Abstract
The development and breakdown of Kelvin–Helmholtz (KH) waves (billows) in the stable atmospheric boundary layer (SABL) and their impact on vertical transport of momentum and scalars have been examined utilizing large eddy simulations. These simulations are initialized with a vertically uniform geostrophic wind and a constant potential temperature lapse rate. An Ekman type of boundary layer develops, and an inflection point forms in the SABL, which triggers the KH instability (KHI). KHI develops with the kinetic energy (KE) in the KH billows growing exponentially with time. The subsequent onset of secondary shear instability along S-shaped braids leads to the turbulent breakdown of the KH billow cores and braids. The frictional ground surface tends to slow down the growth of KE near the surface, reduce the KH billow core depth, and likely suppress other types of secondary instability. KH billows induce substantial down-gradient transport of momentum and sensible heat, which can be further enhanced by the onset of secondary shear instability. Although the KHI-induced strong transport only lasts for around 10–20 min, it reduces vertical shear and stratification in the SABL, enhances surface winds, and results in a 2–3-fold increase in the SABL depth.
1. Introduction
Kelvin–Helmholtz instability (KHI) occurs frequently in stably stratified flows in the presence of strong vertical wind shear [1,2]. The necessary conditions for KHI to occur in a continuously stratified flow include (a) the presence of an inflection point (i.e., the level where , where U(z) denotes the wind speed at level z) and (b) the minimum Richardson number in the shear layer is less than 0.25. A KHI process in the atmosphere lasts from a few minutes to a few dozens of minutes [3], including an initial growth phase with the roll-up of the shear layer (or vortex sheet) into wave-like undulations, the formation of mature KH billows phase, and turbulent breakdown of KHBs phase associated with the overturning of density surfaces or other types of secondary instability (SI). In addition to many laboratory experiments, the secondary instability in two- or three-dimensional laminar flows has been extensively investigated by numerical studies for low-to-moderate Reynolds number fluids using direct numerical simulation codes (DNS). Several SI types have been identified from numerical and laboratory studies, namely localized core vortex instability, secondary core deformation instability, secondary convective instability, stagnation point instability, secondary shear instability, secondary vorticity bands instability, subharmonic vortex pairing, and knots and tubes (see [4] for a review). More recently, the knots and tubes dynamics was numerically investigated by Fritts et al. [5,6].
KHI has been frequently cited as an important source of internal gravity waves (IGWs) and intermittent turbulence in the stable atmospheric boundary layer (SABL, see [7] for a review). Otherwise known as “KH waves” or “KH billows”, KHI-induced wave-like undulations are also frequently referred to as “vorticity waves”, as they are generated by the roll-up of vortex sheets, to distinguish them from buoyancy-driven IGWs in a stably stratified atmosphere. IGWs may trigger KHI in the atmosphere through locally enhancing wind shear and reducing the Richardson number (e.g., [8]); on the other hand, KHIs may generate IGWs [9]. Recent remote-sensing observations suggested that KHI frequently occurs in the SABL over polar regions. For example, in the winter months, KH billows and braids were documented 40% of the time by high-resolution sodar at an Antarctic site [10,11]. Zaitseva et al. [12] evaluated the impact of wave-like motions on turbulent characteristics using long-term sodar measurements and found that the passage of 30% of KH billow trains was accompanied by an increase in turbulent kinetic energy and heat and momentum fluxes. The role KHI plays in the vertical mixing of momentum and scalars has been the subject of numerous studies, mostly for low to moderate Reynolds number fluids, with a few exceptions. Through the analysis of a KHI event documented in the SABL during the Cooperative Atmospheric Surface Exchange Study 1999 field campaign (CASES-99), Newsom and Banta [3] found that, associated with the onset of KH waves, a sudden increase in the downward wave momentum flux was accompanied by a sharp reduction in the wind shear near the critical level. The numerical study by Smyth [13] suggested that KH billows may be important for vertical mixing in stratified fluids. More recently, van der Linden et al. [14] noted that, in a very stable boundary layer, the KHI-induced bursting of momentum flux tends to erode wind shear near the ground surface.
The majority of KHI studies are focused on KH billows developing in an initially sheared laminar flow, far away from any boundaries, with a few exceptions. The development of shear instability in a stably stratified shear layer in the presence of prescribed turbulence has been numerically examined by Kaminski and Smyth [15], and they found that KH billow structure can be suppressed by pre-existing turbulence and be eventually eliminated if the turbulence is strong enough. The impact of a lower boundary on KHI and the turbulent breakdown of KH billows was recently studied by Liu et al. [16] using ensembles of direct numerical simulations (DNS). They noticed that the transition into turbulence and the subsequent mixing were modified by the nearby solid boundary, where a no-slip boundary condition was applied.
The objective of this study is to shed light on KHI development, KH billow characteristics, secondary instability, the turbulent breakdown of KH billows, and their impact on vertical mixing in a stable atmosphere boundary layer by analyzing large eddy simulations. The remainder of this paper is organized as follows. The LES code and model configuration are illustrated in Section 2. The development of the simulated KH billows, secondary instability, and their impact on vertical mixing and mean boundary layer characteristics are examined in Section 3. Some issues related to secondary instability and the model domain sensitivity are further discussed in Section 4. Section 5 includes a summary and concluding remarks.
2. LES Code and Model Configuration
The LES code used in this study solves a set of spatially filtered three-dimensional Boussinesq equations in a rectangular domain with periodic boundary conditions applied along the side walls (e.g., [17,18]). The subgridal scale (SGS) stress and fluxes are parameterized following the two-part SGS scheme illustrated in [18]. The pair of simulations presented in this study are selected from two dozen experimental runs with different horizontal domain aspect ratios, domain sizes, and grid spacings.
For the control simulation (i.e., A in Table 1), the horizontal dimensions of the rectangular domain are Lx = 1536 m and Ly = 384 m with a grid spacing of Δx = Δy = 3 m. There are 220 vertical levels with the first model level at z1 = 2 m and the model top at D = 1200 m, where a radiation boundary condition [19] is applied. The vertical grid spacing increases with height with a constant stretching ratio, , and a resulting average grid spacing of 2.38 m for the lowest 100 m. For simulation B, the first model level is at z1 = 1 m and the model top is at D = 1200 m with a stretching ratio of 1.015. The average vertical grid spacing is 1.54 m in the lowest 100 m. Some control and derived parameters from these simulations can be found in Table 1.

Table 1.
Control and derived parameters for the two LES runs (A and B). The model grids, horizontal grid spacing, geostrophic wind speed, and the first model level (z1) are shown in columns 2–5. The derived parameters (i.e., columns 6–11) include inflection point level (ZIP) before KHI starts, KH wavelength (λ), phase angle (α), inflection point level and wavelength ratio, horizontally averaged kinetic energy maximum (KEm), and the ratio between mature KH billow core height and the wavelength (R), respectively.
The initial horizontal winds are unidirectional and vertically uniform, , where Ug is the wind speed in the X direction. The atmosphere is initially in geostrophic balance with a constant Coriolis parameter s−1. For the control simulation, the potential temperature is given by , where K is the potential temperature at the surface and K/km is the constant lapse rate. In addition, small random perturbations in wind and potential temperature are introduced at the beginning of each simulation to accelerate the spin-up of turbulence in the stable boundary layer.
The surface stress (τ) and dynamic heat flux (Fθ) are computed using the bulk formula (e.g., [20]), namely,
where the subscripts s and 1 denote variables at the surface and 1st model level, respectively. The exchange coefficients, and , are computed following the Monin–Obukhov similarity theory using a constant surface roughness length z0 = 0.1 m for both the surface stress and temperature flux. The ground temperature linearly decreases with time, i.e., , where K is the initial ground temperature, t is the integration time, and is the cooling rate. Therefore, the surface heat flux is always negativem and the boundary layer is stable throughout the simulations. The model integration time interval () is assessed at every time step by setting the maximum Courant–Fredrichs–Lewy number to 0.3 [i.e., CFLmax = ] to maintain computational stability. For the control simulation, the time interval varies between 0.055 and 0.062 s with an average of 0.059 s. It is worth noting that in the majority of KHI studies using LES or DNS models, the model is usually initialized with an idealized unidirectional shear layer. Accordingly, the fastest growth unstable mode can be predicted by solving the Taylor–Goldstein equation, and the horizontal KH phase line is normal to the flow direction in the shear layer. In this study, the LES model is initialized with a vertically uniform unidirectional geostrophic wind (i.e., Ug in the X or u-wind direction). Vertical wind shears in both X and Y directions develop naturally in an Ekman type boundary layer until KHI occurs, associated with an inflection point. Therefore, the fastest growth mode and its phase line orientation are not known a priori. Especially in a limited-area horizontal domain, the fastest growing KHI mode may depend on the domain size and its aspect ratio to satisfy the double periodic boundary conditions. Some of these issues are discussed in Section 4.
3. KH Billows and Breakdown in the SABL
In the control simulation (A), a shallow stable Ekman boundary layer develops rapidly. As will be shown, KHI takes place associated with an inflection point in the v-wind profile followed by secondary instability. We start by diagnosing the control simulation with emphasis on the characteristics and evolution of the simulated KH billows as well as their impact on vertical transport of momentum and heat.
3.1. KH Billows and Turbulent Breakdown
The evolution of KH waves and billows are revealed in the vertical and horizontal cross-sections in Figure 1 and Figure 2 (note that both figures are created by stitching two identical vertical or horizontal cross-sections together, taking advantage of the periodic boundary conditions to give readers a better perspective). Figure 1 shows snapshots of u-wind, potential temperature (), spanwise vorticity (i.e., ), and the buoyancy frequency squared (i.e., ) in a vertical cross-section oriented along the geostrophic wind (i.e., X) direction. KHI starts around t0 = 40 min, and for the sake of clarity, we use tKH = t − t0 in the following discussion of KH billow evolution. At tKH = 5 min, the KH waves become evident, manifested as vertical undulations of the isotachs, isentropic surfaces, spanwise vorticity patterns, and the boundary layer top inversion (Figure 1a,d). At this early stage, the KH waves are most noticeable in the vorticity cross-section (Figure 1c). As expected, the spanwise vorticity is positive in the boundary layer with a maximum immediately above the surface and decreases with height toward zero at the SABL top level, presumably dominated by the contribution from the vertical wind shear term (i.e., ). The largest vertical undulation of the isosurfaces occurs between 20 and 40 m, suggesting that the KH layer is centered approximately at z = 30 m.
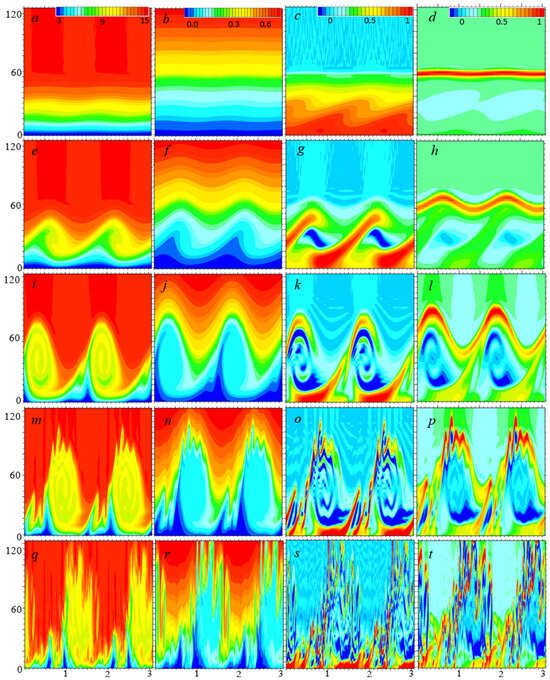
Figure 1.
Vertical cross-sections of u (leftmost, color incr. = 0.5 m/s), potential temperature (col 2, , color incr. = 0.025 K), normalized span-wise vorticity (col 3, incr. = 0.05), and normalized buoyancy frequency squared (rightmost, incr. = 0.05) valid at (top to bottom rows) tKH = 5 (a–d), 11 (e–h), 16 (i–l), 17.5 (m–p), and 18.5 (q–t) min, respectively. The vorticity is normalized by 0.35 (top row), 0.49 (row 2), and 0.78 s−1 (rows 3–5), respectively, and N2 is normalized by 0.001 s−2. These figures are created by stitching together two identical cross-sections for the sake of description.
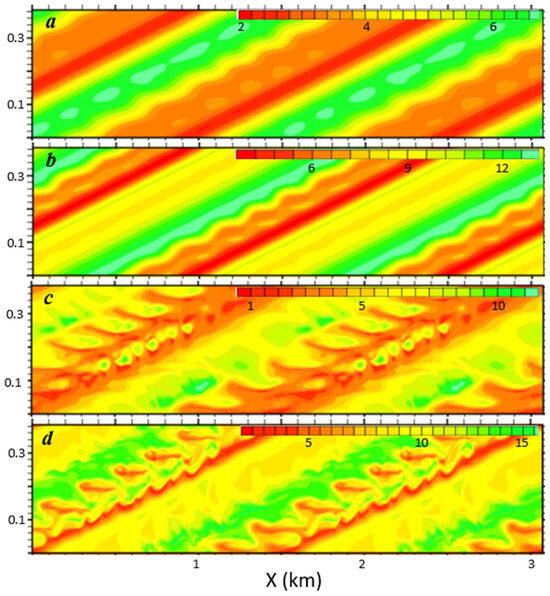
Figure 2.
Horizontal (X-Y) cross-sections of u at levels z = 6 (a,c) and 21 m (b,d) valid at tKH = 15 and 17 min, respectively. The color shading increments are (a) 0.2 m/s, (b) 0.6 m/s, (c) 0.5 m/s, and (d) 0.5 m/s, respectively. The graphics are stretched in the Y direction by a factor of two. These figures are created by stitching two horizontal sections together in the X-direction for the sake of description.
These unstable KH waves grow in amplitude rapidly with time, and the KH billow cores start forming underneath wave crests in 5 min (i.e., tKH = 11 min), as evidenced by the overturning of isotachs and isentropic surfaces (Figure 1e,f). In Figure 1g,h, the KH billow cores are characterized by reduced vorticity (slightly negative in places) and weakened stratification encompassed by S-shaped braids where both the vorticity and stratification are enhanced. Approximately by tKH = 15 min, the KH billows are fully developed with their cores between 20–80 m (Figure 1i–l). KHI-induced vertical undulation extends from the surface up to 120 m and beyond (Figure 1j). The mature billow cores contain multiple rings of alternating wind and temperature anomalies, associated with the entrainment of the warmer and faster airflow from above. Similarly, negative vorticity filaments are evident inside the cores along with much enhanced positive vorticity in the lowest 20 m (Figure 1k). According to [21], the negative vorticity in KH billow cores is generated by baroclinicity, which also contributes to the enhancement of the positive vorticity in the braids. There are negative N2 filaments inside the cores as well, suggesting that some portions of the KH cores are convectively unstable (Figure 1l).
At tKH = 16 min, small kinks first appear along the S-shaped braids that wrap around the KH billow cores, implying the onset of the secondary shear instability (SSI). By tKH = 16.5 min, several spikes are evident along the braids and the wave crests with a horizontal length scale of 100–150 m, suggesting fast growth of SSI (Figure 1e). Negative vorticity and negative N2 appear in the spikes as well (Figure 1o,p), implying that the secondary KH billows become convectively unstable as well. By tKH = 17.5 min, while the vertical undulations of the isotachs and isentropic surfaces associated with the primary KH waves are still evident, KH cores are virtually destroyed by SSI and become turbulent (Figure 1q–t).
Shown in Figure 2 are the horizontal sections of the u wind at two different levels during the SSI. Prior to the SSI and KHB breakdown, the KH waves are two-dimensional with the orientation angle between the phase lines and the geostrophic wind (i.e., X) direction (Figure 2a). The horizontal wavelength (i.e., the distance between two adjacent phase lines) is . Therefore, the ratio between the KH core depth and wavelength is around 0.16, which is sizably smaller than typical KH billows away from a solid surface derived from previous studies (e.g., 0.2 in [22,23]). The smaller KH core depth is likely due to the negative impact of the ground surface, as suggested in [16].
KH wave-induced wind perturbations are substantially larger near the KHB cores than at the surface. Secondary shear instability first develops below each wave crest, where the u-wind is minimal (Figure 2a), and finer-scale perturbations are noticeably stronger at the z = 21 m level than at the surface (Figure 2a,b). In 2 min, the amplitude of the SSI-induced u-wind perturbations become comparable to that of the primary KH waves (Figure 2c,d). The KH waves propagate toward the lower right while growing in amplitude. At tKH = 15 min, finer-scale features first appear along the upwind edges of wave crests (Figure 2b), corresponding to the spikes along braids in the vertical cross-sections (Figure 1d). At tKH = 17 min, the primary KH waves are blurred by finger-like patterns (Figure 2c). The fast-growing fine-scale perturbations along the KH braids, where the wind shear is the strongest (Figure 1 and Figure 2), imply that the secondary shear instability is three-dimensional in nature and plays a dominant role in the initial turbulent breakdown of the simulated KH billows, although convective instability likely contributes to the breakdown as well.
Shown in Figure 3 are the distance–time sections of u at z = 18.6 m. In the X direction, the KH waves propagate along the wind direction while growing in amplitude and subsequently experiencing SSI and turbulent breakdown (Figure 3a). The wave speed (i.e., the slope of patterns indicated by dashed lines in Figure 3a) is around 5.10 m/s. In the Y-direction, the KH wave speed is around 1.35 m/s, implying that the KH waves tend to propagate in the direction perpendicular to the horizontal phase lines (Figure 3b). The growth of KH billows and their breakdown observed near the center of the LES domain are revealed in Figure 4. KHI first manifests itself as undulations of the cold sheared layer above the surface (Figure 4a,b), which rolls up in the second cycle (between tKH = 8–13 min) with the onset of the overturning of the isentropic surfaces under the wave crest. In the third cycle (tKH = 13–17 min), a mature KH billow is evident with signs of the early development of the secondary shear instability (fine-scale spikes along the top edge of the KH billow in Figure 4a,b). Associated with the abrupt breakdown of the KH billow (tKH > 17 min), the turbulent layer thickens substantially with relatively large eddies reaching beyond 200 m above the surface.
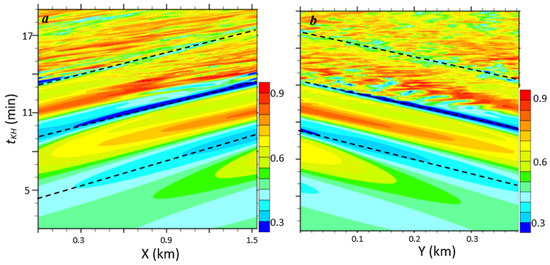
Figure 3.
Distance–time sections, namely (a) X-tKH (along a given Y-section) and (b) Y-tKH (along a given X section) of u at z = 18.6 m normalized by Ug. The dashed lines are used to estimate the KH wave propagation speed.
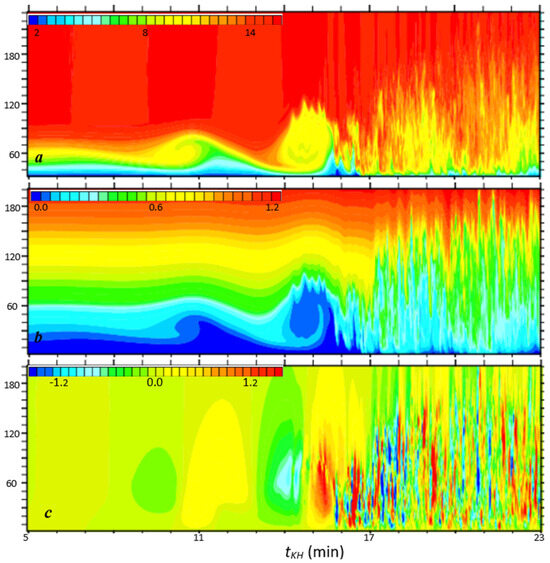
Figure 4.
Time–height (tKH-z) sections of (a) u-wind (u, m/s), (b) potential temperature (, K), and (c) vertical velocity (w, m/s) sampled near the center of the domain. Only the lowest 200 m portion and for tKH between 5–23 min is shown.
The domain-averaged profiles of the horizontal winds (U, V), potential temperature (), vertical wind shears ( and ), and Richardson number () before and after the KH event are shown in Figure 5. Prior to the KH event, the stable boundary layer is about 60 m deep, capped by a thin and more stable layer. While the u-wind and its vertical shear are much larger than its v-wind counterparts, the vertical shear in u-wind is positive throughout the boundary layer. Although the vertical shear of the v-wind is weak, a well-defined inflection point (i.e., where ) is present at ~30 m. In general, the gradient Richardson number is small (Ri < 0.1) in the boundary layer. Therefore, the development of the KH instability is likely associated with the inflection point in the v-wind profile. A low-level jet is evident in the v wind, and the depth of the shear layer above the jet level is around 40 m. For the u wind, the depth of the shear layer is comparable to the SABL depth (i.e., ~60 m). The ratio between the KH wavelength and shear layer depth is 6.2 for u wind and 9.3 for v wind, respectively, which fall into the range for the fastest growing KH mode (i.e., 6–13, e.g., [24]). After the onset of SSI (i.e., tKH > 17 min), the boundary layer depth extends to 150 m, above which the Richardson number > 0.25, the wind shear reduces to zero, and a more stable layer is evident between 150–180 m.
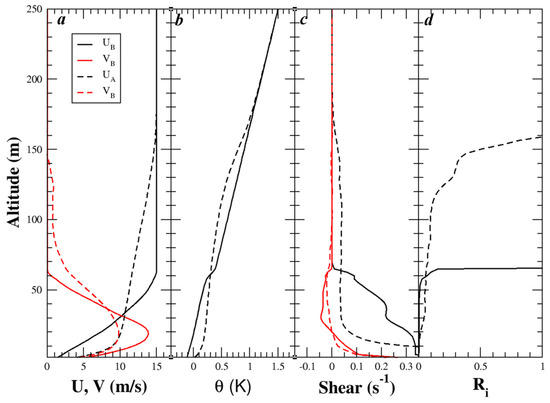
Figure 5.
Profiles of (a) horizontal wind components U and V (red), (b) potential temperature (, K), (c) vertical wind shears and (red), and (d) Richardson number before KH billows fully developed (i.e., tKH = 8 min, solid curves, denoted with subscript “B”) and after their breakdown (i.e., tKH = 20 min, dashed curves, denoted with subscript “A”). The V−wind is multiplied by 10. An inflection point is located at z~30 m, above the V maximum at the beginning of the KH event.
3.2. Impact of KH Billows on Vertical Transport of Momentum and Heat
The development of KHI and its impact on the mean boundary layer structure is further revealed in Figure 6, which shows the time–height sections of several domain-averaged variables along with some second- and third-order moments. A kinetic energy (KE, including both KH-induced perturbations and turbulent kinetic energy or TKE) maximum first appears approximately at z ~ 30 m, where the inflection point is located, and tKH ~ 6 min (Figure 6a). The KE maximum grows rapidly with time in terms of both its magnitude and vertical extension and then breaks into two separate maxima centered at approximately 10–15 m and 40–50 m, respectively, with a relative minimum at z = 30 m. The KE distribution, namely two KE maxima separated by an inflection point, is in qualitative agreement with the Doppler lidar observations by Newsom and Banta [3]. Further analysis indicates that these KE maxima are dominated by contributions from horizontal wind perturbations, which, according to the linear wave theory, are at their minimum near the inflection point level [3]. Starting from the onset of the SSI (tKH ~ 17 min), both KE maxima start decreasing with time, and for tKH > 20 min, KE is characterized by a single maximum near the surface while the elevated maximum disappears. In the meantime, the KE maximum envelope experiences a sharp increase in its vertical extension during the SSI and turbulent breakdown phase and extends up to ~160 m above the ground.

Figure 6.
Time–height sections of (a) kinetic energy (KE, normalized by 5 m2/s2), (b) momentum flux in the geostrophic wind direction ( normalized by 0.8 m2/s2), (c) dynamic heat flux ( normalized by 0.064 K m/s), (d) Km (normalized by 20 m2/s), (e) Kh (normalized by 20 m2/s), (f) (normalized by 0.6 m3/s3), (g) (normalized by 0.044 K2), (h) Richardson number, (i) U (normalized by Ug), and (j) (K). Only the lowest 160 m is shown.
Shown in Figure 6b is the u-wind flux, , which is 1–2 orders of magnitude larger than its counterpart in the Y direction (i.e., ). The u-wind momentum flux is characterized by a negative maximum centered approximately at z ~ 25 m level. The negative maximum grows in magnitude with time before the onset of SSI on pace with the KE growth, implying the role of KH waves in downward, and therefore down-gradient, momentum transport. The momentum flux peaks between tKH = 16–18 min, coinciding with the occurrence of the secondary shear instability, suggesting that the SSI and turbulent breakdown of the KH billows are more effective in the vertical mixing of momentum than the KH billows themselves. The dynamic heat flux (i.e., , which is proportional to the sensible heat flux) is negative as well during this KH event, suggesting generally downward transport of heat by KH billows (Figure 6c). The vertical extension and evolution of the heat flux resemble the momentum flux. However, the largest momentum flux occurs noticeably lower than its counterpart in the heat flux, presumably due to the fact that the strongest mean vertical wind shear is confined in the lowest 20 m while the vertical gradient of potential temperature is more uniform throughout the SABL.
The KHI-induced vertical mixing effect is also evident in the eddy diffusivity cross-sections (Figure 6d,e). The eddy diffusivities of momentum (Km) and scalars (Kh) are evaluated from the domain-averaged fluxes, vertical wind shear, and potential temperature gradient using
Both Km and Kh exhibit similar vertical structure and evolution as their corresponding fluxes. A sharp increase in the eddy diffusivity occurs around tKH~16 min, coinciding with the onset of SSI. For both momenta and scalars, the eddy diffusivity maxima exceed 20 m2/s, suggesting a much stronger mixing effect than in a typical stable atmospheric boundary layer [25]. The strongest mixing lasts for only a few minutes, after which the maximum eddy diffusivity decreases to around 10 m2/s and is nearly constant with time to the end of the simulation. The momentum eddy diffusivity also shows a detached maximum above the KH layer (Figure 6d), where no strong turbulence is expected. Further diagnosis finds that this spurious eddy diffusivity maximum is due to a combination of relatively small momentum flux from KHI-induced internal gravity waves and nearly zero vertical wind shear aloft.
The evolution of the boundary layer depth is evident in Figure 6f,g, which shows the potential temperature variances and gradient Richardson number. Large θ variances are evident along the upper edge of the KE and flux maximum envelopes, associated with the downward entrainment of the warmer air from above. Prior to the KH event, the SABL top (~60 m) is defined by a sharp Richardson number gradient with Ri < Ric in the boundary layer, where Ric = 0.25 denotes the critical Richardson number. Across the SSI and subsequent KH billow breakdown phase, the SABL top increases abruptly, and afterward the sharp Ri gradient along the SABL top thickens and becomes blurry. The Richardson number in the upper portion of the SABL gradually increases, presumably due to entrainment of the warmer air across the SABL top. It is worth noting that perturbations generated by the KH billow breakdown exhibit high skewness (Figure 6h) with near the surface and above the KH billow cores, suggestive of downward transport of the KE near the surface and upward transport above the KHB cores.
Finally, the thickening of the SABL is also evident in the u-wind and θ sections (Figure 6i,j). For the u-wind, the whole shear layer expands substantially, from ~60 m before the KH event to more than 150 m in about 15 min. Near the surface, the winds are noticeably enhanced while the wind speed above the 30 m level weakens. Even in the presence of surface cooling, KHI-enhanced vertical mixing leads to warming of the air below ~60 m and cooling aloft. The evolutions in the mean u-wind and potential temperature over a homogeneous surface are governed by the following budget equations,
where the right-hand side terms represent the vertical divergence of momenta and heat fluxes associated with both turbulence and KH waves. As shown in Figure 6c, the negative heat flux reaches its maximum at z~60 m, and accordingly, the right-hand side term in Equation (6) is positive in the lowest ~60 m and negative aloft. Therefore, we see warming near the surface and cooling in the upper portion of the SABL. In Equation (5), the Coriolis term is small, because the time scale for the KH process is much shorter than the geostrophic adjustment time scale (i.e., 1/f) and v-wind is much weaker than u-wind. If neglecting the Coriolis term, the u-wind evolution is solely driven by the vertical divergence of the momentum flux. The negative momentum flux maximum is located below 30 m, which is noticeably lower than the negative heat flux maximum. Accordingly, the u-wind component is enhanced near the surface where the right-hand side of Equation (5) is positive and weakened aloft.
For a more quantitative comparison, the profiles of kinetic energy, momentum, heat fluxes, and eddy diffusivity at times before, during, and after the KH event are shown in Figure 7. At the beginning of the KH event, KE is relatively small and so are the fluxes and eddy diffusivities, with predominant contribution from turbulence. When secondary instability and the turbulent breakdown of KH billows are taking place, KE becomes substantially larger with two separate maxima located at z = 10 m and 60 m, respectively. The momenta and heat fluxes are dramatically increased by KH processes and exhibit a broad elevated maximum. Turbulence production in an elevated shear layer has been frequently observed in the stable atmospheric boundary layer and such a boundary layer is often referred to as an “upside-down” boundary layer (e.g., [26]). Accordingly, the eddy diffusivity becomes ~30 times larger than at the earlier time when the KH instability just started (Figure 7d). The levels where the momentum and heat fluxes reach their maxima are ~30 and 60 m, respectively. It is worth noting that the eddy diffusivities for the momentum and heat are quite similar (Figure 6f,g), as the two are dependent mostly on the KH eddy and turbulent characteristics in the SABL.
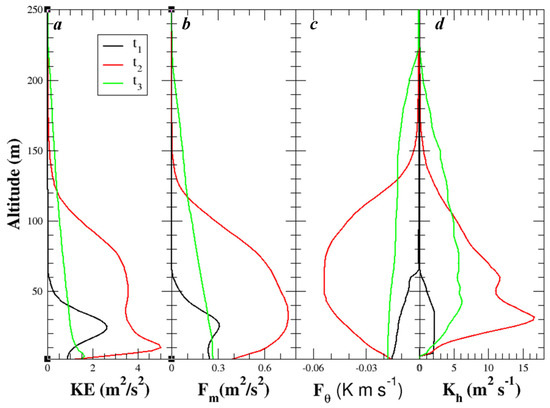
Figure 7.
Profiles of the domain-averaged (a) kinetic energy (KE, m2/s2), (b) momentum flux (, m2/s2), (c) dynamic heat flux (, K m/s), and (d) eddy diffusivity of potential temperature (Kh, m2/s) at three different times, t1 = 8, t2 = 11, and t3 = 78 min. Those at t1 = 8 min are multiplied by 10 for the sake of comparison.
About twenty minutes later, the KE, fluxes, and eddy diffusivities are much reduced from its peak values during the breakdown of KH billows and the elevated maxima in KE and flux profiles vanish, suggesting the weakening of the vertical transport of momentum and heat by KH-induced perturbations and turbulence. The momentum flux linearly decreases with height between the surface and the SABL top, which is now located at ~220 m, suggesting that the SABL thickens more than three times over a 30 min period.
Shown in Figure 8 are the vertically integrated KE, shear production rate, and dissipation rate over a 40 min time period. In general, the integrated KE grows exponentially over the first 18 min by approximately four orders of magnitude and monotonically decays afterward. Quantitatively, KE grows faster over the first 12 min, presumably corresponding to the growth of primary KH waves and billows. The KE growth slows down over the next ~6 min associated with mature billows and the onset of secondary shear instability. If we divide the total KE into the lower portion below the inflection point level (i.e., ZIP = 30 m) and the upper portion above, the former grows noticeably slower than the latter. For comparison, the e-folding growth time, Tg, can be estimated for the first 12 min using , where KE1 and KE2 denote the integrated KE at two reference times, 1 and 2, over time period . The derived e-folding growth times for the lower, upper, and total KE are 1.74, 1.16, and 1.23 min, respectively. The slower growth of KE near the surface is likely due to the influence from the ground surface and surface stress. This is in qualitative agreement with [16], who demonstrated that the KHB grows slower near a solid surface.
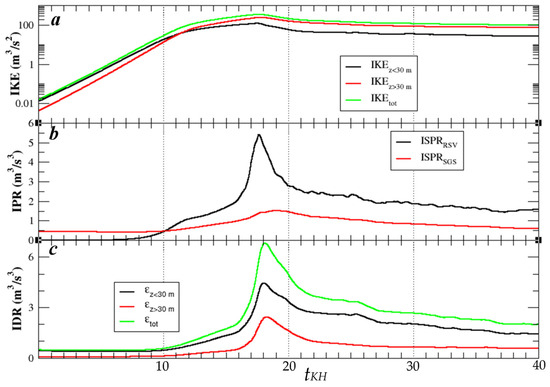
Figure 8.
Evolution of the (a) vertically integrated kinetic energy (IKE, m3/s2, top) in log scale, (b) vertically integrated shear production rate of KE (ISPR, m3/s3, middle; resolved and SGS are shown in black and red respectively), and (c) integrated dissipation rate (IDR, ε, m3/s3, bottom; IDRs in the lowest 30 m, above, and total are shown in black, red, and green, respectively).
For the mature billow and SSI phase, the KE in the lowest 30 m grows slower than its counterpart aloft as well. Similarly, the KE decay portion can be divided into two phases, the breakdown phase (between tKH = 18–21 min) during which KE decreases exponentially, predominantly due to turbulent breakdown of the primary and secondary KH billows, and the dissipation phase (tKH > 21 min), which features slower decrease of KE dominated by turbulent dissipation. The shear production rate from resolved eddies (i.e., ) shows a pronounced maximum at tKH = 18 min, coinciding with the KE maximum (Figure 8b). The shear production rate related to the parameterized turbulence (i.e., , where and denote SGS shear stress) increases with the growth of KH billows as well, suggesting that KH billows tend to enhance small-scale turbulence. The vertically integrated dissipation rate exhibits a less pronounced maximum that lags behind the ISPR peak by ~1.5 min. In addition, stronger dissipation takes place in the lowest 30 m than in the layer above (Figure 8c).
The evolution of the domain-averaged 10 m wind, surface heat flux, and SABL depth over the same time period are shown in Figure 9. The 10 m wind increases with time during the KE growth phase and reaches its maximum approximately at tKH = 19 min, apparently associated with the downward transport of momentum by KH billows. Afterward, the 10 m wind speed gradually decreases with time. In accordance with the sudden increase in the 10 m wind, the surface stress increases significantly, approximately in proportion to the square of the 10 m wind speed. The magnitude of the surface heat flux increases by several folds during this KH event as well. It is worth noting that the increase in 10 m wind during the KH event also implies substantially stronger wind shear near the surface. The enhanced shear layer or surface vortex sheet is lifted off the surface (Figure 1c) and wrapped into KH braids during the mature phase of the KH billows; therefore, it plays a role in the development of secondary shear instability. Finally, the SABL depth increases from ~60 m prior to the KH event to more than 200 m in less than 30 min, suggesting the dramatic impact of the KH event on the mean stable boundary layer characteristics.
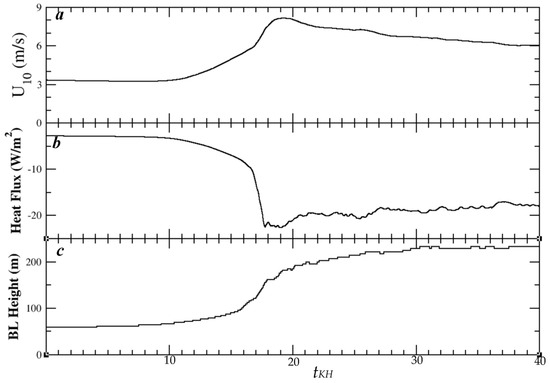
Figure 9.
Evolution of the domain-averaged (a) 10 m wind speed (m/s), (b) surface sensible heat flux (W/m2), and (c) SABL height during a 40 min period.
The above analysis suggests that KHI may significantly enhance the vertical transport of momentum and scalars, substantially thicken the SABL, generate residual waves and intermittent turbulence, modulate mean boundary layer structure, and enhance interactions with the surface. Questions remain regarding contributions from KH waves, secondary instability, and smaller scale turbulence induced or enhanced by the KH waves. To address these questions, we have computed the power spectra of the three wind components and a pair of co-spectra using the volume data. Shown in Figure 10 are the power spectra of u and w and co-spectra of w–u (i.e., momentum flux in the wave number space) and (i.e., dynamic heat flux) as a function of the dimensionless horizontal wave number, , for the lowest 160 m. Here, k and l denote the wave numbers in the X and Y directions, respectively, and only the portion for is shown in Figure 10. At the early stage of the KHI event, the u variance is largely confined in the lowest 60 m and characterized by two maxima separated by the inflection point level (i.e., ZIP ~ 30 m) centered at the nondimensional horizontal wave number . This corresponds to a wavelength of , which is comparable to the wavelength estimated from the plan-view illustrated in Figure 2. The v-wind spectrum resembles its u-wind counterpart except that it is much smaller in magnitude. The w power spectrum shows a single maximum centered at z = 60 m and , which extends up to ~140 m. The maximum of the w spectrum is only around 2% of its u-wind counterpart. Therefore, the largest contribution to KE comes from u-wind perturbations associated with the primary KH waves. It is worth mentioning that, in an LES study of hurricane boundary layer rolls by Wang and Jiang [27], they found that, while the shear instability is attributed to an inflection point in the radial wind profile, the strength of the rolls is positively correlated with the shear in the much stronger tangential wind. The same seems to be true for this study. The u–w co-spectrum is characterized by a single maximum at 30 m, suggesting that the KH waves are able to induce substantial vertical transport of momentum fluxes. The co-spectrum exhibits a similar maximum except that it extends up to ~100 m, noticeably deeper than the maximum in the w–u co-spectrum.
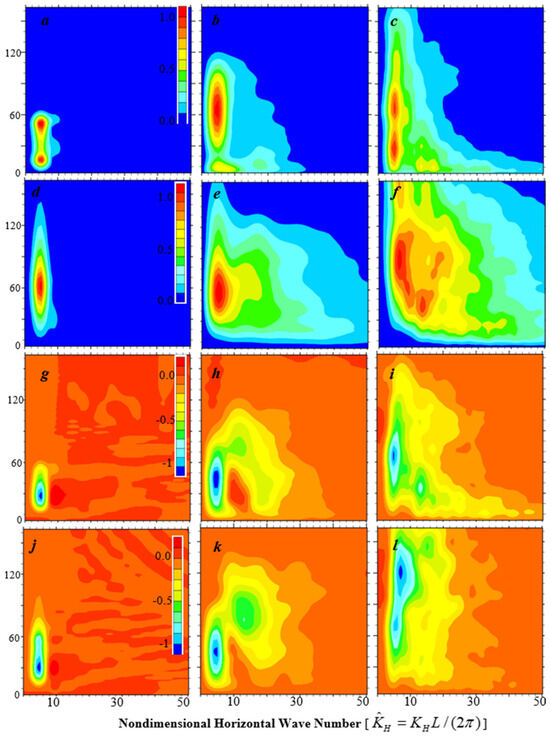
Figure 10.
Dimensionless power spectra of (a–c) u and (d–f) w, and dimensionless co-spectra of (g–i) u–w and (j–l) valid at tKH = 13 (left), 18 (middle), and 23 min (right), respectively, are shown in nondimensional wave number () and height sections. Only the lowest 160 m and up to 50 is shown.
During the SSI and breakdown phases (mid-column), a pair of pronounced maxima centered at is still evident in the u-wind spectra, implying that the primary KH waves- (or billows)-induced perturbations remain significant. However, the peak value in Figure 10b is only about a third of that in Figure 10a (i.e., 5 min ago), implying that the primary waves are weakened by the SSI substantially and nearly two-thirds of its energy are cascaded into the secondary waves and large eddies. Accordingly, the u and w spectra spread toward higher wave numbers, especially near the surface (i.e., z < 30 m), where a secondary maximum in the u spectra is located at , corresponding to a wavelength of ~85 m. The w spectra show a more substantial spreading of energy to the higher wave numbers (Figure 10e). The u–w co-spectra at tKH = 18 min show three discernible maxima, namely the primary maximum, now centered at z = 45 m, a minor maximum centered at and z ~70 m, and a third maximum at , suggesting that while the primary KH waves still play a substantial role in vertical momentum transport, perturbations associated with SSI billows become equally important. For the co-spectrum, in addition to the primary maximum located at and z = 45 m, there is a marked maximum centered at and z = 80 m (Figure 10k), presumably associated with the downward entrainment of warmer air from above by the SSI billows.
At tKH = 23 min (right column), both u and w power spectra extend further up beyond 160 m while spreading more toward higher wave numbers. While at this time, KH billow cores are barely distinguishable from vertical cross-sections, there is still a pronounced maximum centered at the primary KH wave number, implying that the residual waves persist after the turbulent breakdown occurs. For the u spectra, a few secondary maxima appear in the lowest 30 m, suggesting a downscale energy cascade from the KH billows to the turbulence in the SABL. The residue waves still play an important role in the vertical transport of momentum and sensible heat along with substantial contributions from higher wave numbers (Figure 10i,l).
The evolution of the energetics and momentum mixing in the boundary layer (i.e., at z = 21 m) is further revealed by Figure 11. From tKH = 11 to 18 min, a significant portion of the kinetic energy cascades from the primary KH waves to SSI waves and large eddies. In addition, more kinetic energy is transferred from horizontal to vertical motion by the SSI process. From tKH = 18 to 23 min, kinetic energy weakens at all wave numbers, presumably due to turbulent dissipation. It is worth noting that, in the high wave number limit, the spectral slopes tend toward -5/3 after the breakdown KH billows (i.e., tKH = 18 to 23 min), likely due to the enhancement of turbulence and weakening of stratification. In terms of momentum flux, the primary wave contribution to the downward flux doubles from tKH = 16 to 23 min with comparable contributions from secondary waves with between 13 and 23.
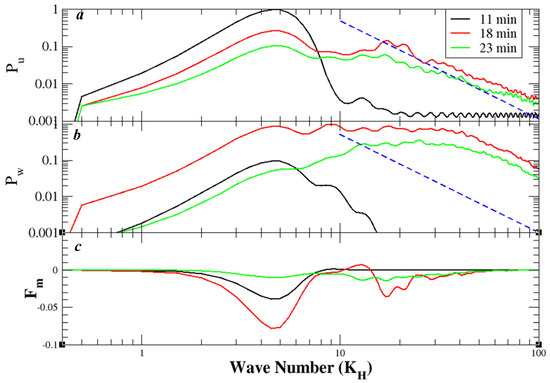
Figure 11.
Dimensionless power spectra of (a) u (i.e., Pu), (b) w (i.e., Pw), and (c) u–w co-spectrum (i.e., Fm) at z = 21 m valid at tKH = 11, 18, and 23 min, respectively. Both Pu and Pw are shown in logarithm and the blue dashed lines with -5/3 slope are included for comparison.
4. Discussion
The development of secondary instability and the subsequent turbulent breakdown of KH billows have been the subject of numerous two-dimensional and three-dimensional numerical studies (see [4] for a brief review). Some proposed secondary instability may only appear in two-dimensional simulations or relatively low Reynolds number fluids. It is evident that secondary shear instability occurs and plays the dominant role in the turbulent breakdown of the KH billows in the control simulation. However, the small model domain used in the control simulation may have suppressed some other types of secondary instability, such as vortex pairing instability and the formation of knots and tubes [5]. To address this issue, sensitivity simulations have been conducted with varying geostrophic winds, domain sizes and grid spacings. This section provides a brief summary of these sensitivity simulations using simulation B as an example with emphasis on the secondary instability and domains size dependence of the simulated KH waves.
The model configuration for simulation B is identical to the control simulation, except that the initial geostrophic wind is Ug = 9 m/s, the horizontal domain is larger (i.e., 2560 m × 640 m), and the horizontal grid spacing is finer (i.e., ). KHI takes place in simulation B and the resulting KE maximum resembles its counterpart in the control except that its peak value is smaller, the KE maximum is centered at ~22 m, which is closer to the surface (Figure 12), and the vertical extension of the KH maximum layer is lower. It is interesting that the ratio of the KE maxima between the two simulations is around 2.8, which is approximately equal to the geostrophic wind squared, (15/9)2~2.8, suggesting that KE tends to be proportional to the vertical shear squared in the u wind component, although the inflection point appears in the v profile in this pair of simulations.
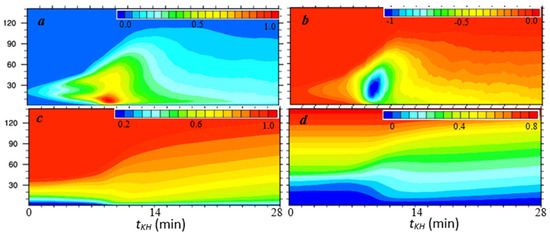
Figure 12.
Time–height sections of (a) KE (normalized by 1.7 m2/s2), (b) momentum flux (normalized by 0.32 m2/s2), (c) U (normalized by Ug = 9 m/s), and (d) potential temperature (, incr. = 0.05 K).
There are six waves in the horizontal domain (Figure 13) with a shorter wavelength (i.e., λ~247 m). However, the angle between the wave phase lines and the geostrophic wind direction is about the same (see Table 1), and the ratios between the wavelength and the boundary layer depth are comparable as well. Just as in the control, three-dimensional SSI occurs first along the braids, when the primary KH billows are mature enough (Figure 13 and Figure 14). At their mature phase, the KH cores are located between 10 and 40 m (Figure 14), and the ratio between the core height and horizontal wave length is around 0.12, which is substantially smaller than those reported in previous studies with KH billows away from any solid surface. The same happens in other simulations, including a weaker geostrophic wind (Ug = 6 m/s) simulation and a larger domain simulation (i.e., identical to B but with Δx = 5 m and therefore both domain length and width are doubled). No vortex pairing is observed in any sensitivity simulations, likely due to the close proximity of KH billows to the ground surface, which tends to suppress the subharmonic instability [16].
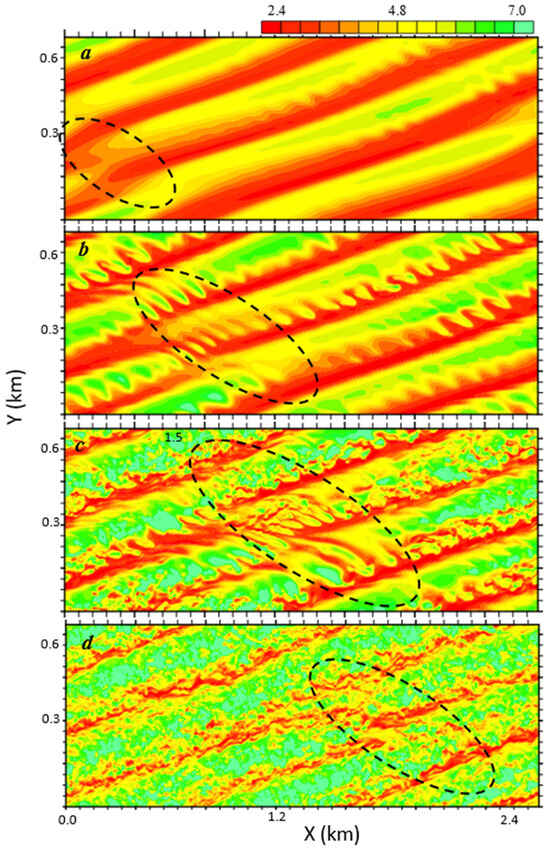
Figure 13.
The X–Y sections of u at z = 10.6 m from simulation B valid at tKH = 5.5, 6.9, 8.3, and 9.7 min (a–d), respectively. The color increment = 0.4 m/s. The misalignment portions (or knots) are highlighted by dashed ovals.
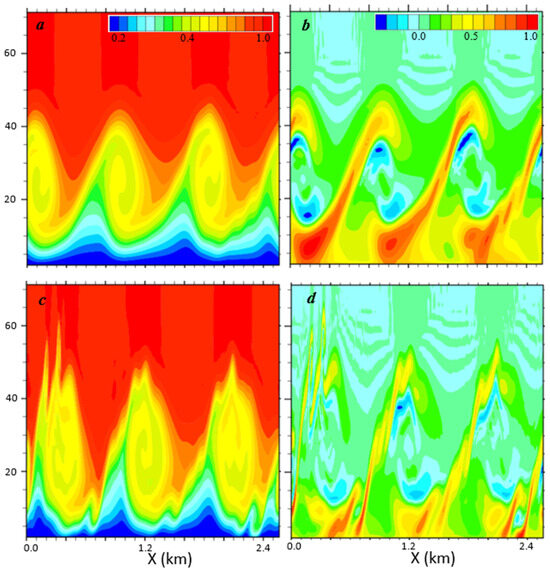
Figure 14.
Vertical cross-sections of (a,c) u (m/s, normalized by Ug = 9 m/s, incr. = 0.05) and (b,d) span-wise vorticity (normalized by 0.6 s−1 and 1.01 s−1, color incr. = 0.1), valid at tKH = 6.9 (a,b) and 8.3 (c,d) min, respectively.
The phase lines in Figure 13 are not as perfectly straight as in the control simulation. KH billows with variable phases that are misaligned along their axes have been documented in laboratory experiments [28,29] and numerical simulations [5,6]. The misaligned portions, also known as “tubes” and “knots”, may evolve more rapidly than a typical secondary instability and accelerate the turbulent breakdown of KH billows (e.g., [5]). This seems to be the case in Figure 13 (highlighted by ovals). It is worth noting that the misalignment of KH billows in simulation B is due to the double-periodic lateral boundary conditions. In nature, this could happen in association with spatial variability in the large-scale flow.
5. Summary and Concluding Remarks
We examined KH instability in an Ekman type stable atmospheric boundary layer using large eddy simulations. The LES model is initialized using a geostrophic wind which is constant with height without a prescribed shear layer. The vertical wind shear develops naturally as the SABL spins up. While the wind component in the geostrophic wind direction (i.e., u) is substantially stronger than the v wind, KHI takes place in association with an inflection point in the weaker v wind profile.
The simulated KH waves are initially two-dimensional with their horizontal phase lines tilting with an acute angle from the geostrophic wind direction. As demonstrated in the control simulation, the KH event can be divided into four phases, namely the growth phase (i.e., exponential growth of KE in the primary KH waves), mature KH billow phase (slow growth of KE associated with mature KH billows and secondary instability), turbulent breakdown phase (fast exponential decay of KE due to turbulent breakdown of KH billow cores), and dissipation phase associated with the slow decay of KE primarily due to turbulent dissipation.
The general characteristics of the simulated KH waves (or billows) and their subsequent turbulent breakdown are in qualitative agreement with previous analytical, numerical and observational studies. For example, KE grows exponentially with time as predicted by linear theory, and the wavelength to shear layer depth ratio is between 6 and 10, which is consistent with previous studies. The simulated KH wavelength and the presence of two stacked KE maxima are in qualitative agreement with the Doppler lidar analysis of a KH event as documented during CASES-99 [3]. In the meantime, several unique aspects and new insights from this study are worth noting.
First, the simulated KH billows are centered at 20–30 m above the ground surface, and the resulting ZIP/D, where D is the half depth of the shear layer, is around unity or less. Regardless of the close proximity to a solid frictional surface, the KH billows and the general characteristics of the billow cores are consistent with previous numerical studies, suggesting that KHI may develop near a frictional surface. The impact of the ground surface on the KHI in the SABL is more quantitative. For example, it has been demonstrated that the integrated KE near the surface grows slower than its counterpart aloft, suggesting that a frictional surface tends to slow down the growth of KH billows, which is consistent with the recent DNS study by Liu et al. [16]. In addition, the ratio between the height of the mature KH billow cores and the horizontal wavelength appears to be smaller, suggesting that the ground surface plays a role in limiting the vertical extension of KH billow cores.
Second, this study also suggests that the turbulent breakdown of KH billows in the SABL starts with the onset of secondary shear instability, which first develops along the S-shaped braids. In addition to the SSI, “tubes” and “knots” associated with the misalignment of phase lines appear in some simulations, which seems to accelerate secondary instability. Other types of secondary instability identified in previous studies are not observed in our simulations, which may be due to the influence of the frictional ground surface.
Finally, as shown in previous studies, KH billows and their subsequent breakdown may dramatically enhance vertical transport (and mixing) or momentum and heat. The magnitudes of KHI-induced vertical fluxes peak during the onset of SSI and breakdown of the KH billows and then slowly decay with time. This leads to a significant increase in the SABL depth, weakened wind shear and stratification throughout most of the SABL, and increased Richardson number in the upper portion of the SABL. It is worth noting that the KHI-induced momentum and heat fluxes exhibit substantial spatiotemporal variability. For example, the maximum momentum flux doubles itself from tKH = 15 to 17 min (Figure 6b), and for tKH = 16 min, the momentum flux at z = 40 m is twice as large as at z = 20 m. This large variability suggests that one has to be careful when evaluating the KHI impact on boundary layer mixing from limited observations.
Funding
This research is supported by the Chief of Naval Research through the Naval Research Laboratory Base Program, PE 0601153N.
Institutional Review Board Statement
Not applicable.
Informed Consent Statement
Not applicable.
Data Availability Statement
The large eddy simulation data presented in this study are available on request from the corresponding author. The data are not publicly available due to the large volume of raw data.
Acknowledgments
Computational resources were supported by a grant of HPC time from the Department of Defense Major Shared Resource Centers.
Conflicts of Interest
The author declares no conflicts of interest. The funders had no role in the design of the study; in the collection, analyses, or interpretation of data; in the writing of the manuscript; or in the decision to publish the results.
References
- Helmholtz, H. Über Discontinuierliche Flüssigkeits-Bewegungen Monatsberichte der Königlichen Preussische; Akademie der Wissenschaften zu Berlin: Berlin, Germany, 1868; Volume 23, pp. 215–228. [Google Scholar]
- Thomson, W. Hydrokinetic solutions and observations. Phil. Mag. 1871, 42, 362–377. [Google Scholar] [CrossRef]
- Newsom, R.K.; Banta, R.M. Shear-flow instability in the stable nocturnal boundary layer as observed by Doppler lidar during CASES-99. J. Atmos. Sci. 2003, 60, 16–33. [Google Scholar] [CrossRef]
- Thorpe, S.A. On the Kelvin–Helmholtz route to turbulence. J. Fluid Mech. 2012, 708, 1–4. [Google Scholar] [CrossRef]
- Fritts, D.; Wang, L.; Lund, T.; Thorpe, S. Multi-scale dynamics of Kelvin–Helmholtz instabilities. Part 1. Secondary instabilities and the dynamics of tubes and knots. J. Fluid Mech. 2022, 941, A30. [Google Scholar] [CrossRef]
- Fritts, D.; Wang, L.; Thorpe, S.; Lund, T. Multi-scale dynamics of Kelvin–Helmholtz instabilities. Part 2. Energy dissipation rates, evolutions and statistics. J. Fluid Mech. 2022, 941, A31. [Google Scholar] [CrossRef]
- Sun, J.; Nappo, C.J.; Mahrt, L.; Belušić, D.; Grisogono, B.; Stauffer, D.R.; Pulido, M.; Staquet, C.; Jiang, Q.; Pouquet, A.; et al. Review of wave-turbulence interactions in the stable atmospheric boundary layer. Rev. Geophys. 2015, 53, 956–993. [Google Scholar] [CrossRef]
- Jiang, Q.; Doyle, J.D.; Grubišić, V.; Smith, R.B. Turbulence characteristics in an elevated shear layer over Owens Valley. J. Atmos. Sci. 2010, 67, 2355–2371. [Google Scholar] [CrossRef]
- Dong, W.; Fritts, D.C.; Liu, A.Z.; Lund, T.S.; Liu, H.-L. Gravity waves emitted from Kelvin-Helmholtz instabilities. Geophys. Res. Lett. 2023, 50, e2022GL102674. [Google Scholar] [CrossRef]
- Petenko, I.; Argentini, S.; Casasanta, G.; Kallistratova, M.; Sozzi, R.; Viola, A. Wavelike structures in the turbulent layer during the morning development of convection at Dome C, Antarctica. Bound.-Layer Meteorol. 2016, 161, 289–307. [Google Scholar] [CrossRef]
- Petenko, I.; Argentini, S.; Casasanta, G.; Genthon, C.; Kallistratova, M. Stable surface-based turbulent layer during the polar winter at Dome C, Antarctica: Sodar and in situ observations. Bound.-Layer Meteorol. 2019, 171, 101–128. [Google Scholar] [CrossRef]
- Zaitseva, D.; Kallistratova, M.; Lyulyukin, V.; Kouznetsov, R.; Kuznetsov, D.D. On the influence of internal gravity waves on the intensity of turbulence in the atmospheric boundary layer. IOP Conf. Ser. Earth Environ. Sci. 2022, 1040, 012034. [Google Scholar] [CrossRef]
- Smyth, W.D. Secondary Kelvin-Helmholtz instability in weakly stratified, sheared flow. J. Fluid Mech. 2003, 497, 67–98. [Google Scholar] [CrossRef]
- Van der Linden, S.J.A.; Van de Wiel, B.J.H.; Petenko, I.; van Heerwaarden, C.C.; Baas, P.; Jonker, H.J.J. A Businger mechanism for intermittent bursting in the stable boundary layer. J. Atmos. Sci. 2020, 77, 3343–3360. [Google Scholar] [CrossRef]
- Kaminski, A.; Smyth, W.D. Stratified shear instability in a field of pre-existing turbulence. J. Fluid Mech. 2019, 862, 639–658. [Google Scholar] [CrossRef]
- Liu, C.-L.; Kaminski, A.K.; Smyth, W.D. The effects of boundary proximity on Kelvin-Helmholtz instability and turbulence. J. Fluid Mech. 2023, 966, A2. [Google Scholar] [CrossRef]
- Moeng, C.H. A large-eddy-simulation model for the study of planetary boundary-layer turbulence. J. Atmos. Sci. 1984, 41, 2052–2062. [Google Scholar] [CrossRef]
- Sullivan, P.P.; McWilliams, J.C.; Moeng, C.H. Subgrid-scale model for large-eddy simulation of planetary boundary-layer flows. Bound.-Layer Meteorol. 1994, 71, 247–276. [Google Scholar] [CrossRef]
- Klemp, J.B.; Durran, D.R. An upper boundary condition permitting internal gravity wave radiation in numerical mesoscale models. Mon. Weather Rev. 1983, 111, 430–444. [Google Scholar] [CrossRef]
- Fairall, C.W.; Bradley, E.F.; Rogers, D.P.; Edson, J.B.; Young, G.S. Bulk parameterization of airsea fluxes for Tropical Ocean-Global Atmosphere Coupled-Ocean Atmosphere Response Experiment. J. Geophys. Res. 1996, 101, 3747–3764. [Google Scholar] [CrossRef]
- Fritts, D.C.; Garten, F.; Andreasson, O. Wave breaking and transition to turbulence in stratified shear flows. J. Atmos. Sci. 1996, 53, 1057–1085. [Google Scholar] [CrossRef][Green Version]
- Fritts, D.; Wan, K.; Werne, J.A.; Lund, T.S.; Hecht, J.H. Modeling the implications of Kelvin–Helmholtz instability dynamics for airglow observations. J. Geophys. Res. Atmos. 2014, 119, 8858–8871. [Google Scholar] [CrossRef]
- Jiang, Q. Impact of Elevated Kelvin–Helmholtz Billows on the Atmospheric Boundary Layer. J. Atmos. Sci. 2021, 78, 3983–3999. [Google Scholar]
- Miura, A.; Pritchett, P.L. Nonlocal stability analysis of the MHD Kelvin-Helmholtz instability in a compressible plasma. J. Geophys. Res. 1982, 87, 7431–7444. [Google Scholar] [CrossRef]
- Costa, F.D.; Acevedo, O.C.; Medeiros, L.E.; Maroneze, R.; Puhales, F.S.; Carvalho, A.D., Jr.; Camponogara, L.F.; dos Santos, D.M.; Mortarini, L. Stable boundary layer regimes in single-column models. J. Atmos. Sci. 2020, 77, 2039–2054. [Google Scholar] [CrossRef]
- Mahrt, L. Stratified atmospheric boundary layers. Bound.-Layer Meteorol. 1999, 90, 375–396. [Google Scholar] [CrossRef]
- Wang, S.; Jiang, Q. Impact of vertical wind shear on roll structure in idealized hurricane boundary layers. Atmos. Chem. Phys. 2017, 17, 3507–3524. [Google Scholar] [CrossRef]
- Thorpe, S.A. Laboratory observations of secondary structures in Kelvin–Helmholtz billows and consequences for ocean mixing. Geophys. Astrophys. Fluid Dyn. 1985, 34, 175–199. [Google Scholar] [CrossRef]
- Thorpe, S.A. Transitional phenomena and the development of turbulence in stratified fluids: A review. J. Geophys. Res. 1987, 92, 5231–5248. [Google Scholar]
Disclaimer/Publisher’s Note: The statements, opinions and data contained in all publications are solely those of the individual author(s) and contributor(s) and not of MDPI and/or the editor(s). MDPI and/or the editor(s) disclaim responsibility for any injury to people or property resulting from any ideas, methods, instructions or products referred to in the content. |
© 2024 by the author. Licensee MDPI, Basel, Switzerland. This article is an open access article distributed under the terms and conditions of the Creative Commons Attribution (CC BY) license (https://creativecommons.org/licenses/by/4.0/).