Article

Identification of Causes of Air Pollution in a Specific Industrial Part of the Czech City of Ostrava in Central Europe

Czech Hydrometeorological Institute, K Myslivně 3/2182, 708 00 Ostrava, Czech Republic
*
Author to whom correspondence should be addressed.
Atmosphere 2024, 15(2), 177; https://doi.org/10.3390/atmos15020177
Submission received: 29 December 2023 / Revised: 21 January 2024 / Accepted: 26 January 2024 / Published: 30 January 2024

Abstract

:
This contribution deals with the assessment of air pollution caused by atmospheric aerosol particulate matter fraction PM10 and benzo[a]pyrene (BaP) in the urban agglomeration of Ostrava, located in the Czech Republic in Central Europe. The motivation for this research was the need to identify the sources of air pollution in the area, particularly in locations where the contribution of different sources to concentrations of pollutants of concern has not been elucidated yet. In this study, source apportionment in the vicinity of the industrial hot spot was performed by statistically evaluating measured pollutant concentrations as a function of meteorological variables and using the Positive Matrix Factorization (PMF) receptor model. A significant methodological innovation and improvement over previous assessments was the higher monitoring resolution of benzo[a]pyrene, with samples collected at three-hour intervals instead of the standard 24 h collection period. The key findings indicate that in the cold part of the year, secondary particles—specifically sulfates and ammonium nitrates—were responsible for the most significant portion of PM10 air pollution throughout the area of interest. The contribution of these particles ranged from one-third to two-fifths of the total concentration, except at the industrial site of Ostrava–Radvanice (TORE), where they accounted for approximately one-fifth of the measured pollution concentration level. Emissions from individual household heating were identified as the main source of this type of pollution. With regards to benzo[a]pyrene air pollution, this study found that in the whole area of interest, except for the Ostrava–Radvanice site, it mainly originated from individual heating with coal (90%). In contrast, at the Ostrava–Radvanice site, two-thirds of the benzo[a]pyrene pollution came from the premises of Liberty Ostrava a.s., primarily from coke production, and less than one-third came from local domestic heating. This study also determined the spatial extent of the occurrence of extremely high benzo[a]pyrene concentrations (above 5 ng/m3), which are estimated to affect nearly 10,000 inhabitants. The results confirm that the data from the TORE station are only representative of its immediate surroundings and are not applicable to the assessment of air quality and causes of air pollution in the whole city of Ostrava or the urban area of Ostrava–Radvanice as a whole. After years of research, these findings provide the Ministry of the Environment of the Czech Republic and the government with an accurate basis for implementing measures to address the identified pollution sources in the area of interest. The success of this study was made possible by the adoption of a more detailed sampling approach, which involved a resolution of 3 h instead of 24 h. This methodological improvement is a significant finding and will be useful for future source apportionment studies.

1. Introduction

Air pollution is one of the most important environmental problems, especially in urban areas where most people live [1]. Knowledge about the level of air pollution in a region of interest is critical for assessing the impact on the quality of life of every resident [2,3,4,5,6]. The study area is located in the northeastern part of the Czech Republic in the city of Ostrava, which is part of the Ostrava–Karviná agglomeration. The agglomeration is part of the Upper Silesian Basin, which is located in the Czech Republic and in the larger area of Poland. Coal mining and related industries began here in the 17th century. There is a high density of individual heating with solid fuels (a high proportion of coal combustion), many industrial sources that were historically linked to coal mining in the Upper Silesian Basin and, last but not least, a rich transport infrastructure [7]. The situation is particularly serious given that this is a densely populated area. The negative impact on the environment and air quality has been recorded since the 1970s. Air quality improved in the 1990s with the onset of economic restructuring in both countries. Another reason for the improvement was the accession of both countries to the European Union and the need to adapt legislation to EU requirements [7,8]. These measures have improved air pollution levels in the region, but problems remain. In the study area, there are still exceedances of the limits, especially for PM10 and benzo[a]pyrene (BaP). In the case of the carcinogen BaP, the annual limit of 1 ng/m3 has been exceeded significantly over the long term. In some years, it is even more than 10 times higher than the limit. Although annual PM10 concentrations have not exceeded the annual limit of 40 µg/m3 in the last 4 years, the number of permissible exceedances of the daily limit was exceeded every year, i.e., more than 35 times over 50 µg/m3 [9].
Elevated concentrations of both pollutants cause a number of health risks, especially in a densely populated region. The most significant source of PM10 and BaP is individual heating with solid fuels. In the Czech Republic in 2019, local heating sources accounted for 55.1% of PM10 concentrations and 96.4% of BaP concentrations [9]. BaP is produced almost exclusively by combustion processes and is the product of incomplete combustion at temperatures of 300 to 600 °C [10]. The contribution to BaP concentrations varies in different parts of the Czech Republic and depends on the position and density of its sources. The greatest burden by emissions of BaP occurs in the Moravian–Silesian region due to the higher proportion of black coal combustion in bulk-burning-type boilers in households [11,12,13,14].
The Ostrava–Radvanice (TORE) station has the highest BaP concentrations in the Czech Republic in the long term. Annual mean BaP concentrations at this station ranged from 7.7 to 9.6 ng/m3 over the last 5 years 2017–2021 [9], whereas the annual limit for BaP is 1 ng/m3 [15,16,17].
Previous processing and model evaluations have not been able to reliably identify the main contributor to this pollution at this station [18,19]. Real measured BaP concentrations were higher than the results from the model calculations. The previous model results for this area also indicate that for BaP, the contribution of foreign sources (transboundary air pollution transport) was the largest contributor to the annual mean concentration (exceeding the limit value by several times), at around 45%. Similarly, the contribution of foreign sources at the nearest industrial stations (Ostrava–Přívoz and another location Ostrava–Radvanice) was also based on the same method [18]. Furthermore, the model results show that the year-round coking plant operated by ArcelorMittal Ostrava a. s. (now Liberty Ostrava, a. s.) contributes relatively less to the total annual mean BaP concentration in this locality, as well as automobile traffic, on the order of a few percent [20].
However, if we relate this share to the mean annual BaP concentration measured at the station, the absolute contribution of foreign sources at the TORE station is approximately twice as high as the one at the other two industrial stations. Of course, this cannot correspond to reality. A closer look at the modeling results shows that the absolute contribution of foreign sources calculated by the CAMx model (www.camx.com, accessed on 15 December 2023) is comparable at these sites. The spatial distribution of annual averages of BaP presented that the annual mean concentration measured at the stations decreases with increasing distance from the Czech–Polish border [13,14,21,22]. The Ostrava–Radvanice site is an exception. Assuming the accuracy of the measured concentrations, the only possible explanation is that a significant source (or group of sources) of BaP emissions, which significantly affects the concentrations measured at the Ostrava–Radvanice TORE station locally, is missing or incorrectly accounted for in the model inputs [20,21,22].
The lack of precise information meant that there were no convincing arguments on where to target measures to reduce emissions of this pollutant. At stations in the National Air Quality Monitoring Network of the Czech Republic, 24 h (daily) BaP concentrations are measured every 3rd day (or 6th day) [9,21]. This makes it impossible to assess the level of air pollution by this pollutant in more detail depending on meteorological variables (mainly wind direction and wind speed) and to identify the possible source of pollution on the basis of these assessments.
Due to the above-described pitfalls, the Czech Hydrometeorological Institute has decided to realize an innovative method of sampling at 3 h intervals in the period January–April 2021. Subsequently, broad-spectrum analyses were performed. The increased technical and financial complexity of this solution was positively compensated by the higher representativeness of the measurements in relation to meteorological conditions and thus higher unambiguity and credibility of the assessment. The extraordinary reliability of the assessment conclusions was achieved by using two completely independent methodological approaches for quantifying the concentration proportions of pollution sources: source identification based on the dependence of air pollution levels on meteorological conditions and source identification based on the PMF model—Positive Matrix Factorization [23,24]. Both solutions are independent of the input emission data.
Such extensive measurements, analyses, and postprocessing of the results were carried out within the project ARAMIS—Air Quality Research, Assessment and Monitoring Integrated System (www.projekt-aramis.cz, accessed on 1 December 2023), which is funded by the Technology Agency of the Czech Republic and the project KAPOOO—Regional Action Plan for Air Protection (https://www.msk.cz/cs/temata/zivotni_prostredi/krajsky-akcni-plan-pro-oblast-ochrany-ovzdusi---kapooo-10409/, accessed on 1 December 2023), which is being implemented under the Environment, Ecosystems and Climate Change program funded by the 2014–2021 Norway Grants. Within the project of emission reduction, measures targeting the most problematic air polluters, implemented or at least proposed before the project started, are analyzed based on an earlier series of regional air quality measurements. The project also includes an analysis of previously identified pollution sources. This will contribute to a targeted, detailed, and more accurate identification of air pollution sources. Based on the analyses, the most effective measures will be proposed and further integrated into the action plan. The purpose of these measures is to achieve an improvement in air quality in the Czech Republic, namely in the Moravian–Silesian Region.
Activities within both projects were supported by the Regional Authority of the Moravian–Silesian Region (www.msk.cz, accessed on 1 December 2023), the Statutory City of Ostrava (https://www.ostrava.cz/cs, accessed on 1 December 2023), the municipalities of the districts concerned, Public Health Institute Ostrava (https://www.zuova.cz/, accessed on 1 December 2023), and the integrated steel business Liberty Ostrava a. s. (https://libertysteelgroup.com/cz/, accessed on 1 December 2023).

2. Materials and Methods

The sampling was carried out at three monitoring sites (TOBA, TOKU, and TORE) between 14 January and 14 April 2021.

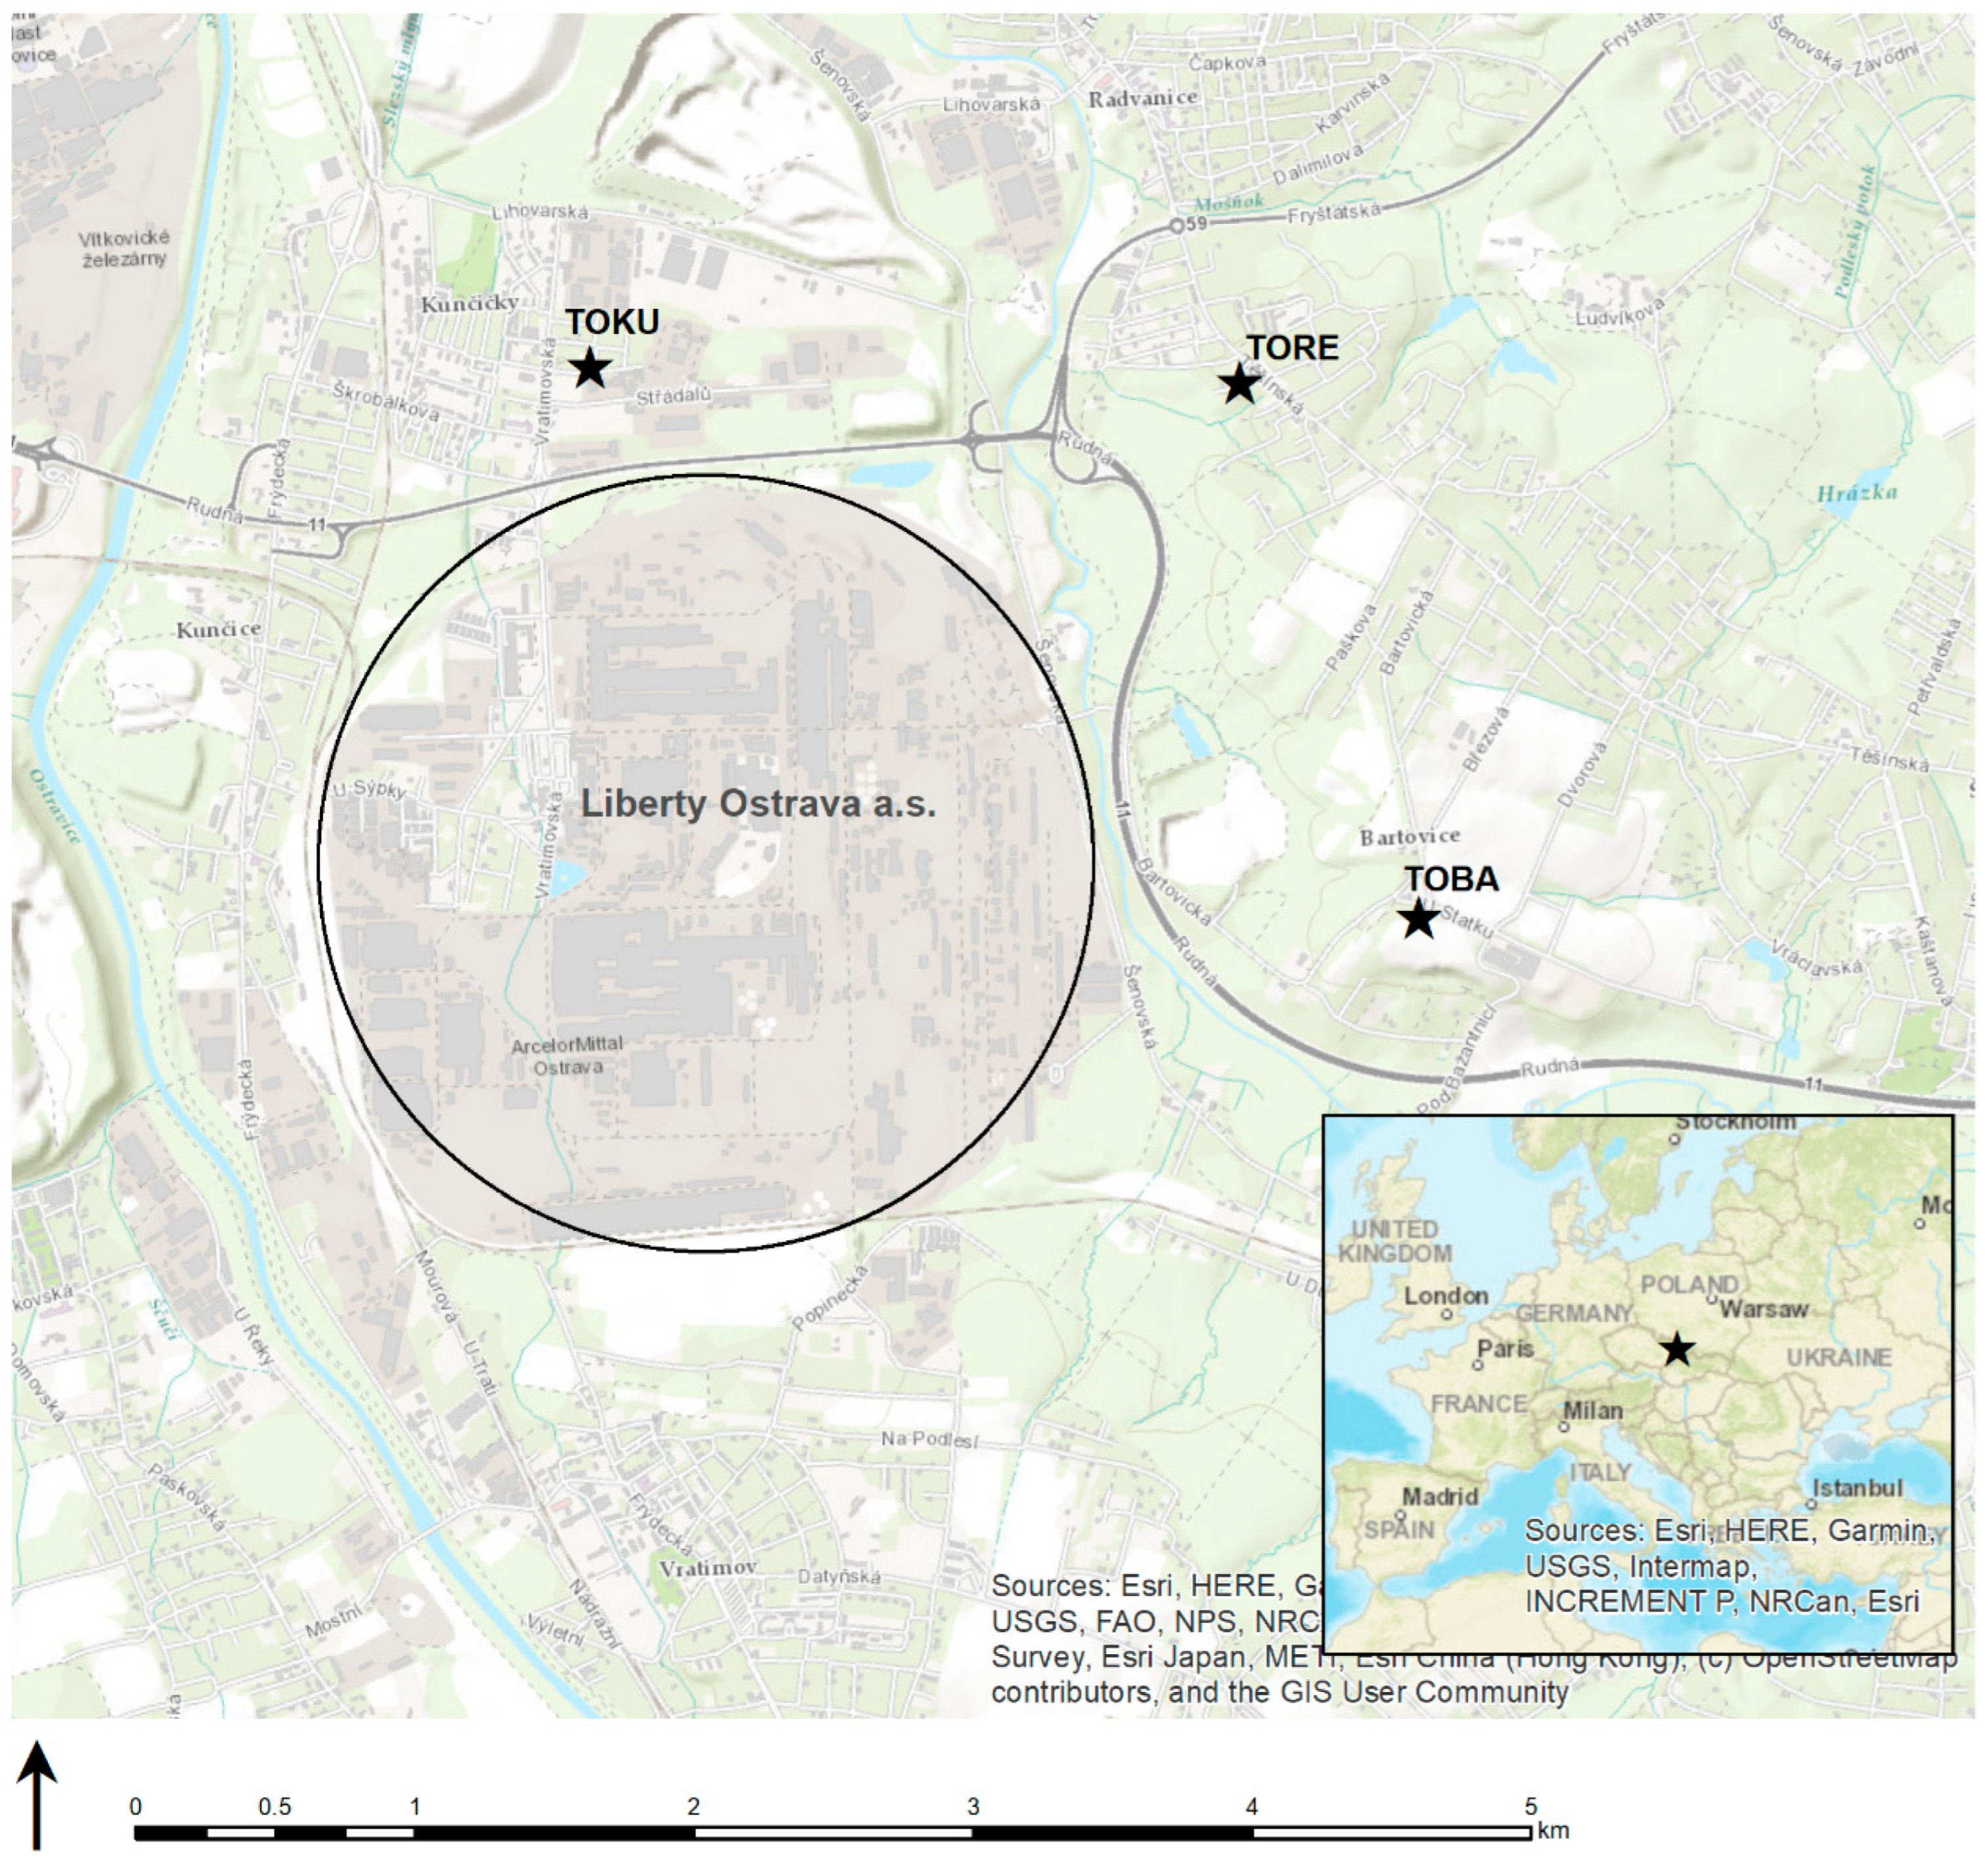
2.1. Monitoring Sites

The locations were selected with regard to the location of the industrial complex Liberty Ostrava a. s. and other existing sources of air pollution. These were three stations located in the vicinity (Figure 1) of the Liberty Ostrava a. s. site, in the northern (Kunčičky, Ostrava, Czech Republic—TOKU), northeast (Ostrava-Radvanice—TORE), and eastern (Bartovice, Ostrava, Czech Republic—TOBA) directions of the site. Two new locations in Ostrava–Kunčičky and Ostrava–Bartovice were purposely selected for two sampling sites. The third station was located on the site of the existing long-term air quality monitoring station Ostrava–Radvanice ZÚ, located on Nad Obcí Street. This station is owned by The Public Health Institute in Ostrava and operated with the support of the Statutory City of Ostrava. The distance between TOKU and TORE is about 2.3 km, between TORE and TOBA about 2 km, and between TOBA and TOKU about 3.6 km. The TOBA station is located at the fire station. The site is on the outskirts of the village near buildings of the civic facilities, and there are agricultural areas nearby. The TOKU station is located in the fire station area, with low-rise residential development and buildings for civic facilities.
The TORE station belongs to the National Air Quality Monitoring Network and is classified as industrial, suburban-zoned, with industrial and residential characteristics [21,25,26]. In the vicinity of the station, in the southern part of Ostrava–Radvanice, on sloping terrain, there is a low-rise development of family houses at a distance of about 60 m from a medium-traffic road. The industrial characteristics of the station are determined by the main source of air pollution from the metallurgical industrial complex (production of coke, sinter, iron, steel, secondary metallurgy, and associated steel processing plants, a power plant, and a heating plant), which is located in a valley positioned about 1.1 to 4.1 km to the southwest. The purpose of the location of the station is to represent the contribution from industrial sources of air pollution on a microscale: a few meters to 100 meters [9].

2.2. Sampling

Three Leckel SEQ automatic samplers with a controlled flow of 2.3 m3/h and an accuracy of 2% were used to collect atmospheric PM10 on filters at each monitoring site. The samples were collected every 9 h for a period of 3 h, and the sampling periods were the same for all samplers at all sites. This measurement interval allowed 3 h samples to be taken with a shift and overhang within the same day and overlap to the next day. The sampling thus represented a moving window of 3 h intervals throughout various times of the day over a 3-month period (14 January—14 April 2021). The aim of such a design was to equally cover various daytime intervals in the sampling, with the same number of samples collected at each time of the day, as different emission sources can release pollution at different times of the day or irregularly. Additionally, this approach ensures a sufficient number of samples for subsequent evaluations and to meet the financial constraint of costly laboratory analyses. A total of 240 regular samples and 12 field blanks (5% of samples) were collected at each site for each laboratory method.
PTFE filters (diameter of 46.2 mm, Cytiva Whatman, Buckinghamshire, UK) were used for gravimetric, elemental, anhydrosacharides, cations, and anions analyses, while quartz fiber filters (MK5, diameter of 47 mm diameter, Ahlstrom-Munksjö, Helsinki, Finland) were used for organic (OC) and elemental (EC) carbon and PAH analyses. Prior to the organic and elemental carbon and PAH analyses, the filters were prebaked at 800 °C for 3 h.

2.3. Laboratory Analysis

In all samples, the same laboratory procedures were conducted. The Mettler Toledo, XPR6UD5 model was used for gravimetric PM10 mass measurement (with a method detection limit of 0.6 µg/m3). Clean filters were stabilized at a temperature of 19–21 °C and a relative air humidity of 45–50% for 48 and 12 h before the first and second weighing, respectively. The exposed filters were stabilized under the same conditions for 48 and 24 h, respectively.
For the determination of OC and EC concentrations, thermo-optical transmission (Sunset Laboratory Inc., Amsterdam, The Netherlands, model 4L) adopting the EUSAAR_2 thermal program was used, which is a widely published European standard method for atmospheric aerosol samples [27,28,29]. Temperatures and duration of thermal steps are documented in Table 1.
A Merck calibration standard (10 µL of saccharose CAS 57-50-1 of carbon concentration 4.2109 µg/µL dosed on the filter) was used after every ten measured samples to ensure accuracy. The measured OC data were corrected for the field blank values, and the field blank EC concentration was found to be negligible. The limit of quantification for organic and elemental carbon was determined as three times the concentration of laboratory blanks (3.6 and 0.02 µg/m3, respectively). Positive OC sampling artifacts were evaluated based on doubled filters, where top filters were placed directly on top of bottom filters in the same position in the sampler. A total of 66 out of 683 collected filters were doubled at all three sites. No significant difference was found between the field blanks and bottom filters, nor between the laboratory blanks and the field blanks. The mean and standard deviation of laboratory blanks, field blanks, and bottom filter OC concentrations were 1.21 ± 0.46, 1.36 ± 0.64, and 1.36 ± 0.80 µg/cm2, respectively [30,31].
Anhydrosacharides and ions (levoglucosan, mannosan, galactosan, SO42−, NO3, Cl, Br, F, NH4+, Na+, K+, Ca2+, and Mg2+) concentrations were determined with HPAE chromatography (using a two-channel Metrohm, 940 Professional IC Vario with PAD and CD detectors for anhydrosugars and ions, respectively). This method has been widely used worldwide for many years [23]. For chromatography analyses, all samples were extracted in 10 mL of pure water (PURELAB® Elga flex) using a horizontal eccentric shaker (350 rotations per minute for 1 h). Water extracts were then filtered through the Cytiva Whatman Puradisc nylon membrane filters (25 mm diameter, 0.45 µm porosity). The Metrohm Metrosep A Supp, Metrosep Carb 2, and Metrosep C6 column guards were used for anhydrosugars, cations, and anions, respectively. The limit of quantification for individual anhydrosugars and ions was 10 ng/m3 and 5 ng/m3, respectively.
Concentrations of PAHs were measured using the liquid chromatography EPA TO 13 method in the laboratory of the Public Health Institute Ostrava. The limit of quantification for benzo[a]anthracene, benzo[a]pyrene, benzo[b]fluoranthene, benzo[ghi]perylene, benzo[j]fluoranthene, benzo[k]fluoranthene, dibenzo[a,h]anthracene, chrysene, and indeno[1,2,3-cd]pyrene was 0.3, 0.1, 0.3, 0.3, 2.9, 0.3, 0.6, 0.3, and 0.6 ng/m3, respectively.
Macro and trace elements (Na, Mg, Al, Si, S, K, Ca, Ti, V, Cr, Mn, Fe, Ni, Cu, Zn, As, Se, Cd, In, Sb, Ba, and Pb) were measured by ED XRF (Thermo Scientific (Waltham, MA, USA)—ARL Quant X), with the samples autorotated during measurement. The method is well known and has been tested over the long term for the elemental analyses of aerosol samples [24]. Three measurement repetitions of each sample were averaged to reduce measurement uncertainty. The method calibration was based on the individual Micromatter XRF calibration standard on the PTFE filter for each element. Table S1 in the Supplementary Material shows the limits of quantification of the macro and trace elements analysis.
Due to measurement and laboratory losses, 206 (TOBA), 237 (TOKU), and 239 (TORE) valid samples were used in the PMF modeling. Except for the filters-based laboratory analysis results, concentrations of gases from the TORE site were also used, as their measurement was part of long-term air quality monitoring provided by the Public Health Institute in Ostrava [32].

2.4. Identification of Pollution Sources Depending on Wind Direction and Wind Speed

The assessment makes an important contribution by enabling the evaluation of BaP concentrations in relation to meteorological variables, such as wind direction and wind speed, at shorter intervals of 3 h. Previously, only 24 h averages of this pollutant were available, which made it difficult to establish a complete relationship with short-term (hourly or 10 min) measurements of wind direction and speed. For the assessment of daily concentrations, it is possible to use the method of calculating the daily type of wind (prevailing daily wind direction). While the method of calculating the prevailing daily wind direction is suitable for assessing daily concentrations, it may not be accurate enough for identifying sources of air pollution in a given area [33,34].
The processing used 3 h averaged concentrations of BaP and PM10 and hourly values of meteorological variables. Meteorological data were averaged for the same 3 h interval. The values are in UTC and are referenced to the beginning of the measurement interval, i.e., the mean PM10 concentration for hour 0 is the mean PM10 concentration for the period 0 to 3 h UTC.
Direct meteorological measurements were carried out in Ostrava–Bartovice (TOBA). For all three locations, measurements of wind direction and wind speed in this locality were used due to the uncomplicated orography and small distance. The suitability of using this wind rose was verified by comparison with a representative wind rose for Ostrava from the climatological station Ostrava–Poruba for the same period. For the purpose of comparison with the 3 h averaged values of the measured pollutants, vector averages of wind direction were calculated for the given 3 h intervals.
In the processing, concentration roses were used to represent the data, showing the distribution of contribution of maximum PM10 concentration for a given wind direction and wind speed. The weighted concentration roses, as opposed to concentration roses, provide information on how often a given combination of wind direction and wind speed occurs and indicate how much the concentrations measured for a given wind speed and direction contribute to the overall mean concentration over a given period. The concentration roses reveal the situations at maximum contributions of a given pollutant in a given location. The weighted concentration rose will show from which wind direction and at which wind speed the pollution was coming at the highest rate over the whole period. It is clear from the above that the two types of roses for the same location and period can differ significantly. To give a better idea, concentration roses without including wind speed were also shown. Evaluation and comparison of these types of roses can indicate the location of sources that most frequently affect air quality at a given location, as well as the location of sources from which concentrations come only sporadically but at maximum contributions.
In order to evaluate the often-discussed possible influence of emissions from the Liberty Ostrava a. s. premises on the air quality in the TOBA, TOKU, and TORE locations, azimuths (sectors) were drawn from each station, including the delineation of wind direction from the direction of the Liberty Ostrava a. s. premises with respect to the stations. In the case of TOBA, there is an angle of 250°–305°, for TOKU 125°–160°, and for TORE, a section at an angle of 190°–250°. The remaining angles of up to 360° (from other directions than from directions of the area of the Liberty Ostrava a. s.) are included and marked “from other directions”.
Statistical characteristics with concentration distributions indicating median and outliers are presented using boxplots. Statistical analyses and their graphical display were performed using the R software (Version 4.3.2), MS Excel (Version 2021), and ArcGIS (Version 2.8).

2.5. Positive Matrix Factorization

The U.S. EPA PMF receptor model v. 5.0 was used, which is commonly used worldwide for source apportionment. It has been used several times for PM2.5 and submicron PM source apportionment in the study area [35,36,37,38]. The method is based on time series correlations of individual analytes concentration. Analytes with a similar time course are grouped by the model into factors, which represent specific sources or groups of sources, which contribute to air pollution.
The matrix of measured concentrations and the matrix of uncertainties of the same size were used as the model input. The matrix of uncertainties was based on laboratory method uncertainties. For ions, anhydrosugars, and PAHs, the same relative uncertainty of 20%, 20%, and 25% was attributed to all samples, respectively. For EC/OC and elemental composition, individual uncertainties for each sample were used and quantified by laboratory instrument during analysis. For the mean relative uncertainties, please see Table S2 in Supplementary Material.
For each factor, the model calculated its absolute and relative contribution to the ambient air PM10 concentration. Based on the weight portion of BaP in each factor, the factor’s contribution to the total ambient concentration of this pollutant was then calculated. The PMF is often used on PM2.5 datasets with a size above 100 samples [23]. The dataset size (about 240 samples from each location) was therefore sufficient for reliable source apportionment. Nevertheless, the data from all three sites were merged into one dataset for the PMF model for more reliable and stable results. Samples collected at different sites and combined into one overall dataset have already been used in many other PMF source apportionment studies. This approach has proven to increase the statistical significance of the analysis, although it assumes that the chemical profiles of the sources do not significantly vary at the different sites [38].
The modeling was conducted following the guidelines outlined in the PMF 5.0 manual [23]. The Base Run solution was mathematically stable and geochemically meaningful, with a Q/Qexp ratio of 0.93. The coefficients of determination for the measured and modeled concentrations of PM10 and BaP were R2 = 0.97 and R2 = 0.78, respectively. The level of fit achieved for BaP was satisfactory, and for PM10, it exceeded the good accordance standard set in the previous PMF model applications in other locations in the Czech Republic [39,40]. The extra modeling uncertainty was 12%.
A total of 41 analytes were assigned as STRONG and 2 as WEAK (Si and the total variable PM10) and used in the PMF model. Some analytes, such as Al, S, Ni, Cd, In, some PAHs (BbF, BjF, BkF, DBahA, CRY), fluoride, chloride, bromide, and gaseous pollutants measured by automatic analyzers at the TORE site, were excluded from the measured analytes (assigned as BAD in the model) due to unsatisfactory signal-to-noise ratio, duplication with another analyte, or insufficient dataset. Concentrations of other duplicate and gaseous analytes in the dataset, e.g., sulfur determined by ED XRF [30,41] or nitrogen oxides, were reduced by 3 orders of magnitude to minimize their effect on PM10 mass apportionment.
The stability of the solution was verified mainly by the bootstrap method using 20 test selections. As the Base Run did not achieve sufficient accordance for some factors, a fine rotation of the model solution was performed, with the best results achieved at Fpeak = +0.5. Although the rotated solution was mathematically stable (bootstrap compliance ≥ 95%), some factors representing primary particles from nearby sources (see Section 3.2.1 for their description) showed a minor interfactorial interference. Therefore, the nitrate and sulfate content in the individual heating factors and the carbonaceous particulate content in the mineral dust factor were constrained to zero. Consequently, the Constrained Run was launched, and in its output, the mass of nitrates and sulfates was meaningfully shifted from the individual heating factors to the factors representing secondary aerosol. The model solution preserved sufficient stability, which was verified by the bootstrap method.

3. Results and Discussion

The main statistics of the measured concentration in PM10 at the TOBA, TORE, and TOKU monitoring sites are shown in Table S2 (in the Supplementary Material). Values below the detection limit were replaced by half of the method detection limit, and uncertainties were replaced by 5/6 of the detection limit. To obtain the mean uncertainties in Table S2, concentrations below the detection limit and their uncertainties were thus excluded from the calculation.

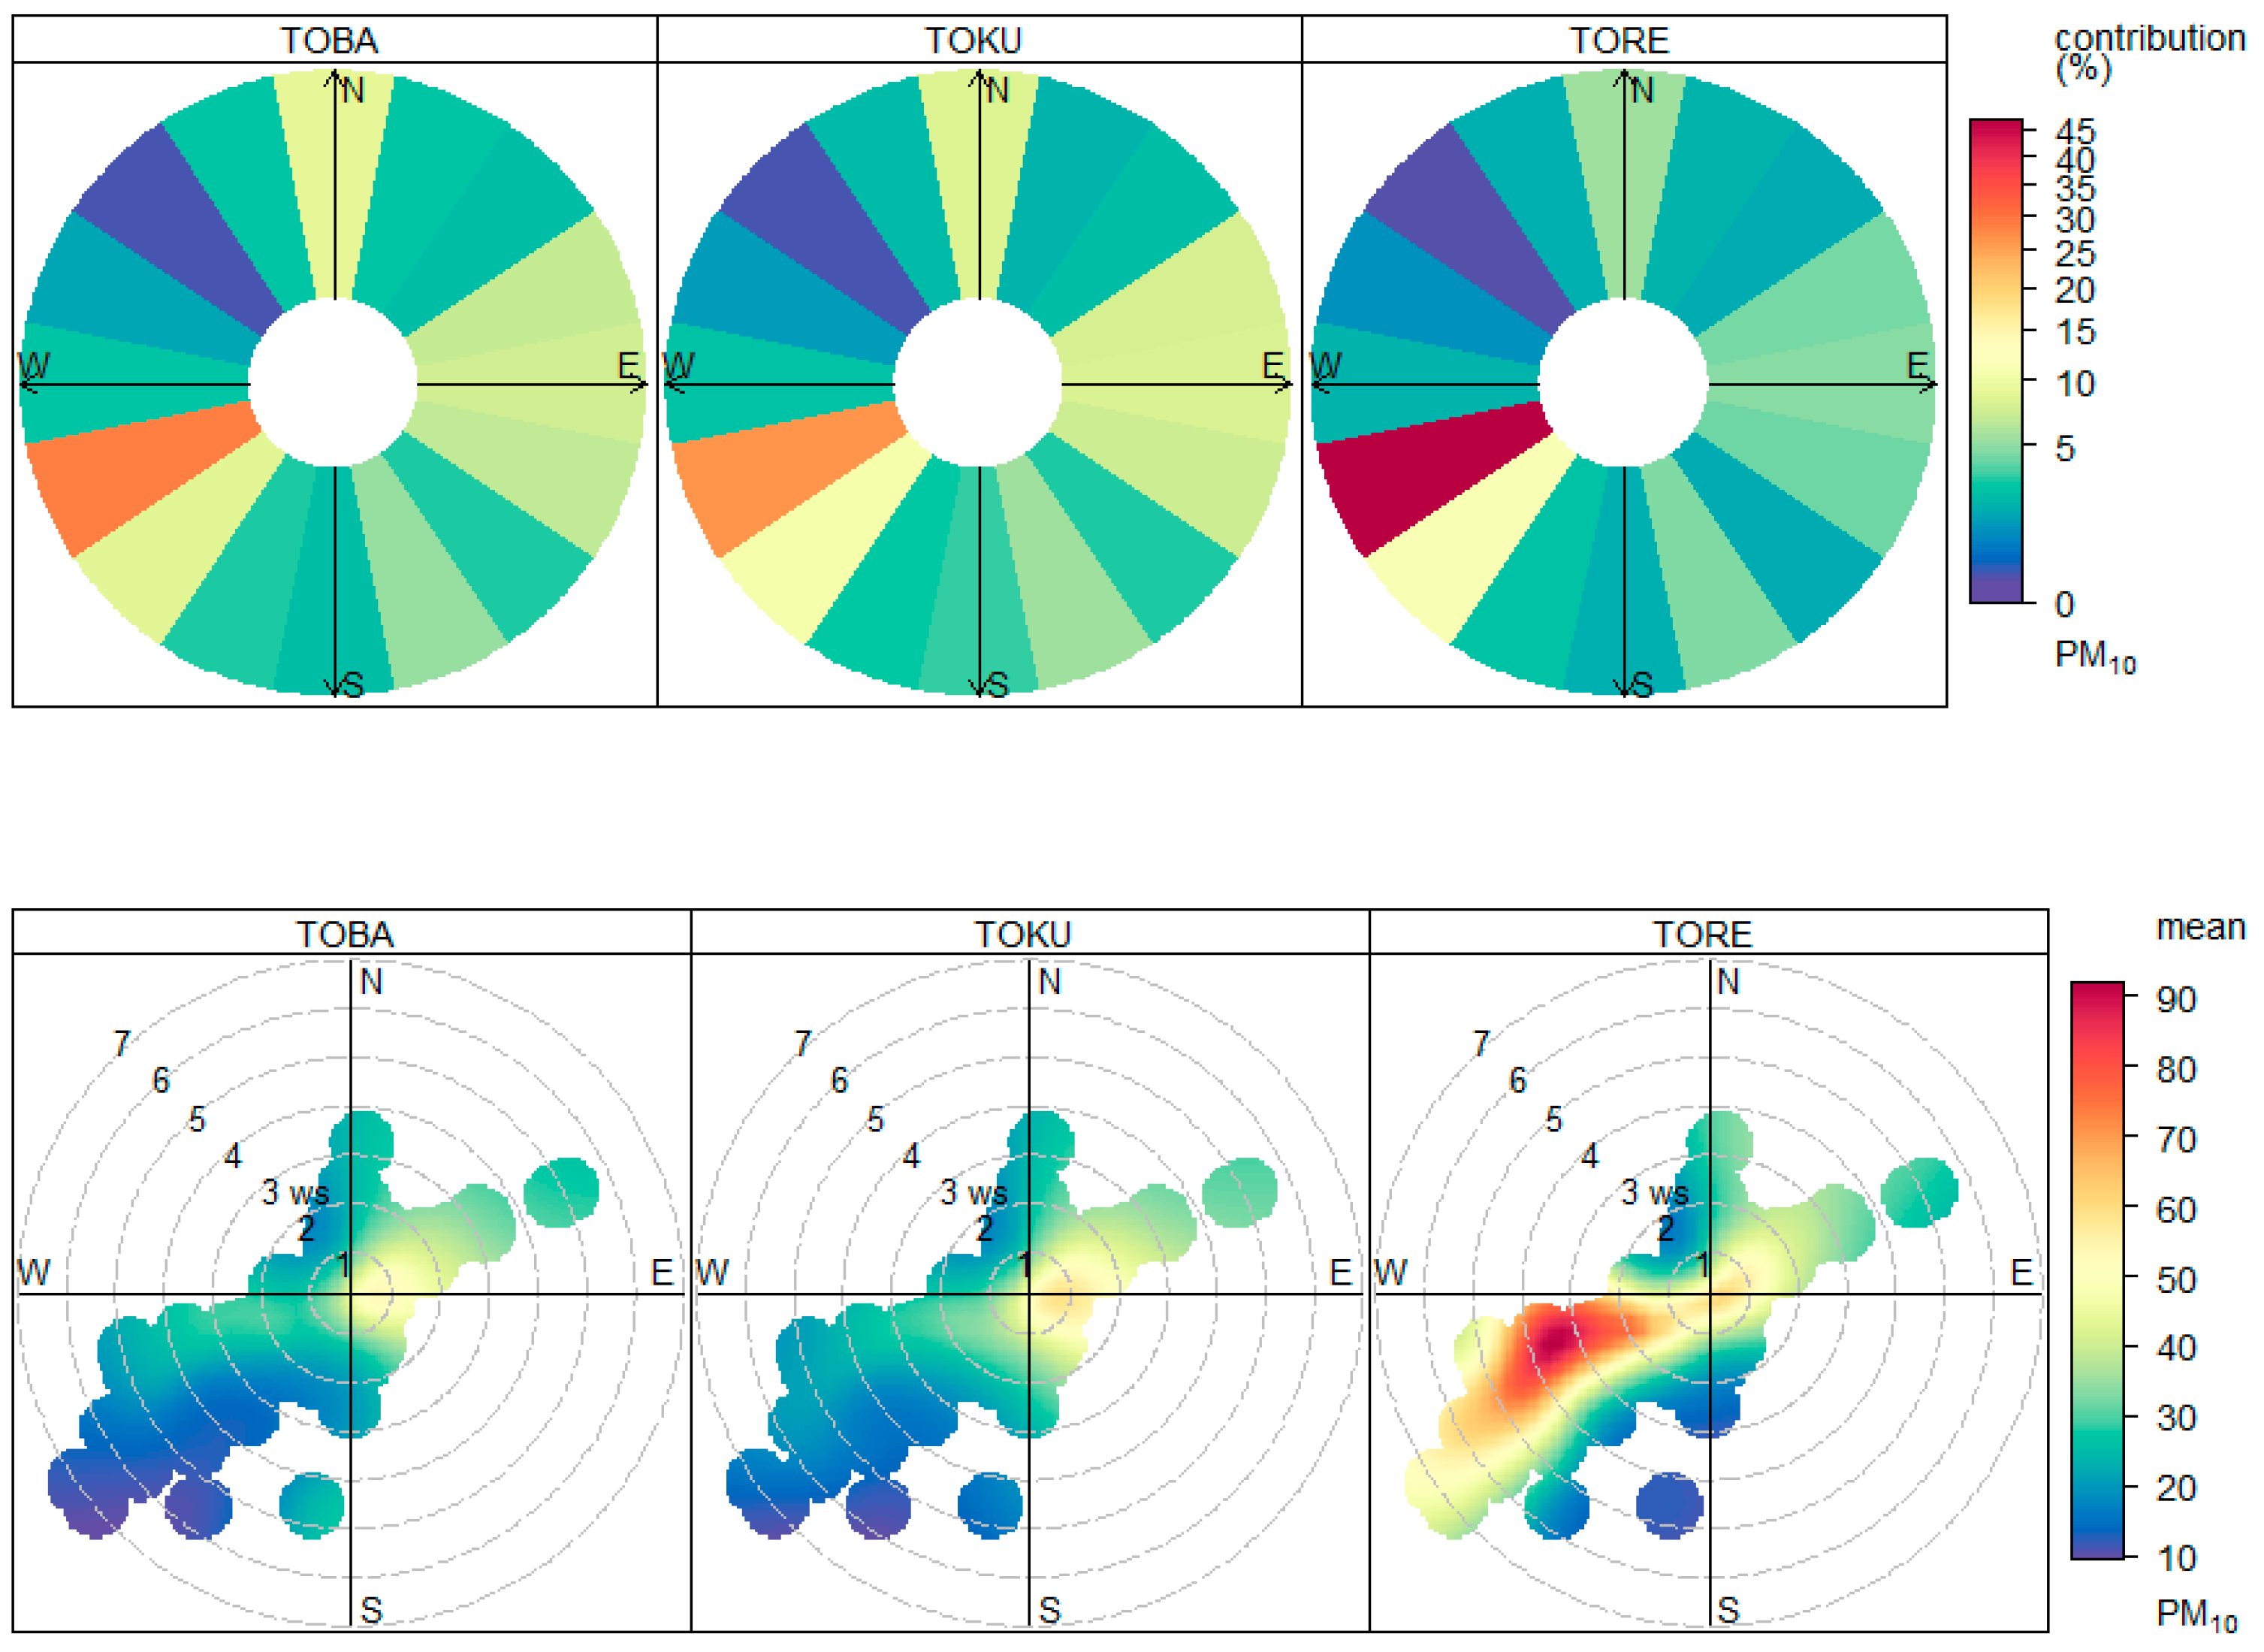
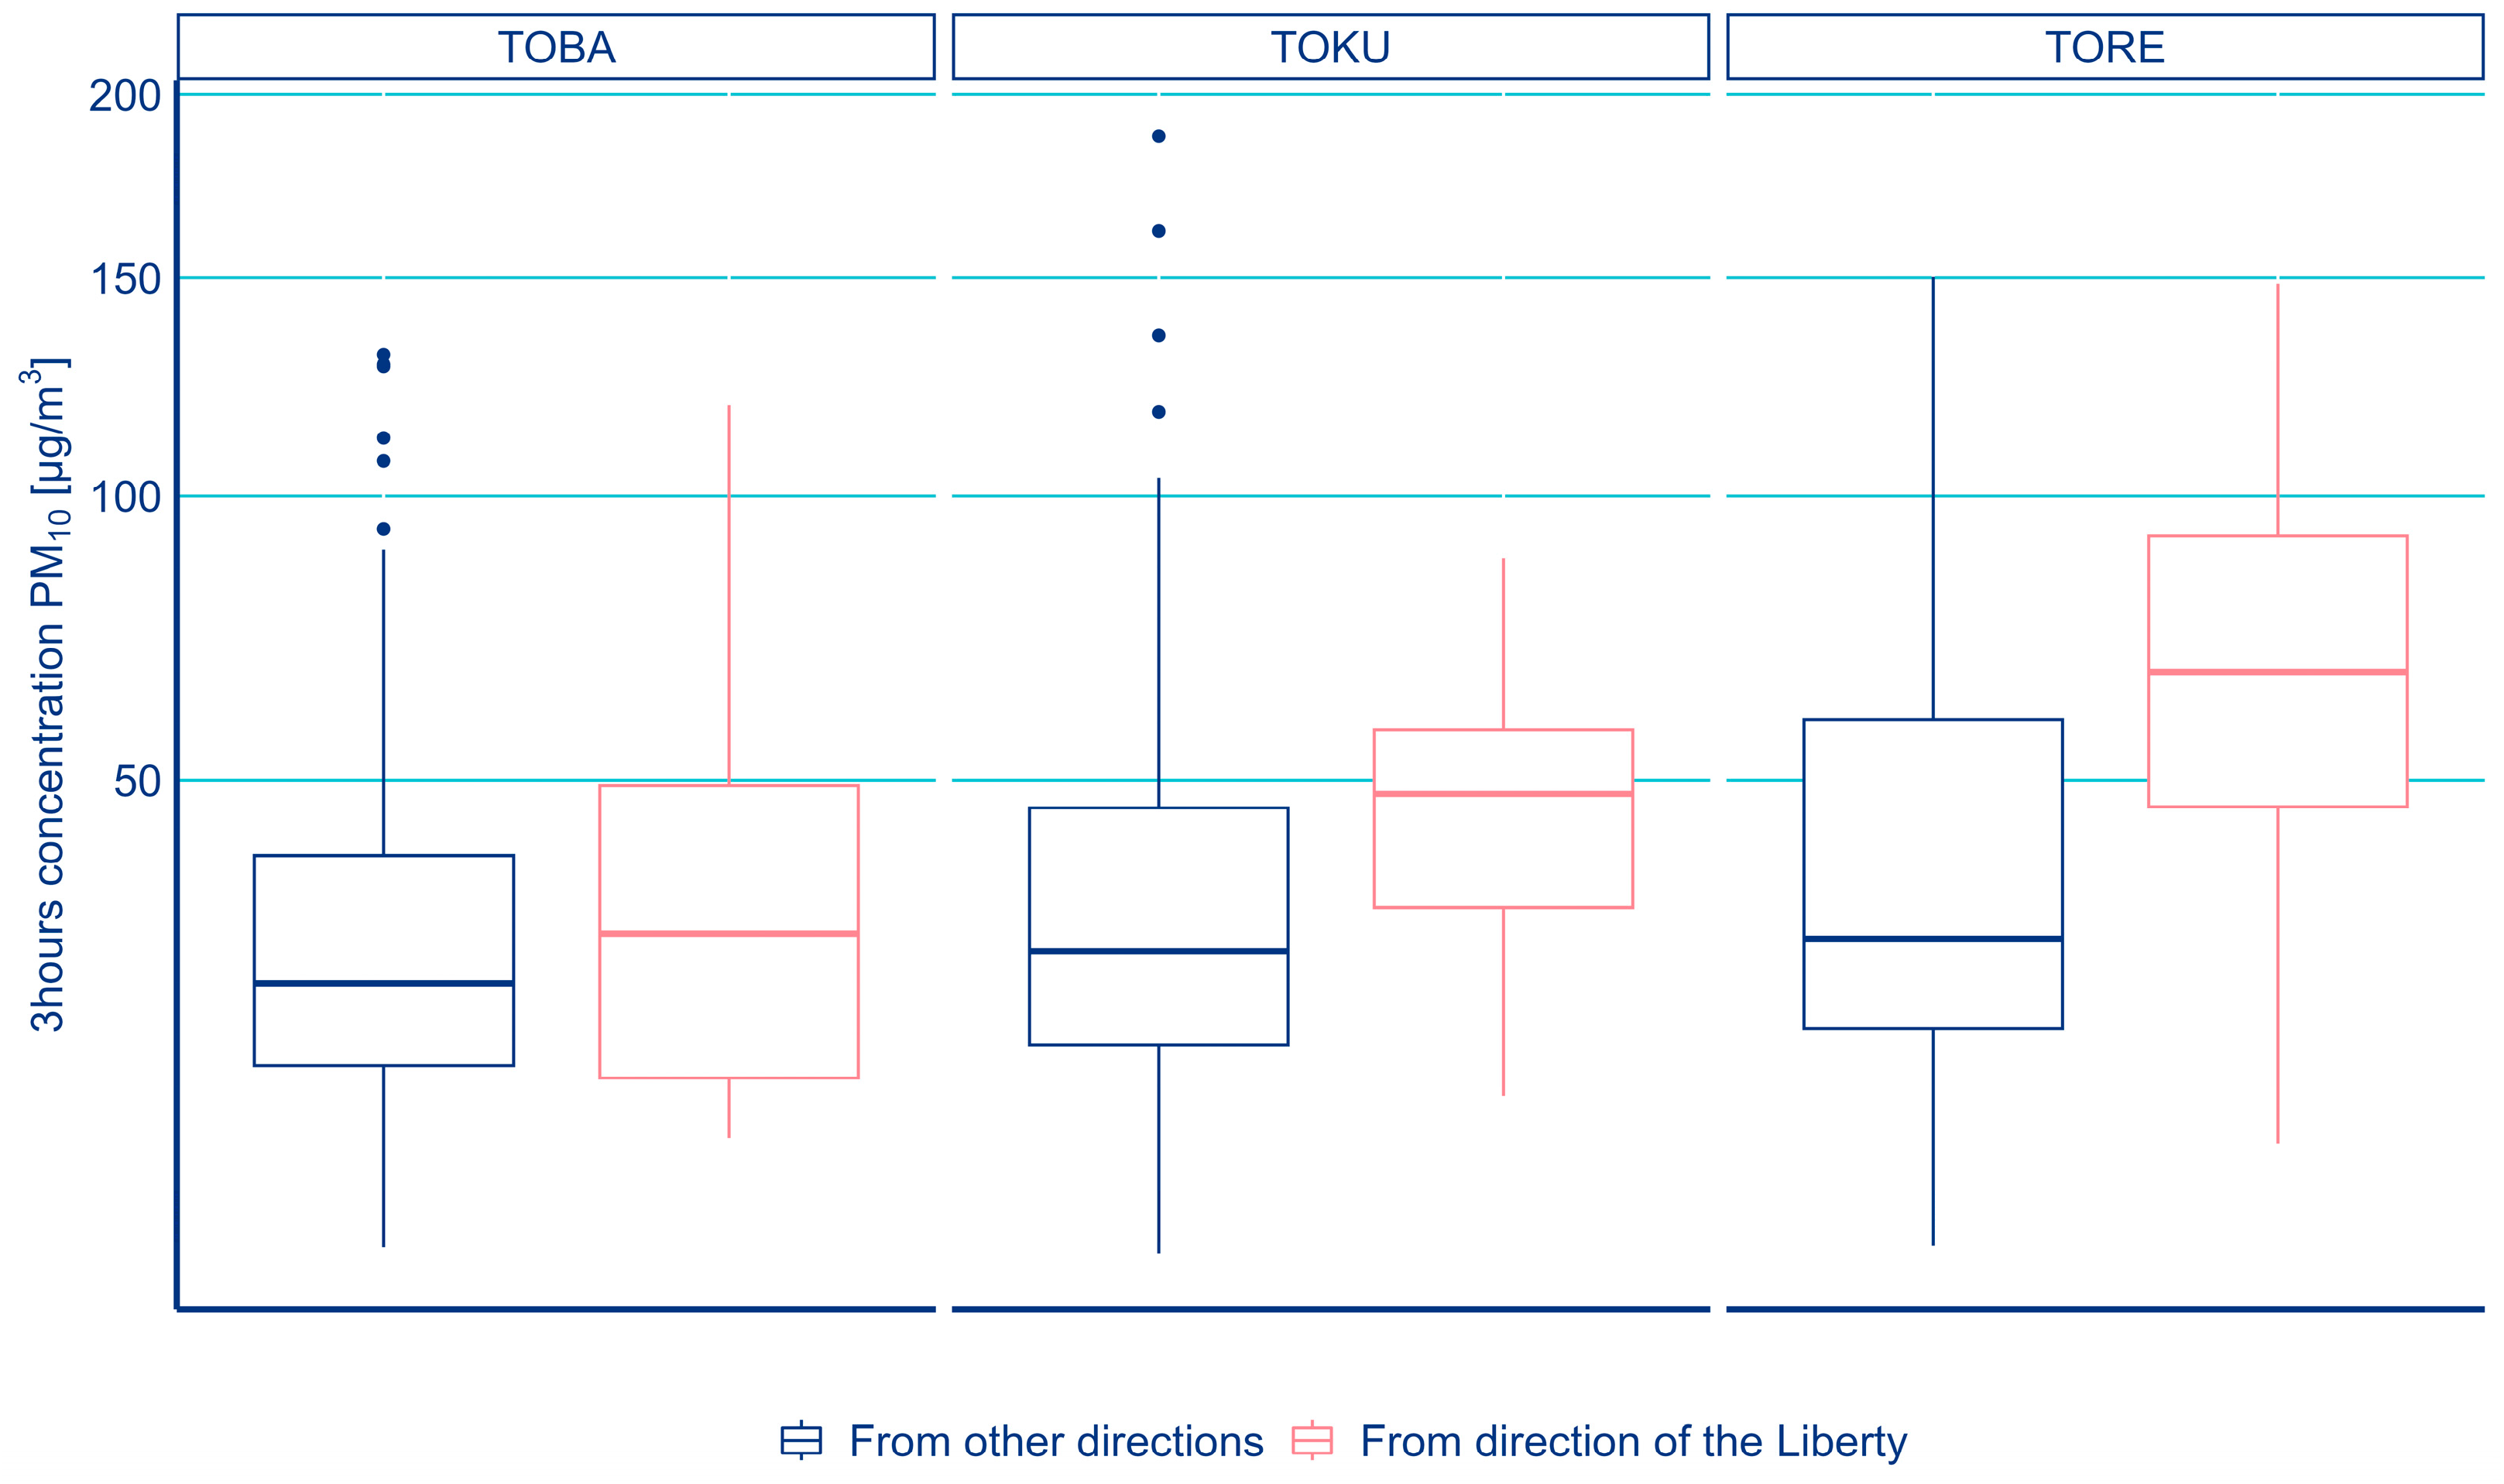
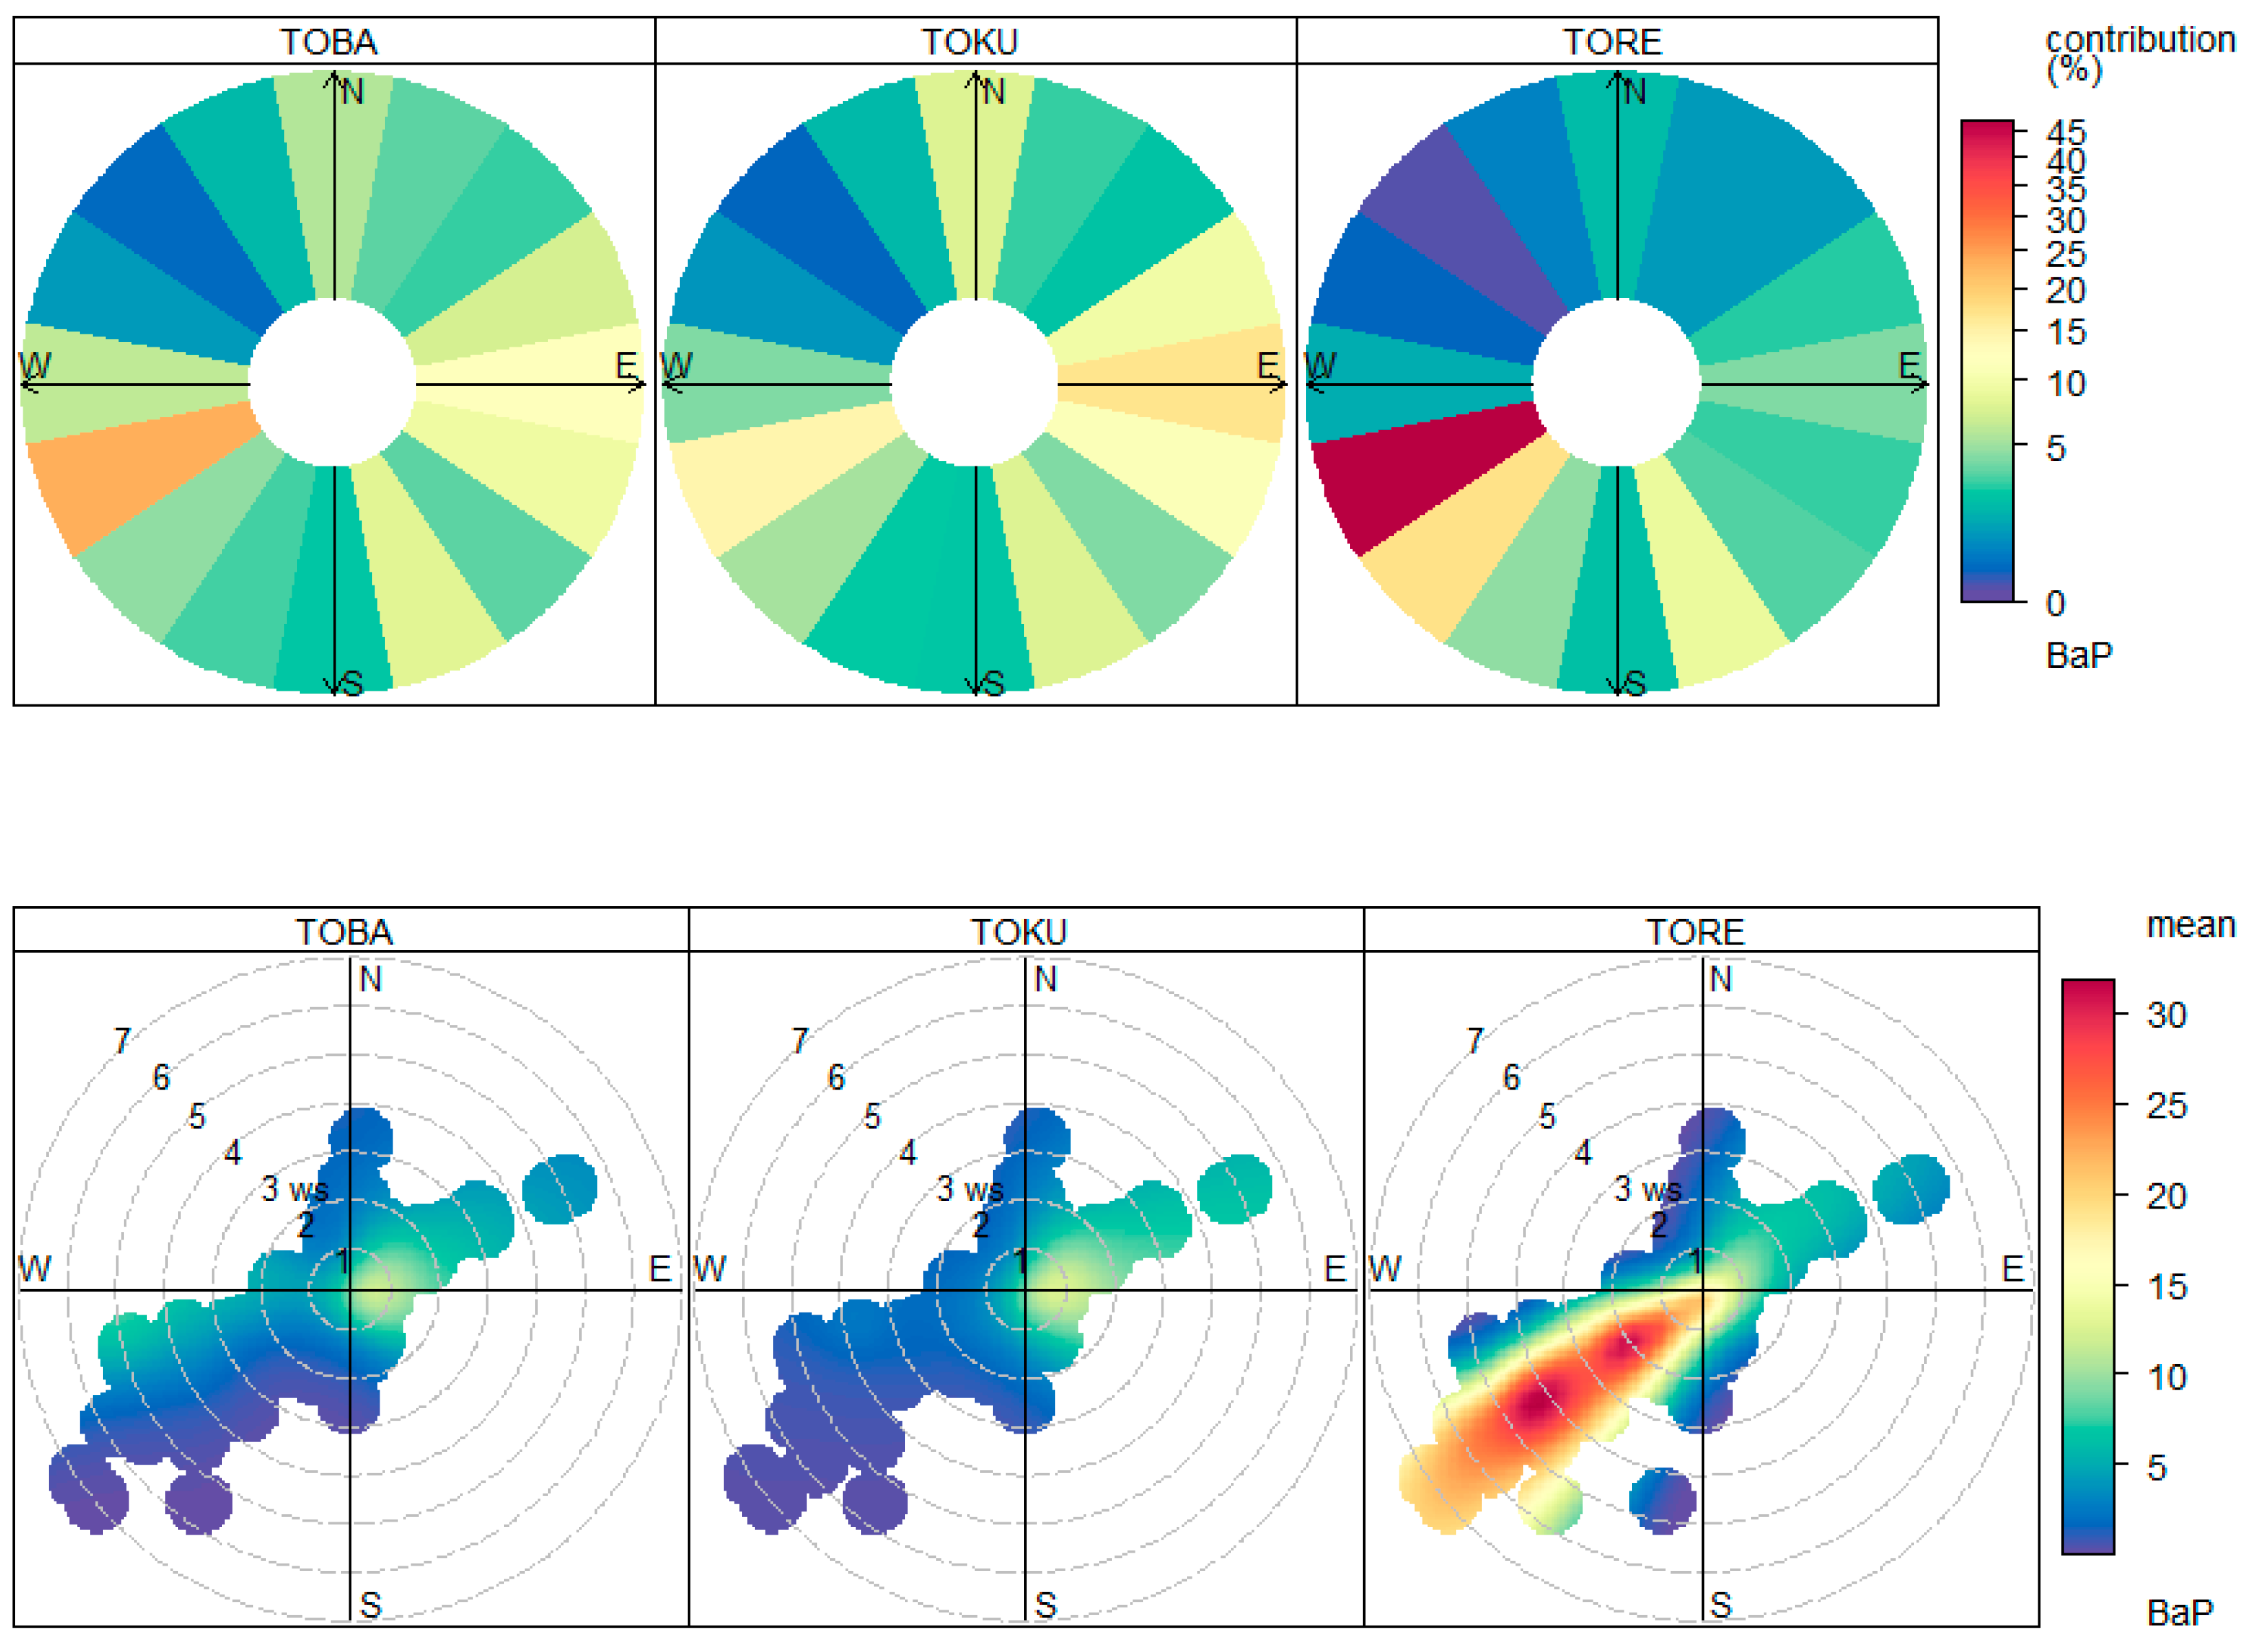
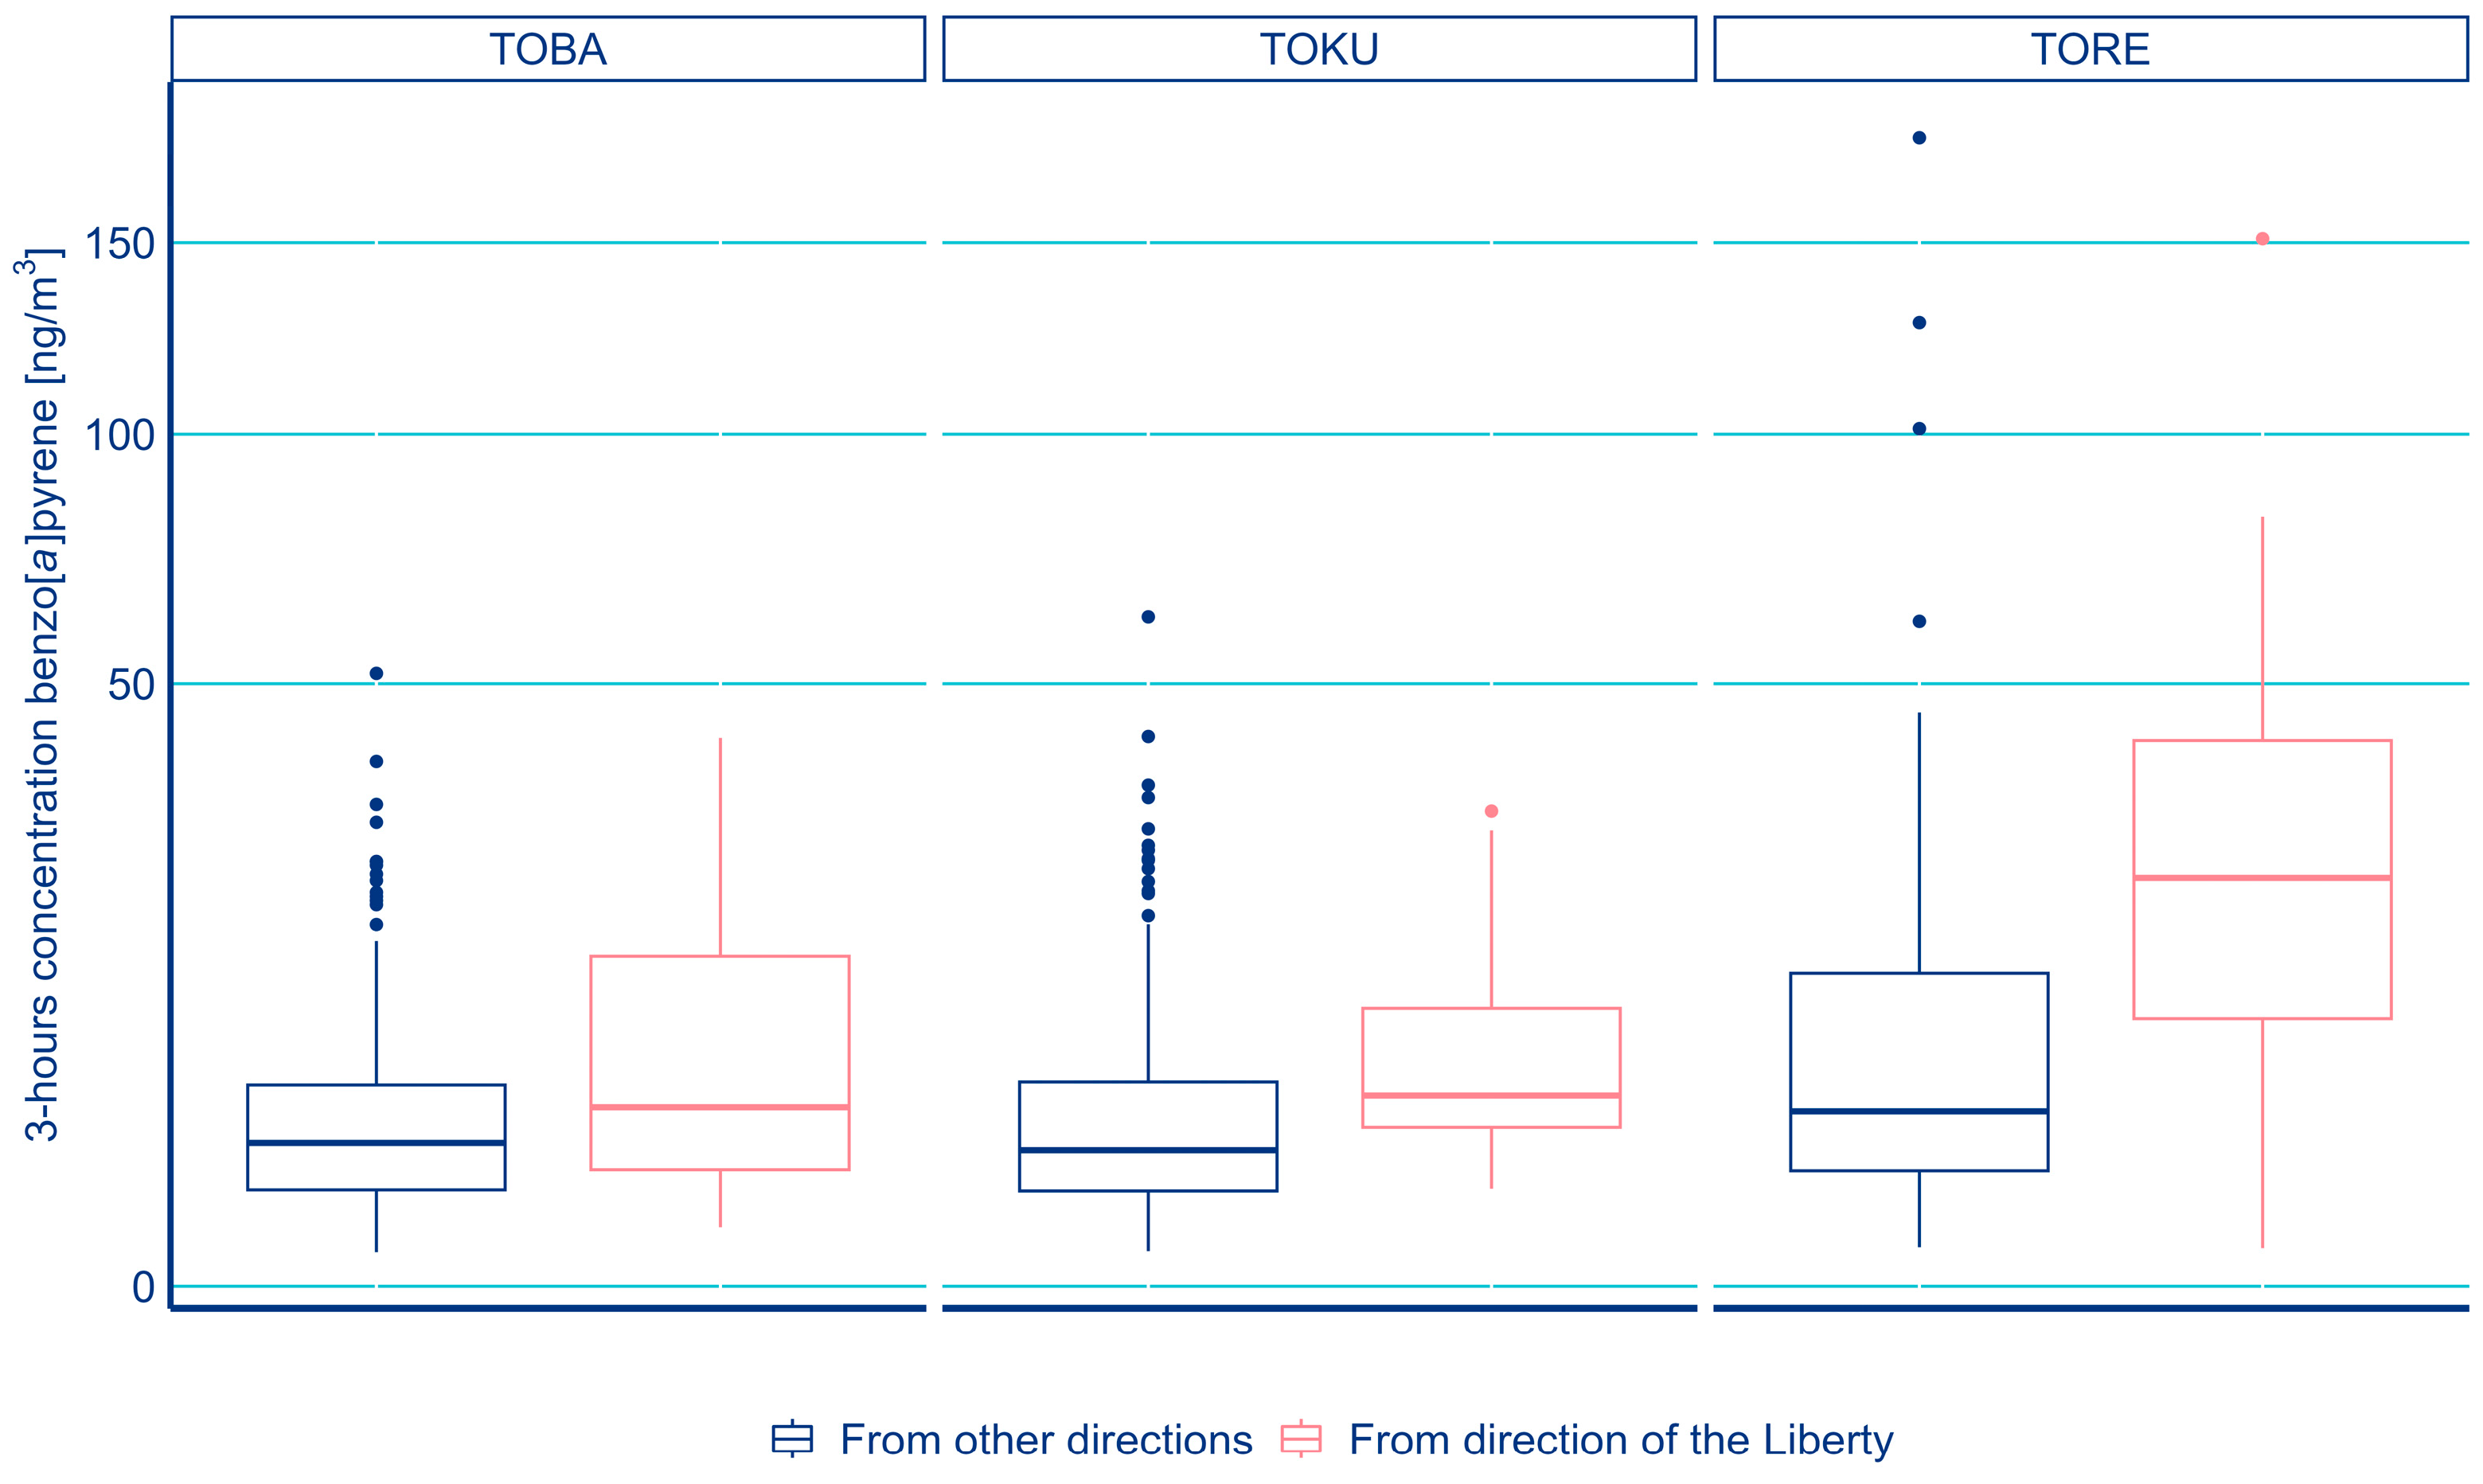
3.1. Identification of Pollution Sources Depending on Wind Direction and Wind Speed

PM10 concentrations depending on wind direction and wind speed are shown in Figure 2. The weighted concentration rose without including wind speed (Figure 2 top) presents the highest frequency of mean PM10 contributions from the southwest sector at all three stations. The concentration roses at the bottom of Figure 2 show that at the TOBA and TOKU sites, the maximum PM10 concentrations came from the eastern sector at wind speeds up to 1.5 m/s; at the TORE site, they came from the WSW to SW direction at wind speeds of 2 to 4.5 m/s.
Median and mean PM10 values are higher at all locations in the direction from the Liberty Ostrava a. s. site, but maximum 3 h PM10 concentrations also occurred in the wind direction from the area outside the Liberty Ostrava a. s. site (Figure 3, Table 2). The division into directions from and other from the area of the Liberty is described in Section 2.4. If we calculate the percentage of influence on the total PM10 concentration load in a given locality, the influence of the direction away from the Liberty Ostrava a. s. premises prevails in the TOBA and TOKU localities (88% and 93%), but in the TORE locality, the influence on the PM10 concentrations from the direction away from the Liberty Ostrava a. s. premises prevails in 57% (Table 2).
Weighted concentration roses without wind speed (Figure 4 top) for BaP and the sites TOBA and TORE show the most frequent contributions from the WSW direction, and for the TOKU site, from the E direction. However, in the case of the TOBA site, they were on mean 15 to 20% lower than in TORE. The highest mean contributions at TORE were most often achieved at wind speeds of 1–2 m/s but also up to 4 m/s (Figure 4 bottom). The maximum contributions of BaP, however, were several times lower than at the TORE site, coming mainly from the eastern sector at the TOBA and TOKU stations and clearly from the SW sector at the TORE station (Figure 4 bottom).
The statistical distribution of 3 h BaP concentrations from the direction from and other directions than from the area of the Liberty Ostrava a. s. (Figure 5) shows higher median and mean values of BaP at all locations in the wind from the Liberty Ostrava a. s. site. A higher occurrence of maximum 3 h BaP concentrations was also registered at wind directions from other directions of the Liberty Ostrava a. s. site. The highest mean concentration of BaP in the wind direction from Liberty Ostrava a. s. was at the station TORE 28.4 ng/m3 (TOBA 9.6 ng/m3; TOKU 10 ng/m3). In the TOBA and TOKU sites, the percentage contribution to the air quality load of BaP concentrations from other directions than from the area of Liberty Ostrava a. s. was significantly higher (83% and 90%). At the TORE site, the contribution to air pollution by BaP in the direction from the area of Liberty Ostrava a. s. (67%) was significantly higher (Table 3).

3.2. Identification of Pollution Sources by PMF

A stable and geochemically meaningful solution was found for 10 PMF factors. Their key characteristics are summarized below, with further details about their chemical composition and time series contributions shown in graphs in the Supplementary Material.
HEAT CC—primary particulate matter from coal-fired household heating. This factor had a high proportion of EC, OC, PAH, and chlorine in chloride form, along with bromides. EC and OC were dominated by low-temperature fractions, and among metals, As, Se, and Pb were the most abundant. The factor’s contributions to PM10 significantly fluctuated, commonly taking values of about 10 µg/m3, peaking at 40 µg/m3, with a clear decreasing trend during the measurement campaign (January to April). The factor contribution was significantly higher at night.
HEAT BB—primary particulate matter from biomass household heating. This factor had a high content of OC and anhydrosaccharides in ionic form, with significantly lower concentrations of PAHs than the factor representing heating with coal. Low-temperature fractions predominated in the carbonaceous particles, and there was a significant abundance of K in ionic form, with only Zn and Cu being significant among metals. The time series of the factor contribution was highly variable, usually taking values of about 10 µg/m3, peaking at almost 50 µg/m3. There was a clear decreasing trend in the contribution over the measurement period, and the factor contribution was significantly higher at night.
CRUSTAL—primary particles made up of mineral particles (Si, Ti, Ba, K, Mg). These were mostly particles of natural origin. The time series of the factorial contribution was characterized by a dominant short-term contribution ranging from 40 to more than 50 µg/m3 between 24 and 27 February 2021 during the episode of long-range aerosol transport from the Sahara region. For the rest of the measurement period, the model showed contributions of this factor close to 0 or at noise level, probably due to interference with other factors. The factor did not have obvious diurnal variability. The Ca contribution to the chemical profile is likely underestimated due to interference with the “IND Ca” factor commented below.
NaCl—primary particles consisting of Na in ionic form, Mg, and chloride. This factor had a less significant abundance of other elements typical for resuspension and road traffic brake and tire wear (Ba, Cu, Cr, Sb), suggesting that the main origin was from road salt and from the premises of Liberty Ostrava a. s. The time series of the contribution was moderately variable compared with other factors, with significant differences between sites, usually in the lower units of µg/m3, exceptionally over 10 µg/m3. This factor did not have pronounced diurnal variability.
IND Ca—primary particles consisting mainly of Ca and Mg accompanied by Sb, as well as V and Mn less significantly. These are particles from the industrial handling of bulk materials, mainly in the northeastern part of the Liberty Ostrava a. s. site. At the TOBA site, an indistinct contribution of the factor was associated with the bulk material landfills in the southeastern part of the premises of the company. At the TOKU location, occasional contributions of the factor occurred due to the transport of particles from the slag disposal site situated to the northeast. The time series was highly variable, with short-term peaks and extreme differences between measurement sites, with the short-term peaks in the tens of µg/m3 at the TORE site. The diurnal variability was high at the TORE site, with higher values at night and in the morning between 6 and 9 am. In contrast, no obvious daily trend was found at the other sites.
IND HM—primary particles with complex polymetallic composition (Mn, Fe, Cu, Zn, Pb, As, and less significantly, Cr, V, Sb, Ca, and Cl). A composition dominated by Mn and Fe is typical of iron and steel production particles. The concentration contribution varied substantially from site to site. It was relatively significant at the TORE site, while at other measurement sites, it was close to 0. The time series of the factor contribution to PM10 concentration was extremely variable, with short-term peaks in the tens of µg/m3 at the TORE site. Its diurnal variability was strong with no apparent daily trend.
IND PAHs—primary particles dominated by polycyclic aromatic hydrocarbons and iron, with carbonaceous particles consisting almost exclusively of the carbon fractions EC3 and especially EC4. This factor contribution was relatively high and with a strong variable time series at the TORE, in contrast to low values at the other sites. The high contribution of iron in the factor profile is due to interference with the IND HM factor, suggesting an origin in the same geographic area. Iron is also the carrier of the mass contribution of this factor to PM10, which took values up to the first tens of µg/m3 at the TORE site. The factor contribution had no apparent daily trend.
TRA—primary carbon particles from road transport. Elemental carbon prevailed over organic carbon in the factor profile, especially the high-temperature fraction EC3. A group of metals typical of abrasion and resuspension from road traffic (Cr, Cu, Ba, Ca, Ti, V, Mn, Fe, Sb) was abundant in it. In the context of the other factors, the contribution to PM10 was moderately variable, with a weak increasing trend from winter to spring. The highest values were reached at the TOKU site, and the lowest ones were at the TOBA site. They usually varied in units of µg/m3, rarely going above 10 µg/m3. The diurnal variability of the contribution was not clearly pronounced, with slightly higher values in the daytime.
SIA—secondary particles of a predominantly inorganic origin, consisting mainly of sulfate and ammonium nitrate. This factor profile showed a significant content of Se, while Pb was also present but less apparent. The factor contribution time series exhibited low variability, no diurnal trend, and a decreasing trend during the campaign. The factor represents a predominantly winter type of secondary aerosol with a complex origin, primarily induced by household heating, but also to a lesser extent by automobile traffic and industrial emissions. Factor contributions typically varied up to 10 µg/m3, with occasional elevations in the tens of µg/m3, rising to over 80 µg/m3 during the episode of poor air quality between 9 and 11 February 2021.
C-Na-NO3—a factor with unclear interpretation, consisting mainly of a mixture of high-temperature organic carbon particles, salt, and nitrates. This factor’s mass is likely dominated by secondary organic aerosol and sodium nitrate. The contribution of the factor to PM10 concentrations varied in a similar range at all sites, typically from 0 to 10 µg/m3, with slightly higher values in the daytime, especially in the early afternoon. The time series of the factor contribution and small differences between sites suggest a regional origin. The most probable interpretation of this factor is that it is a wintertime secondary aerosol induced, at least in part, by photochemical processes from nitrogen oxides and carbonaceous particulate emissions originating predominantly from household heating and road traffic. The presence of Na with nitrates indicates particles of altered salt, possibly originating from both long-range transport from sea areas and city road maintenance (winter road salting and subsequent spreading of the liquid salt aerosol into the air by cars). Especially in humid winter conditions, NaCl particles could be readily transformed into nitrate form through nitric acid [36], originating from nitrogen oxides emitted by city traffic.

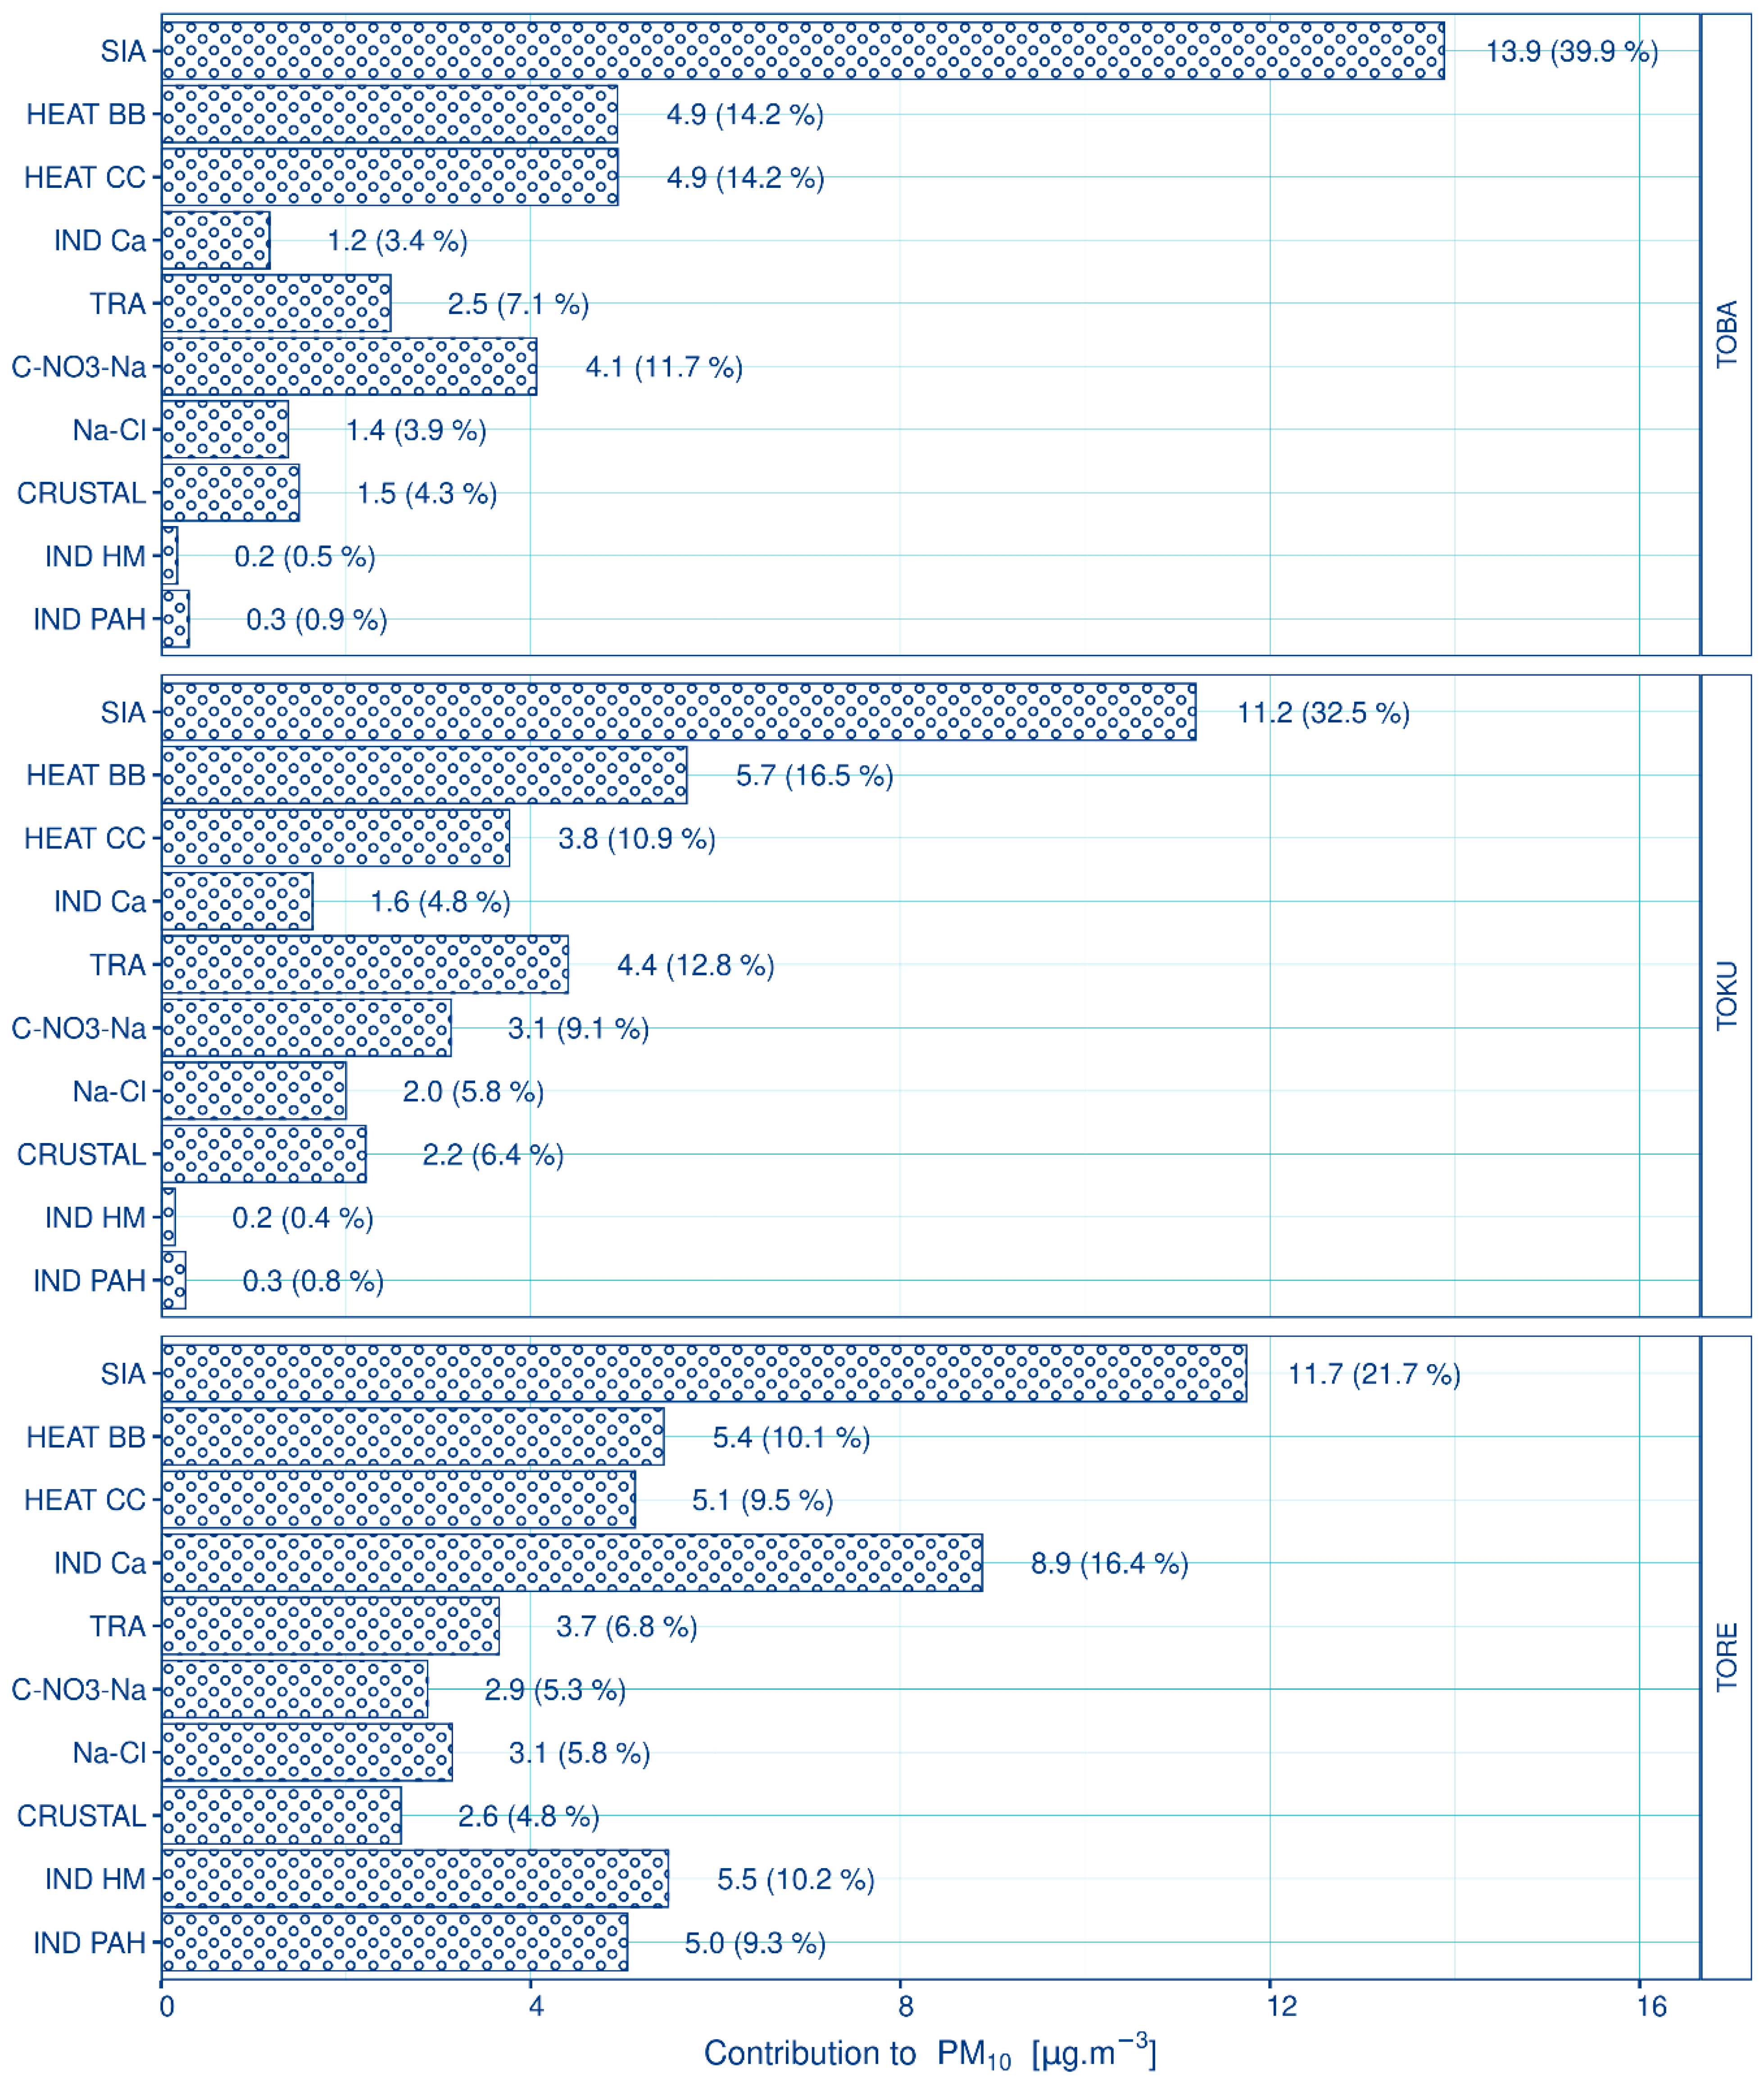
3.2.1. Model Contributions to PM10

Model factor contributions were quantified separately for each monitoring site. The Constrained model contributions are shown in Figure 6. There was only a minor difference between the Constrained and Fpeak Run (please compare Constrained model contributions with Figure S3 in the Supplementary Material). The most different was the contribution of the secondary inorganic aerosol (SIA) factor, which was 4 to 6% higher in the Constrained Run.
SIA factor, which consisted mainly of ammonium sulfate and ammonium nitrate, contributed to PM10 mass concentration from 20 to 40%, with negligible differences among monitoring sites. Maximum contributions occurred on winter days of bad dispersion conditions (Figure S5 in the Supplementary Material). This suggests a prevailing regional or long-range transport origin for this pollution type. The higher levels of PM10 concentrations in the Polish part of Silesia (located approximately 20 km southeast of the survey area) compared with the study area [42,43,44,45], along with the use of similar traditional methods of household heating (predominantly individual coal-fired boilers), should be taken into account. The significant secondary aerosol formation in nearby Poland and its subsequential atmospheric transport could contribute to the SIA concentration in the study area, especially during occasional winter northeasterly wind direction situations. Previous studies [39] have already indicated significant transboundary transport of polluted air from the Silesian Voivodeship in Poland to the Ostrava city area. The highest contributions of the SIA factor occurred on 1 February and between 9 and 11 February during weak wind flow from the north quadrant, taking into account the uncertainties of wind direction measurement discussed above. Additionally, the polar plot of the SIA factor (Figure S8 in the Supplementary Material) shows high PM10 contributions from east and northeast directions during low and moderate wind speeds, indicating a probable local and regional SIA origin. Low contributions probably come from sources in Ostrava city and its outskirts, while high contributions during moderate wind speed suggest longer transport than local origin, and together with wind direction, they suggest a spread from the Polish border area. The contribution of Poland to the SIA factor thus appears to be significant, but quantification is not possible.
The second and third most significant factors were coal (HEAT CC) and biomass (HEAT BB) household heating, with individual contributions of approximately 10 to 15%, and a combined contribution of approximately 20 to 30%. The polar plots (Figures S9 and S10 in the Supplementary Material) show high contributions of these factors when wind speed was low. At the TOBA and TORE sites, contributions peaked during east and northeast wind flow, whereas at the TOKU site, the direction was ambiguous, with slightly higher contributions from the northwest. Differences among monitoring sites and the high contributions during low wind speed suggest a local pollution origin.
Regarding the factors mentioned above, PM10 contributions at the TORE site were significantly different compared with the other sites. Although the absolute contribution of heating to PM10 was similar to the other two sites (around 5 µg/m3); relatively, it was the lowest (around 10% for both coal and biomass heating). This is due to the significant contribution of industrial mineral dust (“IND Ca” factor), which contributed about 9 µg/m3 here (around 15% of total PM10 concentration).
After secondary inorganic aerosol, household heating, and industrial mineral dust, the next most important factor was primary particles from the road traffic (“TRA” factor), with a contribution ranging from about 7% (TOBA and TORE) to 13% (TOKU). These contributions represent only primary particles (brake, tire, and road surface wear and exhaust emissions), but road traffic nitrogen oxide emissions play a significant role in secondary inorganic aerosol formation [46,47,48]. Traffic emissions also make up a part of winter secondary organic aerosol C-Na-NO3, discussed in the following paragraph. Moreover, road resuspension can interfere with the CRUSTAL factor because of similar elemental composition (the predominant elements found in road dust, including Si, Al, Fe, Ca, Mg, and others [49,50], are also the most abundant in the earth’s crust). All together, traffic contribution can be estimated as one-fifth to one-quarter of the PM10 concentration.
The winter secondary organic aerosol (C-Na-NO3 factor) made up 3 to 4 µg/m3 PM10 (about 5% at the TORE, about 12% at the other sites). Despite the challenging interpretation, it was a very stable factor in all tested model runs with a number of factors from 5 to 11. The stability of the C-Na-NO3 factor and its correlation with temperature and wind directions of the highest factor contributions indicate a connection with traffic emissions from the frequent highway nearby (Figure S13 in the Supplementary Material).
The primary particles consisting of sodium chloride and mineral particles varied negligibly among the sites. They individually reached about 3 to 6% of PM10. The factor was labeled “NaCl” based on the dominant components in the factor profile. The Na and Cl contribution to the factor mass was several times higher than that of other species, clearly indicating the dominance of salt particles. Regarding the relative species contribution to PM10, the levels of accompanying species were negligible. As shown by polar plots in Figure S14 in the Supplementary Material, there were significant differences in NaCl contribution among the sites, making its long-range transport unlikely. NaCl aerosol mass predominantly came from anthropogenic sources. At the TORE site, it was especially the sinter and coking plant. At the other two sites, the main sources were household coal-fired boilers and road salt resuspension.
A specific episode of Sahara dust transport with high PM10 concentrations occurred during the sampling period (see 24–26 February in Figure S15 in the Supplementary Material). The determined contribution of the CRUSTAL factor thus probably does not correspond to the normal winter situation in the area.
Industrial particles with heavy metals and PAHs (“IND HM” and “IND PAH” factors) were a minor component of PM10. Industrial emissions accounted for a significant portion of PM10 mass only at the TORE site (about 10% in total). Less than one percent of PM10 was attributed to these factors at the other sites. Polar plots in Figures S16 and S17 in the Supplementary Material clearly indicate that the origin of all three industrial factors can be attributed to the Liberty Ostrava a. s.
The time series of absolute PM10 concentrations, absolute contributions of concentrations, and relative species concentrations of identified air pollution factors are shown in Figures S3–S7 in the Supplementary Material. Polar plots for all factors are shown in Figures S8–S17 in the Supplementary Material.

3.2.2. Model Contributions to Benzo[a]pyrene

The contributions of the PMF-constrained model factors to the concentration of BaP during the measurement campaign are documented in Figure 7. The difference between the Constrained and Fpeak Run contributions is negligible (please compare Figure 7 with Figure S4 in the Supplementary Material).
The source apportionment results at the TOBA and TOKU sites were dramatically different compared with the TORE site. At TOBA and TOKU, the dominant source of BaP was household heating, with coal heating contributing approximately 4 ng/m3 (TOKU) and 5 ng/m3 (TOBA) during the measurement period. Biomass heating contributed only tenths of ng/m3 (lower units of %). In total, biomass and coal household heating made up approximately 90% of BaP concentration at these measurement sites. The industrial emissions of BaP accounted for about 0.5 ng/m3 (about 10%) at the TOBA and TOKU measurement sites. The contribution of biomass household heating may seem surprisingly low according to the model, which could be due to the prevalence of coal in the household heating fuel mix in the region. At the TORE site, industrial sources made the highest contribution to BaP concentration. The mean contribution of industrial sources to the concentration of BaP was 9.5 ng/m3 at TORE (about two-thirds in relative terms). The remaining contribution to the BaP pollution was attributed predominantly to household heating at TORE. At all three sites, transport and other pollution sources played only a minor role in BaP concentration, contributing less than 1%.
The BaP concentration and the population exposure rapidly decreased with distance from the TORE site. The source apportionment results provided for the TORE site are applicable to the area with a radius of roughly 500 m to a maximum of 1 km around this site.
The apportionment of benzo[a]pyrene was a challenging task because PAH emissions were produced by various sources, whereas their time series and spectra did not show significant differences among the sources. The model’s ability to apportion benzo[a]pyrene mass depended on its time coincidence with both organic and inorganic tracers. It was crucial to distinguish between residential heating and coke production, as these two groups of sources were expected to be the most significant factors influencing ambient air benzo[a]pyrene concentrations. For coal-burning residential boilers, typical inorganic species included As, Se, and Cl, along with PAHs and both elemental and organic carbon, especially in their low-temperature thermal fractions. Residential biomass burning was distinguished by the presence of anhydrosugars, PAHs, and carbonaceous particles, together with potassium (both ionic and elemental) and a higher zinc fraction compared with other metals. The distinguishing of the emissions from coke production was based on the fact that the coking plant operated concurrently with an iron and steel mill in the same industrial area at the same time. The emissions from coke production were thus present in all samples, alongside tracers typical of iron and steel production, especially iron, manganese, and calcium. These elements are emitted in large quantities by iron and steel production plants compared with all other sources in the area of interest. Some authors have pointed out that the combined influence of organic species can be overshadowed by the influence of elemental species, despite the significance of organic tracers for source apportionment [51,52,53]. This is usually true because the strength of species in PMF is derived from average relative uncertainties, which are typically lower for elements than for organics. This issue could affect the model’s ability to distinguish sources whose emissions consist of species with high measurement uncertainties. Since all the chemical profiles of the identified sources in the presented study include both organic and inorganic tracers, we consider the potential impact of the mentioned issue on presented results as negligible. In contrast to the conclusions in the aforementioned study [51], the approach of combining organic and inorganic tracers in PMF datasets is common worldwide and usually allows for more detailed results [52,53,54].

3.3. Comparison of Methods

The above conclusions are based on two independent evaluations. The assessment of air pollution depending on meteorological conditions and the PMF receptor model in all its parameters are valid only for the locations where the measurements were made. However, the synthesis of information from these three sites allows an interpretation that is valid for the eastern part of Ostrava and adjacent municipalities (Vratimov, Slezská Ostrava, Rychvald, Horní Suchá, and Havířov). The sampling campaign took place during the cold period, when meteorological conditions, especially wind direction and speed, did not differ significantly from the long-term mean over the corresponding part of the year. Wind speed and direction measurements were compared with the long-term mean of the climatological station in Ostrava–Poruba, which is representative of the territory of the city of Ostrava. Based on the described meteorological accordance, the identified causes of pollution can be considered to be valid for the winter and transitional period (heating season) on a medium-term timescale (several years).
According to the assessment of pollutant concentrations as a function of wind direction and wind speed, slightly more than half of the PM10 pollution at the TORE site originated from the direction of the Liberty Ostrava a. s. site, while in the other two sites assessed, approximately one-tenth of the pollution originated from the direction of this site.
The PMF model identified a contribution of the Liberty Ostrava a. s. metallurgical plant to the PM10 concentration in Ostrava–Radvanice of about 1/3 of the total concentration. In the other two sites (Ostrava–Bartovice and Ostrava–Kunčičky), the total contribution of sources related to the operation of Liberty Ostrava a. s. to the PM10 concentration represents about 5% of the concentration. When comparing the results obtained by these two methods, it must be taken into account that, when wind direction comes from the direction of the Liberty Ostrava a. s. site, the air contains not only pollution from emissions from the steelworks site but also background pollution originating from the areas in front of the site (on its windward side). It is therefore logical that the contribution from metallurgical sources calculated by the PMF model is lower than the estimation based on the wind direction and wind speed assessment.
A smaller deviation in the results of the two methods was found for BaP because the spectrum of its sources is very limited compared with PM10. According to the assessment of BaP concentrations depending on wind direction and wind speed, in Ostrava–Radvanice, the contribution of BaP from the direction of the Liberty Ostrava a. s. site was about two-thirds of the total concentration, whereas in the other two sites, the contribution from this metallurgical site was only one-tenth to one-fifth of the pollution. Similarly, the PMF model attributed nearly two-thirds of the total BaP to the metallurgical sources. This is only slightly lower (units of percent) than in the case of the wind direction and wind speed assessment. In the Ostrava–Kunčičky and Ostrava–Bartovice sites, the PMF model attributed about one-tenth of the BaP concentration to the metallurgical sources, which is similar to the wind direction and wind speed assessment results.
The agreement between the results of the two methods used is clear and guarantees the reliability of the main conclusions drawn concerning the effect of metallurgical and other sources, especially in the case of BaP.

4. Conclusions

Within the framework of the ARAMIS project and the KAPOOO project, the identification of air pollution sources was carried out on the basis of the winter-intensive part of the measurement campaign in three locations in the eastern part of Ostrava in the Czech Republic. The intention was to identify the main causes of air pollution by PM10 and BaP in this area. The evaluation was based on a statistical assessment of measured pollutant concentrations as a function of wind direction and wind speed and a receptor model of PMF. A significant methodological contribution to the causes of high air pollution in this area was the use of the 3 h PM10 aerosol sampling period.
Overall, household heating and road traffic were identified as the main contributors to PM10 in the study area, while other factors were less significant. The only area where industrial primary particle sources made a higher contribution than household heating and road traffic was the part of the Radvanice district near the TORE site. With this exception, the highest portion of the PM10 mass was made up of secondary inorganic aerosols, specifically ammonium sulfate and ammonium nitrate. The precursors of these aerosols came mainly from individual household heating emissions.
Near the TORE site in the Radvanice district, relatively high BaP concentrations were proved. Due to the high pollution level gradient in the area, values measured at the TORE site are relevant for a limited population and should not be used directly for the health impact assessment in the study area. The BaP yearly mean concentration in the Radvanice district and an estimation of the affected population size should be based on all-year air quality monitoring. In general, while the metallurgical plant Liberty Ostrava a. s. was the primary source of BaP pollution in the part of the Radvanice district near the TORE site, the effect of household heating was prevalent in all other districts of Ostrava.
A comparison of these and previous results reveals significant differences in the causes of air pollution between submicron and larger particles, as well as between mass and particle number contributions in the study area. Although a previous study [35] identified industrial and traffic aerosols as predominant in the submicron range, the presented research highlights that local household heating and regional secondary aerosols induced by a complex mix of sources (including local household heating, industrial, and traffic sources) are the main sources of PM10 concentrations. Because the secondary aerosols, which constitute the predominant component of PM10 mass, belong to the PM2.5 fraction, a similar conclusion is likely to be valid for the causes of PM2.5 air pollution. Since the PM10 and PM2.5 levels in the air, unlike PM1, are legislatively regulated, the presented results clearly imply current regional air protection priorities. Reducing household emissions is essential, since they have a significant impact on both primary and secondary particle concentrations. The replacement of old household heating systems, especially those burning coal, with low-emission alternatives is necessary. Reducing traffic and industrial emissions in line with European air protection strategies are secondary measures that are also crucial.

Supplementary Materials

The following supporting information can be downloaded at https://www.mdpi.com/article/10.3390/atmos15020177/s1, Figure S1: PMF source apportionment of PM10 based on Fpeak Run, Figure S2: PMF source apportionment of benzo(a)pyrene based on Fpeak Run, Figure S3: Time series of absolute PM10 concentrations, Figure S4: Absolute contributions of concentrations of identified air pollution factors, Figure S5: Relative species concentration of identified air pollution factors, Figure S6: Polar plots, SIA factor (concentration units in polarPlots are µg/m3, wind speed units are m/s), Figure S7: Polar plots, HEAT BB factor (concentration units in polarPlots are µg/m3, wind speed units are m/s), Figure S8: Polar plots, HEAT CC factor (concentration units in polarPlots are µg/m3, wind speed units are m/s), Figure S9: Polar plots, IND Ca factor (concentration units in polarPlots are µg/m3, wind speed units are m/s), Figure S10: Polar plots, TRA factor (concentration units in polarPlots are µg/m3, wind speed units are m/s), Figure S11: Polar plots, C-NO3-Na factor (concentration units in polarPlots are µg/m3, wind speed units are m/s), Figure S12: Polar plots, Na-Cl factor (concentration units in polarPlots are µg/m3, wind speed units are m/s), Figure S12: Polar plots, CRUSTAL factor (concentration units in polarPlots are µg/m3, wind speed units are m/s), Figure S13: Polar plots, CRUSTAL factor (concentration units in polarPlots are µg/m3, wind speed units are m/s), Figure S14: Polar plots, IND HM factor (concentration units in polarPlots are µg/m3, wind speed units are m/s), Figure S15: Polar plots, IND PAH factor (concentration units in polarPlots are µg/m3, wind speed units are m/s), Table S1: ED XRF limits of quantification (ng/m3), Table S2: Minimum, maximum, median and mean concentrations in PM10 and mean relative uncertainties. Min: minimum; Max: maximum; Med: median; Avg: mean; NA: no data available, LVG: levoglucosan, MAN: mannosan; GAL: galactosan. All units in ng/m3, except the PM10 (µg/m3), and relative uncertainty (unitless).

Author Contributions

Conceptualization, R.S. and V.V.; methodology, R.S.; validation, V.V., R.S. and D.H.; formal analysis, V.V.; investigation, R.S.; resources, V.V.; data curation, D.H., R.S. and V.V.; writing—original draft preparation, R.S.; writing—review and editing, V.V.; visualization, D.H.; supervision, B.K.; project administration, B.K.; funding acquisition, R.S. and B.K. All authors have read and agreed to the published version of the manuscript.

Funding

The APC was funded by Czech Hydrometeorological Institute.

Institutional Review Board Statement

Not applicable.

Informed Consent Statement

Not applicable.

Data Availability Statement

The original contributions presented in the study are included in the article and supplementary materials, further inquiries can be directed to the corresponding authors.

Acknowledgments

The data for the analysis were provided by the Czech Hydrometeorological Institute. The assessment is based on measurements at the sites run by the Czech Hydrometeorological Institute. The measurements, analyses, and evaluation were carried out in cooperation with the project ARAMIS (Air quality Research, Assessment and Monitoring Integrated System) and project KAPOOO (Regional Action Plan for Air Protection) and were supported by the Regional Authority of the Moravian–Silesian Region in the Czech Republic.

Conflicts of Interest

The authors declare no conflicts of interest.

References

  1. Sokhi, R.; Kitwiroon, N. Air pollution in urban areas. In World Atlas of Atmospheric Pollution; Molina, M., Sokhi, R., Eds.; Anthem Press: London, UK, 2008; pp. 19–34. [Google Scholar] [CrossRef]
  2. Hime, N.J.; Marks, G.B.; Cowie, C.T. A Comparison of the Health Effects of Ambient Particulate Matter Air Pollution from Five Emission Sources. Int. J. Environ. Res. Public Health 2018, 15, 1206. [Google Scholar] [CrossRef]
  3. IARC. IARC Monographs on the Evaluation of Carcinogenic Risks to Humans: "Outdoor Air Pollution", Vol. 109. A Review of Human Carcinogens. Lyon, France, 2016. Available online: https://monographs.iarc.fr/wp-content/uploads/2018/06/mono109.pdf (accessed on 1 December 2023).
  4. Koolen, C.D.; Rothenberg, G. Air Pollution in Europe. ChemSusChem 2019, 12, 164–172. [Google Scholar] [CrossRef]
  5. WHO. Health Effects of Particulate Matter, 2nd ed.; Policy Implications for Countries in Eastern Europe, Caucasus and Central Asia; WHO Regional Office for Europe: Copenhagen, Denmark, 2013; ISBN 978-92-890-0001-7. [Google Scholar]
  6. WHO. Ambient (Outdoor) Air Pollution. Available online: https://www.who.int/en/news-room/fact-sheets/detail/ambient-(outdoor)-air-quality-and-health (accessed on 2 February 2020).
  7. Kaleta, D.; Kozielska, B. Spatial and Temporal Volatility of PM2.5, PM10 and PM10-Bound B[a]P Concentrations and Assessment of the Exposure of the Population of Silesia in 2018–2021. Int. J. Environ. Res. Public Health 2023, 20, 138. [Google Scholar] [CrossRef]
  8. Hůnová, I. Ambient Air Quality in the Czech Republic: Past and Present. Atmosphere 2020, 11, 214, Erratum in Atmosphere 2021, 12, 720. [Google Scholar] [CrossRef]
  9. CHMI. Air Pollution in the Czech Republic in 2020; Graphical Yearbook (Czech/English); Czech Hydrometeorological Institute: Prague, Czech Republic, 2021. Available online: www.chmi.cz/files/portal/docs/uoco/isko/grafroc/grafroc_CZ.html (accessed on 30 January 2023). Graphical Yearbook (Czech/English).
  10. Horák, J.; Kuboňová, L.; Krpec, K.; Hopan, F.; Kubesa, P.; Motyka, O.; Laciok, V.; Dej, M.; Ochodek, T.; Plachá, D. PAH emissions from old and new types of domestic hot water boilers. Environ. Pollut. 2017, 225, 31–39. [Google Scholar] [CrossRef] [PubMed]
  11. Hůnová, I.; Kurfürst, P.; Vlasáková, L.; Schreiberová, M.; Škáchová, H. Atmospheric Deposition of Benzo[a]pyrene: Developing a Spatial Pattern at a National Scale. Atmosphere 2022, 13, 712. [Google Scholar] [CrossRef]
  12. Křůmal, K.; Mikuška, P.; Horák, J.; Hopan, F.; Krpec, K. Comparison of emissions of gaseous and particulate pollutants from the combustion of biomass and coal in modern and old-type boilers used for residential heating in the Czech Republic, Central Europe. Chemosphere 2019, 229, 51–59. [Google Scholar] [CrossRef] [PubMed]
  13. Schreiberová, M.; Vlasáková, L.; Vlček, O.; Šmejdířová, J.; Horálek, J.; Bieser, J. Benzo[a]pyrene in the Ambient Air in the Czech Republic: Emission Sources, Current and Long-Term Monitoring Analysis and Human Exposure. Atmosphere 2020, 11, 955. [Google Scholar] [CrossRef]
  14. Volná, V.; Hladký, D.; Seibert, R.; Krejčí, B. Transboundary Air Pollution Transport of PM10 and Benzo[a]pyrene in the Czech–Polish Border Region. Atmosphere 2022, 13, 341. [Google Scholar] [CrossRef]
  15. ČR. Zákon č. 201/2012 Sb. ze dne 2. května 2012 o ochraně ovzduší (Act No. 201/2012 Coll. of 2 May 2012 on air protection); Praha, 2012. pp. 2785–2848. Available online: https://www.mzp.cz/www/platnalegislativa.nsf/%24%24OpenDominoDocument.xsp?documentId=9F4906381B38F7F6C1257A94002EC4A0&action=openDocument (accessed on 20 July 2023). (In Czech).
  16. EC. Directive 2004/107/EC of the European Parliament and of the Council of 15 December 2004 Relating to Arsenic, Cadmium, Mercury, Nickel and Polycyclic Aromatic Hydrocarbons in Ambient Air; EC: Brussel, Belgium, 2005. [Google Scholar]
  17. EC. The Clean Air Policy Package. 2013. Available online: https://ec.europa.eu/environment/air/clean_air/index.htm (accessed on 30 January 2023).
  18. Černikovský, L.; Novák, J.; Plachá, H.; Krejčí, B.; Nikolová, I.; Chalupníčková, E.; Conner, T.; Norris, G.; Kovalcik, K.; Olson, D.; et al. The Impact of Select Pollutant Sources on Air Quality for Ostrava and the Moravian-Silesian Metropolitan Region by the Positive Matrix Factorization model. In EAC 2013, PRAGUE Handbook; Czech Aerosol Society (CAS): Prague, Czech Republic; European Aerosol Assembly (EAA): Prague, Czech Republic, 2013. [Google Scholar]
  19. Kozaková, J.; Pokorná, P.; Vodička, P.; Ondráčková, L.; Ondráček, J.; Křůmal, K.; Mikuška, P.; Hovorka, J.; Moravec, P.; Schwarc, J. The influence of local emissions and regional air pollution transport on a European 837 air pollution hot spot. Environ. Sci. Pollut. Res. 2019, 26, 1675–1692. [Google Scholar] [CrossRef]
  20. MŽP. Ministry of the Environment of the Czech Republic: Air Quality Improvement Program of Aglomeration Ostrava/Karviná/Frýdek-Místek—CZ08A; Ministry of the Environment of the Czech Republic: Praha, Czech Republic, 2021. (In Czech) [Google Scholar]
  21. MŽP. Sdělení Odboru Ochrany Ovzduší, Kterým se Stanoví Seznam Stanic Zahrnutých do Státní Sítě Imisního Monitoring (Communication from the Air Protection Department, Which Establishes a List of Stations Included in the national Air Pollution Monitoring Network). Available online: http://portal.chmi.cz/files/portal/docs/uoco/oez/emise/evidence/aktual/Vestnik_2016_1.pdf (accessed on 22 March 2020). (In Czech).
  22. MŽP. Ministry of the Environment of the Czech Republic: Air Quality Improvement Program of Aglomeration Ostrava/Karviná/Frýdek-Místek—CZ08A; Ministry of the Environment of the Czech Republic: Praha, Czech Republic, 2016. (In Czech) [Google Scholar]
  23. Norris, G.; Duvall, R.; Brown, S.; Bai, S. Positive Matrix Factorization (PMF), Fundamentals and User Guide; U.S. EPA: Washington, DC, USA, 2014. Available online: https://www.epa.gov/sites/production/files/2015-02/documents/pmf_5.0_user_guide.pdf (accessed on 30 January 2023).
  24. Belis, C.A.; Pernigotti, D.; Pirovano, G.; Favez, O.; Jaffrezo, J.L.; Kuenen, J.; Denier Van Der Gon, H.; Reizer, M.; Riffault, V.; Alleman, L.Y.; et al. Evaluation of receptor and chemical transport models for PM10 source 879 apportionment. Atmos. Environ. 2020, X5, 100053. [Google Scholar]
  25. EC. Council Decision 97/101/EC of 27 January 1997 establishing a reciprocal exchange of information and data from networks and individual stations measuring ambient air pollution within the Member States. Official Journal of the European Communities, 1997. No. L 35/14. EC. Available online: https://eur-lex.europa.eu/LexUriServ/LexUriServ.do?uri=CONSLEG:1997D0101:20080611:EN:PDF (accessed on 30 January 2023).
  26. Larssen, S.; Sluyter, R.; Helmis, C. 1999 Criteria for Euroairnet. The EEA Air Quality Monitoring and Information Network. Technical Report no. 12. EEA, Copenhagen. Available online: https://www.eea.europa.eu/publications/TEC12F (accessed on 15 February 2023).
  27. Cavalli, F.; Alastuey, A.; Areskoug, H.; Ceburnis, D.; Čech, J.; Genberg, J.; Harrison, R.M.; Jaffrezo, J.L.; Kiss, G.; Laj, P.; et al. A European aerosol phenomenology-4: Harmonized concentrations of carbonaceous aerosol at 10 regional background sites across Europe. Atmos. Environ. 2016, 144, 133–145. [Google Scholar] [CrossRef]
  28. Giannoni, M.; Calzolai, G.; Chiari, M.; Cincinelli, A.; Lucarelli, F.; Martellini, T.; Nava, S. A comparison between thermal-optical transmittance elemental carbon measured by different protocols in PM2.5 samples. Sci. Total Environ. 2016, 571, 195–205. [Google Scholar] [CrossRef] [PubMed]
  29. Cavalli, F.; Viana, M.; Yttri, K.E.; Genberg, J.; Putaud, J.-P. Toward a standardised thermal-optical protocol for measuring atmospheric organic and elemental carbon: The EUSAAR protocol. Atmos. Meas. Tech. 2010, 3, 79–89. [Google Scholar] [CrossRef]
  30. Iinuma, Y.; Engling, G.; Puxbaum, H.; Herrmann, H. A highly resolved anion-exchange chromatographic method for determination of saccharidic tracers for biomass combustion and primary bio-particles in atmospheric aerosol. Atmos. Environ. 2009, 43, 1367–1371. [Google Scholar] [CrossRef]
  31. Chiari, M.; Yubero, E.; Calzolai, G.; Lucarelli, F.; Crespo, J.; Galindo, N.; Nicolás, J.F.; Giannoni, M.; Nava, S. Comparison of PIXE and XRF analysis of airborne particulate matter samples collected on Teflon and quartz fibre filters. Nucl. Instrum. Methods Phys. Res. Sect. B Beam Interact. Mater. At. 2018, 417, 128–132. [Google Scholar] [CrossRef]
  32. WAQI. World Air Quality Index. Available online: https://waqi.info (accessed on 20 February 2023).
  33. Černikovský, L.; Krejčí, B.; Blažek, Z.; Volná, V. Transboundary Air-Pollution Transport in the Czech-Polish Border Region between the Cities of Ostrava and Katowice. Cent. Eur. J. Public Health 2016, 24, S45–S50. [Google Scholar] [CrossRef]
  34. Volná, V.; Hladký, D. Detailed Assessment of the Effects of Meteorological Conditions on PM10 Concentrations in the Northeastern Part of the Czech Republic. Atmosphere 2020, 11, 497. Available online: https://www.mdpi.com/2073-4433/11/5/497 (accessed on 29 January 2023). [CrossRef]
  35. Leoni, C.; Pokorná, P.; Hovorka, J.; Masiol, M.; Topinka, J.; Zhao, Y.; Křůmal, K.; Cliff, S.; Mikuška, P.; Hopke, P.K. Source apportionment of aerosol particles at a European air pollution hot spot using particle number size distributions and chemical composition. Environ. Pollut. 2018, 234, 145–154. [Google Scholar] [CrossRef] [PubMed]
  36. Pokorná, P.; Hovorka, J.; Klán, M.; Hopke, P.K. Source apportionment of size resolved particulate matter at a European air pollution hot spot. Sci. Total Environ. 2015, 502, 172–183. [Google Scholar] [CrossRef] [PubMed]
  37. Vossler, T.; Černikovský, L.; Novák, J.; Plachá, H.; Krejčí, B.; Nikolová, I.; Chalupníčková, E.; Williams, R. An investigation of local and regional sources of fine particulate matter in Ostrava, the Czech Republic. Atmos. Pollut. Res. 2015, 6, 454–463. [Google Scholar] [CrossRef]
  38. Vossler, T.; Černikovský, L.; Novák, J.; Williams, R. Source Apportionment With Uncertainty Estimates of Fine Particulate Matter in Ostrava, Czech Republic Using Positive Matrix Factorization. Atmos. Pollut. Res. 2016, 7, 503–512. Available online: https://www.sciencedirect.com/science/article/abs/pii/S1309104215300477 (accessed on 20 February 2023). [CrossRef]
  39. Contini, D.; Cesari, D.; Conte, M.; Donateo, A. Application of PMF and CMB receptor models for the evaluation of the contribution of a large coal-fired power plant to PM10 concentrations. Sci. Total Environ. 2016, 560, 131–140. [Google Scholar] [CrossRef] [PubMed]
  40. Seibert, R.; Nikolová, I.; Volná, V.; Krejčí, B.; Hladký, D. Air Pollution Sources’ Contribution to PM2.5 Concentration in the Northeastern Part of the Czech Republic. Atmosphere 2020, 11, 522. [Google Scholar] [CrossRef]
  41. Seibert, R.; Nikolová, I.; Volná, V.; Krejčí, B.; Hladký, D. Source Apportionment of PM2.5, PAH and Arsenic Air Pollution in Central Bohemia. Environments 2021, 8, 107. [Google Scholar] [CrossRef]
  42. Dasgupta, P.K.; Campbell, S.W.; Al-Horr, R.S.; Ullah, S.M.R.; Li, J.; Amalfitano, C.; Poor, N.D. Conversion of sea salt aerosol to NaNO3. and the production of HCl: Analysis of temporal behavior of aerosol chloride/nitrate gaseous HCl/HNO3 concentrations with AIM. Atmos. Environ. 2007, 41, 4242–4257. [Google Scholar] [CrossRef]
  43. López, M.L.; Ceppi, S.; Palancar, G.G.; Olcese, L.E.; Tirao, G.; Toselli, B.M. Elemental concentration and source identification of PM10 and PM2.5 by SR-XRF in Córdoba City, Argentina. Atmos. Environ. 2011, 45, 5450–5457. [Google Scholar] [CrossRef]
  44. EEA. Air Quality in Europe—2019 Report. EEA Technical Report 10/2019; EEA: Copenhagen, Denmark, 2019; ISBN 978-92-9480-088-6. ISSN 1977-8449. Available online: https://www.eea.europa.eu/publications/air-quality-in-europe-2019 (accessed on 15 March 2023).
  45. ETC/ATNI. Benzo(a)pyrene (BaP) Annual Mapping. Evaluation of Its Potential Regular Updating. ETC/ATNI Report 18/2021 2022, European Topic Centre on Air pollution, transport, noise and industrial pollutioc/o NILU–Norwegian Institute for Air Research, Kjeller, Norway, 2022. Available online: https://zenodo.org/records/5898376 (accessed on 15 March 2023).
  46. Guerreiro, C.B.; Foltescu, V.; De Leeuw, F. Air quality status and trends in Europe. Atmos. Environ. 2014, 98, 376–384. [Google Scholar] [CrossRef]
  47. Mikuška, P.; Křůmal, K.; Večeřa, Z. Characterization of organic compounds in the PM2.5 aerosols in winter in an industrial urban area. Atmos. Environ. 2015, 105, 97–108. [Google Scholar] [CrossRef]
  48. Aksoyoglu, S.; Ciarelli, G.; El-Haddad, I.; Baltensperger, U.; Prévôt, A.S.H. Secondary inorganic aerosols in Europe: Sources and the significant influence of biogenic VOC emissions, especially on ammonium nitrate. Atmos. Chem. Phys. 2017, 17, 7757–7773. [Google Scholar] [CrossRef]
  49. Megido, L.; Negral, L.; Castrillón, L.; Fernández-Nava, Y.; Suárez-Peña, B.; Marañón, E. Impact of secondary inorganic aerosol and road traffic at a suburban air quality monitoring station. J. Environ. Manag. 2017, 189, 36–45. [Google Scholar] [CrossRef] [PubMed]
  50. Weijers, E.P.; Sahan, E.; Ten Brink, H.M.; Schaap, M.; Matthijsen, J.; Otjes, R.P.; Van Arkel, F. Contribution of Secondary Inorganic Aerosols to PM10 and PM2.5 in the Netherlands; Measurements and Modelling Results; Netherlands Research Program on Particulate Matter, Report 500099006, measurement and modelling results; AH: Bilthoven, The Netherlands, 2010. [Google Scholar]
  51. Casotti Rienda, I.; Nunes, T.; Gonçalves, C.; Vicente, A.; Amato, F.; Lucarelli, F.; Kováts, N.; Hubai, K.; Sainnokhoi, T.-A.; Alves, C.A. Road dust resuspension in a coastal Atlantic intermunicipal urban area with industrial facilities: Emission factors, chemical composition and ecotoxicity. Atmos. Res. 2023, 294, 106977. [Google Scholar] [CrossRef]
  52. Christensen, W.F.; Schauer, J.J. Quantifying and manipulating species influence in positive matrix factorization. Chemom. Intell. Lab. Syst. 2008, 94, 140–148. [Google Scholar] [CrossRef]
  53. Wang, Y.; Hopke, P.K.; Xia, X.; Rattigan, O.V.; Chalupa, D.C.; Utell, M.J. Source apportionment of airborne particulate matter using inorganic and organic species as tracers. Atmos. Environ. 2012, 55, 525–532. [Google Scholar] [CrossRef]
  54. Amato, F.; Alastuey, A.; de la Rosa, J.; Gonzalez Castanedo, Y.; Sánchez de la Campa, A.M.; Pandolfi, M.; Lozano, A.; Contreras González, J.; Querol, X. Trends of road dust emissions contributions on ambient air particulate levels at rural, urban and industrial sites in southern Spain. Atmos. Chem. Phys. 2014, 14, 3533–3544. [Google Scholar] [CrossRef]
Figure 1. Location of the assessed area within the Czech Republic and Central Europe (CHMI).
Atmosphere 15 00177 g001
Figure 2. Weighted concentration roses without wind speed (top) and concentration roses (bottom) for PM10 (µg/m3), 14 January–14 April 2021.
Atmosphere 15 00177 g002
Figure 3. Statistical distribution of 3 h mean PM10 concentrations divided by wind direction from an area of the Liberty Ostrava a. s. and others, 14 January–14 April 2021 (the central horizontal line indicates the median and the rectangle boundaries the upper and lower quartiles, and points indicate outliers—high concentration values).
Atmosphere 15 00177 g003
Figure 4. Weighted concentration roses without wind speed (top) and concentration roses (bottom) for BaP (ng/m3), 14 January–14 April 2021.
Atmosphere 15 00177 g004
Figure 5. Statistical distribution of 3 h mean BaP concentrations divided by wind direction from the area of the Liberty Ostrava a. s. and others, 14 January–14 April 2021 (the central horizontal line indicates the median and the rectangle boundaries the upper and lower quartiles, and points indicate outliers—high concentration values).
Atmosphere 15 00177 g005
Figure 6. PMF source apportionment of PM10 based on Constrained Run: SIA—secondary inorganic aerosol; HEAT BB—biomass household heating; HEAT CC—coal household heating; IND_Ca—industrial handling of bulk materials; TRA—road transport; C-NO3-Na—carbonaceous and altered salt aerosol; NaCl—salt; CRUSTAL—nonindustrial mineral particles; IND_HM—industrial polymetallic emissions (blast furnace + steel mill); IND PAH—industrial particles rich in PAHs (coking plant).
Atmosphere 15 00177 g006
Figure 7. PMF source apportionment of BaP based on Constrained Run: HEAT CC—coal household heating; IND PAH—industrial particles rich in PAHs (coking plant); HEAT BB—biomass household heating; TRA—road transport; C-NO3-Na—carbonaceous and altered salt aerosol; CRUSTAL—nonindustrial mineral particles; SIA—secondary inorganic aerosol.
Atmosphere 15 00177 g007
Table 1. Temperatures and duration of thermal steps of EUSAAR_2 protocol.
StepTemperature
°C
Duration
s
He1200120
He2300150
He3450180
He4650180
He/O21500120
He/O22550120
He/O2370070
He/O2485080
Table 2. Mean PM10 concentrations (µg/m3) and percentage contribution to the PM10 concentration load at locations from the direction of the area of Liberty Ostrava a. s. and from other directions than the Liberty area, 14 January–14 April 2021.
LocalityDirection fromMean PM10 ConcentrationContribution %
Ostrava–Bartovice (TOBA)From other directions32.088
Ostrava–Bartovice (TOBA)From the direction of the Liberty37.912
Ostrava–Kunčičky (TOKU)From other directions35.793
Ostrava–Kunčičky (TOKU)From the direction of the Liberty47.97
Ostrava–Radvanice (TORE)From other directions43.843
Ostrava–Radvanice (TORE)From the direction of the Liberty70.457
Table 3. Mean BaP concentrations (ng/m3) and percentage contribution to the BaP concentration load at locations from the direction of the area of the Liberty Ostrava a. s. and other directions than the Liberty area, 14 January–14 April 2021.
LocalityDirection fromMean BaP ConcentrationContribution %
Ostrava–Bartovice (TOBA)From other directions5.383
Ostrava–Bartovice (TOBA)From the direction of the Liberty9.617
Ostrava–Kunčičky (TOKU)From other directions5.490
Ostrava–Kunčičky (TOKU)From the direction of the Liberty10.010
Ostrava–Radvanice (TORE)From other directions11.333
Ostrava–Radvanice (TORE)From the direction of the Liberty28.467
Disclaimer/Publisher’s Note: The statements, opinions and data contained in all publications are solely those of the individual author(s) and contributor(s) and not of MDPI and/or the editor(s). MDPI and/or the editor(s) disclaim responsibility for any injury to people or property resulting from any ideas, methods, instructions or products referred to in the content.

