Article

Geo-Statistical Characterization of Annual Maximum Daily Rainfall Variability in Semi-Arid Regions

1
Laboratory of Water & Environment, Faculty of Nature and Life Sciences, University Hassiba Benboual of Chlef, P. B 78C, Ouled Fares, Chlef 02180, Algeria
2
National Research Council of Italy-Research Institute for Geo-Hydrological Protection (CNR-IRPI), Via Cavaour 4/6, 87036 Rende, Italy
3
Research Institute of Engineering and Technology, Hanyang University, Ansan 15588, Republic of Korea
4
Department of Civil Engineering & Technology, Qurtuba University of Science and Information Technology, Dera Ismail Khan 29050, Pakistan
5
Department of Sanitary Engineering and Water Management, University of Agriculture in Krakow, Mickiewicza 24/28 Street, 30-059 Krakow, Poland
6
CERIS, Instituto Superior Técnico, Universidade de Lisboa, Av. Rovisco Pais 1, 1049-001 Lisbon, Portugal
7
National Research Council of Italy-Institute for Agriculture and Forestry Systems in the Mediterranean (CNR-ISAFOM), Via Cavaour 4/6, 87036 Rende, Italy
*
Author to whom correspondence should be addressed.
Atmosphere 2024, 15(12), 1519; https://doi.org/10.3390/atmos15121519
Submission received: 15 November 2024 / Revised: 13 December 2024 / Accepted: 16 December 2024 / Published: 19 December 2024

Abstract

:
In the Wadi Cheliff basin (Algeria), a 48-year (1971–2018) time series of annual maximum daily rainfall was studied to identify and quantify trends observed at 150 rain gauges. Initial trends in annual maximum daily rainfall were determined using the Mann–Kendall test, with a significance level of 95%. The slope or increase/decrease in the annual maximum daily precipitation was assessed using the Theil–Sen estimator. A running trend analysis was then performed to quantify the effects of different time windows on trend detection. Finally, to assess the different spatial distribution of annual maximum daily precipitation during the observation period, spatial analysis was performed using a geo-statistical approach for the whole observation period and at different decades. The results showed a predominant negative trend in annual maximum daily rainfall (about 11% of rain gauges at a 95% significance level), mainly affecting the north-eastern area of the catchment. The spatial distribution of annual maximum daily rainfall showed high rainfall variability in the period of 1970–1980, with a decrease in the decades of 1980–1990 and 2010–2017 when the maximum values were more evenly distributed across the region.

1. Introduction

Precipitation is an essential part of the hydrological cycle. Therefore, an accurate assessment of precipitation plays a key role in the proper planning and sustainable management of water resources in water-scarce regions. Moreover, long-term analysis of precipitation variability is essential, especially in climate change detection studies, as it helps water managers and other stakeholders to make cost-effective decisions on conservation and adaptation measures against droughts, floods, and other climate-related natural hazards [1]. Since the different atmospheric mechanisms of the formulation determine floods, information on the spatio–temporal variability of precipitation is very useful for building simulation models to analyze and predict floods [2]. In addition, information on the spatial resolution of annual precipitation can reduce the calculation error in flood simulation [3].
The analysis of spatial and temporal precipitation patterns is important to understand climate change or its variability and to assess the impact of climate change on water resources and various eco-hydrological processes [4]. In addition, the amount of precipitation directly influences the soil moisture required for cultivation. Thus, the productivity or failure of crops depends on the amount and variability of precipitation. Therefore, understanding climatic variables, especially rainfall, can help develop optimal strategies to improve the socio-economic well-being of smallholder farmers [5]. Therefore, quantifying rainfall variability at different temporal and spatial scales is important to combat the extreme impacts of prolonged droughts and crop failures.
However, the amount of precipitation and its spatial distribution depends, among other things, on longitude, latitude, altitude, seasonality, distance from the sea, temperature, humidity, and atmospheric pressure [6]. The simulation of climate variables through geo-statistical modelling has made it possible to understand the spatial variability patterns of precipitation. However, the geospatial analysis of precipitation variability becomes challenging when the spatial patterns are simulated under different environmental conditions, especially in countries with arid and semi-arid climates such as Algeria, where the complex topography and spatially highly separated climate make it difficult to estimate small-scale precipitation and temperature patterns [7].
Nowadays, new technologies such as geographic information system (GIS), satellite, and radar data can help make progress in the quantitative estimation of precipitation distribution [8,9]. As an example, GIS has become essential for agricultural research and natural resource management, especially for the application of spatial interpolation techniques such as spline, inverse distance weighted, and kriging interpolation [10]. To understand the spatio–temporal occurrence and patterns of agroclimatic variables (e.g., temperature, precipitation, and evapotranspiration), accurate and cost-effective quantitative approaches such as GIS modelling and the availability of long-term data are essential. Moccia et al. [11] investigated the variability of maximum precipitation in Italy. They demonstrated that the relationship between elevation and precipitation amount does not change with the return period of the examined event. The problem of the spatial variability of precipitation is visible in arid and semi-arid climate zones. The variability is due to large fluctuations in air temperature, altitude above mean sea level, and the variations in the impacts of large atmospheric circulation patterns, such as the strength and position of subtropical highs [12].
To date, many studies have been conducted to analyze the spatial variability of precipitation in arid and semi-arid regions. Pechlivanidis et al. [13] showed that the influence of spatial precipitation on runoff generation is greater in more impervious catchments. Syed et al. [14] showed that in arid and semi-arid regions, the sensitivity of runoff to the spatio–temporal characteristics of the precipitation event is visible at different catchment scales. The sensitivity is higher for convective events than for frontal events [15]. Catchment permeability and antecedent catchment conditions can also influence the spatio–temporal relationship between precipitation and runoff [16]. Non-parametric tests such as the Mann–Kendall test, Sen’s slope, Spearman’s rho test, cumulative sum, and innovative polygon trend nalysis (IPTA) are often used to determine the temporal variability of precipitation [17,18,19,20]. The importance of rainfall analysis in different parts of Algeria has been investigated in previous studies. However, as far as we know, there are no studies dealing with the spatial variability of precipitation that consider trend analysis at a daily level in the Wadi Cheliff basin (WCB), one of the main basins in northern Algeria. Therefore, the main objectives of this study are as follows: (i) to detect possible trends in annual maximum daily precipitation, (ii) to quantify the effects of different periods in trend detection, and (iii) to evaluate the different spatial distribution of annual maximum daily precipitation for the different decades using a geo-statistical approach.
The rest of the study is structured as follows: Section 2 describes the study, the data collection, and the methodology used; Section 3 presents the main results and discusses their relevance in the light of related literature, also emphasizing the importance of understanding precipitation variability at different temporal and spatial scales; finally, Section 4 presents the main conclusions from this study.

2. Materials and Methods

2.1. Study Area and Data

The Wadi Cheliff is the longest river in the country and plays a vital role in the socio-economic development of the main regions in Algeria. The Wadi originates from the Saharan Atlas, near Aflou in the mountains of the Jebel Amour, and is approximately 750 km long. The WCB presents a fan shape, covers an area of 43,750 km2, has a perimeter of 1439.26 km, and lies between 00°07′44″ E and 03°31′07″ E and between 33°53′13″ N and 36°26′34″ N (Figure 1). The topography of the basin is complex and rugged. The elevation varies between −4 m and 1969 m.
Climatically, the basin is arid and semi-arid. The mean annual temperature decreases with increasing altitude upstream from north to south [21]. The mean annual precipitation recorded at various stations (1970–2018) ranges from 161 mm to 662 mm, 80% of which falls between November and March. For this study, datasets from 150 precipitation stations (Figure 1) with long-term precipitation records from 1970 to 2018 across the WCB were adopted from the National Agency for Water Resources (ANRH). The records from these stations cover varying periods, and some include gaps. To enhance data quality, only those observing stations with data series representing at least 70% of the total study period have been selected. After excluding stations with excessive missing values, a quality analysis was conducted on the remaining data, and gaps were addressed using simple linear regression as well as double or multiple regression methods.

2.2. Methodology

2.2.1. Temporal Variability

Two non-parametric tests for trend detection were used in this paper: the Theil–Sen (TS) estimator [22] for the assessment of the slopes of the trends and the Mann–Kendall (MK) test for the assessment of statistical significance [23,24]. The slope estimates of N pairs of observations are calculated based on the equation:
Q k = P j P i t j t i           for     k = 1 ,   ,   N ,
where Pj and Pi are the observations at time j and i (j > i), respectively.
The median of these N values of Qi is the Sen’s estimator of the slope, which is evaluated as follows:
Q m e d = Q N + 1 / 2 if   N   is   odd Q N / 2 + Q N + 2 / 2 2 if   N   is   even ,
The Qmed sign reveals the trend behaviour, while its value indicates the magnitude of the trend.
The test statistic S is calculated using the following equation:
S = k = 1 n 1 j = k + 1 n sgn P j P k           w h e r e       sgn P j P k = 1             if       P j P k > 0 0             if       P j P k = 0 1         if       P j P k < 0 ,
where n is the number of data, and P is the observation at times k and j (with j > k).
The variance of S is computed as follows:
V a r S = n   n 1 2 n + 5 i = 1 m t i   t i 1 2 t i + 5   / 18 ,
where ti is the number of ties of extent i, and m is the number of tied rank groups.
For n larger than 10, the standard normal ZMK test statistics are computed as the Mann–Kendall test statistics as follows:
Z M K = S 1 V a r S               for     S > 0 0               for     S = 0 S + 1 V a r S             for     S < 0 ,
By applying a two-sided test for a certain significance level α, the significance of the trend can be assessed. In this work, the precipitation and runoff series were analyzed for three different significance levels (SL), corresponding to 90%, 95%, and 99%.
The temporal variability was computed using the Excel spreadsheet software programme.

2.2.2. Spatial Variability

In geo-statistics, the kriging with external drift (KED) approach incorporates auxiliary data available at all locations to model the local spatial trend of a dependent variable. While the predictions are generated similarly to standard kriging, the difference lies in how the covariance matrix of the residuals is expanded to include these auxiliary variables.
The spatial characteristics of the secondary variable reflect an indicator of the overall trend, which helps to illustrate predictions. In this study, the KED method was chosen to include elevation and geographic coordinates as secondary variables. This is consistent with the nature of precipitation data, which shows a general southwest-to-northeast trend influenced by altitude [14].
Kriging of Y at a location x0, where it is unknown, is a linear combination of the data:
Y * x 0 = i = 1 n λ i x i ,
where the Y x i ’s are the values at the n measured sites, and the λ i are determined by a covariance matrix whose values are calculated from the observed precipitation data. The KED method simplifies the use of semi-variograms compared to ordinary Kriging, as it does not require a separate semi-variogram for each covariate. Instead, the semi-variogram is applied only to the residual spatial variability after accounting for external drift. This ensures that the linear predictor, Y * x 0 effectively removes the influence of external drift. Here, μ1 and μ2 represent the Lagrange multipliers used to obtain unbiased predictions while minimizing the variance of the prediction.
Due to the small amount of measured data, an omnidirectional semi-variogram was used to analyze the spatial dependence, and it was therefore assumed that the spatial variability is identical in each direction. In general, it is possible to consider several models of the semi-variogram in one. This approach is very useful for fitting the experimental data more accurately so that a more realistic representation of the modelled data is obtained. In this study, the fit was not calculated automatically but was performed separately, considering the different cases. In particular, a semi-variogram model was fitted for each decade using all the data available in the dataset spanning several years, resulting in 6 models in total. The semi-variogram models were also used to avoid negative interpolated precipitation. The comparison between predicted and measured data was performed by calculating R2, root mean squared error (RMSE), and mean absolute error (MAE) values for all decades.
The spatial variability was computed in an R statistical environment using the “gstat” package.

3. Results

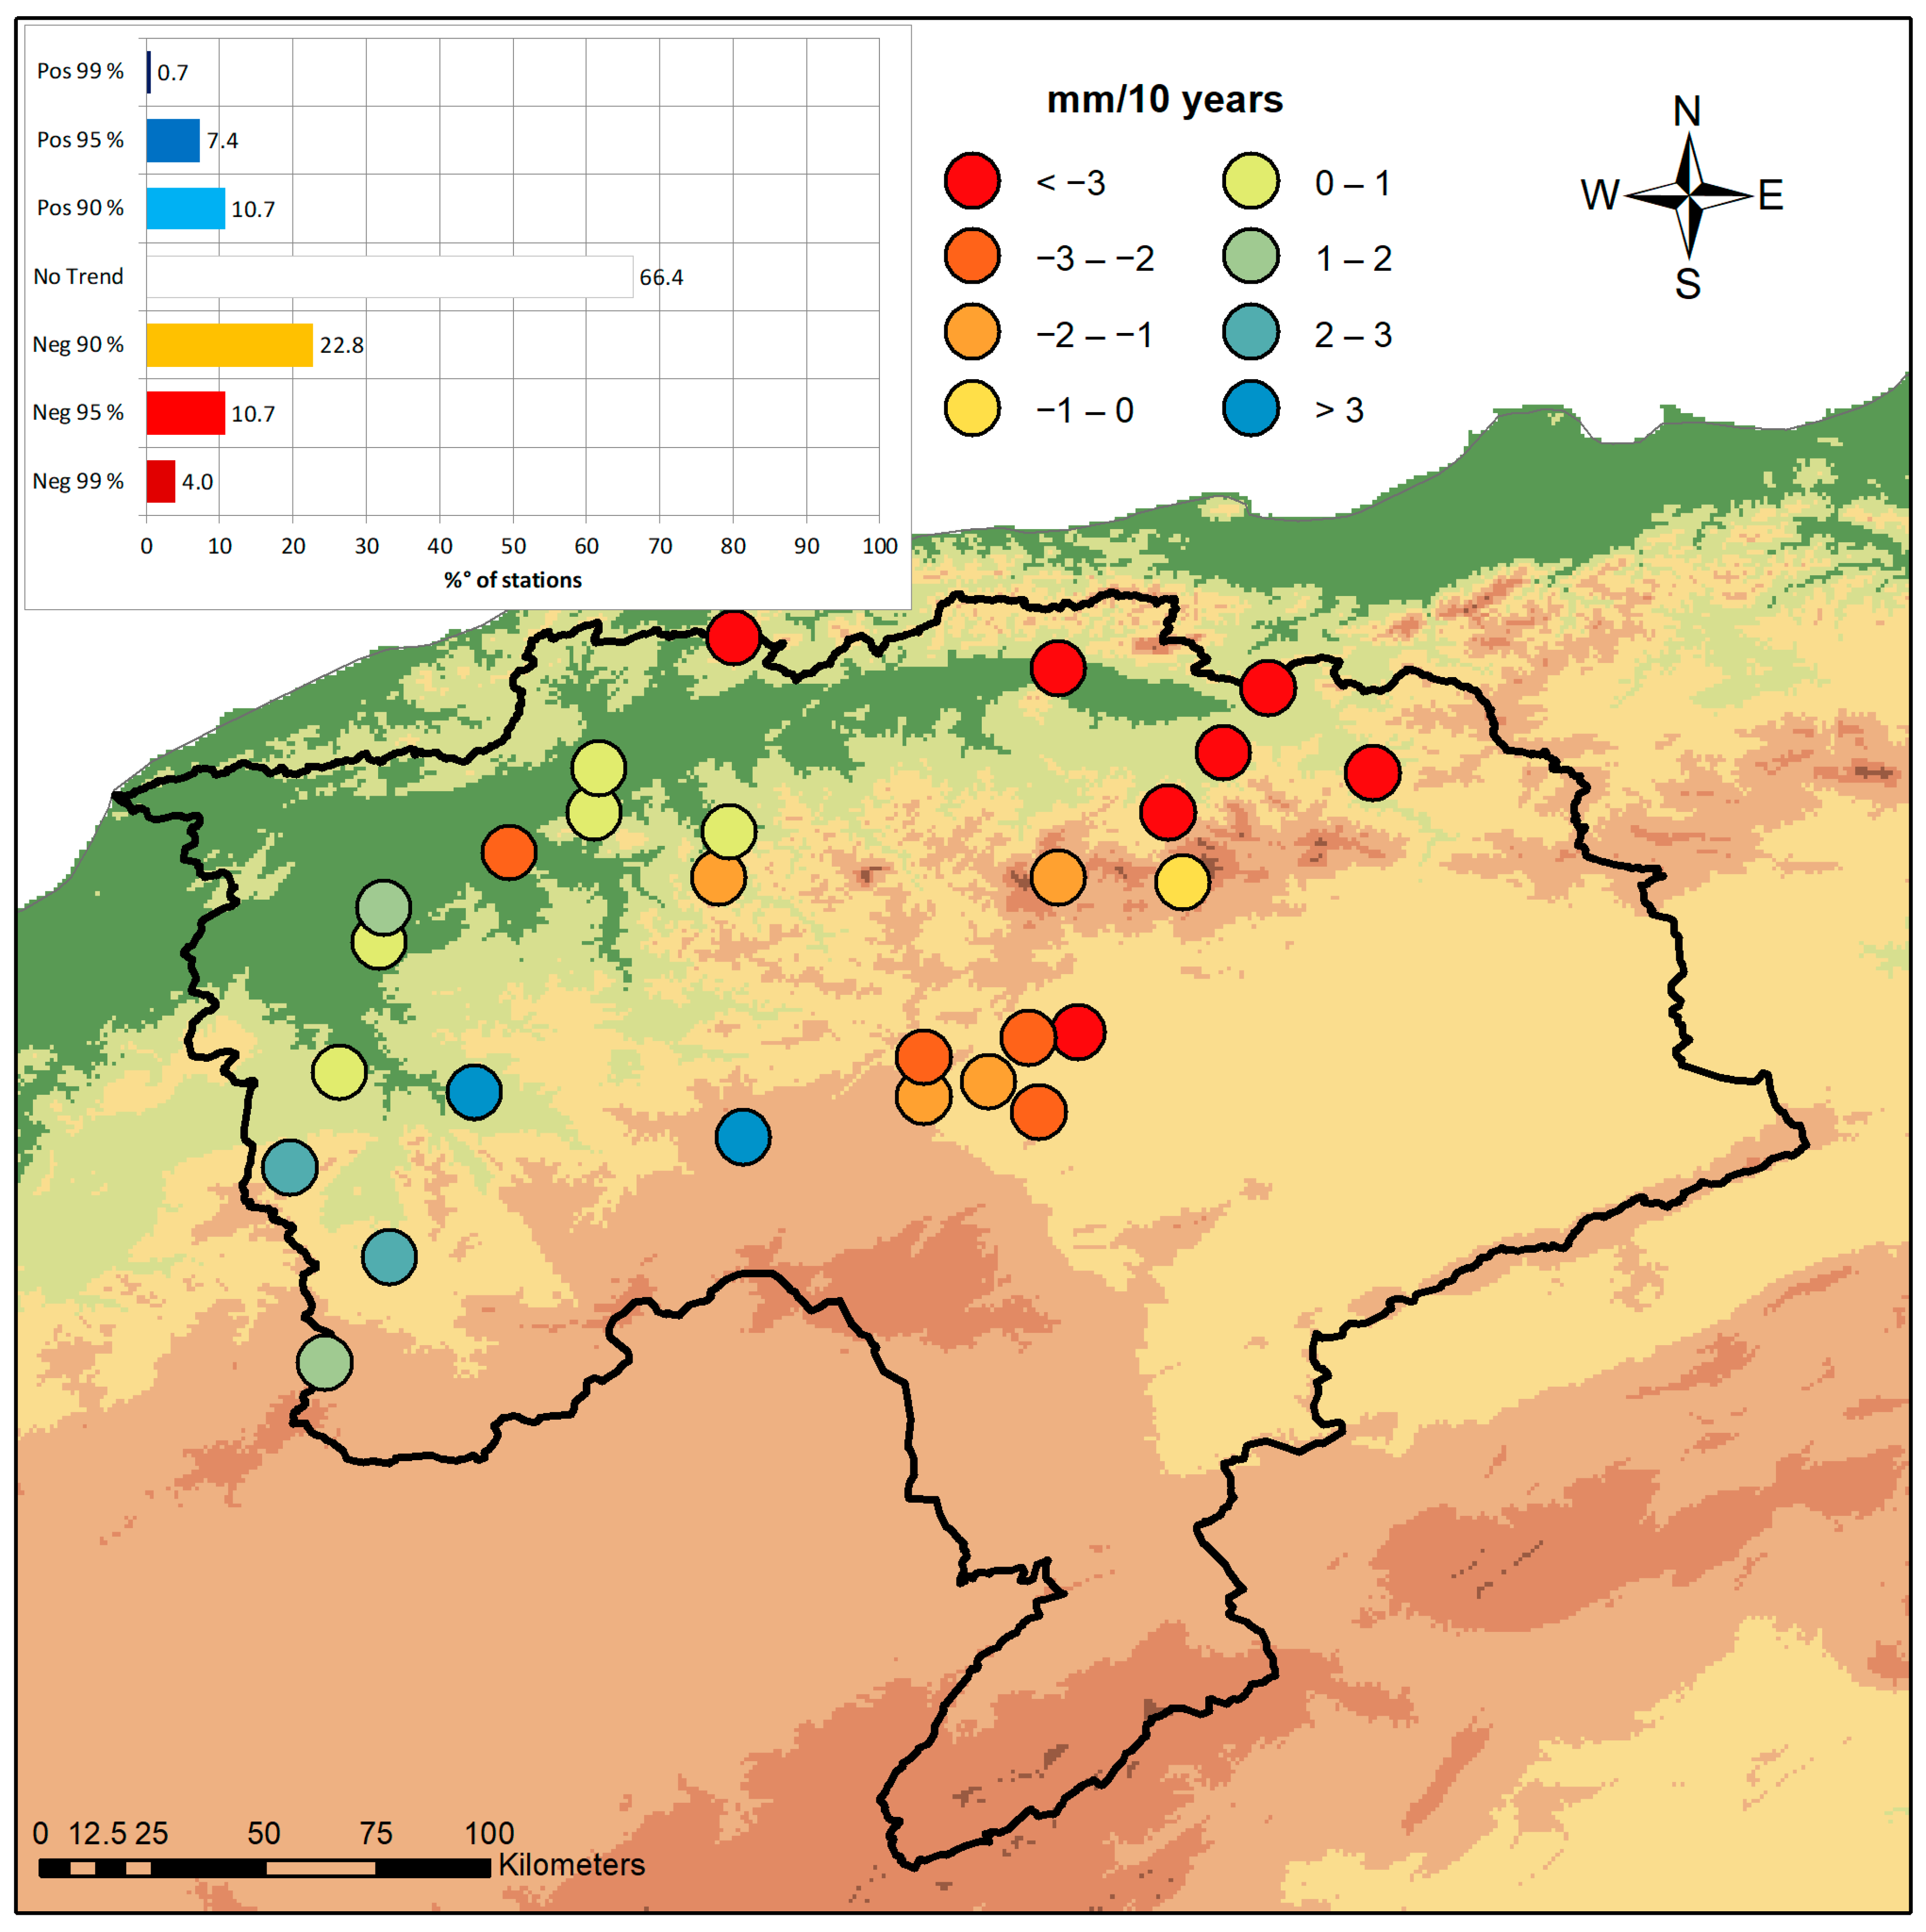
The trend analysis of the annual maximum daily precipitation was performed considering three different significance levels (SL): 90%, 95%, and 99% (Figure 2). The result is a predominant negative trend in precipitation. Indeed, 22.8% (SL = 90%), 10.7% (SL = 95%), and 4.0% (SL = 99%) of the precipitation series of the study area showed a negative trend. In contrast, a positive precipitation trend was observed in 10.7%, 7.4%, and 0.7% of the series for SL = 90%, 95%, and 99%, respectively. From a spatial perspective, the results of the trend analysis divide the basin into three areas. The southern part of the basin has no significant trend; the north-eastern side is characterized by negative trend values with a maximum decrease of more than 3 mm/10 years, and the north-western area of the basin showed negative trends near the coast and mixed, mostly positive trends with a maximum magnitude of more than 3 mm/10 years, in more south of the western third of the study region.
To capture the entire possible spectrum of significant trends in the series and thus obtain the best possible detailed information, an ongoing trend analysis was carried out. The slopes of the trends were estimated within time windows ranging in width from 20 years to the entire length of the series (48 years). The identified trends were presented in graphs for better visualization, with the y-axis indicating the width of the time window and the x-axis indicating the last year of the time window to which the trend refers. The value of the trend is represented by the colour of the corresponding pixel and the significance level by the size of the square, large squares are plotted for p < 0.05 and small squares otherwise. The result shows that the annual maximum daily precipitation decreases significantly in the first 20–30 years of observation and over the entire period, but to a lesser extent, as a significant increase was observed in the last 20 years (Figure 3).
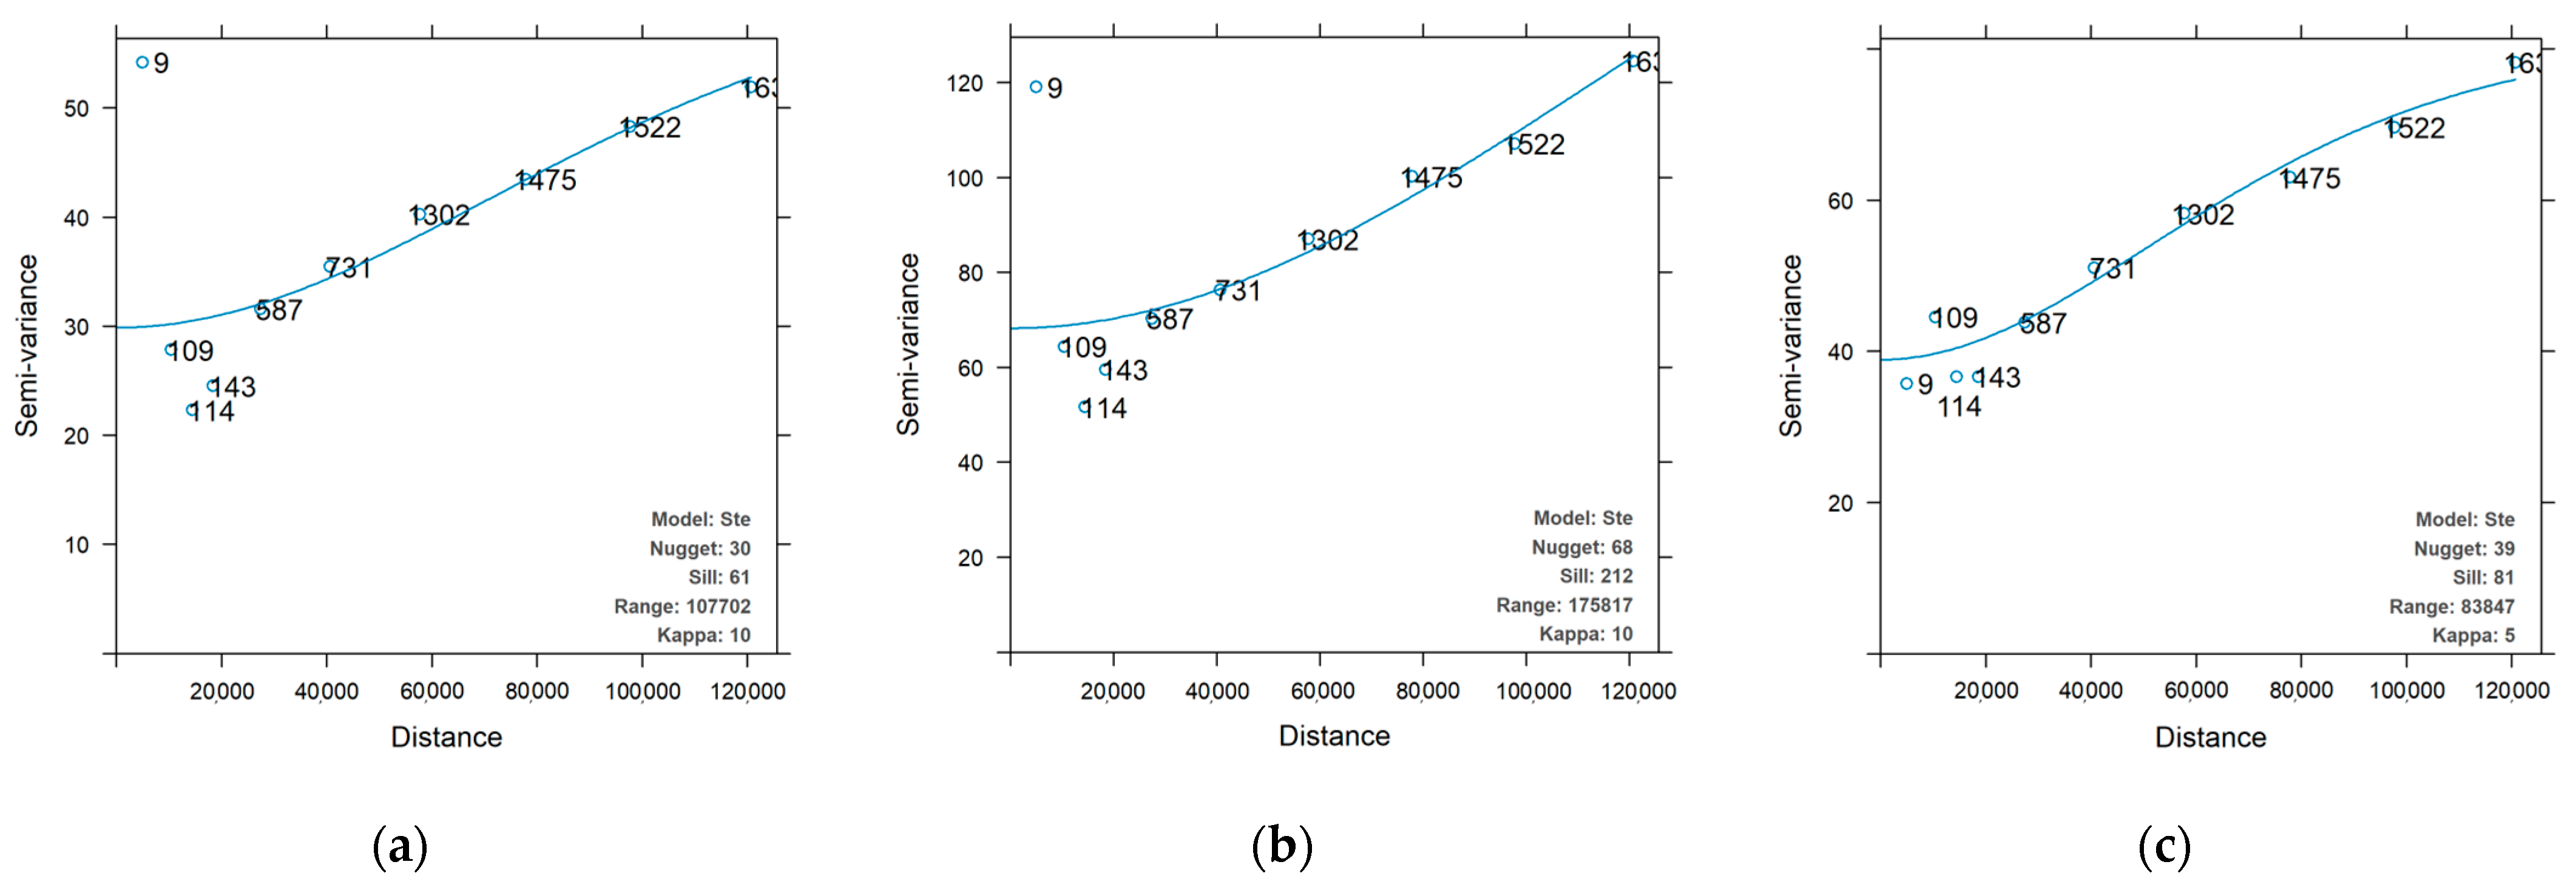
The analysis of the experimental variograms over different periods shows a fluctuation of spatial dependence over time. The entire time series and the periods between 1970–1980 and 2000–2010 show relatively strong spatial structures characterized by a higher degree of spatial variability and wider ranges. In contrast, the 1980–1990, 1990–2000, and 2010–2017 periods show weaker spatial dependence with lower thresholds and shorter ranges, indicating less spatial heterogeneity and a more localized structure. These temporal differences in nugget, sill, and range values reflect the evolving spatial dependence of daily maximum precipitation over time, possibly influenced by climatic shifts and environmental changes (Figure 4).
The sequence of decadal spatial distributions in Figure 5 shows the temporal changes in the distribution of maximum daily precipitation in the region. Two main behaviours can be identified: periods with higher precipitation concentrated in certain areas and periods with evenly distributed, lower precipitation. In particular, for the full-time series and the period of 1970–1980, higher precipitation values (above 50 mm) are concentrated in the northern part of the region. On the contrary, precipitation from 1980–1990 to 2010–2017 shows lower maximum values more evenly distributed across the region. Specifically, in the more recent periods (2000–2010 and 2010–2017), the intensity is lower than in the previous periods in the northern areas, with maximum values below 35 mm. This indicates a possible decrease in extreme daily precipitation events, which regional climatic changes might cause.
The regression results between the observed and the estimated daily maximum precipitation values show remarkable differences in the quality of the estimates in the different decades (Figure 6). The period of 1970–1980 and the entire time series show the highest R2 values (0.489 and 0.429, respectively), indicating a moderate match between observed and estimated values. The RMSE and MAE are 7.6 mm and 5.7 mm for the period of 1970–1980 and 5.3 mm and 3.9 mm for the complete time series. In the period of 1980–1990, R2, RMSE, and MAE are 0.4, 6.4 mm, and 5 mm, respectively, with a slight deviation from the ideal line of 1:1, which indicates a moderate tendency to underestimate the observed values. A similar pattern can also be observed for the period of 2000–2010, with an R2 of 0.347.
The periods between 1990–2000 and 2010–2017 have the lowest R2 values (0.327 and 0.325, respectively), and the slope of the regression line deviates further from the ideal line, indicating increasing difficulties in accurately capturing the variability of daily maximum precipitation. In recent years, the match between the estimated and observed data has been weaker, possibly due to climate anomalies or shifts in precipitation patterns that have challenged the accuracy of the model.

4. Discussion

This study revealed diverse changes in the annual maximum daily precipitation in the analyzed area. Predominantly decreasing trends were identified, encompassing 22.8% of the data series at a significance level of 90%, 10.7% at 95%, and 4.0% at 99%. These results are confirmed by Bouklikha et al. [25], who identified monthly precipitation trends in north-western Algeria and by Kessabi et al. [26], who demonstrated a decrease of −20% to −40% in total annual precipitation in northern Morocco. The negative precipitation trends in north-western Algeria are associated with an increased risk of drought [27].
Moreover, analyses showed that the southern regions of the WCB do not exhibit significant precipitation trends, while the north-eastern part experiences decreases exceeding 3 mm/10 years. The trend analysis results suggest a significant decline in the first 20–30 years of observation, but a partial increase in maximum daily precipitation has been observed over the last two decades. Hassini et al. [28] demonstrated great inter-annual and intra-annual variability of rainfall in northern Algeria, with the latter driven by a clearer distinction between dry and rainy seasons, characterized by smaller rainfall amplitude.
The use of semi-variogram models and their application over different decades enabled more accurate spatial modelling of changes in precipitation intensity. The results showed that greater spatial variability was observed during 1970–1980 and 2000–2010. The spatial variability in precipitation may significantly affect groundwater resources and, consequently, the agricultural sector [29].
In addition, a reduction in the maximum values through the decades has been observed, with the full-time series and the period of 1970–1980 showing precipitation values higher than 50 mm in the northern part of the region, indicating a high-intensity precipitation zone in this area. Similar behaviours have been observed in many studies on the climate of North Africa and the Mediterranean basin. For instance, Bouklikha et al. [25] indicated a shift in the distribution of intense rainfall events in the northern regions of Algeria, which aligns with the findings of this study. Berhail et al. [30] reported that the spatial distribution of average decade rainfall reflects a shift in the Mediterranean rainfall regime toward all the northern regions of Algeria. This spatial distribution of extreme precipitation in the WCB is strongly influenced by its connection to the Eastern Mediterranean Sea [31,32].
Finally, from the point of view of water management, as suggested by Lorente Cas-telló et al. [33], the results of this study showing the spatial distribution of annual maximum precipitation could be useful in carrying out the prevention and management of river flooding.

5. Conclusions

This study aimed to explore the trends of the annual maximum daily precipitation amount in the semi-arid Wadi Cheliff basin, Algeria, over 48 years (1971–2018). The aim was to use statistical and geo-statistical methods to identify precipitation trends, assess their extent, and analyze the changes in spatial distribution over time.
The study used the Mann–Kendall test and Theil-Sen estimator to analyze trends. At the same time, spatial distribution was examined using kriging models with external drift (KED), with elevation included as a secondary variable. This methodology allowed the temporal trends to be analyzed at different significance levels (90%, 95%, and 99%) and provided insights into the spatial changes in precipitation distribution.
The results showed a predominantly negative trend in the annual maximum daily precipitation amount in the Wadi Cheliff basin. Specifically, 22.8% of rain gauges showed a negative trend at a 90% significance level, with a smaller percentage showing a significant trend at higher confidence levels. Spatially, the basin can be divided into three zones: a southern area with no significant trend, a north-eastern region where rainfall is decreasing significantly (more than 3 mm/decade), and a north-western area with negative trends near the coast and mixed, mostly positive trends, in more south of the western third of the study region.
This study concluded that the Wadi Cheliff basin is characterized by considerable temporal and spatial variability in precipitation, which is probably due to a combination of topographic and climatic factors. The observed trend of decreasing maximum daily precipitation, particularly in the north-eastern basin, indicates an increased risk of drought and reduced water availability. This study also highlights the need for adaptive water management strategies to address the changing rainfall patterns and mitigate the potential socio-economic impacts on local communities.
This analysis is crucial for understanding the impacts of climate change in regions facing water scarcity and helps to develop water resource management and strategies to mitigate floods and droughts.

Author Contributions

Conceptualization, M.A. and M.J.; methodology, M.A., T.C. and G.P.; software, M.A., T.C. and G.P.; formal analysis, M.A. and T.C.; validation: M.A., T.C., M.J., A.W. and A.K.; investigation, M.A., T.C., A.W. and M.J.; data curation, M.A.; writing—original draft preparation, M.A., T.C., M.J., A.W., A.K. and G.P.; writing—review and editing, M.A., T.C., M.J. and G.P.; visualization, M.J. and T.C.; supervision, T.C. and M.J. All authors have read and agreed to the published version of the manuscript.

Funding

This research received no external funding.

Institutional Review Board Statement

Not applicable.

Informed Consent Statement

Not applicable.

Data Availability Statement

The data presented in this study are available upon request from the corresponding authors.

Acknowledgments

We thank the National Agency of the Water Resources (ANRH) for the collected data and the General Directorate of Scientific Research and Technological Development of Algeria (DGRSDT).

Conflicts of Interest

The authors declare no conflicts of interest.

References

  1. Javari, M. Geostatistical modeling to simulate daily rainfall variability in Iran. Cogent Geosci. 2017, 3, 1416877. [Google Scholar] [CrossRef]
  2. Volkert, H. Heavy Precipitation in the Alpine Region (HERA): Areal Rainfall Determination for Flood Warnings Through in-situ Measureme nts, Remote Sensing and Atmospheric Modelling. Meteorol. Atmos. Phys. 2000, 72, 73–85. [Google Scholar] [CrossRef]
  3. Cristiano, E.; ten Veldhuis, M.C.; van de Giesen, N. Spatial and temporal variability of rainfall and their effects on hydrological response in urban areas—A review. Hydrol. Earth Syst. Sci. 2017, 21, 3859–3878. [Google Scholar] [CrossRef]
  4. Gupta, A.; Kamble, T.; Machiwal, D. Comparison of ordinary and Bayesian kriging techniques in depicting rainfall variability in arid and semi-arid regions of north-west India. Environ. Earth Sci. 2017, 76, 512. [Google Scholar] [CrossRef]
  5. Kisaka, M.O.; Mucheru-Muna, M.; Ngetich, F.K.; Mugwe, J.N.; Mugedi, D.; Maurura, F. Rainfall Variability, Drought Characterization, and Efficacy of Rainfall Data Reconstruction: Case of Eastern Kenya. Adv. Meteorol. 2015, 2015, 380404. [Google Scholar] [CrossRef]
  6. Bachir, H.; Semar, A.; Mazari, A. Statistical and geostatistical analysis related to geographical parameters for spatial and temporal representation of rainfall in semi-arid environments: The case of Algeria. Arab. J. Geosci. 2016, 9, 486. [Google Scholar] [CrossRef]
  7. Tabari, H.; Somee, B.S.; Zadeh, M.R. Testing for long-term trends in climatic variables in Iran. Atmos. Res. 2011, 100, 132–140. [Google Scholar] [CrossRef]
  8. Ghorbani, M.A.; Mahmoud Alilou, S.; Javidan, S.; Naganna, S.R. Assessment of spatio-temporal variability of rainfall and mean air temperature over Ardabil province, Iran. SN Appl. Sci. 2021, 3, 728. [Google Scholar] [CrossRef]
  9. Otto, T.; Russchenberg, H.W.J. Estimation of Specific Differential Phase and Differential Backscatter Phase from Polarimetric Weather Radar Measurements of Rain. IEEE Geosci. Remote Sens. Lett. 2011, 8, 988–992. [Google Scholar] [CrossRef]
  10. Di Piazza, A.; Conti, F.L.; Noto, L.V.; Viola, F.; La Loggia, G. Comparative analysis of different techniques for spatial interpolation of rainfall data to create a serially complete monthly time series of precipitation for Sicily, Italy. Int. J. Appl. Earth Obs. Geoinf. 2011, 13, 396–408. [Google Scholar] [CrossRef]
  11. Moccia, B.; Papalexiou, S.M.; Russo, F.; Napolitano, F. Spatial variability of precipitation extremes over Italy using a fine-resolution gridded product. J. Hydrol. Reg. Stud. 2021, 37, 100906. [Google Scholar] [CrossRef]
  12. Modarres, R.; Sarhadi, A. Rainfall trends analysis of Iran in the last half of the twentieth century. J. Geophys. Res. Atmos. 2009, 114, D03101. [Google Scholar] [CrossRef]
  13. Pechlivanidis, I.G.; McIntyre, N.; Wheater, H.S. The significance of spatial variability of rainfall on simulated runoff: An evaluation based on the Upper Lee catchment, UK. Hydrol. Res. 2016, 48, 1118–1130. [Google Scholar] [CrossRef]
  14. Syed, K.H.; Goodrich, D.C.; Myers, D.E.; Sorooshian, S. Spatial characteristics of thunderstorm rainfall fields and their relation to runoff. J. Hydrol. 2003, 271, 1–21. [Google Scholar] [CrossRef]
  15. Vischel, T.; Lebel, T. Assessing the water balance in the Sahel: Impact of small scale rainfall variability on runoff. Part 2: Idealized modeling of runoff sensitivity. J. Hydrol. 2007, 333, 340–355. [Google Scholar] [CrossRef]
  16. Fortesa, J.; Latron, J.; García-Comendador, J.; Tomàs-Burguera, M.; Company, J.; Calsamiglia, A.; Estrany, J. Multiple Temporal Scales Assessment in the Hydrological Response of Small Mediterranean-Climate Catchments. Water 2020, 12, 299. [Google Scholar] [CrossRef]
  17. Achite, M.; Ceribasi, G.; Ceyhunlu, A.I.; Wałęga, A.; Caloiero, T. The Innovative Polygon Trend Analysis (IPTA) as a Simple Qualitative Method to Detect Changes in Environment—Example Detecting Trends of the Total Monthly Precipitation in Semi-arid Area. Sustainability 2021, 13, 12674. [Google Scholar] [CrossRef]
  18. Ali, R.; Kuriqi, A.; Abubaker, S.; Kisi, O. Long-Term Trends and Seasonality Detection of the Observed Flow in Yangtze River Using Mann-Kendall and Sen’s Innovative Trend Method. Water 2019, 11, 1855. [Google Scholar] [CrossRef]
  19. Harka, A.E.; Jilo, N.B.; Behulu, F. Spatial-temporal rainfall trend and variability assessment in the Upper Wabe Shebelle River Basin, Ethiopia: Application of innovative trend analysis method. J. Hydrol. Reg. Stud. 2021, 37, 100915. [Google Scholar] [CrossRef]
  20. Kuriqi, A.; Ali, R.; Pham, Q.B.; Gambini, J.M.; Gupta, V.; Malik, A.; Lith, N.T.T. Seasonality shift and streamflow flow variability trends in central India. Acta Geophys. 2020, 68, 1461–1475. [Google Scholar] [CrossRef]
  21. Achite, M.; Krakauer, N.Y.; Wałęga, A.; Caloiero, T. Spatial and Temporal Analysis of Dry and Wet Spells in the Wadi Cheliff Basin, Algeria. Atmosphere 2021, 12, 798. [Google Scholar] [CrossRef]
  22. Sen, P.K. Estimates of the Regression Coefficient Based on Kendall’s Tau. J. Am. Stat. Assoc. 1968, 63, 1379–1389. [Google Scholar] [CrossRef]
  23. Mann, H.B. Non-parametric tests against trend. Econometrica 1945, 13, 245–259. [Google Scholar] [CrossRef]
  24. Kendall, M.G. Rank Correlation Methods; Oxford University Press: New York, NY, USA, 1975. [Google Scholar]
  25. Bouklikha, A.; Habi, M.; Elouissi, A.; Hamoudi, S. Annual, Seasonal and Monthly Rainfall Trend Analysis in the Tafna Watershed, Algeria. Appl. Water Sci. 2021, 11, 77. [Google Scholar] [CrossRef]
  26. Kessabi, R.; Hanchane, M.; Brahim, Y.A.; El Khazzan, B.; Addou, R.; Belmahi, M. Characterization of Annual and Seasonal Rainfall Trend Using Innovative Trend Analysis (ITA) and Classical Methods: The Case of Wadi Sebou Basin (WSB) Morocco. Euro-Mediterr. J. Environ. Integr. 2024, ahead of print. [CrossRef]
  27. Merabti, A.; Darouich, H.; Paredes, P.; Meddi, M.; Pereira, L.S. Assessing Spatial Variability and Trends of Droughts in Eastern Algeria Using SPI, RDI, PDSI, and MedPDSI-A Novel Drought Index Using the FAO56 Evapotranspiration Method. Water 2023, 15, 626. [Google Scholar] [CrossRef]
  28. Hassini, N.; Bouchama, M.; Dobbi, A. Trend of Precipitation in Algeria: Between Severe Drought and Torrential Rain. In Proceedings of the 8th International Conference on Water Resources and Arid Environments (ICWRAE 8), Riyadh, Saudi Arabia, 22–24 January 2019; pp. 104–108. [Google Scholar]
  29. Benali, K.M.; Metouchi, A.; Djoudar Hallal, D.; el Amine Khelfi, M.; Önsoy, H.; Toumi, S. Spatiotemporal characterization of the annual rainfall variability in the Isser Watershed (Algeria). Arab. J. Geosci. 2022, 15, 190. [Google Scholar] [CrossRef]
  30. Berhail, S.; Tourki, M.; Merrouche, I.; Bendekiche, H. Geo-Statistical Assessment of Meteorological Drought in the Context of Climate Change: Case of the Macta Basin (Northwest of Algeria). Model. Earth Syst. Environ. 2022, 8, 81–101. [Google Scholar] [CrossRef]
  31. Mrad, D.; Dairi, S.; Boukhari, S.; Djebbar, Y. Applied Multivariate Analysis on Annual Rainfall in the Northeast of Algeria. J. Water Clim. Chang. 2020, 11, 1165–1176. [Google Scholar] [CrossRef]
  32. Diatta, S.; Diedhiou, C.W.; Dione, D.M.; Sambou, S. Spatial Variation and Trend of Extreme Precipitation in West Africa and Teleconnections with Remote Indices. Atmosphere 2020, 11, 999. [Google Scholar] [CrossRef]
  33. Lorente Castelló, J.; Casas Castillo, M.C.; Rodríguez Solà, R.; Redaño Xipell, A. Extreme Rainfall Rates and Probable Maximum Precipitation; Adverse Weather in Spain; World Climate Research Programme: Geneva, Switzerland, 2013; pp. 135–148. [Google Scholar]
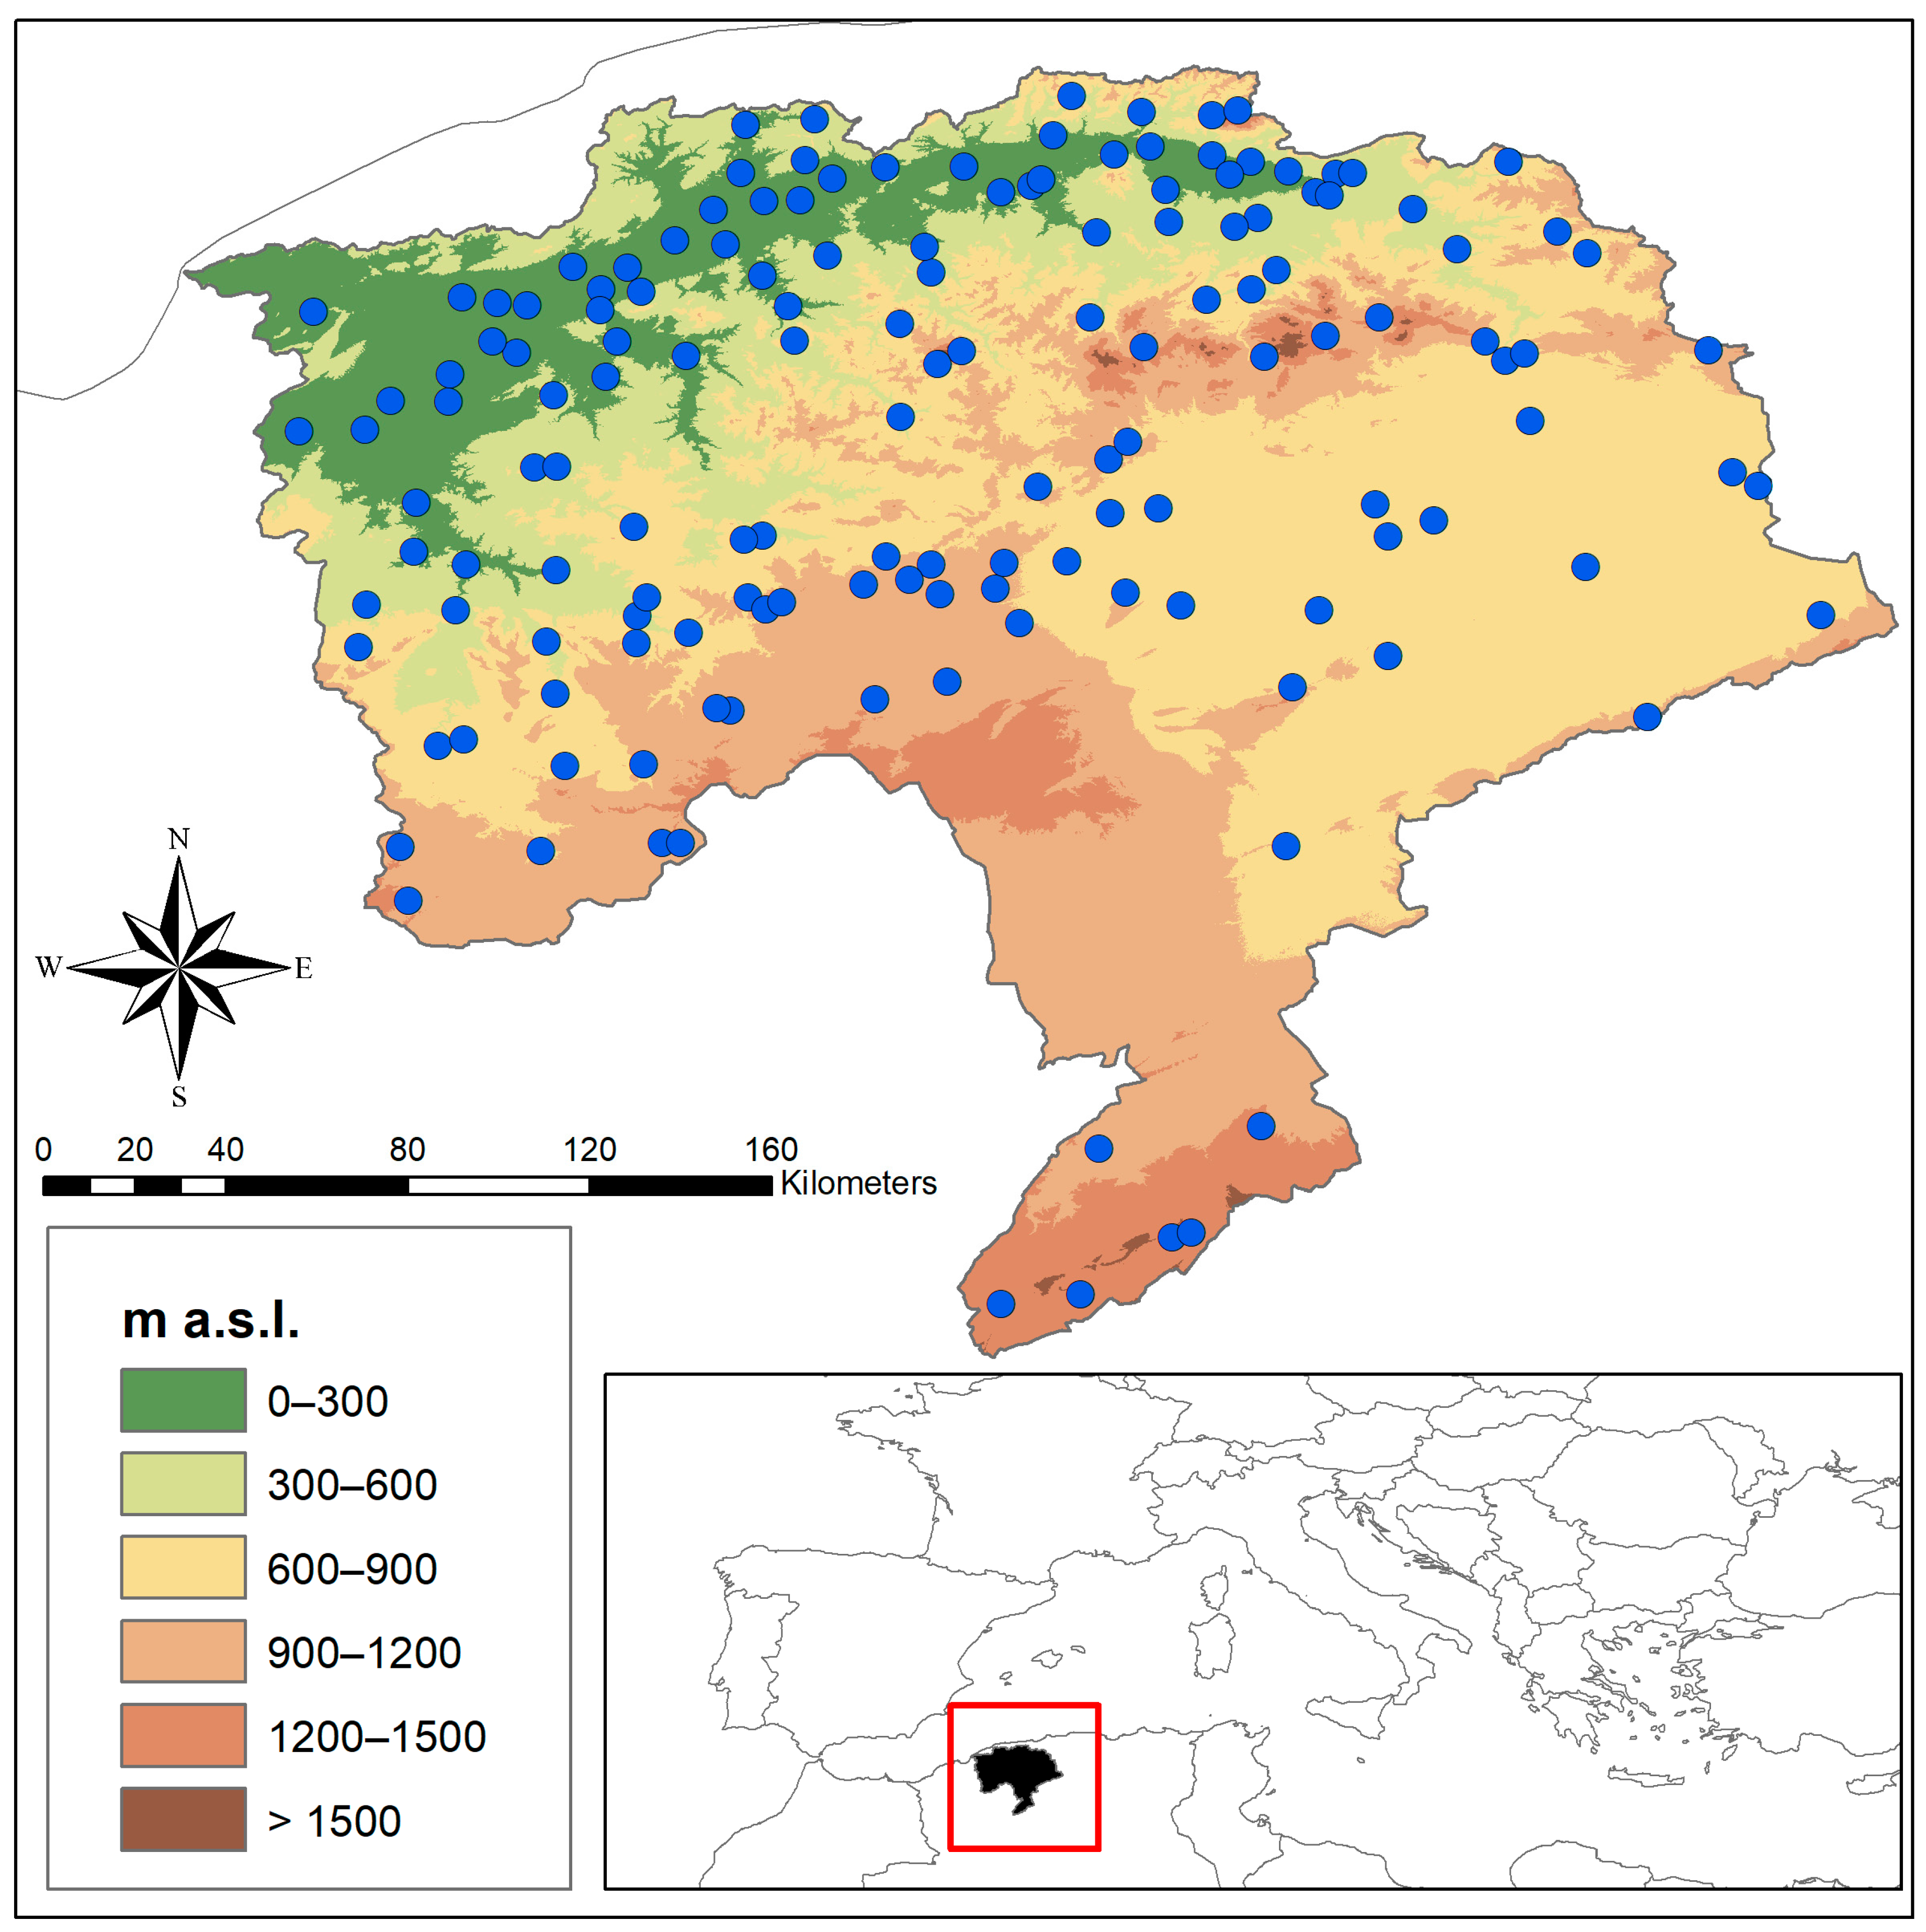
Figure 1. Illustration of study area. Blue dots identify the precipitation stations.
Atmosphere 15 01519 g001
Figure 2. Percentages of annual rainfall series present significant positive or negative trends, and spatial distribution of the stations shows significant precipitation trends.
Atmosphere 15 01519 g002
Figure 3. Results of the running trend analysis for the annual regional mean series.
Atmosphere 15 01519 g003
Figure 4. Experimental variograms with different temporal segments: (a) the full-time series, (b) 1970–1980, (c) 1980–1990, (d) 1990–2000, (e) 2000–2010, and (f) 2010–2017. In the X-axis, distance is expressed in metres.
Atmosphere 15 01519 g004aAtmosphere 15 01519 g004b
Figure 5. Spatial distribution of annual maximum precipitation (in mm).
Atmosphere 15 01519 g005
Figure 6. Scatter plots between observed and estimated daily maximum precipitation values.
Atmosphere 15 01519 g006
Disclaimer/Publisher’s Note: The statements, opinions and data contained in all publications are solely those of the individual author(s) and contributor(s) and not of MDPI and/or the editor(s). MDPI and/or the editor(s) disclaim responsibility for any injury to people or property resulting from any ideas, methods, instructions or products referred to in the content.