Article

Evaluating Ionospheric Total Electron Content (TEC) Variations as Precursors to Seismic Activity: Insights from the 2024 Noto Peninsula and Nichinan Earthquakes of Japan

by
Karan Nayak
1,*,
Rosendo Romero-Andrade
1,*,
Gopal Sharma
2,
Charbeth López-Urías
1,
Manuel Edwiges Trejo-Soto
1 and
Ana Isela Vidal-Vega
1
1
Faculty of Earth and Space Sciences, Autonomous University of Sinaloa, Culiacán 80040, Mexico
2
North-Eastern Space Application Centre, Umiam 793103, India
*
Authors to whom correspondence should be addressed.
Atmosphere 2024, 15(12), 1492; https://doi.org/10.3390/atmos15121492
Submission received: 7 November 2024 / Revised: 2 December 2024 / Accepted: 12 December 2024 / Published: 14 December 2024

Abstract

:
This study provides a comprehensive investigation into ionospheric perturbations associated with the Mw 7.5 earthquake on the Noto Peninsula in January 2024, utilizing data from the International GNSS Service (IGS) network. Focusing on Total Electron Content (TEC), the analysis incorporates spatial mapping and temporal pattern assessments over a 30-day period before the earthquake. The time series for TEC at the closest station to the epicenter, USUD, reveals a localized decline, with a significant negative anomaly exceeding 5 TECU observed 22 and 23 days before the earthquake, highlighting the potential of TEC variations as seismic precursors. Similar patterns were observed at a nearby station, MIZU, strengthening the case for a seismogenic origin. Positive anomalies were linked to intense space weather episodes, while the most notable negative anomalies occurred under geomagnetically calm conditions, further supporting their seismic association. Using Kriging interpolation, the anomaly zone was shown to closely align with the earthquake’s epicenter. To assess the consistency of TEC anomalies in different seismic events, the study also examines the Mw 7.1 Nichinan earthquake in August 2024. The results reveal a prominent negative anomaly, reinforcing the reliability of TEC depletions in seismic precursor detection. Additionally, spatial correlation analysis of Pearson correlation across both events demonstrates that TEC coherence diminishes with increasing distance, with pronounced correlation decay beyond 1000–1600 km. This spatial decay, consistent with Dobrovolsky’s earthquake preparation area, strengthens the association between TEC anomalies and seismic activity. This research highlights the complex relationship between ionospheric anomalies and seismic events, underscoring the value of TEC analysis as tool for earthquake precursor detection. The findings significantly enhance our understanding of ionospheric dynamics related to seismic events, advocating for a comprehensive, multi-station approach in future earthquake prediction efforts.

1. Introduction

Ionospheric Total Electron Content (TEC) studies have increasingly gained traction as a promising path for identifying and detecting seismic activity before the occurrence of an earthquake. This interest stems from the potential of TEC variations in the ionosphere, an ionized layer situated in Earth’s upper atmosphere, to serve as precursory indicators of impending seismic disturbances. The ionosphere’s electron density exhibits fluctuations influenced by various geophysical processes, including seismic events, making it a valuable target for investigation. Ground-based Global Navigation Satellite System (GNSS) receivers play a crucial role in TEC monitoring. These receivers analyze the time delays experienced by satellite signals as they pass through the ionosphere, providing data on ionospheric TEC variations. Anomalies in TEC data, both spatially and temporally, have been identified as potential precursors to earthquakes [1,2,3,4]. However, interpreting these anomalies requires careful consideration of unrelated ionospheric variability and the refinement of analysis techniques to distinguish seismic-related signals from background noise accurately. Researchers have proposed several coupling mechanisms to explain the relationship between ionospheric anomalies and seismic activity [5,6]. These mechanisms include the release of gasses from the Earth’s crust [7], stress-induced changes in conductivity [8], and piezoelectric effects resulting from rock deformation [9]. Studies have also suggested lineament variations as a seismic precursor for large events [10]. However, investigating these mechanisms requires interdisciplinary collaboration among seismologists, ionospheric physicists, and geophysicists to gain a comprehensive understanding of the complex processes involved.
The ionosphere part of the upper atmosphere undergoes influences from various geophysical processes, including those associated with seismic events. Changes in ionospheric electron density have been observed before earthquakes, making it a subject of significant interest in earthquake precursor research. TEC analysis offers a unique advantage in seismic prediction by detecting ionospheric disturbances days to weeks before earthquakes, complementing traditional methods like ground deformation monitoring. By distinguishing seismic-related TEC anomalies from solar and geomagnetic influences, TEC analysis enables cost-effective, real-time monitoring across large regions, advancing earthquake early warning systems. The study of TEC anomalies as earthquake precursors can be traced back to the 1990s, when advancements in satellite technology, like GPS, enabled scientists to monitor the ionosphere with greater accuracy. Early studies, such as [11], demonstrated that GPS networks could be used not only to observe surface deformation but also to monitor ionospheric TEC. Analyzing data from Taiwan’s GPS network, ref. [12] found significant decreases in TEC three to four days before the Chi-Chi earthquake. In a follow-up study, ref. [13] expanded their analysis to include all 20 M ≥ 6.0 earthquakes in Taiwan from September 1999 to December 2002, discovering that TEC anomalies, particularly reductions, often appeared one to five days prior to these seismic events. As the years passed, studies focusing on major earthquakes, including the 2004 Sumatra and 2008 Wenchuan events, continued to demonstrate that TEC anomalies often appeared in the days or hours leading up to large seismic occurrences. Researchers such as [13,14] were among those who showed that these anomalies were more than just coincidental, but separating them from other influences like solar activity and geomagnetic disturbances remained a significant challenge. This issue led to the development of more sophisticated statistical techniques, designed to improve the reliability of TEC anomaly detection. The devastating 2011 Tohoku earthquake in Japan provided key evidence of TEC disturbances before the quake, as observed by [15], and this event further highlighted the potential of ionospheric monitoring as part of earthquake research. In 2013, Heki and Enomoto [16] further explored TEC anomalies before large earthquakes, leveraging more refined statistical tools to improve detection. Machine learning methods, such as neural networks, started gaining traction soon after, helping to automate the analysis of large datasets, with applications such as support vector machines and decision trees being tested for TEC anomaly classification [17,18]. Refs. [19,20,21] also applied machine learning techniques to analyze TEC data, enhancing the accuracy of earthquake prediction efforts by filtering out non-seismic disturbances. Despite these improvements, more work remains in reducing false positives and confirming the validity of these anomalies as reliable precursors. More recently, several studies have reported promising results in detecting ionospheric disturbances before earthquakes. For example, a study focused on the 2023 Moroccan 6.8 Mw earthquake unveiled a geophysical connection between ionospheric TEC anomalies and the earthquake [22]. Other research has used ionosonde stations and GNSS data to model ionospheric TEC for earthquake precursors [23,24]. A combined approach using b-value and ionospheric GPS-TEC has also been proposed as a large earthquake precursor [25]. The development of a monitoring system for ionospheric TEC variability in earthquake studies is considered a relatively new but promising field [26]. These studies collectively suggest that monitoring variations in ionospheric TEC could potentially serve as a valuable tool for detecting short-term earthquake precursors. However, it is important to note that while the research in this area is promising, further validation and refinement of the methods are still needed before ionospheric TEC can be reliably used for earthquake precursors. Recent advancements in spatio-temporal modeling approaches, such as the work by Dai et al. [27] on optimal dispatch strategies for power systems considering air pollutant distributions, and by She et al. [28] on the impact of VOC emissions on urban air quality using spatially distributed models, underscore the importance of integrating spatial dynamics in environmental monitoring frameworks. These interdisciplinary methods provide valuable insights that can be adapted to enhance the resolution and reliability of ionospheric TEC anomaly detection.
One particular region of interest in the exploration of TEC as a potential precursor for earthquakes is the Noto Peninsula in Japan. This area has a notable history of seismic activity, exemplified by a significant 7.5-magnitude earthquake that occurred on 1 January 2024. The occurrence of this event has instigated extensive research efforts aimed at advancing our comprehension of precursory indicators and refining early warning systems. The earthquake off the west coast of Japan, on the island of Honshu, with a magnitude of 7.5, resulted from shallow reverse faulting in the Earth’s crust, presenting a distinctive seismic scenario [29]. This event transpired in a region where historical seismicity records have indicated lower rates compared to the major subduction zone along the east coast. Shallow earthquakes, such as this one, pose an elevated risk due to their proximity to the Earth’s surface, leading to more pronounced shaking and an increased potential for generating tsunamis. Eight major aftershocks of a magnitude more than five were also recorded within the span of a day after the main event (Figure 1). Despite the comparatively lower seismicity rates in the area, historical records reveal a noteworthy pattern. Since 1900, 30 earthquakes with a magnitude of 6 or higher have occurred within 250 km of the 1 January 2024 event (USGS). Notably, three of these earthquakes occurred on or near the Noto Peninsula, emphasizing the seismic vulnerability of the region. This study specifically focuses on investigating ionospheric TEC anomalies associated with the Mw 7.5 earthquake that occurred on 1 January 2024, on the Noto Peninsula. The objective is to provide valuable insights into the connection between ionospheric anomalies and impending seismic activity. Unlike previous studies, this research uniquely combines advanced regional spatial mapping methods with temporal TEC analysis across multiple stations to investigate the Mw 7.5 Noto Peninsula earthquake. It also introduces cross-event validation with the Mw 7.1 Nichinan earthquake to strengthen the reliability of TEC anomalies as seismic precursors, while systematically ruling out non-seismic influences through rigorous space weather filtering. Furthermore, this study innovatively incorporates Pearson correlation analysis across stations to quantify the spatial coherence of TEC anomalies with increasing distance, enabling the precise identification of the earthquake preparation area, and validating its alignment with Dobrovolsky’s theoretical radius. Understanding variations in ionospheric conditions during the pre-seismic period offers new perspectives on the intricate interplay between movements in the Earth’s crust and the upper atmosphere. The exploration of such phenomena not only contributes to our fundamental understanding of geophysical processes but also holds the potential to enhance capabilities in forecasting earthquake precursors.

2. Materials and Methods

In this study, a comprehensive analysis of ionospheric perturbations observed preceding the Mw 7.5 earthquake on the Noto Peninsula in 2024 is presented. Through a combination of data collection and analytical methods, the temporal and spatial characteristics of these perturbations were examined, aiming to illuminate their significance in the context of seismic activity. Data were gathered approximately 45 days before the earthquake from the International GNSS Service (IGS) network. The signals from 22 strategically positioned stations, accessible at https://cddis.nasa.gov/ (accessed on 8 January 2024), were instrumental in this analysis (Table 1). These GNSS signals, including those from the Global Positioning System (GPS), were crucial for calculating ionospheric TEC. The raw GNSS data obtained from the IGS network were preprocessed to ensure quality and reliability. Dual-frequency carrier-phase observations (L1 and L2) were used to correct for ionospheric and tropospheric delays. Missing data points were identified using an automatic screening algorithm that flagged signal-to-noise ratios below 30 dB-Hz. Outliers were removed through a 1.34-sigma statistical threshold on a 15-day running mean of TEC values. To ensure data accuracy, hardware biases and satellite clock errors were corrected using IGS-provided files, and the stability of vTEC values was cross-verified against modeled TEC data under quiet geomagnetic conditions. This preprocessing ensured the robustness of the derived TEC anomalies for further analysis. The selected ground-based stations in Japan and neighboring regions, strategically positioned for extensive spatial coverage, were located within the ~1680 km earthquake preparation zone (Dobrovolsky equation) [31], as shown in Figure 1.
The data used in this study were obtained in the Receiver Independent Exchange (RINEX) format, which undergoes a series of processing steps to estimate the vertical Total Electron Content (vTEC) from slant Total Electron Content (sTEC), a key parameter for studying ionospheric disturbances. Slant TEC (sTEC) is the TEC measured along the oblique path of the satellite signal through the ionosphere, while vertical TEC (vTEC) represents the TEC corrected to a vertical path directly above the receiver, assuming a single-layer ionospheric model at a fixed height of 350 km. The primary inputs for this estimation were the pseudo-range codes P1 and P2, which are derived from signals transmitted by the GNSS satellites and recorded by ground-based receivers. These pseudo-ranges are the time delays between the satellite and the receiver, calculated by measuring the time taken for the signals to travel from the satellite to the receiver. In addition to the pseudo-ranges, carrier phase observations, denoted by L1 and L2, were used. The L1 and L2 carrier signals correspond to two different frequencies broadcast by GNSS satellites: f1 (1.57542 GHz) for L1 and f2 (1.22760 GHz) for L2. These dual-frequency signals are crucial because they allow for the correction of ionospheric errors, which are frequency-dependent. An improved estimate of the ionospheric delay can be obtained by examining the variation in travel time between the L1 and L2 frequencies. A well-established technique in GNSS-based ionospheric investigations, this method combines pseudo-range and carrier phase data to provide the basis for computing the sTEC, which is the total electron content along the path between the satellite and the receiver [32]. The basic equation for the sTEC calculation is given by Equation (1).
sTEC = 1 40.3 ( f 1 2 · f 2 2 f 1 2 f 2 2 )   ( L 1 λ 1 L 2 λ 2 )
where f1 and f2 are the carrier frequencies for the L1 and L2 signals and 40.3 is a constant derived from the physical properties of the Earth’s ionosphere and electromagnetic waves.
However, to make the data more comparable across stations and observation times, it is necessary to convert the obtained sTEC to vertical TEC (vTEC), which represents the electron content vertically above the receiver. To perform this conversion, we assume a single-layer ionospheric model, where all electrons are concentrated at a specific height, typically around 350 km above the Earth’s surface [33,34]. The conversion is performed using the following relationship, as derived in Equation (2).
vTEC = sTEC × cos ( z )
where vTEC is the vertical TEC, sTEC is the slant TEC, and z is the zenith angle of the satellite relative to the receiver. The zenith angle z is related to the elevation angle θ of the satellite through the following equation (Equation (3)):
cos ( z ) = 1 ( R E × cos ( θ ) R E + h ) 2
where RE is the radius of the Earth, h is the assumed height of the ionospheric layer, and θ is the elevation angle of the satellite.
Once vTEC was computed, the diurnal temporal behavior of TEC was analyzed. To detect anomalies, a 15-day running mean and standard deviation of one-minute TEC data were calculated for each station. The anomalies were identified by deviations beyond a pre-defined threshold, as suggested in previous studies [22,25,35,36,37]. The threshold for defining an anomaly was set using Equation (4).
TEClimit = X ± 1.34α
where X is the mean and α is the standard deviation.
Time series analysis was conducted on the closest CORS stations, namely USUD and MIZU, from the epicenter location. Anomalies were identified when vTEC values fell below a specified limit. Specifically, anomalies in low TEC values were focused on, as higher TEC values are typically associated with external phenomena rather than earthquakes [25,35]. The determination of the Peak Negative Anomaly (PNA) time was accomplished using Equation (5) [22,36].
PNA = LL − vTEC
where PNA is the Peak Negative Anomaly, LL is the Lower Limit, and vTEC is the vertical TEC.
The study also incorporated space weather analysis, specifically examining three key indicators, Dst, Kp, and F10.7, to assess the tranquility of the space environment. Recognizing the potential impact of heightened geomagnetic or solar activity on ionospheric anomalies, the analysis exclusively focused on periods marked by subdued geomagnetic conditions. This restriction involved selecting instances with Kp values below 5, Dst greater than −50 nT, and F10.7 registering below 150, indicative of low solar activity levels. By analyzing data under these conditions, the intention was to identify anomalies linked to seismic activity, undisturbed by the influences of geomagnetic storms or solar flares.

3. Results and Discussions

The Noto Peninsula earthquake in Japan, with a magnitude of 7.5, had a profound impact, affecting an expansive area of approximately 1680 km around the epicenter. Figure 2 illustrates the recorded TEC variations at the nearest station, USUD, located 181 km from the epicenter, over the 30-day period leading up to the main seismic event on 1 January 2024. The analysis highlights significant ionospheric activity, including distinct negative TEC anomalies between 7 and 10 December 2023, and positive anomalies on December 2, 19, and 21, with deviations exceeding 5 TECU. The shaded regions in black and green on the graph mark instances where TEC values surpassed the thresholds established by Equation (4).
Among the anomalies, the sharp negative TEC deviation, exceeding 5 TECU on December 7 and 8, stands out as particularly noteworthy. These anomalies occurred 23 and 22 days before the earthquake and could be potential precursors to the seismic event. The calculation of the PNA time for these two anomaly days yielded values of 3.367 and 3.117 UTC, respectively, as determined by Equation (5), with both occurring at nearly the same time. The local time during the PNA for both days was around noon according to Japan Standard Time (JST), where ionospheric TEC concentration tends to rise due to the presence of an eastward electric field around the geomagnetic equator [38,39]. While Japan, situated in the northern hemisphere, is less impacted by this phenomenon, this observation underscores the potential of TEC variations as seismic precursors, particularly the substantial negative anomaly occurring weeks before the earthquake event.
To validate our temporal TEC time series analysis, we have examined data from another nearby station, MIZU, positioned at a 385 km aerial distance from the epicenter. The TEC dynamics are visually represented in Figure 3, revealing patterns of anomalies similar to those observed at USUD (Figure 2). Notably, positive anomalies were evident on December 2, 19, and 21, mirroring the occurrences at the USUD station. Likewise, significant negative anomalies were observed on December 7 and 8. The TEC patterns at MIZU closely resembled those at the USUD station, further affirming the consistency and reliability of the observed anomalies across different stations. This cross-validation enhances the robustness of our temporal TEC analysis, reinforcing the significance of the identified patterns leading up to the seismic event on 1 January 2024.
In addition to examining ionospheric TEC variations, we accounted for the influence of space weather by retrieving geomagnetic storm intensity and solar flare activity data from the National Oceanic and Atmospheric Administration (NOAA). Geomagnetic and solar activity can induce ionospheric disturbances, which must be considered when interpreting TEC anomalies as potential seismic precursors [40,41,42]. To determine whether TEC anomalies were directly related to seismicity or indirectly influenced by space weather factors, we conducted a detailed analysis of geomagnetic and solar activity during the study period. Data for three key indices—Dst, Kp, and F10.7—with only periods with geomagnetically calm conditions (Dst > −50 nT, Kp < 5, and F10.7 < 150) were included in the analysis to minimize the influence of external factors. To assess potential delays in the impact of space weather on TEC, we examined the temporal relationship between space weather variability and TEC anomalies, finding no significant lagged effects. Positive TEC anomalies coinciding with elevated Kp or Dst values were excluded from the analysis to avoid confounding. In contrast, the most significant negative TEC anomalies occurred during geomagnetically quiet periods, supporting their seismogenic origin. Figure 4 presents the fluctuations in space weather indices, including the solar radio flux (F10.7) and geomagnetic indices (Kp and Dst) for the months of November and December 2023.
Figure 4 indicates that F10.7 remained consistently elevated, except during the period from 2 December to 17 December, suggesting low solar activity with minimal influence on the ionosphere during this time. Similarly, the Kp and Dst indices point to geomagnetically calm conditions during this period, with values falling below the established thresholds for geomagnetic storms. However, a severe geomagnetic storm occurred on 1 December, lasting until midday on 2 December, and additional geomagnetic disturbances were recorded on 26 November, 18 December, and 19 December, potentially impacting the ionosphere on these dates. Notably, the significant positive TEC anomalies recorded on 2, 19, 21, and 25 December (as shown in Figure 2 and Figure 3) coincided with periods of heightened space weather activity. This suggests that the positive TEC deviations could be attributed, at least in part, to the influence of geomagnetic storms and solar activity on the ionosphere during these days. In contrast, during the period of negative anomalies, specifically from 7 December to 10 December, the space weather indices showed calmer conditions, with Kp and Dst values below the threshold. This lack of geomagnetic disturbance suggests that the drop in TEC observed during this time is more likely linked to a seismogenic origin, further supporting the hypothesis that these ionospheric variations may have been precursors to the earthquake on 1 January 2024. The attribution of positive TEC anomalies to geomagnetic storms was based on a combination of temporal correlation with geomagnetic indices and known ionospheric responses to geomagnetic activity. While geomagnetic storms are often associated with positive TEC enhancements due to increased ionization from storm-time electric fields and particle precipitation, they can also induce negative TEC responses in certain regions due to neutral composition changes or disturbed electrodynamics [43,44]. This dual behavior underscores the complexity of geomagnetic effects on the ionosphere. To address this complexity, we carefully examined the temporal relationship between positive TEC anomalies and geomagnetic indices during the study period. For anomalies observed during geomagnetically quiet periods, we analyzed their spatial coherence and proximity to the earthquake preparation zone to differentiate seismogenic anomalies from residual storm effects or other non-seismic influences. This approach minimizes the risk of arbitrarily attributing positive TEC anomalies to geomagnetic storms and ensures that the interpretation is grounded in established ionospheric physics.
Given that the positive anomalies were largely attributed to space weather effects, the research shifts focus toward analyzing negative anomalies. The TEC time series from the nearest epicentral station, USUD, was examined, with anomalous variations defined as TEC depletions exceeding a threshold of 3 TEC units (3 × 10¹⁶ electrons/m2), while excluding days influenced by space weather phenomena. Significant instances of TEC depletion were notably observed on 7 and 8 December 2023, as shown in Figure 5. Negative pre-earthquake TEC anomalies observed in this study are hypothesized to arise from lithosphere–atmosphere–ionosphere coupling (LAIC) processes [5,6,45]. One potential mechanism involves stress accumulation in the Earth’s crust, which leads to changes in conductivity and generates electric fields propagating upward into the ionosphere. These fields can modify the distribution of ionospheric electrons, resulting in localized TEC depletions [8,46,47]. Additionally, the piezoelectric effect, triggered by tectonic stress may induce electromagnetic emissions, further influencing ionospheric electron density [9,48]. Gas release from the Earth’s crust, particularly radon, can also ionize the lower atmosphere, causing perturbations in the ionosphere [7,49]. In the context of this study, the dominant mechanism is likely the stress-induced generation of electric fields, as the significant negative TEC anomalies coincide spatially with the earthquake preparation zone, occurring near the epicenter, and temporally with calm space weather conditions. These findings are consistent with Dobrovolsky’s theoretical earthquake preparation area, suggesting a strong seismogenic origin. However, further interdisciplinary research is required to quantify the contributions of these mechanisms and their interactions. This focused exploration of TEC depletions aims to unveil distinctive patterns associated with seismic activity.

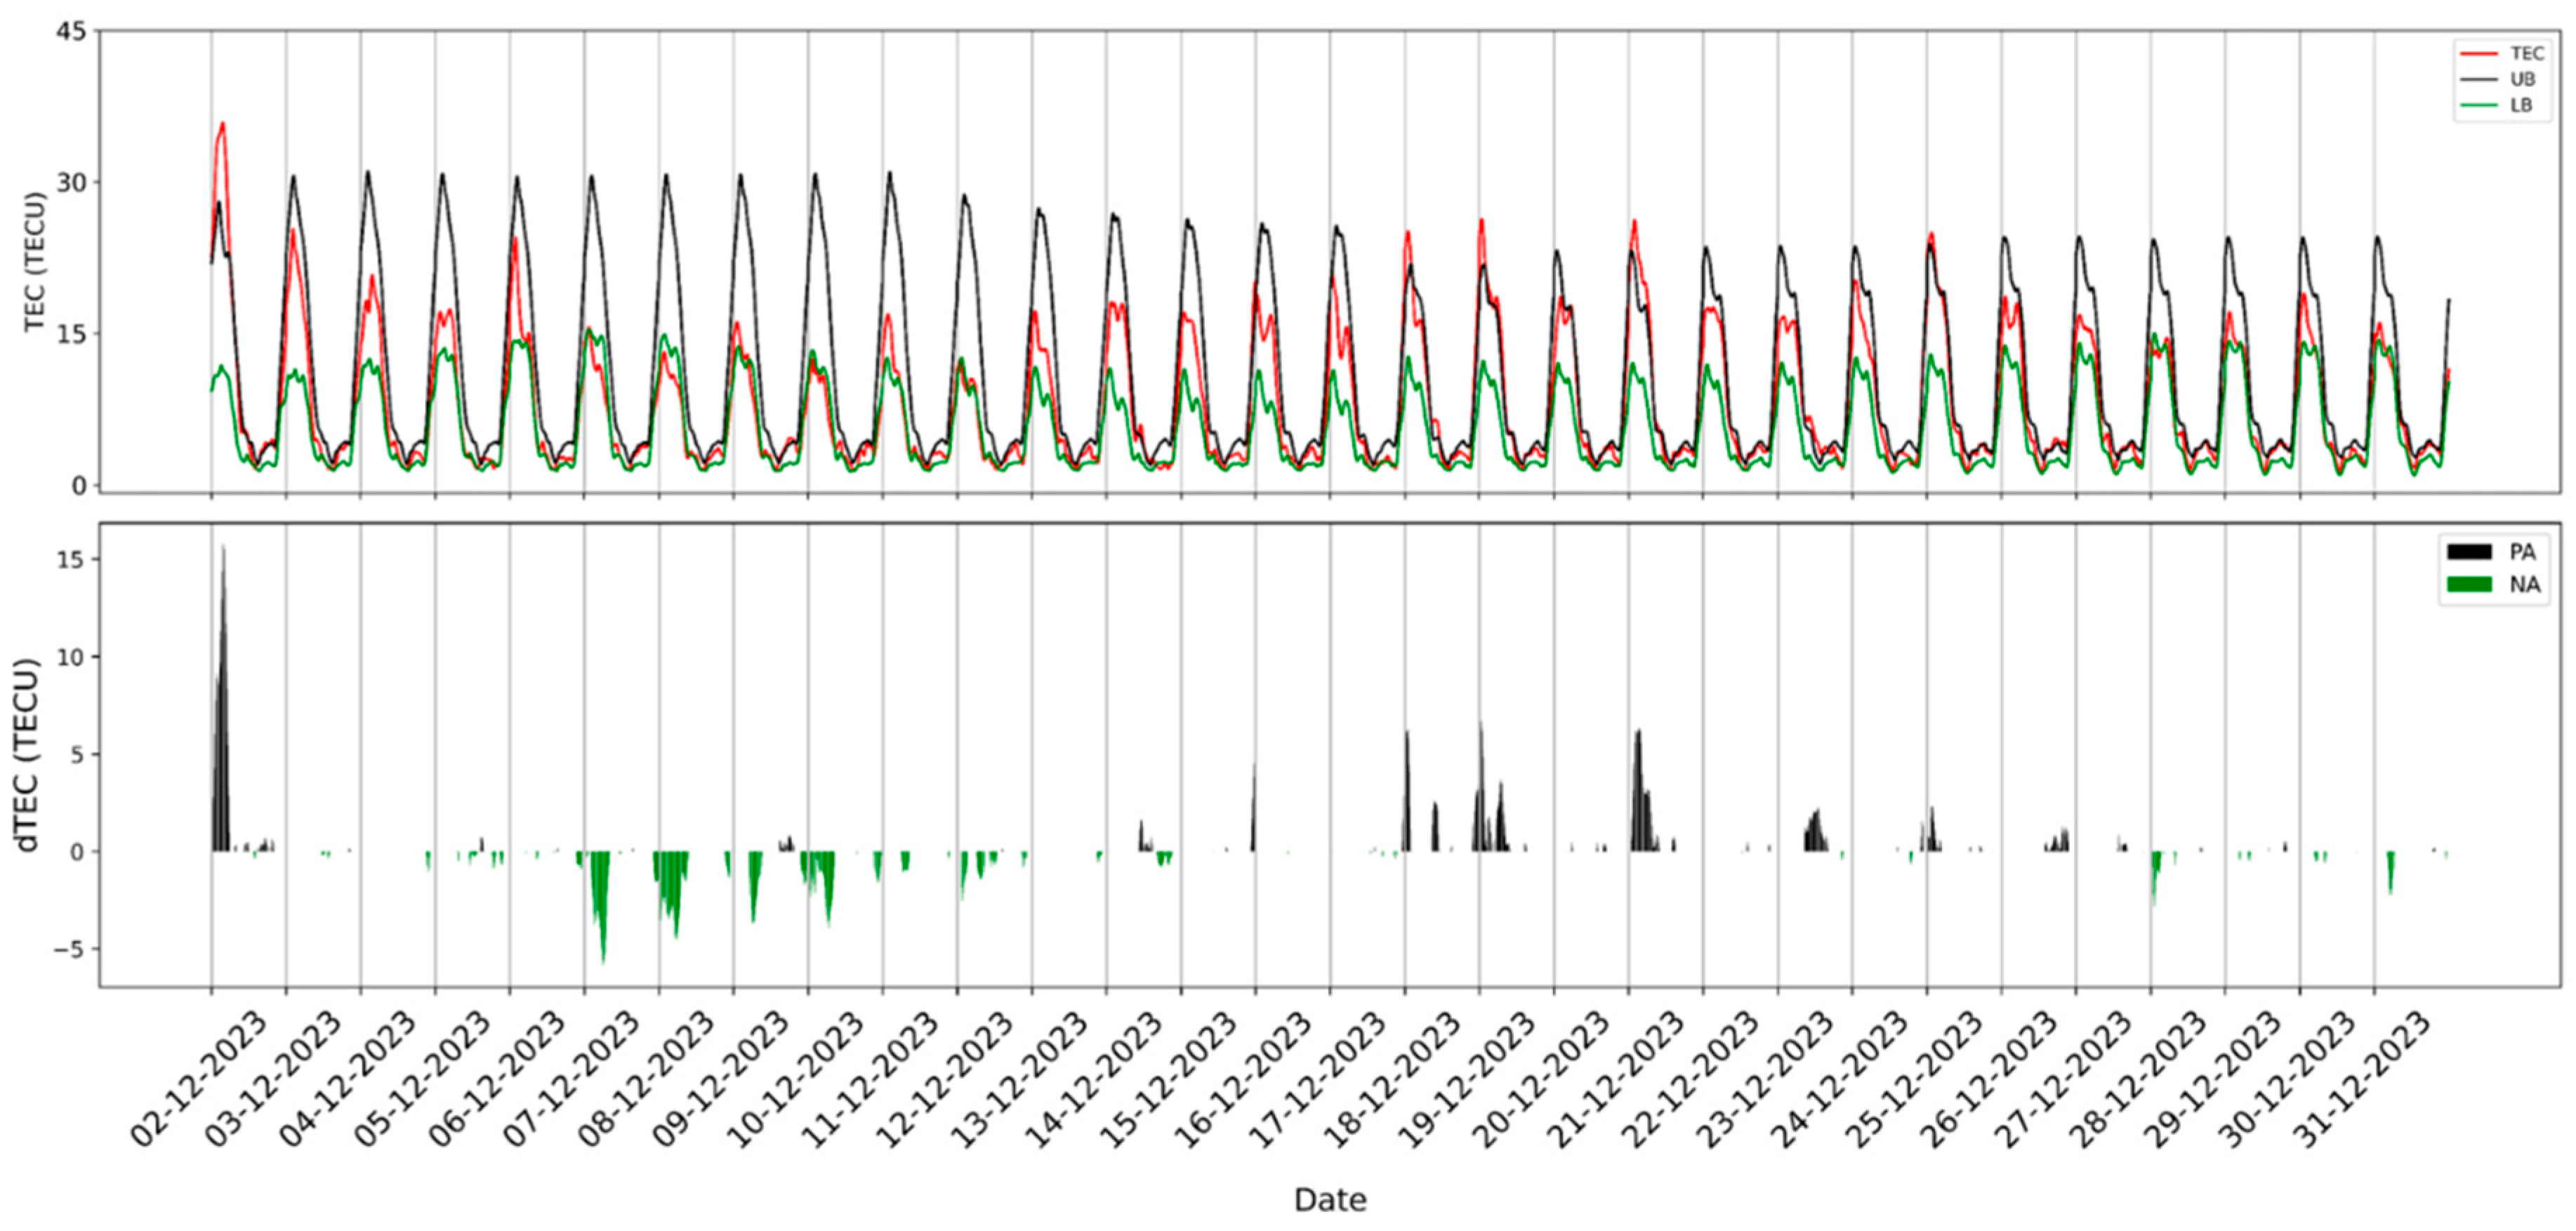
3.1. Anomaly of 7 December 2023

The anomaly observed on 7 December was identified as the most prominent negative anomaly, unaffected by any solar or geomagnetic influences, making it particularly relevant for seismic precursor analysis. For this day, the PNA was calculated to be 5.175 TECU, with the anomaly time detected at 3.367 UTC. Utilizing the strategic placement of 22 stations, as outlined in Table 1, which cover the earthquake preparation region, a detailed spatial distribution of TEC values was constructed. This comprehensive mapping allowed for a more precise understanding of ionospheric disturbances in relation to the earthquake. Figure 6 presents a graphical representation of the PNA recorded on 7 December 2023, in relation to the distance of each CORS station from the epicenter. The graph reveals a clear correlation between the TEC values and their proximity to the earthquake preparation zone. Specifically, the data show a trend where TEC values decrease at a rate of 0.0097 TECU per kilometer as the distance to the epicenter decreases. This trend strongly suggests that stations closer to the epicenter experience more significant negative TEC anomalies, indicating a direct relationship between the proximity to the earthquake and the intensity of ionospheric disturbances.
To further analyze the relationship of TEC variations with distance, Figure 7 illustrates both the Pearson correlation and p-value as a function of increasing distances between stations. The Pearson correlation values start high at shorter distances, indicating strong similarity in TEC measurements from nearby stations, but they decline with increasing distance, suggesting that ionospheric disturbances become less similar over larger distances. Notably, the correlation deteriorates significantly beyond 1600 km, aligning with Dobrovolsky’s proposed earthquake preparation area radius [31], which indicates a potential threshold for regional coherence in TEC disturbances related to seismic activity. This trend is represented by the linear trend line y= −0.00019x + 1.08579, showing a gradual decrease in correlation per kilometer, while the p-values remain close to zero across all distances, confirming the statistical significance of the correlations. The observed spatial decay suggests that ionospheric disturbances have a regional influence, with stronger correlations detected between closer stations. Within approximately 1600 km, TEC anomalies are more coherent, supporting their potential link to seismic activity, whereas disturbances beyond this range are less likely to be directly related to seismic processes. This spatial decay pattern aligns with Dobrovolsky’s theoretical earthquake preparation radius, reflecting the extent of stress accumulation and crustal deformation leading up to the event. The decline in correlation beyond 1600 km suggests a weakening of LAIC processes at greater distances from the epicenter, consistent with stress propagation theories. Understanding this distance–decay relationship can help refine models and enhance interpretation of ionospheric signals as earthquake precursors, with data from closer stations offering more reliable predictive insights.
The spatial mapping of vTEC values across the study region provided a vivid visualization of electron density variations, crucial for identifying anomalous TEC patterns and understanding their evolution associated with the earthquake on 1 January 2024. Kriging interpolation was utilized to precisely map the stations [50,51], providing a comprehensive visual overview of electron density variations. This method improves the identification of spatial patterns and the tracking of dynamic changes in electron density, both of which are essential for seismic precursor analysis. Kriging was chosen for its ability to incorporate spatial autocorrelation, enabling more accurate predictions for TEC data, which frequently displays such dependencies. As shown in Figure 8, the color-coded regions correspond to different PRN’s vTEC ranges, with the most significant TEC depletions concentrated near the epicenter, represented by the red zone (12.8–14 TECU). Stations closest to the epicenter recorded the most notable TEC anomalies, reinforcing the strong spatial correlation between ionospheric disturbances and the earthquake’s proximity. A consistent pattern of decreasing TEC values, at a rate of 0.0097 TECU per kilometer as one moves closer to the epicenter, supports the hypothesis that ionospheric anomalies intensify within the earthquake preparation zone. While stations farther from the epicenter also displayed negative TEC anomalies, these were less pronounced, suggesting that the most substantial disturbances are concentrated in the immediate vicinity of the epicenter. Figure 8 further illustrates that stations within 1600 km of the epicenter displayed more pronounced TEC anomalies compared to those further away.

3.2. Anomaly of 8 December 2023

On the anomaly day of 8 December, the calculated PNA amounted to 4.975 TECU, with the anomaly time detected at 3.117 UTC. Employing the same set of 22 stations within the study region, the graphical representation of the PNA for the anomaly day, 8 December, concerning its distance from the epicenter, is depicted in Figure 9. Similarly to the preceding anomaly day, the graph reveals a discernible correlation between TEC values and their proximity to the earthquake preparation zone near the epicenter, underscoring a trend where TEC values decrease at a rate of 0.0064 TECU per kilometer. This finding indicates that proximity to the epicenter is associated with a reduction in TEC values, mirroring the pattern observed in the previous anomaly. However, the rate of TEC decrease in the second anomaly is lower than that of the first, which corresponded to 0.0097 TECU/km. This difference can be attributed to the higher PNA observed in the first anomaly compared to the 4.975 TECU of the second. This variation in TEC behavior can also be linked to the ionospheric recovery phase, during which disturbances begin to dissipate and redistribute following the initial stress and buildup from tectonic activity. The recovery phase contributes to a slower rate of TEC decrease as the ionosphere starts to stabilize. Nevertheless, further research is warranted to gain a comprehensive understanding of TEC variations concerning distance from the epicenter, particularly considering the impact of the ionospheric recovery phase.
Figure 10 shows the relationship between distance and both Pearson correlation and p-value for TEC anomalies observed the day after the primary anomaly associated with the 1 January 2024 earthquake. As with the previous day, Pearson correlation is high at shorter distances, indicating strong similarity in TEC measurements near the reference station, but it decreases with distance, suggesting weaker coherence over larger areas. The linear trend, given by y = −0.00023x + 1.10322, shows a slightly faster decay in correlation than the prior day, implying that TEC anomalies are dispersing more rapidly. The more rapid weakening of spatial correlation in TEC anomalies on the day following the primary anomaly likely reflects the natural dissipation of ionospheric disturbances as tectonic stress diminishes and the ionosphere enters a recovery phase. On the primary anomaly day, TEC variations are more coherent and concentrated, directly influenced by tectonic activity. However, as time progresses, these disturbances become more dispersed and are increasingly affected by external ionospheric factors, leading to a faster decline in correlation with distance. This recovery phase further contributes to the diffusion of anomalies, suggesting that the diagnostic value of TEC anomalies as earthquake precursors is strongest near the primary anomaly day. The p-values remain close to zero across all distances, confirming the statistical significance of these correlations. Notably, correlation deterioration is pronounced beyond 1600 km, aligning with Dobrovolsky’s proposed earthquake preparation area and reinforcing the idea that TEC anomalies are most coherent within this proximity. This consistent spatial decay pattern across both days suggests a stable, localized influence of the earthquake on TEC measurements, supporting the potential use of TEC anomalies as earthquake precursors within a defined radius around the epicenter.
A notable observation from this spatial distribution underscores the significant alignment of the anomaly zone with the anticipated earthquake’s epicenter, as observed in Figure 11. Notably, in close proximity to the epicenter, diminished TEC concentration was exhibited, akin to the anomaly observed the day before, underscoring its pivotal role in capturing ionospheric anomalies linked to the impending seismic event. In this context, the most prominent negative TEC anomaly was identified to the north-east of the epicenter; with the USUD station being the closest, it emerged as the station most significantly affected by these ionospheric anomalies, further accentuating its crucial role in comprehending seismic events.
The results demonstrate that the most significant TEC depletions occurred in the absence of space weather influences, underscoring their potential as reliable seismic precursors. The application of Kriging interpolation provided a detailed and smooth spatial representation of the 22 CORS stations, enhancing our understanding of how ionospheric TEC variations reflect seismic processes and potentially serve as early warning indicators for future seismic events.
To evaluate the consistency of TEC anomalies across different regions, we also analyzed the spatial distribution of TEC leading up to the 8 August 2024 Mw 7.1 earthquake northeast of Nichinan, Japan. This earthquake occurred approximately 825 km from the analyzed Noto Peninsula earthquake epicenter, resulting from thrust faulting at shallow depth near the subduction zone interface between the Philippine Sea plate and the Eurasian plate (USGS). Given Japan’s status as one of the most seismically active regions in the world, it serves as an ideal setting to further investigate the reliability of ionospheric TEC anomalies as seismic precursors. For this analysis, the nearest GNSS station used for the time series was AIRA, located around 85 km from the epicenter. Notably, TEC anomalies exceeding 3 TECU were observed on 23, 24, 28 July, and 4 August 2024. Among these, the most significant negative anomaly was recorded on July 28, approximately 10 days prior to the earthquake, with a PNA that amounted to around 9 TECU. This prominent anomaly aligns with the observed patterns of TEC depletion commonly associated with seismic activity. Furthermore, the space weather conditions were checked, and it was confirmed that the ionosphere was calm during these days, ruling out any solar or geomagnetic influences, as reported in Appendix A. This strengthens the likelihood that the detected anomalies were triggered by seismic activity rather than external space weather effects.
The time series data from the AIRA station, shown in Figure 12, illustrates TEC variations 30 days prior to the event. The clear detection of a prominent negative anomaly on 28 July further validates the potential of TEC anomalies as precursors for earthquakes. The ability to observe similar TEC disturbances in multiple seismic events across different regions of Japan suggests that ionospheric responses to seismic processes may follow consistent patterns. These findings contribute to the growing evidence that monitoring ionospheric TEC variations can provide valuable insights into earthquake prediction and highlight the need for continued investigation of TEC anomalies in seismically active regions.
On the anomaly day of 28 July 2024, the PNA time was calculated to be 3.85 UTC. Covering an earthquake preparation area of approximately 1130 km, 17 GNSS stations were strategically positioned around the epicenter. The graphical representation of the PNA for 28 July, utilizing the data from the 17 stations, shown in Figure 13, highlights the relationship between TEC values and their distance from the epicenter. Similar to the findings from the Noto Peninsula earthquake, the graph reveals a clear correlation between TEC values and proximity to the earthquake preparation zone. Specifically, the data show a decreasing trend in TEC values at a rate of 0.0076 TECU per kilometer as the distance to the epicenter decreases. This observation reinforces the idea that proximity to the epicenter is linked to a reduction in TEC values, mirroring the pattern observed in the previous study. These findings further suggest that ionospheric TEC depletions are closely tied to seismic activity, with a consistent relationship between the magnitude of TEC anomalies and the distance from the earthquake epicenter.
The relationship between distance and both Pearson correlation and p-value for TEC anomalies associated with another earthquake in Japan reveals a clear pattern of spatial decay. As shown in Figure 14, Pearson correlation values are high at shorter distances, indicating strong similarity in TEC measurements near the reference station, but gradually decrease as distance increases, suggesting a weakening of TEC coherence over larger areas. The linear trend line, represented by y = −0.00022x + 1.07195, shows a steady negative slope, capturing this spatial decay, likely influenced by local ionospheric dynamics within the earthquake preparation zone. The p-values, depicted by the black line, remain close to zero across all distances, confirming the statistical significance of these correlations and reinforcing that the observed patterns are not due to random variations. The correlation decay remains pronounced up to around 1000 km, supporting the hypothesis that TEC anomalies are most coherent within a specific proximity to the epicenter, as defined by Dobrovolsky. This consistent spatial decay across multiple earthquakes in the region suggests a stable ionospheric response to seismic activity in Japan, highlighting the potential of TEC anomalies as reliable earthquake precursors, with the strongest signals appearing closer to the epicenter.
Using Kriging interpolation, a spatial mapping of the PNA for the anomaly day of 28 July 2024 was produced, as shown in Figure 15. This approach provided a detailed visualization of TEC anomalies across the earthquake preparation zone. The map reveals a distinct concentration of the most significant TEC anomaly, with values ranging from 7.1 to 7.5 TECU, located just below the epicenter within the AIRA station. This anomaly closely aligns with the epicentral region, reinforcing the observed relationship between ionospheric disturbances and seismic activity, as seen in the Noto Peninsula earthquake. The findings suggest a localized ionospheric response triggered by seismic activity. These results align with the hypothesis that ionospheric TEC depletions intensify as one approaches the epicenter.
The negative TEC anomalies observed 20–30 days before the seismic events were carefully analyzed to determine their seismogenic origin, considering the possibility of large day-to-day ionospheric variations even under geomagnetically quiet conditions. Day-to-day ionospheric variability is often influenced by localized atmospheric conditions, tropospheric weather, or tidal effects and can manifest as significant TEC fluctuations [52]. To minimize the impact of these natural variations, we applied a 15-day running mean and standard deviation method to define anomaly thresholds. TEC anomalies were identified only when the deviations exceeded ±1.34σ of the mean, as recommended by prior studies [3,22,23,35]. Additionally, we conducted a temporal comparison of TEC anomalies against known drivers of ionospheric variability, such as changes in F10.7 levels and diurnal patterns, to rule out external influences. While it is true that F10.7 levels were slightly reduced during the study period, these anomalies were temporally consistent across multiple stations near the earthquake preparation zone, indicating a localized and coherent spatial pattern distinct from random day-to-day variations. Moreover, these anomalies align well with Dobrovolsky’s theoretical earthquake preparation radius, suggesting a seismogenic origin rather than atmospheric or ionospheric noise.
The TEC anomalies for the two events also revealed notable similarities and differences shaped by their distinct geophysical and environmental contexts. The larger magnitude (Mw 7.5) and shallower depth (~10 km) of the Noto Peninsula earthquake resulted in more pronounced and coherent TEC anomalies compared to the Mw 7.1 Nichinan earthquake, which occurred at a greater depth (~24 km). Shallow reverse faulting in the Noto event, associated with vertical displacement, likely generated stronger electric fields, while the Nichinan earthquake, involving thrust faulting near a subduction zone, exhibited weaker TEC anomalies and faster spatial decay. The Noto event’s moderate seismicity region produced isolated and clearer TEC signals, whereas the Nichinan event’s active tectonic environment lightly influenced the anomaly patterns. Both events were analyzed under geomagnetically calm conditions; however, the Noto event exhibited higher spatial coherence of anomalies, potentially due to quieter space weather conditions enabling more distinct detection. Additionally, the lead time of TEC anomalies differed, with the Noto event showing a longer lead time, possibly attributable to stress accumulation patterns and its tectonic characteristics.
These findings underscore the significance of TEC anomalies as potential seismic precursors while also highlighting the influence of factors such as earthquake magnitude, depth, fault type, tectonic settings, and local space weather conditions in shaping their characteristics. To further enhance earthquake prediction capabilities, integrating multiple parameters such as geomagnetic indices, atmospheric radon emissions, ground deformation, and seismicity indicators like the b-value could provide complementary insights into the LAIC process. For example, combining TEC anomalies with radon emissions or ground-based measurements of crustal stress could help differentiate seismogenic signals from non-seismic disturbances. Additionally, analyzing the correlation between TEC and other atmospheric or geophysical parameters under geomagnetically calm conditions could reveal synergistic patterns that improve the reliability of earthquake prediction models. Recent advancements in machine learning and data assimilation techniques also provide an opportunity to integrate these multi-parameter datasets for more accurate and timely predictions. Future research should focus on developing frameworks that combine these parameters across spatial and temporal scales to establish consistent and robust correlations with seismic activity, potentially leading to breakthroughs in short-term earthquake forecasting.

4. Conclusions

This study provides a thorough examination of ionospheric perturbations preceding the Mw 7.5 earthquake on the Noto Peninsula in 2024, while also expanding the analysis to include the 8 August 2024 Mw 7.1 earthquake northeast of Nichinan, Japan. By leveraging data from the IGS network, the focus on TEC anomalies, incorporating meticulous spatial mapping and temporal pattern analysis, reveals a clear trend of TEC depletions linked to seismic activity. For the Noto Peninsula earthquake, the observed decline in TEC values at rates of 0.0097 and 0.0064 TECU per kilometer towards the epicenter for each anomaly day, respectively, underscores the localized impact of ionospheric disturbances within the earthquake preparation zone. A substantial negative anomaly exceeding 5 TECU, observed 23 and 22 days before the Noto earthquake, emphasizes the potential of TEC variations as seismic precursors. Positive anomalies coinciding with periods of intense space weather conditions were identified, yet the most significant negative anomalies were observed in the absence of such influences, suggesting a seismogenic origin. Further analysis of the spatial correlation of TEC anomalies with distance for the earthquake revealed that Pearson correlation values remained high at shorter distances, indicating strong coherence in TEC measurements near the epicenter. However, this correlation decreased steadily with distance, reflecting a spatial decay in TEC coherence. For both anomaly days, this trend was captured by a linear decay model, with Pearson correlation values declining at rates of approximately 0.00019 and 0.00023 per kilometer in each respective analysis. Notably, the correlation decay became more pronounced beyond 1600 km, aligning with Dobrovolsky’s proposed earthquake preparation area radius and supporting the idea that TEC anomalies are most coherent within this proximity to the epicenter. Additionally, the spatial correlation of TEC anomalies was strongest near the primary anomaly day, while on subsequent days, the ionosphere entered a recovery phase, leading to the dissipation and spread of disturbances over larger areas. The use of Kriging interpolation to spatially map these anomalies further underscores their close alignment with the epicentral region, reinforcing the significance of ionospheric disturbances as potential earthquake precursors.
The analysis of the Mw 7.1 Nichinan earthquake adds weight to these findings, revealing TEC anomalies exceeding 3 TECU in the days leading up to the event, with a prominent negative anomaly of 9 TECU observed on 28 July 2024, approximately 10 days prior to the earthquake. As with the Noto Peninsula event, these TEC depletions showed a consistent spatial relationship with the epicenter, with a decline in TEC at a rate of 0.0076 TECU per kilometer. The absence of space weather influences on these days further strengthens the hypothesis that these anomalies were induced by seismic activity. Additionally, the Pearson correlation rate of decline, at 0.00022 per kilometer, with a more pronounced decay beyond 1000 km, aligns with Dobrovolsky’s earthquake preparation area. The consistent patterns of TEC disturbances across two significant earthquakes in different regions of Japan reinforce the reliability of TEC analysis as a tool for detecting potential seismic precursors.
These findings offer significant implications for earthquake precursors and early warning systems. To implement these results into practical applications, future efforts should focus on integrating TEC monitoring into multi-parameter early warning frameworks, combining ionospheric data with other geophysical precursors such as crustal deformation, radon emissions, and seismicity patterns. Additionally, expanding GNSS station coverage and incorporating advanced machine learning algorithms for automated detection of TEC anomalies could further enhance prediction accuracy and reduce false positives. Establishing real-time monitoring networks using ionospheric TEC data would provide actionable insights for disaster preparedness and risk mitigation. This study lays the groundwork for such advancements, demonstrating the value of ionospheric anomalies as reliable indicators of seismic activity and emphasizing the need for interdisciplinary research to refine these methodologies further.

Author Contributions

Conceptualization, K.N. and G.S.; methodology, K.N. and G.S.; software, K.N.; validation, R.R.-A., G.S. and M.E.T.-S.; formal analysis, K.N.; investigation, K.N.; resources, C.L.-U.; data curation, A.I.V.-V.; writing—original draft preparation, K.N.; writing—review and editing, K.N. and R.R.-A.; visualization, G.S.; supervision, R.R.-A.; project administration, M.E.T.-S.; funding acquisition, K.N. All authors have read and agreed to the published version of the manuscript.

Funding

This research received no external funding.

Institutional Review Board Statement

Not applicable.

Informed Consent Statement

Not applicable.

Data Availability Statement

The data can be made available upon request.

Acknowledgments

We express our gratitude to USGS for furnishing the earthquake data. Additionally, our thanks extend to the International GNSS Services (IGS) and the National Oceanic and Atmospheric Administration (NOAA) for supplying the high-quality data utilized in the analysis. K.N. thanks the National Council of Science, Humanities and Technology (CONAHCyT) in Mexico for the financial support (CVU: 1182470). Lastly, we also extend our sincere appreciation to Gopi Seemala for sharing the GPS-TEC v3.2 software, instrumental in the estimation of vTEC.

Conflicts of Interest

The authors declare no conflicts of interest.

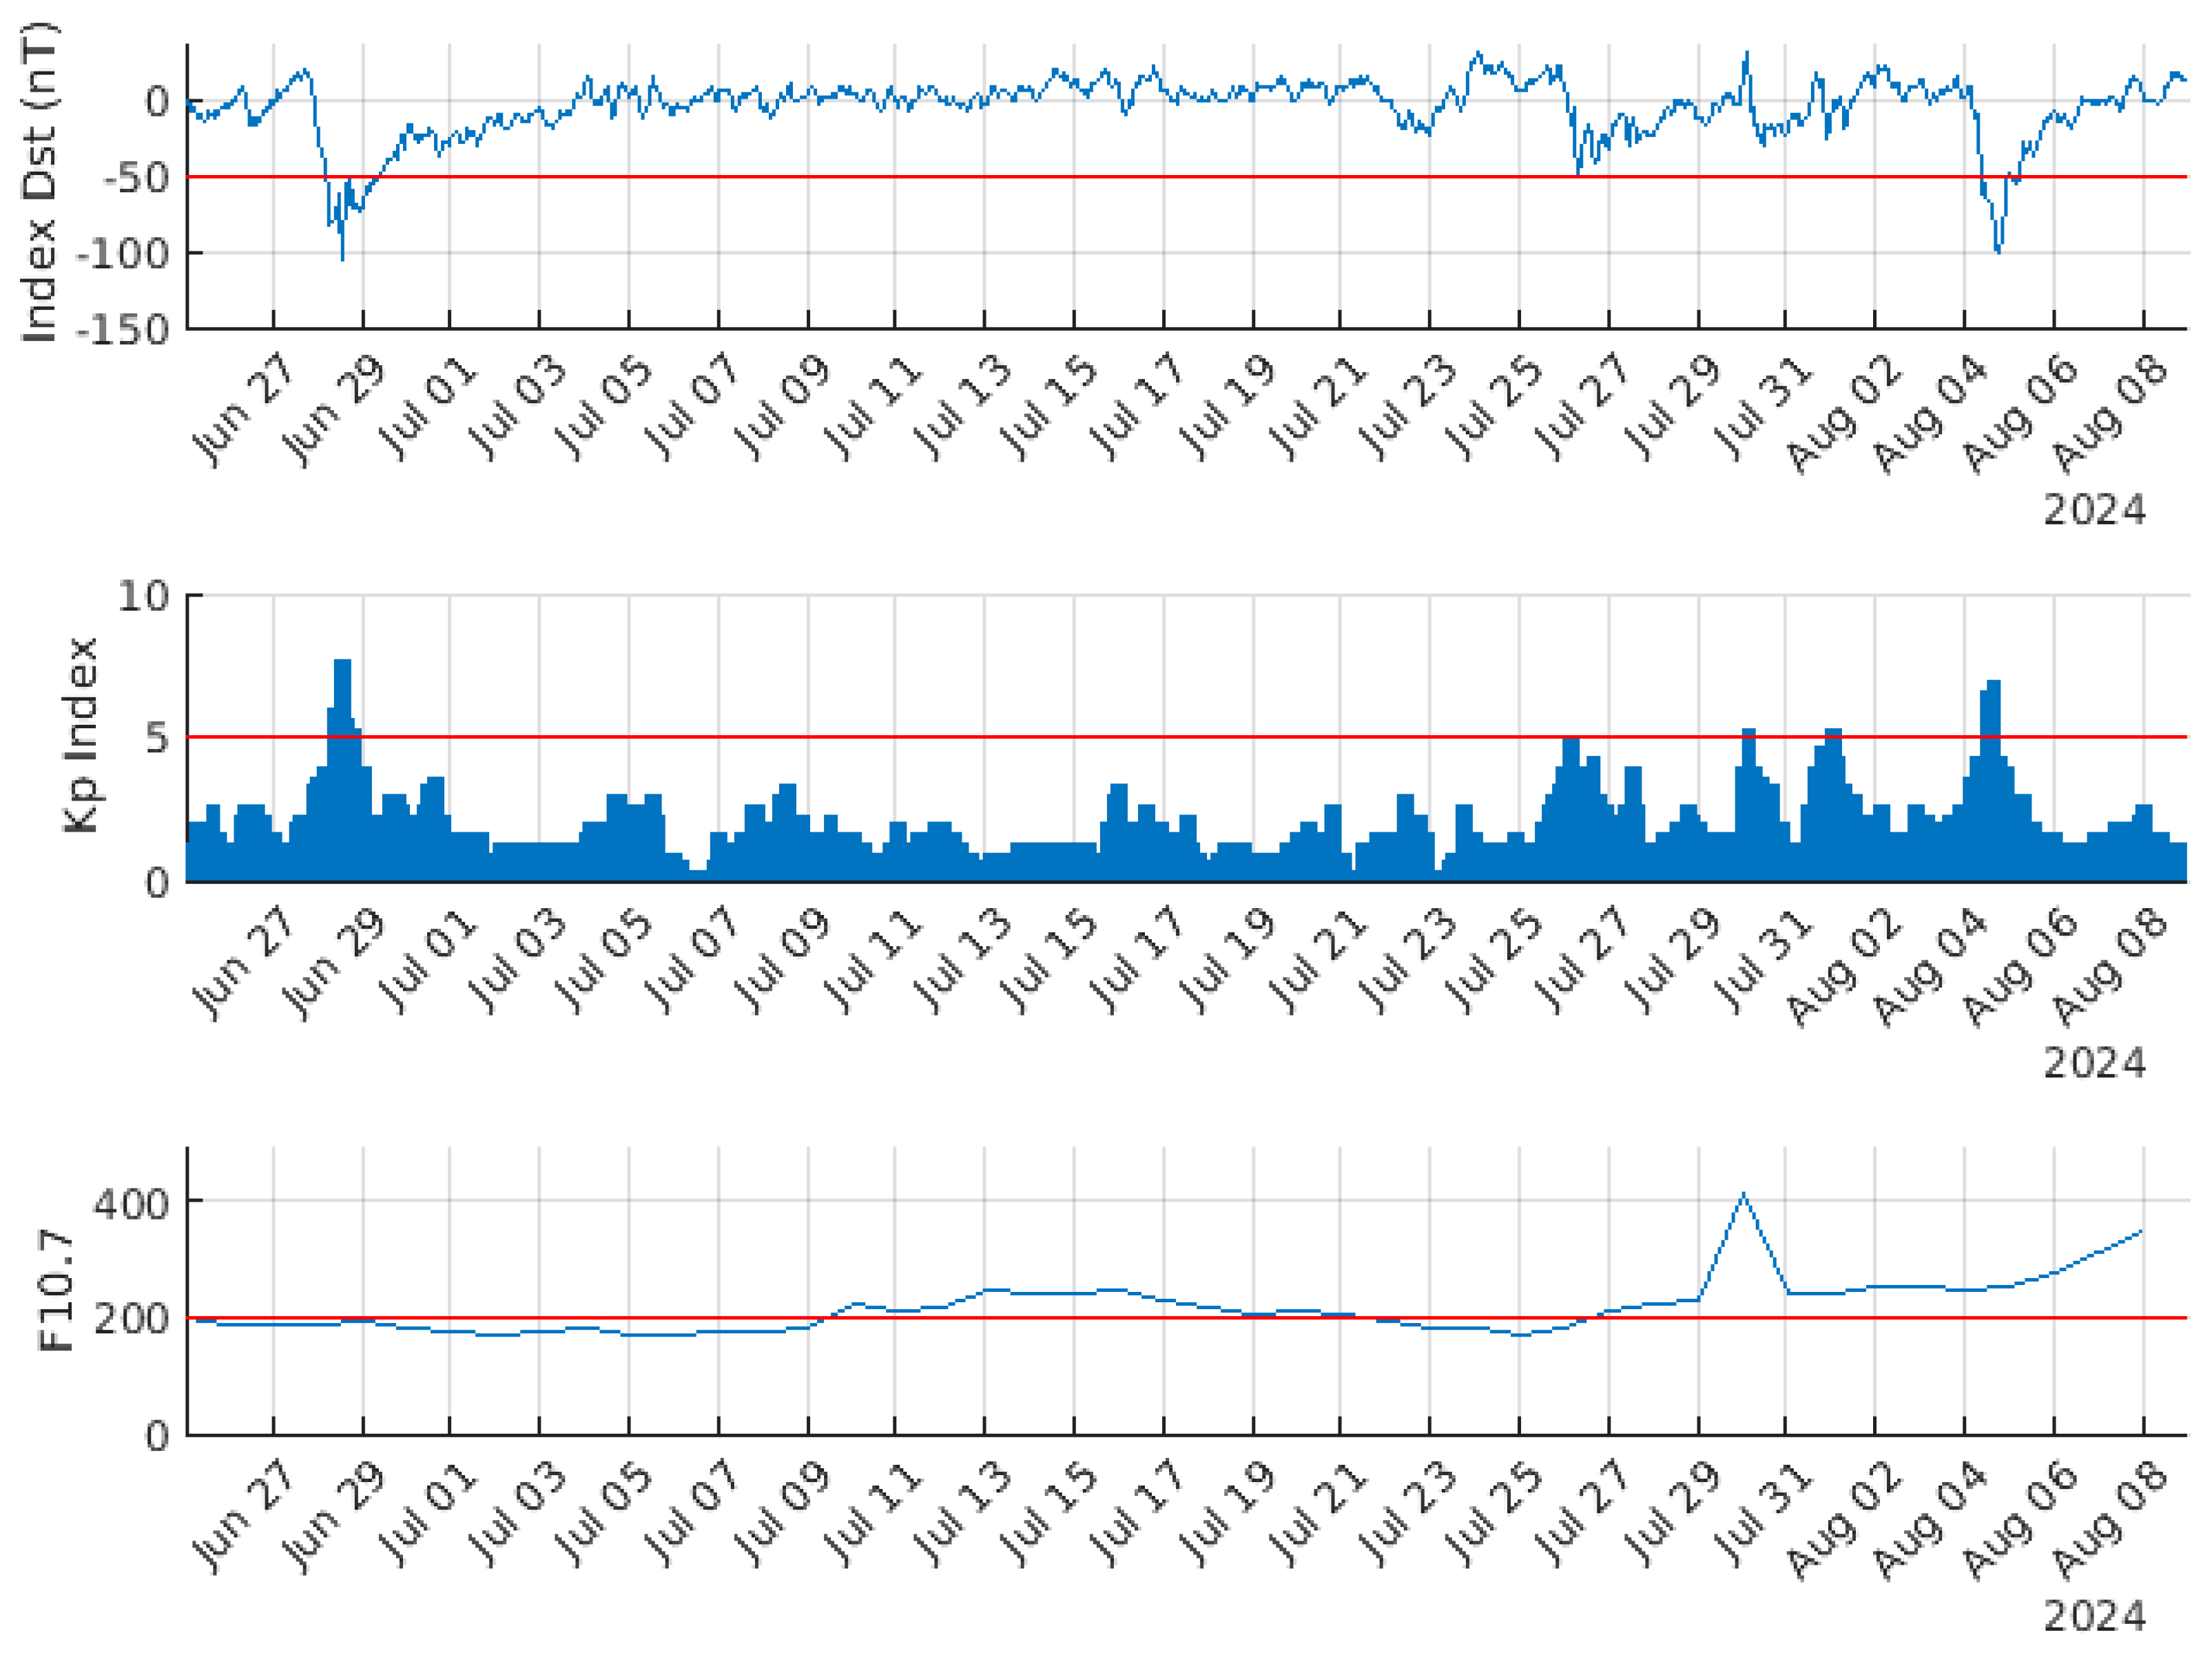
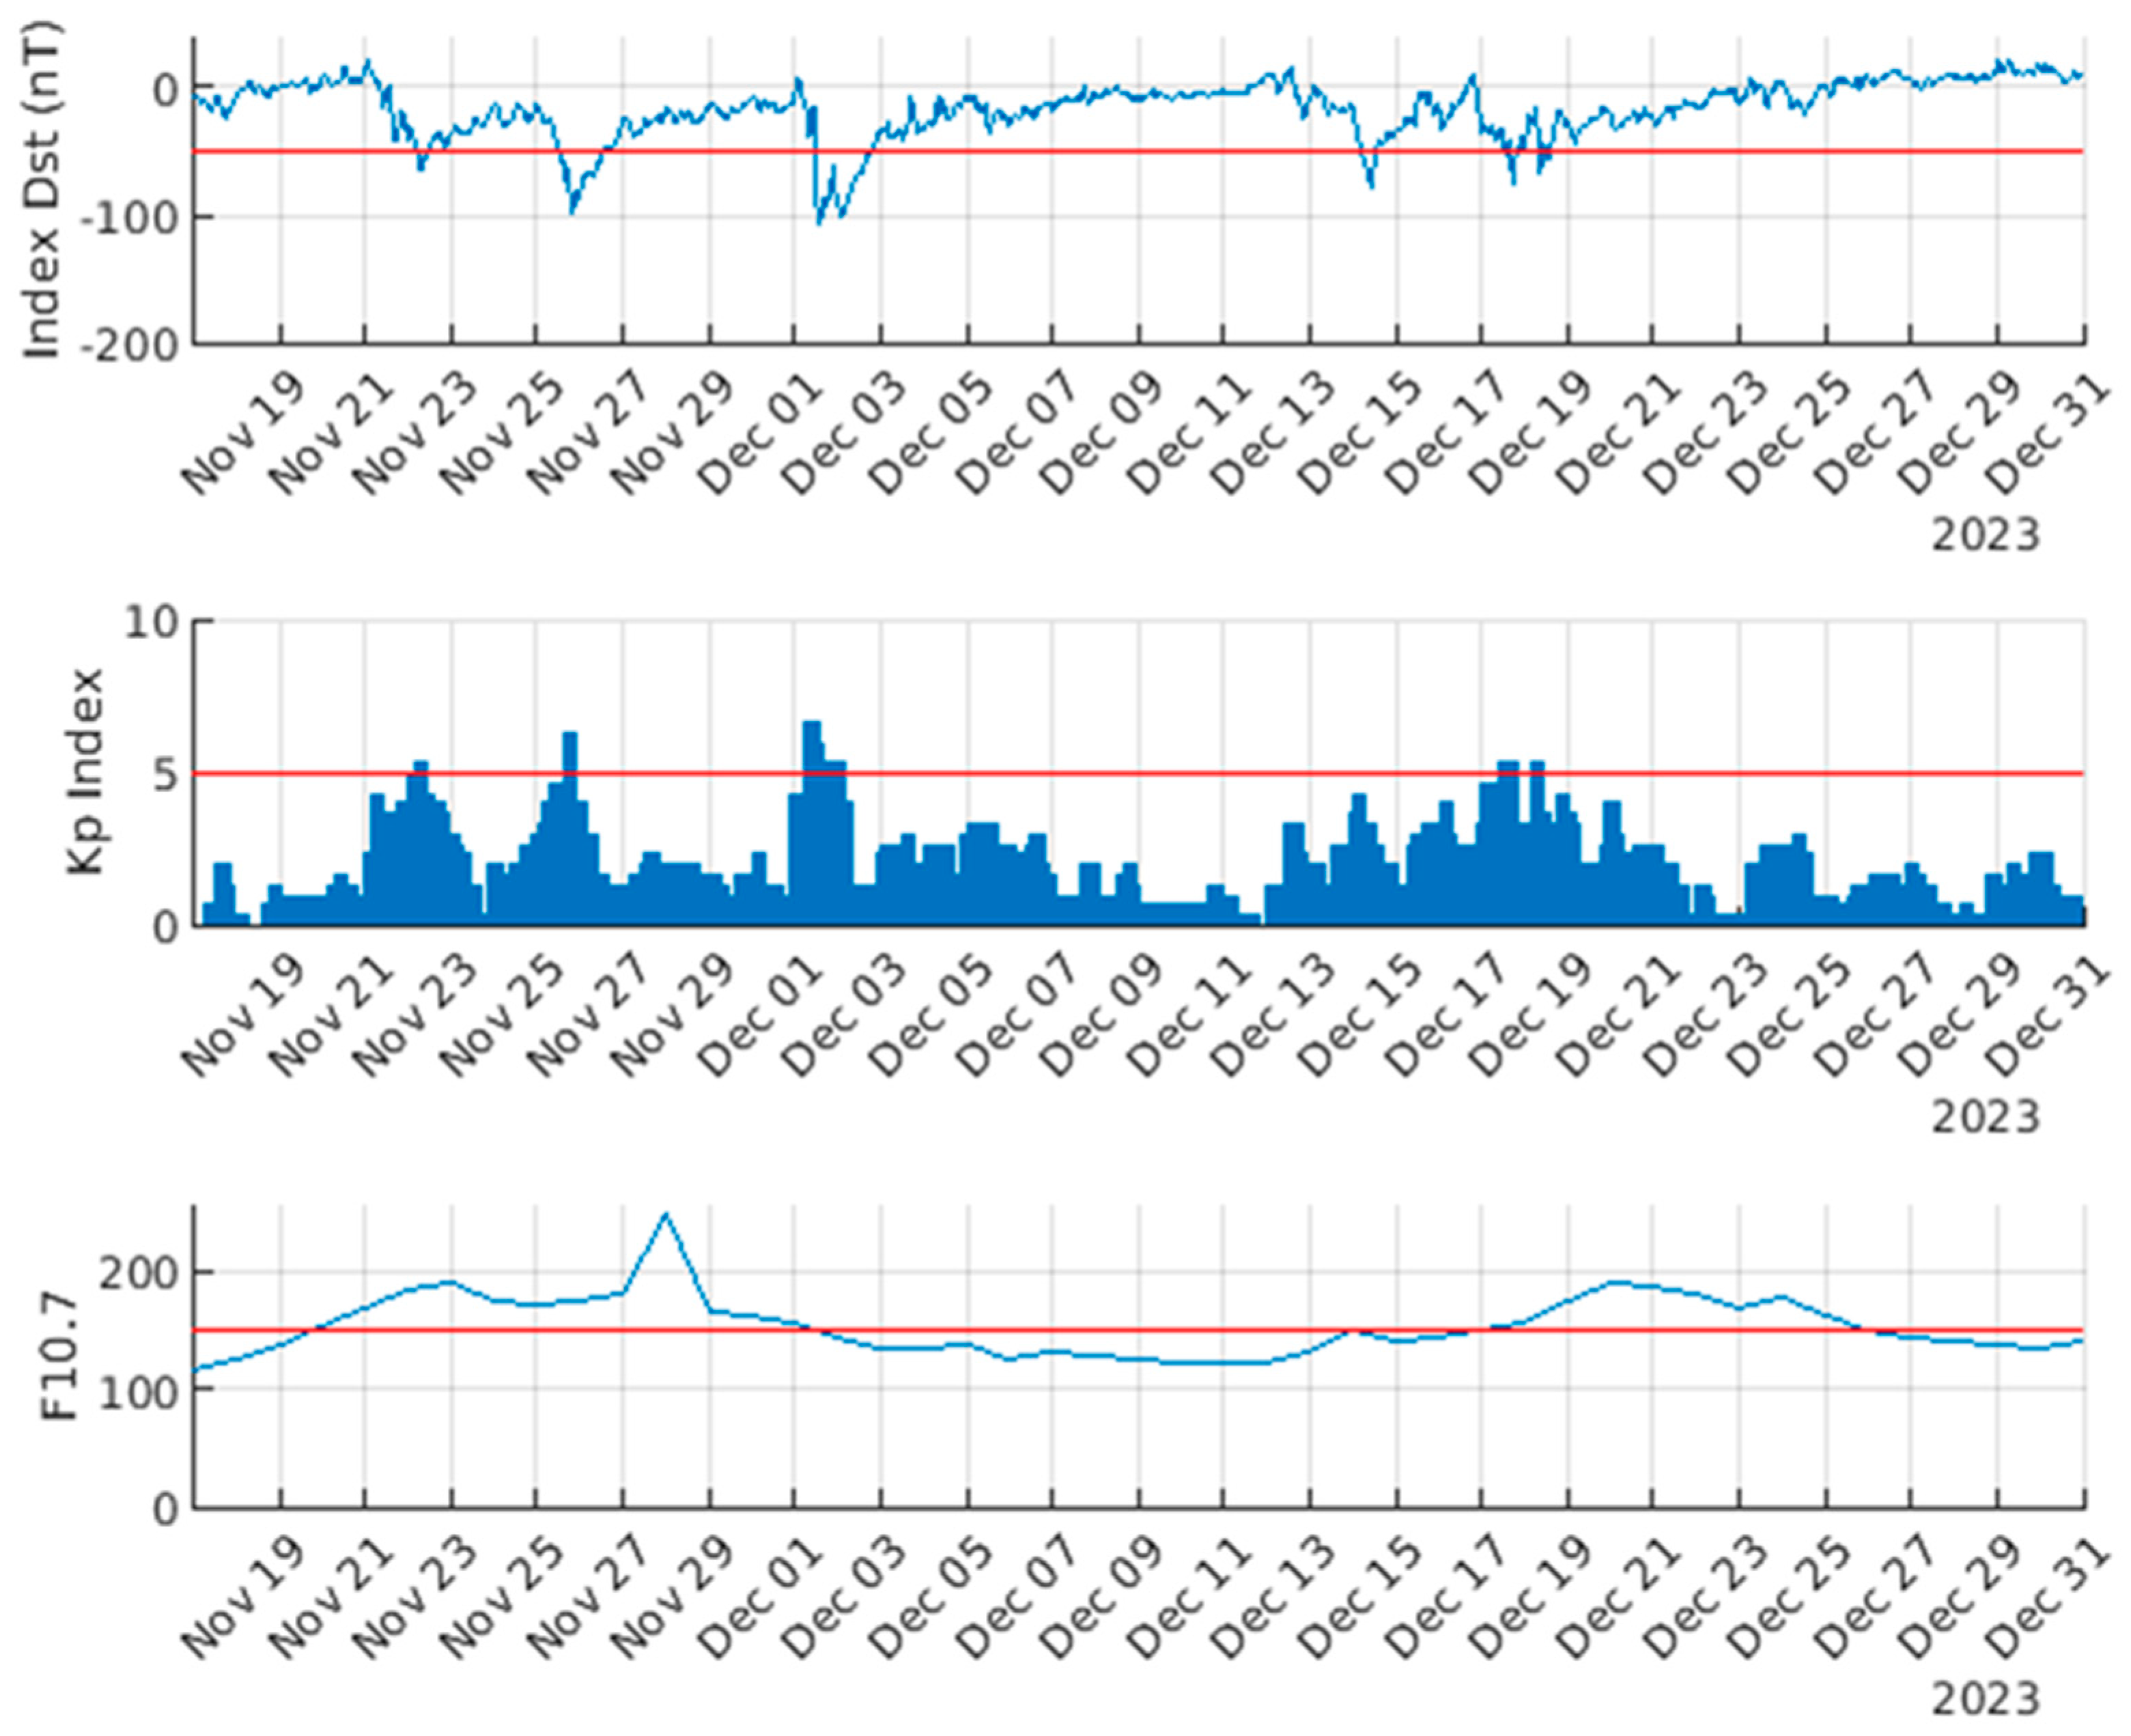
Appendix A. Space Weather Conditions

This appendix presents the space weather conditions observed leading up to the Nichinan earthquake in Japan, which took place on 8 August 2024. The dataset includes a comprehensive analysis spanning 45 days before the event. Notably, it is evident that the anomaly detected on 28 July is free from any space weather influence, reinforcing the conclusion that it is linked to a seismogenic source.
Figure A1. Space weather conditions preceding the Nichinan earthquake of 8 August 2024.
Atmosphere 15 01492 g0a1

References

  1. Pulinets, S. Ionospheric precursors of earthquakes; recent advances in theory and practical applications. Terr. Atmos. Ocean. Sci. 2004, 15, 413–436. [Google Scholar] [CrossRef]
  2. Shah, M.; Jin, S. Statistical characteristics of seismo-ionospheric GPS TEC disturbances prior to global Mw ≥ 5.0 earthquakes (1998–2014). J. Geodyn. 2015, 92, 42–49. [Google Scholar] [CrossRef]
  3. Chetia, T.; Sharma, G.; Dey, C.; Raju, P.L. Multi-parametric approach for earthquake precursor detection in Assam valley (Eastern Himalaya, India) using satellite and ground observation data. Geotectonics 2020, 54, 83–96. [Google Scholar] [CrossRef]
  4. Sharma, G.; Saikia, P.; Walia, D.; Banerjee, P.; Raju, P.L.N. TEC anomalies assessment for earthquakes precursors in North-Eastern India and adjoining region using GPS data acquired during 2012–2018. Quat. Int. 2021, 575, 120–129. [Google Scholar] [CrossRef]
  5. Pulinets, S.; Ouzounov, D. Lithosphere–Atmosphere–Ionosphere Coupling (LAIC) model–An unified concept for earthquake precursors validation. J. Asian Earth Sci. 2011, 41, 371–382. [Google Scholar] [CrossRef]
  6. Pulinets, S.; Ouzounov, D.; Karelin, A.; Davidenko, D. Lithosphere–atmosphere–ionosphere–magnetosphere coupling—A concept for pre-earthquake signals generation. In Pre-Earthquake Processes: A Multidisciplinary Approach to Earthquake Prediction Studies; Wiley: Hoboken, NJ, USA, 2018; pp. 77–98. [Google Scholar] [CrossRef]
  7. Li, W.; Sun, Z.; Chen, T.; Yan, Z.; Ma, Z.; Cai, C.; He, Z.; Luo, J.; Wang, S. Atmospheric Charge Separation Mechanism Due to Gas Release from the Crust before an Earthquake. Appl. Sci. 2024, 14, 245. [Google Scholar] [CrossRef]
  8. Freund, F.T.; Takeuchi, A.; Lau, B.W.; Post, R.; Keefner, J.; Mellon, J.; Al-Manaseer, A. Stress-induced changes in the electrical conductivity of igneous rocks and the generation of ground currents. Terr. Atmos. Ocean. Sci. 2004, 15, 437–468. [Google Scholar] [CrossRef]
  9. Wang, J.H. Piezoelectricity as a mechanism on generation of electromagnetic precursors before earthquakes. Geophys. J. Int. 2021, 224, 682–700. [Google Scholar] [CrossRef]
  10. Romero-Andrade, R.; Trejo-Soto, M.E.; Nayak, K.; Hernández-Andrade, D.; Bojorquez-Pacheco, N. Lineament analysis as a seismic precursor: The El Mayor Cucapah earthquake of April 4, 2010 (MW7. 2), Baja California, Mexico. Geod. Geodyn. 2023, 14, 121–129. [Google Scholar] [CrossRef]
  11. Liu, J.Y.; Tsai, H.F.; Jung, T.K. Total electron content obtained by using the global positioning system. Terr. Atmos. Ocean. Sci. 1996, 7, 107–117. [Google Scholar] [CrossRef]
  12. Liu, J.Y.; Chen, Y.I.; Chuo, Y.J.; Tsai, H.F. Variations of ionospheric total electron content during the Chi-Chi earthquake. Geophys. Res. Lett. 2001, 28, 1383–1386. [Google Scholar] [CrossRef]
  13. Liu, J.Y.; Chen, Y.I.; Pulinets, S.A.; Tsai, Y.B.; Chuo, Y.J. Seismo-ionospheric signatures prior to M ≥ 6.0 Taiwan earthquakes. Geophys. Res. Lett. 2000, 27, 3113–3116. [Google Scholar] [CrossRef]
  14. Zhao, B.; Wang, M.; Yu, T.; Wan, W.; Lei, J.; Liu, L.; Ning, B. Is an unusual large enhancement of ionospheric electron density linked with the 2008 great Wenchuan earthquake? J. Geophys. Res. Space Phys. 2008, 113, A11304. [Google Scholar] [CrossRef]
  15. Heki, K. Ionospheric electron enhancement preceding the 2011 Tohoku-Oki earthquake. Geophys. Res. Lett. 2011, 38, L17312. [Google Scholar] [CrossRef]
  16. Heki, K.; Enomoto, Y. Preseismic ionospheric electron enhancements revisited. J. Geophys. Res. Space Phys. 2013, 118, 6618–6626. [Google Scholar] [CrossRef]
  17. Akhoondzadeh, M. Support vector machines for TEC seismo-ionospheric anomalies detection. Ann. Geophys. 2013, 31, 173–186. [Google Scholar] [CrossRef]
  18. Melgarejo-Morales, A.; Vazquez-Becerra, G.E.; Millan-Almaraz, J.R.; Martinez-Felix, C.A.; Shah, M. Applying support vector machine (SVM) using GPS-TEC and Space Weather parameters to distinguish ionospheric disturbances possibly related to earthquakes. Adv. Space Res. 2023, 72, 4420–4434. [Google Scholar] [CrossRef]
  19. Mokhamad Nur Cahyadi, Kosuke Heki, Coseismic ionospheric disturbance of the large strike-slip earthquakes in North Sumatra in 2012: Mw dependence of the disturbance amplitudes. Geophys. J. Int. 2015, 200, 116–129. [CrossRef]
  20. Akyol, A.A.; Arikan, O.; Arikan, F. A machine learning-based detection of earthquake precursors using ionospheric data. Radio. Sci. 2020, 55, e2019RS006931. [Google Scholar] [CrossRef]
  21. Tsai, T.C.; Jhuang, H.K.; Ho, Y.Y.; Lee, L.C.; Su, W.C.; Hung, S.L.; Kuo, C.L. Deep learning of detecting ionospheric precursors associated with M ≥ 6.0 earthquakes in Taiwan. Earth Space Sci. 2022, 9, e2022EA002289. [Google Scholar] [CrossRef]
  22. Nayak, K.; López-Urías, C.; Romero-Andrade, R.; Sharma, G.; Guzmán-Acevedo, G.M.; Trejo-Soto, M.E. Ionospheric Total Electron Content (TEC) Anomalies as Earthquake Precursors: Unveiling the Geophysical Connection Leading to the 2023 Moroccan 6.8 Mw Earthquake. Geosciences 2023, 13, 319. [Google Scholar] [CrossRef]
  23. Sharma, G.; Mohanty, S.; Kannaujiya, S. Ionospheric TEC modelling for earthquakes precursors from GNSS data. Quat. Int. 2017, 462, 65–74. [Google Scholar] [CrossRef]
  24. Pulinets, S.; Krankowski, A.; Hernandez-Pajares, M.; Marra, S.; Cherniak, I.; Zakharenkova, I.; Budnikov, P. Ionosphere Sounding for Pre-seismic anomalies identification (INSPIRE): Results of the project and Perspectives for the short-term earthquake forecast. Front. Earth Sci. 2021, 9, 610193. [Google Scholar] [CrossRef]
  25. Nayak, K.; Romero-Andrade, R.; Sharma, G.; Zavala, J.L.C.; Urias, C.L.; Trejo Soto, M.E.; Aggarwal, S.P. A combined approach using b-value and ionospheric GPS-TEC for large earthquake precursor detection: A case study for the Colima earthquake of 7.7 Mw, Mexico. Acta Geod. Geophys. 2023, 58, 515–538. [Google Scholar] [CrossRef]
  26. Sharma, G.; Soubam, M.; Walia, D.; Nishant, N.; Sarma, K.K.; Raju, P.L.N. Development of a monitoring system for ionospheric TEC variability before the earthquakes. Appl. Comput. Geosci. 2021, 9, 100052. [Google Scholar] [CrossRef]
  27. Dai, H.; Huang, G.; Zeng, H. Multi-objective optimal dispatch strategy for power systems with Spatio-temporal distribution of air pollutants. Sustain. Cities Soc. 2023, 98, 104801. [Google Scholar] [CrossRef]
  28. She, Y.; Li, J.; Lyu, X.; Guo, H.; Qin, M.; Xie, X.; Hu, J. Current status of model predictions of volatile organic compounds and impacts on surface ozone predictions during summer in China. Atmos. Chem. Phys. 2024, 24, 219–233. [Google Scholar] [CrossRef]
  29. Serguei, B. The Source of Earthquake Energy on the West Coast of Japan 1.1.2024. Magmatic Ram as an Earthquake Generator. Available online: https://ssrn.com/abstract=4685378 (accessed on 5 January 2024).
  30. Richard, S.; Pagani, M. The GEM Global Active Faults Database. Earthq. Spectra 2020, 36, 160–180. [Google Scholar]
  31. Dobrovolsky, I.P.; Zubkov, S.I.; Miachkin, V.I. Estimation of the size of earthquake preparation zones. Pure Appl. Geophys. 1979, 117, 1025–1044. [Google Scholar] [CrossRef]
  32. Blewitt, G. An automatic editing algorithm for GPS data. Geophys. Res. Lett. 1990, 17, 199–202. [Google Scholar] [CrossRef]
  33. Kersley, L.; Malan, D.; Pryse, S.E.; Cander, L.R.; Bamford, R.A.; Belehaki, A.; Leitinger, R.; Radicella, S.M.; Mitchell, C.N.; Spencer, P.S. Total electron content—A key parameterin propagation: Measurement and usein ionospheric imaging. Ann. Geophys. 2004, 47, 1067–1091. [Google Scholar] [CrossRef]
  34. Norsuzila, Y.; Abdullah, M.; Ismail, M. Leveling Process of Total Electron Content (TEC) Using Malaysian Global Positioning System (GPS) Data. Am. J. Eng. Appl. Sci. 2008, 1, 223–229. [Google Scholar]
  35. Sharma, G.; Nayak, K.; Romero-Andrade, R.; Aslam, M.M.; Sarma, K.K.; Aggarwal, S.P. low ionosphere density above the earthquake epicentre region of Mw 7.2, El Mayor–Cucapah earthquake evident from dense CORS data. J. Indian Soc. Remote Sens. 2024, 52, 543–555. [Google Scholar] [CrossRef]
  36. Nayak, K.; Urias, C.L.; Romero Andrade, R.; Sharma, G.; Soto, M.E.T. Analysis of Seismo-Ionospheric Irregularities Using the Available PRNs vTEC from the Closest Epicentral cGPS Stations for Large Earthquakes. Environ. Sci. Proc. 2024, 27, 24. [Google Scholar] [CrossRef]
  37. Kumar, S.; Singh, A.K. Ionospheric precursors observed in TEC due to earthquake of Tamenglong on 3 January 2016. Curr. Sci. 2017, 113, 795–801. [Google Scholar] [CrossRef]
  38. Andreeva, E.S.; Franke, S.J.; Yeh, K.C.; Kunitsyn, V.E. Some features of the equatorial anomaly revealed by ionospheric tomography. Geophys. Res. Lett. 2000, 27, 2465–2468. [Google Scholar] [CrossRef]
  39. Jonah, O.F.; De Paula, E.R.; Kherani, E.A.; Dutra, S.L.G.; Paes, R.R. Atmospheric and ionospheric response to sudden stratospheric warming of January 2013. J. Geophys. Res. Space Phys. 2014, 119, 4973–4980. [Google Scholar] [CrossRef]
  40. López-Urias, C.; Vazquez-Becerra, G.E.; Nayak, K.; López-Montes, R. Analysis of Ionospheric Disturbances during X-Class Solar Flares (2021–2022) Using GNSS Data and Wavelet Analysis. Remote Sens. 2023, 15, 4626. [Google Scholar] [CrossRef]
  41. Urias, C.L.; Nayak, K.; Becerra, G.E.V.; Montes, R.L. An Analysis of Ionospheric Conditions during Intense Geomagnetic Storms (Dst ≤− 100 nt) in the Period 2011–2018. Environ. Sci. Proc. 2023, 27, 18. [Google Scholar] [CrossRef]
  42. Feng, J.; Zhang, Y.; Li, W.; Han, B.; Zhao, Z.; Zhang, T.; Huang, R. Analysis of ionospheric TEC response to solar and geomagnetic activities at different solar activity stages. Adv. Space Res. 2023, 71, 2225–2239. [Google Scholar] [CrossRef]
  43. Shreedevi, P.; Choudhary, R.; Thampi, S.V.; Yadav, S.; Pant, T.; Yu, Y.; Sinha, A. Geomagnetic storm-induced plasma density enhancements in the southern polar ionospheric region: A comparative study using St. Patrick’s Day storms of 2013 and 2015. Space Weather 2020, 18, e2019SW002383. [Google Scholar] [CrossRef]
  44. Oljira, A. A study of Solar Flares and Geomagnetic Storms Impact on Total Electron Content Over High-Latitude Region During July-November 2021: The Case of Tromso Station. Adv. Space Res. 2023, 72, 3868–3881. [Google Scholar] [CrossRef]
  45. Akhoondzadeh, M. Investigation of the LAIC mechanism of the Haiti earthquake (August 14, 2021) using CSES-01 satellite observations and other earthquake precursors. Adv. Space Res. 2024, 73, 672–684. [Google Scholar] [CrossRef]
  46. Mizuno, A.; Kao, M.; Umeno, K. A capacitive coupling model between the ionosphere and a fault layer in the crust with supercritical water. Int. J. Plasma Environ. Sci. Technol. 2024, 18, e01003. [Google Scholar]
  47. St-Laurent, F.; Derr, J.S.; Freund, F.T. Earthquake lights and the stress-activation of positive hole charge carriers in rocks. Phys. Chem. Earth Parts A/B/C 2006, 31, 305–312. [Google Scholar] [CrossRef]
  48. Bishop, J.R. Piezoelectric effects in quartz-rich rocks. Tectonophysics 1981, 77, 297–321. [Google Scholar] [CrossRef]
  49. Yasuoka, Y.; Kawada, Y.; Nagahama, H.; Omori, Y.; Ishikawa, T.; Tokonami, S.; Shinogi, M. Preseismic changes in atmospheric radon concentration and crustal strain. Phys. Chem. Earth Parts A/B/C 2009, 34, 431–434. [Google Scholar] [CrossRef]
  50. Oliver, M.A.; Webster, R. Kriging: A method of interpolation for geographical information systems. Int. J. Geogr. Inf. Syst. 1990, 4, 313–332. [Google Scholar] [CrossRef]
  51. Myers, D.E. Interpolation and estimation with spatially located data. Chemom. Intell. Lab. Syst. 1991, 11, 209–228. [Google Scholar] [CrossRef]
  52. Yamazaki, Y.; Häusler, K.; Wild, J.A. Day-to-day variability of midlatitude ionospheric currents due to magnetospheric and lower atmospheric forcing. J. Geophys. Res. Space Phys. 2016, 121, 7067–7086. [Google Scholar] [CrossRef]
Figure 1. Seismotectonic map of the Noto Peninsula in Japan depicting the earthquake on 1 January 2024 (highlighted by the black star). Aftershocks are marked with red stars, green triangles denote CORS points used for TEC analysis within the earthquake preparation zone, and active faults are represented by brown lines (modified after Styron et al., 2020 [30]).
Atmosphere 15 01492 g001
Figure 2. TEC readings taken at the closest USUD station in the month leading up to the earthquake. The upper and lower boundaries, determined by Equation (2), are represented by the black and green solid lines, respectively. The daily TEC values, measured in TEC units (TECU), are depicted by the red lines. Any deviations beyond these limits are identified as anomalies, with positive anomalies shown as black columns and negative anomalies as green columns.
Atmosphere 15 01492 g002
Figure 3. TEC readings taken at MIZU station in the month leading up to the earthquake. The upper and lower boundaries, determined by Equation (2), are represented by the black and green solid lines, respectively. The daily TEC values, measured in TEC units (TECU), are depicted by the red lines. Any deviations beyond these limits are identified as anomalies, with positive anomalies shown as black columns and negative anomalies as green columns.
Atmosphere 15 01492 g003
Figure 4. Elaborate depiction of the day-to-day changes in the Dst, Kp, and F10.7 index observed between 17 November and 31 December, covering the 45 days preceding the earthquake. In each subplot, red horizontal lines signify the predetermined threshold levels for these indices. Anomalies in the TEC patterns are taken into account only when the indices fall below their respective thresholds.
Atmosphere 15 01492 g004
Figure 5. Anomalous variations in TEC depletions exceeding a threshold of at least 3 TEC units (3 × 10¹⁶ electrons/m2).
Atmosphere 15 01492 g005
Figure 6. Observation of TEC on the anomaly day with the PNA time at 3.367 UTC, considering data from the nearby 22 stations. The X-axis illustrates the CORS distance from the epicenter, while the Y-axis represents the vTEC in relation to TEC units.
Atmosphere 15 01492 g006
Figure 7. Relationship between TEC Pearson correlation and distance, showing spatial decay in correlation with statistical significance across stations for the anomaly day of 7 December 2023.
Atmosphere 15 01492 g007
Figure 8. Spatial distribution of vTEC based on data from 22 neighboring stations, depicted by green triangles, during the Peak Negative Anomaly time at 3.367 UTC on the anomaly day of 7 December.
Atmosphere 15 01492 g008
Figure 9. Observation of TEC on the anomaly day with, the PNA time at 3.117 UTC, considering data from the nearby 22 stations. The X-axis illustrates the CORS distance from the epicenter, while the Y-axis represents the vTEC in relation to TEC units.
Atmosphere 15 01492 g009
Figure 10. Relationship between TEC Pearson correlation and distance, showing spatial decay in correlation with statistical significance across stations for the anomaly day of 8 December 2023.
Atmosphere 15 01492 g010
Figure 11. Spatial distribution of vTEC based on data from 22 neighboring stations, depicted by green triangles, during the Peak Negative Anomaly time at 3.117 UTC on the anomaly day of 8 December.
Atmosphere 15 01492 g011
Figure 12. Anomalous variations in TEC depletions exceeding a threshold of at least 3 TEC units, as observed from the AIRA station for the Nichinan earthquake of Japan.
Atmosphere 15 01492 g012
Figure 13. Observation of TEC on the anomaly day with the PNA time at 3.85 UTC, considering data from the 17 stations. The X-axis illustrates the CORS distance from the epicenter, while the Y-axis represents the vTEC in relation to TEC units.
Atmosphere 15 01492 g013
Figure 14. Relationship between TEC Pearson correlation and distance, showing spatial decay in correlation with statistical significance for the Nichinan Earthquake across stations for the anomaly day of 28 July 2024.
Atmosphere 15 01492 g014
Figure 15. Spatial distribution of vTEC based on data from 17 neighboring stations, depicted by green triangles, during the Peak Negative Anomaly time at 3.85 UTC on the anomaly day of 28 July 2024.
Atmosphere 15 01492 g015
Table 1. Details of the CORS used in the study.
StationLatLongDist. (km)StationLatLongDist. (km)
AIRA31.824130.6875MTKA35.68139.561289
CCJ227.068142.1951246OSN437.083127.034905
CHAN43.791125.4431216SEJN36.522127.303890
KGNI35.675139.531282SMST33.578135.937450
DAEJ36.399127.374886SUWN37.276127.054902
GAMG35.59127.92860TNML24.798120.9871688
ISHI36.209140.219301TSKB36.106140.087297
JFNG30.516114.4911632TWTF24.954121.1651663
KMNM24.464118.3891701USUD36.133138.362181
MIZU39.135141.133385WUHN30.532114.3571743
MSSA36.14138.352360YONS37.541127.001904
Disclaimer/Publisher’s Note: The statements, opinions and data contained in all publications are solely those of the individual author(s) and contributor(s) and not of MDPI and/or the editor(s). MDPI and/or the editor(s) disclaim responsibility for any injury to people or property resulting from any ideas, methods, instructions or products referred to in the content.

