Communication

Study on Ozone and Its Critical Influencing Factors in Key Regions of China

1
State Key Laboratory of Environmental Criteria and Risk Assessment, Chinese Research Academy of Environmental Sciences, Beijing 100012, China
2
Department of Environmental Engineering, Beijing Institute of Petrochemical Technology, Beijing 102627, China
3
China Meteorological Administration, National Meteorological Center, Beijing 100081, China
*
Authors to whom correspondence should be addressed.
Atmosphere 2024, 15(12), 1430; https://doi.org/10.3390/atmos15121430
Submission received: 9 October 2024 / Revised: 22 November 2024 / Accepted: 26 November 2024 / Published: 27 November 2024
(This article belongs to the Special Issue Air Pollution in China (3rd Edition))

Abstract

:
Solar radiation is the fundamental energy source of climate change, which has a significant impact on the generations of secondary fine particulate matter (PM2.5) and ozone (O3) in the atmosphere. Additionally, surface solar radiation is also affected by the concentration of PM2.5, which in turn affects the generation of O3. To clarify the relationships among the O3, PM2.5 and the total radiation intensity, this study analyzes their temporal and spatial variation trends from 2017 to 2019. Meanwhile, as a common precursor of O3 and PM2.5, concentration variations in nitrogen dioxide (NO2) are discussed as well in this study. The results showed the following: (1) There are significant positive correlations between the O3-8 h concentrations and the total radiation intensities in critical regions, especially in the “2 + 26” cities, Fen-Wei Plain and Yangtze River Delta. (2) The decrease in PM2.5 concentrations is in good agreement with the trend of NO2 concentrations, while the response of O3 concentration to the NO2 concentration variation differs in different regions, except in the Pearl River Delta. (3) In addition to the meteorological factors, changes in the concentrations and ratios of precursors such as NO2 and volatile organic compounds (VOCs) likely contribute to the observed fluctuations in O3 concentrations in recent years.

1. Introduction

As a typical secondary pollutant, O3 is primarily generated through photochemical processes in the troposphere, and its concentration is not only closely related to the emissions of precursors but also significantly influenced by meteorological conditions [1,2]. In different regions, the impact of meteorological factors on O3 concentrations varies significantly. Short-term variations in O3 concentration are influenced by local meteorological factors. Clean sky, high temperature and low humidity have a positive effect on the O3 formation. Additionally, changes in local circulation and the structure of the atmospheric boundary layer will significantly affect the O3 concentration. Long-term trends in O3 concentration are associated with the amounts of precursors and broader climate change [3]. On a global scale, regions with high O3 concentrations are mainly concentrated in the Northern Hemisphere, particularly between 25° N and 60° N [4,5]. In terms of temporal distribution, O3 pollution mainly occurs during summer or the near-warm months.
As the fundamental energy source driving climate change, solar radiation plays a critical role in photochemical processes, significantly influencing the formation of secondary pollutants, such as secondary aerosols and O3 in the atmosphere [6]. Studies [7] have shown that in the past decade, total solar radiation has significantly increased in the Beijing–Tianjin–Hebei (BTH) region. The daily maximum 8h average O3 concentrations in BTH, the Yangtze River Delta (YRD), and the Pearl River Delta (PRD) show strong positive correlations with total solar radiation, with correlation coefficients exceeding 0.71. In Chengdu, the O3 concentrations also show a positive correlation with total radiation. The maximum O3 occurs when radiation intensity is between 600 and 800 W/m2, and when the radiation intensity exceeds 800 W/m2, the hourly average O3 concentration reaches a peak of 117 μg/m3 [8].
Additionally, there is a highly complex interaction between O3 and particulate matter, as they have common precursors (volatile organic compounds (VOCs) and nitrogen oxides (NOx) and are directly influenced by meteorological conditions [9]. Meanwhile, the concentrations of PM2.5 and O3 affect one another. Generally, aerosols can impact tropospheric photochemistry through scattering or absorbing radiation, which subsequently influences near-ground O3 concentrations to some extent [10,11]. Furthermore, PM2.5 may indirectly alter cloud optical thickness and heterogeneous phase reactions, thereby affecting atmospheric dynamics and photodecomposition rates. Conversely, the generation and transformation of secondary aerosols are primarily driven by photochemical processes. As a key photochemical oxidant, O3 plays a critical role in the formation of secondary components such as nitrates, sulfates, and secondary organic aerosols by influencing the concentrations of oxidants like hydroxyl radicals (OH), hydrogen peroxide (H2O2), and aldehydes (RCHO) [12,13,14].
To gain a comprehensive understanding of the dynamics of O3 pollution and the key determinants within China, this study analyzes the fluctuations in O3 and PM2.5 concentrations alongside total radiation intensity in key regions from 2017 to 2019. Additionally, the study explores the influence of meteorological conditions and the concentration variations of key precursors on O3 levels across the country. The insights derived from this research are intended to inform and enhance the coordinated management strategies for both PM2.5 and O3 pollution in China.

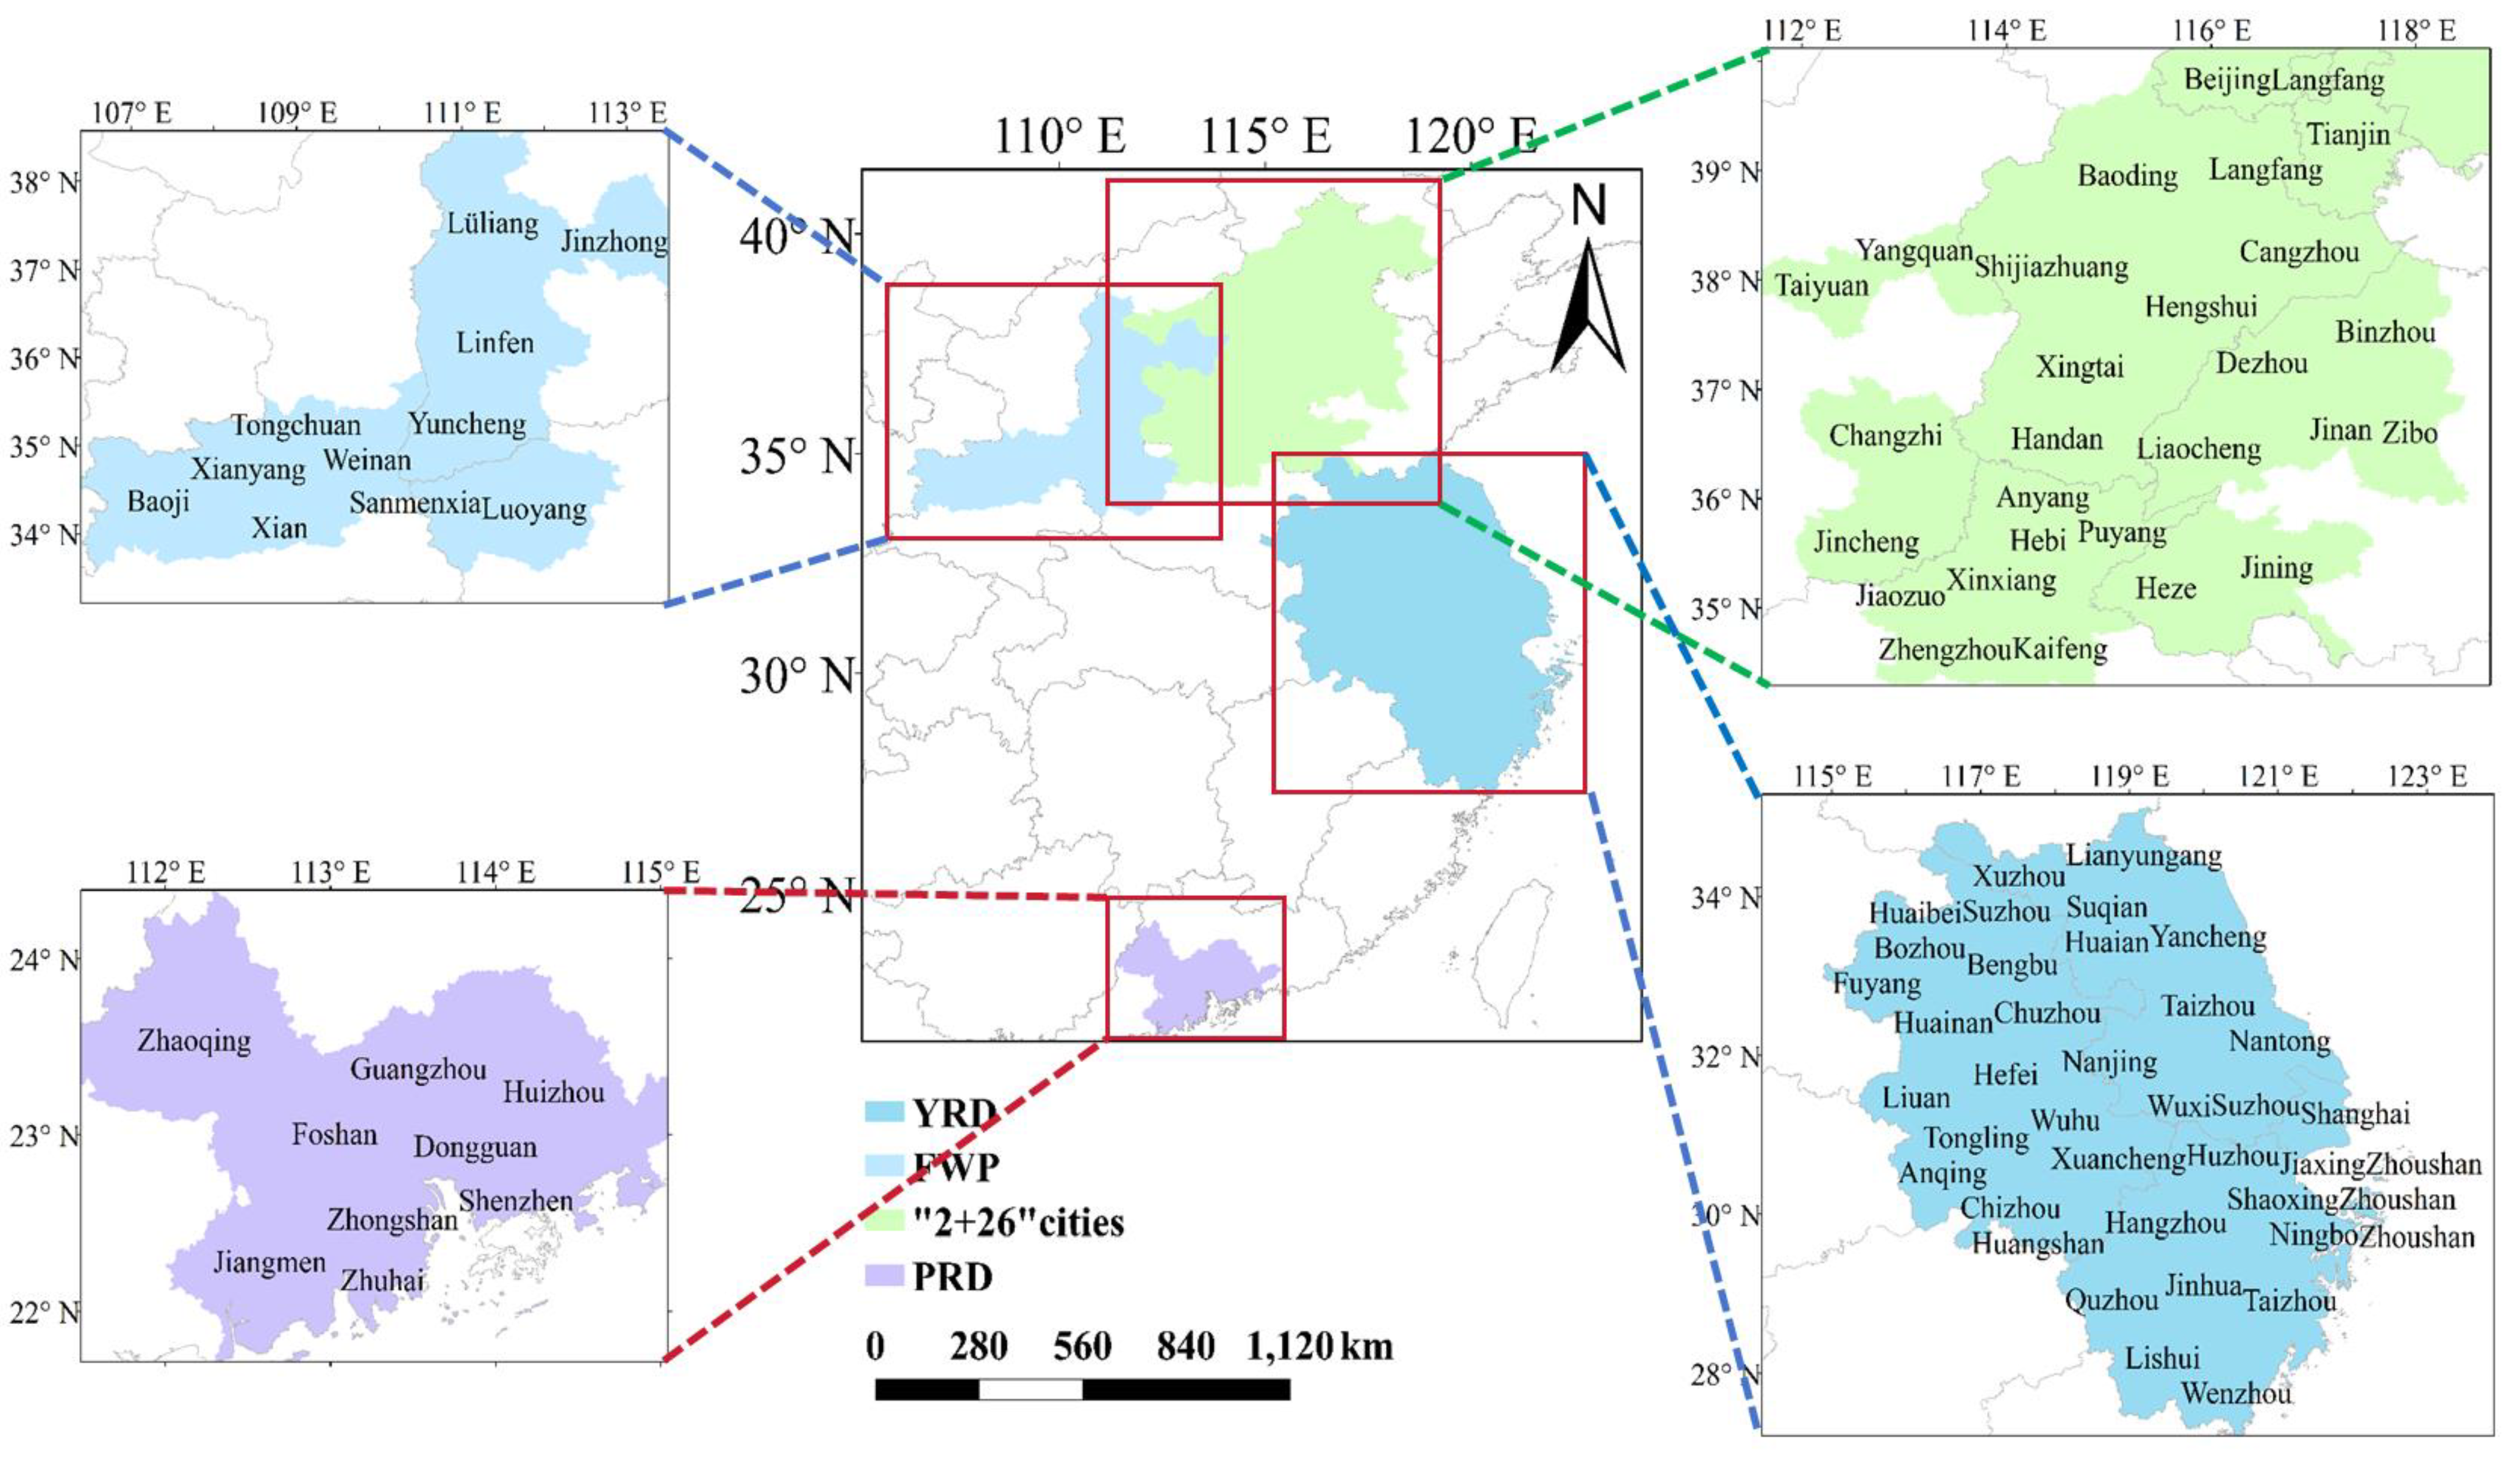
2. Materials and Methods

Beijing–Tianjin–Hebei and the surrounding areas (“2 + 26” cities), the Fen-Wei Plain (FWP), the YRD, and the PRD are selected as the key regions in this study (Figure 1). The air quality monitoring data used were collected from real-time urban monitoring data publicly released by the China National Environmental Monitoring Center (http:// air.cnemc.cn:18007, accessed on 3 May 2024). The daily average concentrations of O3, PM2.5, and NO2 were calculated based on the HJ 633–2012 “Technical Regulation on Ambient Air Quality Index (AQI) (Trial)” and HJ 663–2013 “Technical Specification for Ambient Air Quality Assessment (Trial)”. The PM2.5 and NO2 concentrations represent 24 h arithmetic means, while O3 concentration is represented by the maximum 8 h running average near-surface ozone for the same day (referred to as the “O3-8 h” concentration). Monthly and annual average concentrations of PM2.5 and NO2 are calculated using the arithmetic mean of daily concentrations. To accurately understand the relationship between PM2.5 and O3 concentrations, and to objectively study the overall variation patterns of O3 in relation to meteorological factors and other pollutants, the monthly and annual average concentrations of O3, aside from evaluation values, were calculated as the arithmetic mean of the O3-8 h concentration. The total radiation intensity data were obtained from the National Meteorological Information Center (http://data.cma.cn, accessed on 9 May 2024).
Considering the climatic characteristics, distribution of O3 pollution, regional pollution features, and the key atmospheric pollution prevention and control efforts in China, BTH and surrounding areas (referred to as the “2 + 26” cities), the FWP, the YRD, and the PRD regions were selected as the study areas. Detailed information is presented in Table 1.

3. Results and Discussion

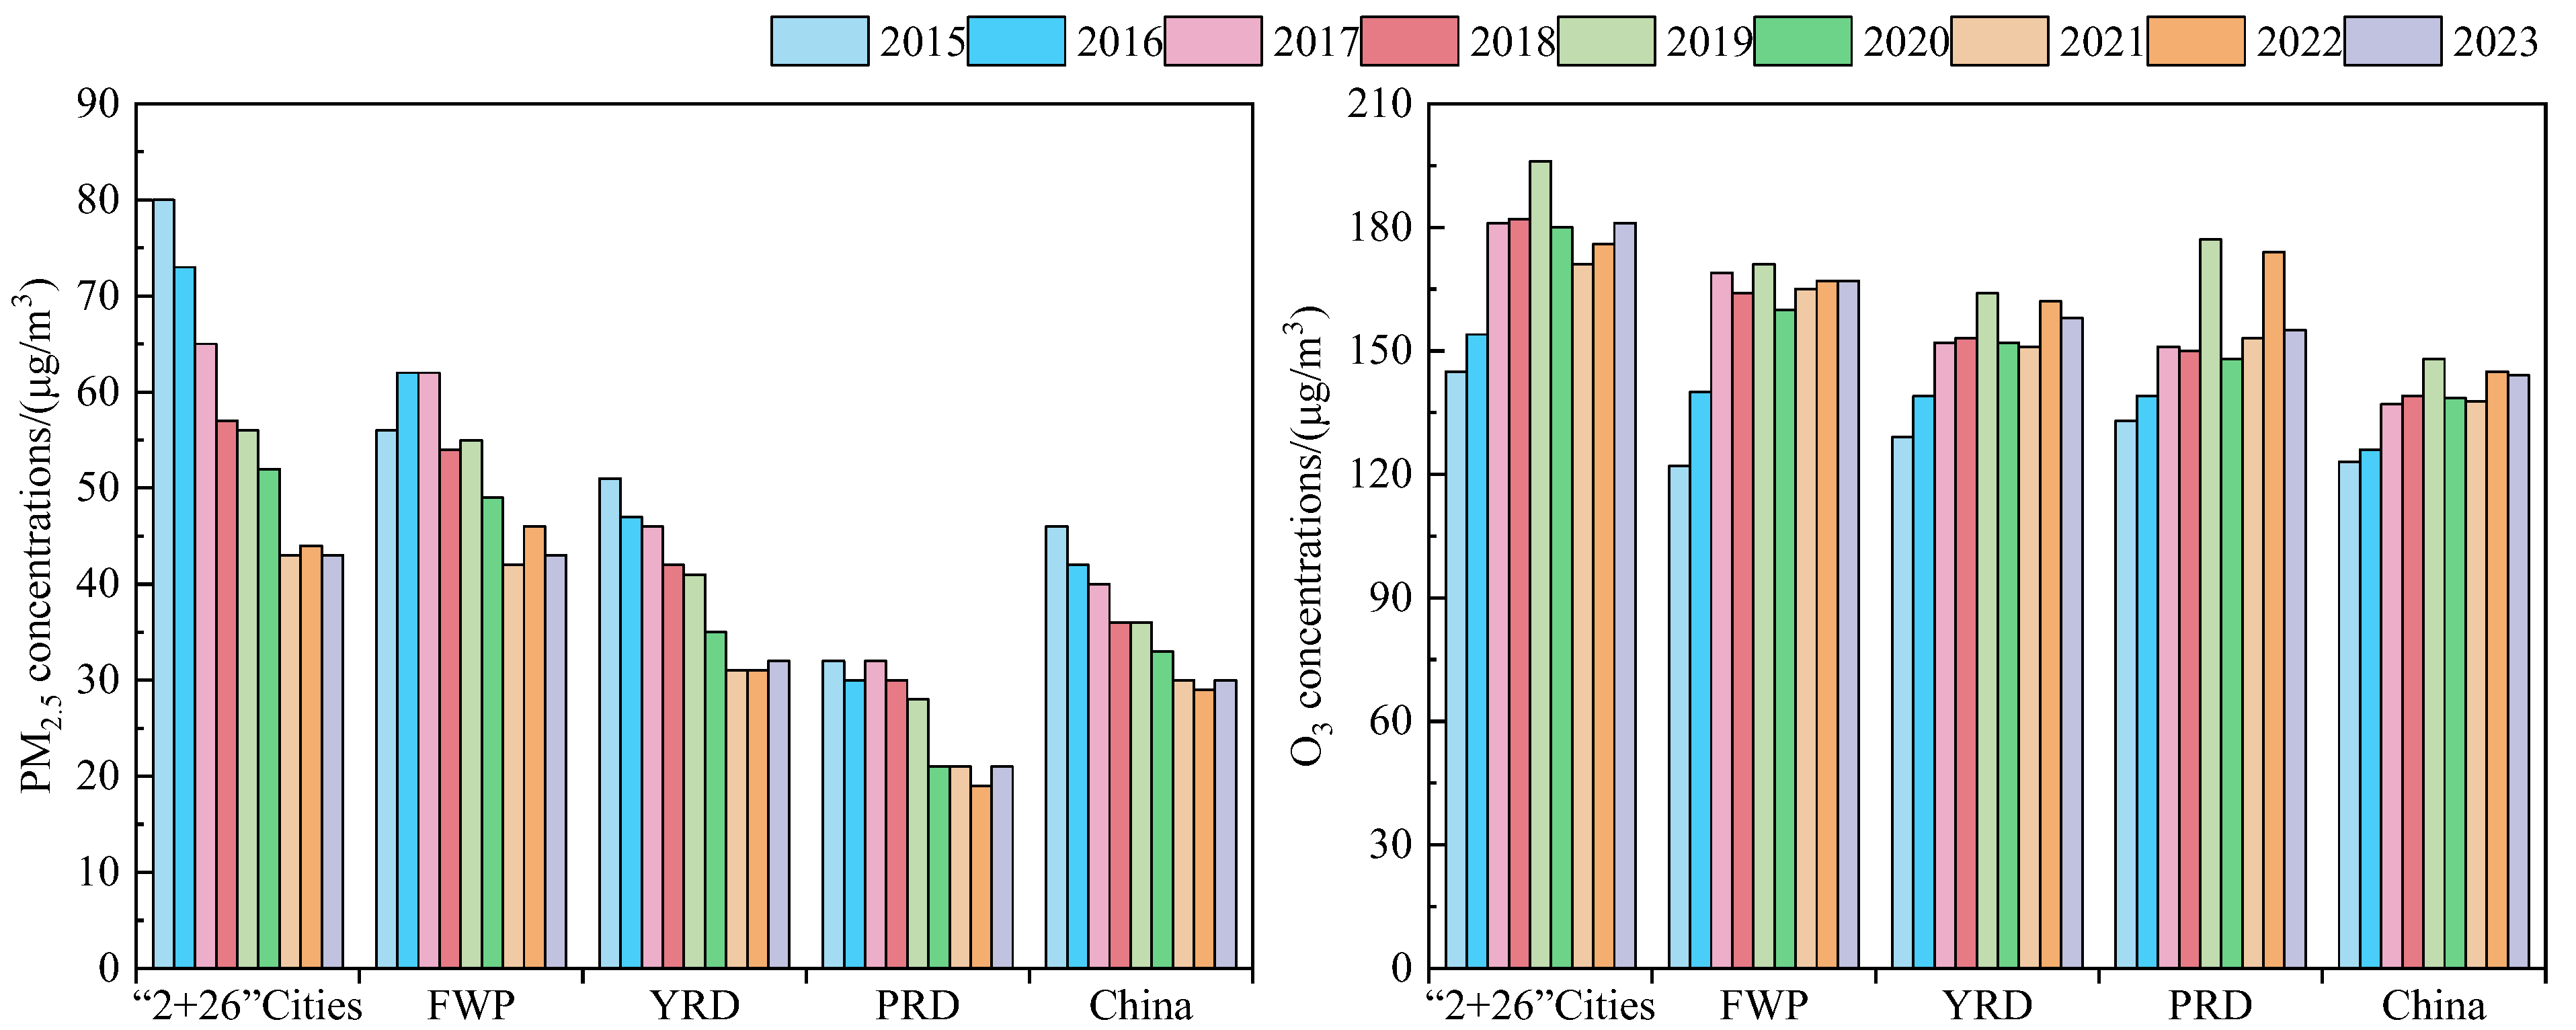
3.1. PM2.5 and O3 Pollution Situation

In recent years, with the continuous advancement of a series of air pollution prevention and control efforts in China, there has been a significant improvement in air quality, especially in the reduction in particulate matter and SO2 pollutants, but the issue of ground-level O3 pollution still remains prominent [15]. In 2023, the annual PM2.5 evaluation value for China was 30 μg/m3, a 34.8% decrease compared to 2015. The annual O3 evaluation value (90th percentile of O3-8 h concentration) came to 137 μg/m3, which obtained the first inflection point until 2020, although it was still 11.4% higher than in 2015. The PM2.5 concentrations in the “2 + 26” cities and the YRD region showed a steady downward trend, while the FWP and PRD regions exhibited some fluctuations. The O3-8 h concentrations in key regions showed a significant increase from 2015 to 2019 and the O3 concentrations exhibited slight fluctuations during 2020 and 2023 (Figure 2). The annual average concentration of O3 of 2019 shows a significant increase, which was 9–11 μg/m3 higher than that of 2017, 2018, and 2020, with an increase of 6.5–8%.
The PM2.5 and O3 pollution situation in China exhibits significant seasonal and regional variability, with considerable differences in pollution levels [7,8]. On a regional scale, areas with elevated levels of PM2.5 and O3 are predominantly found in regions with substantial pollutant emissions, including the “2 + 26” cities, the FWP, and the YRD. On a temporal scale, high pollution periods in the “2 + 26” cities, the FWP, and the YRD regions are relatively synchronized. PM2.5 pollution is prominent in autumn and winter, particularly from November to February. In contrast, O3 pollution peaks in the second and third quarters, especially from May to September. The PRD experiences relatively scattered O3 pollution throughout the year. Additionally, complex pollution involving both PM2.5 and O3 typically occurs from May to July in the “2 + 26” cities, from March to April in the YRD, and from November to January in the PRD (Figure 3).

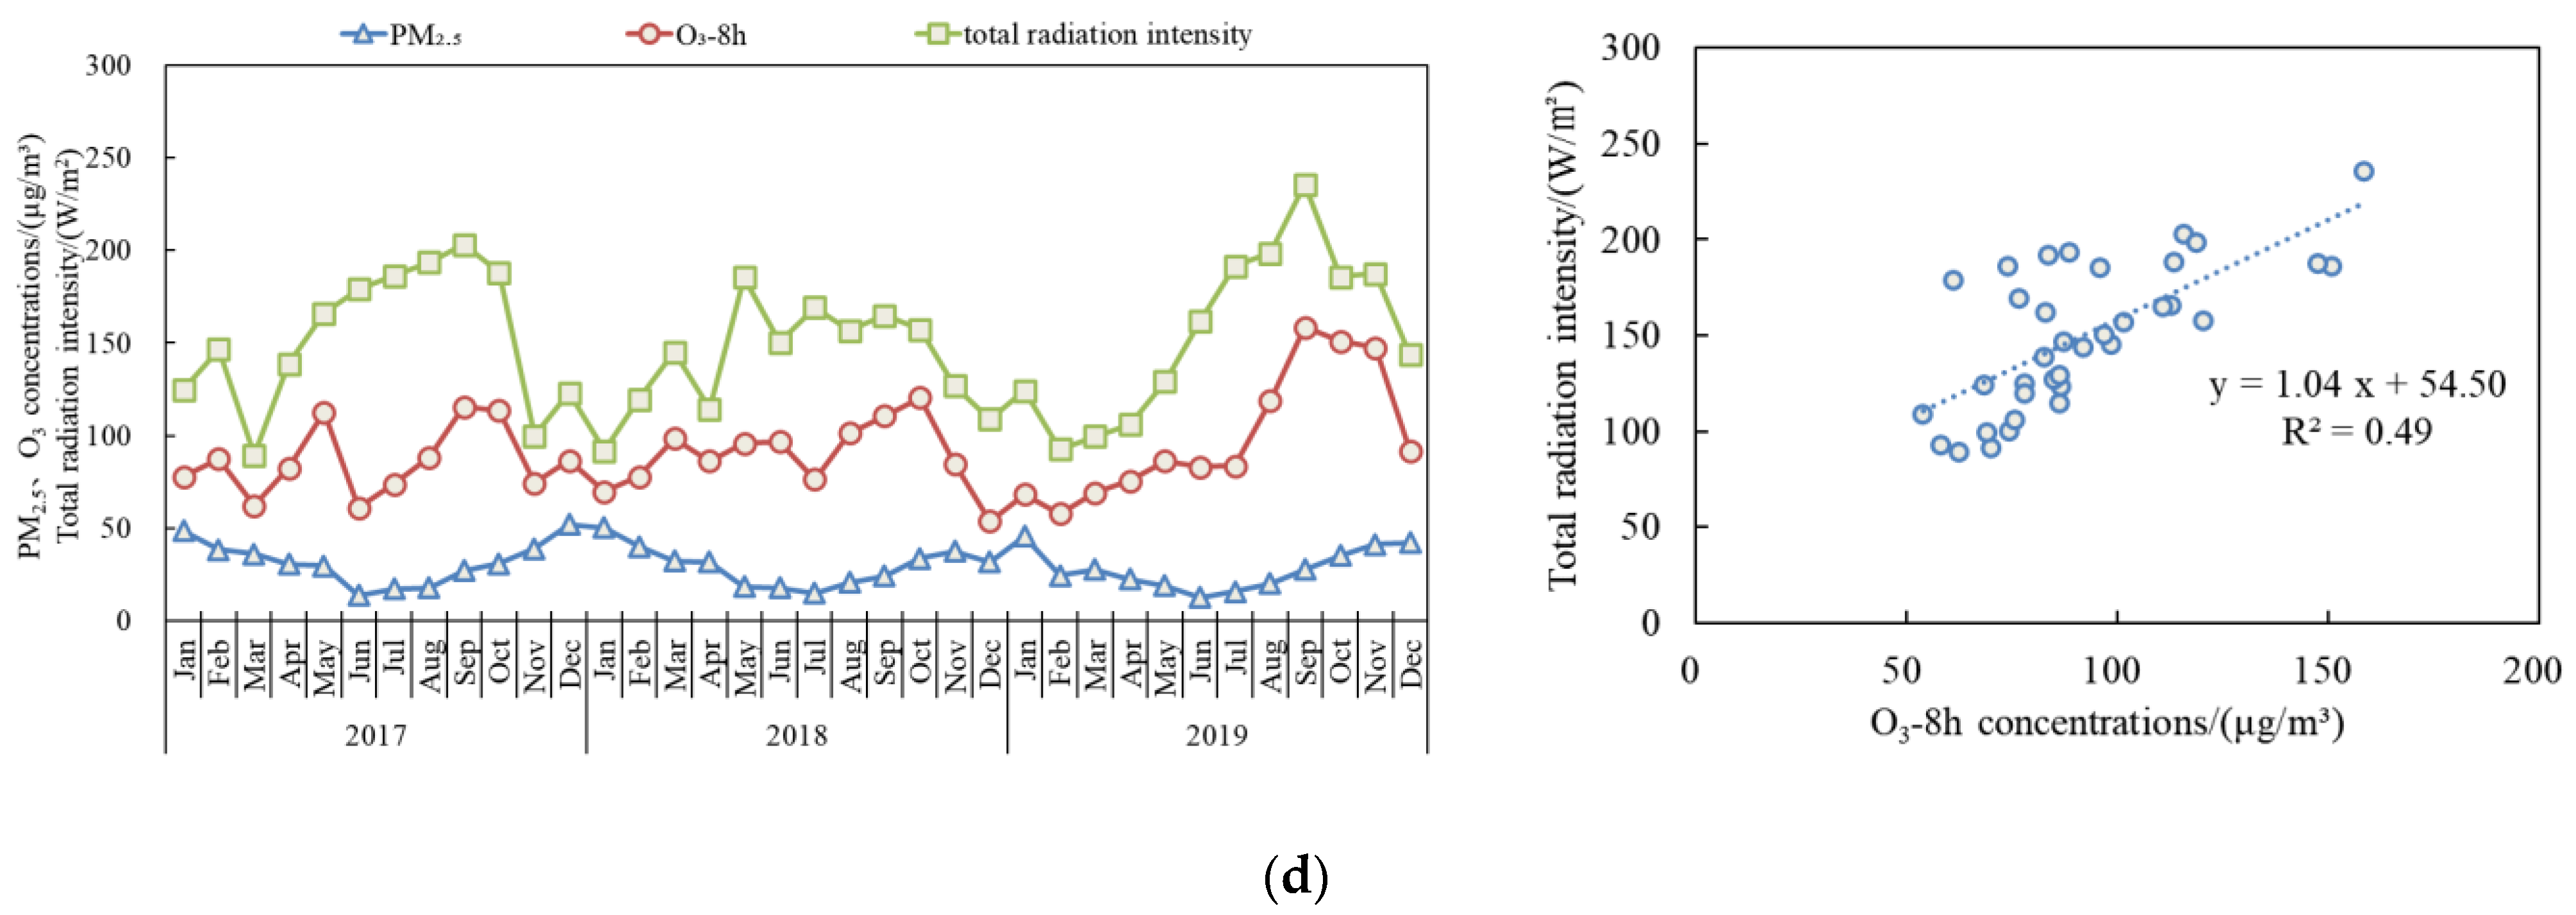
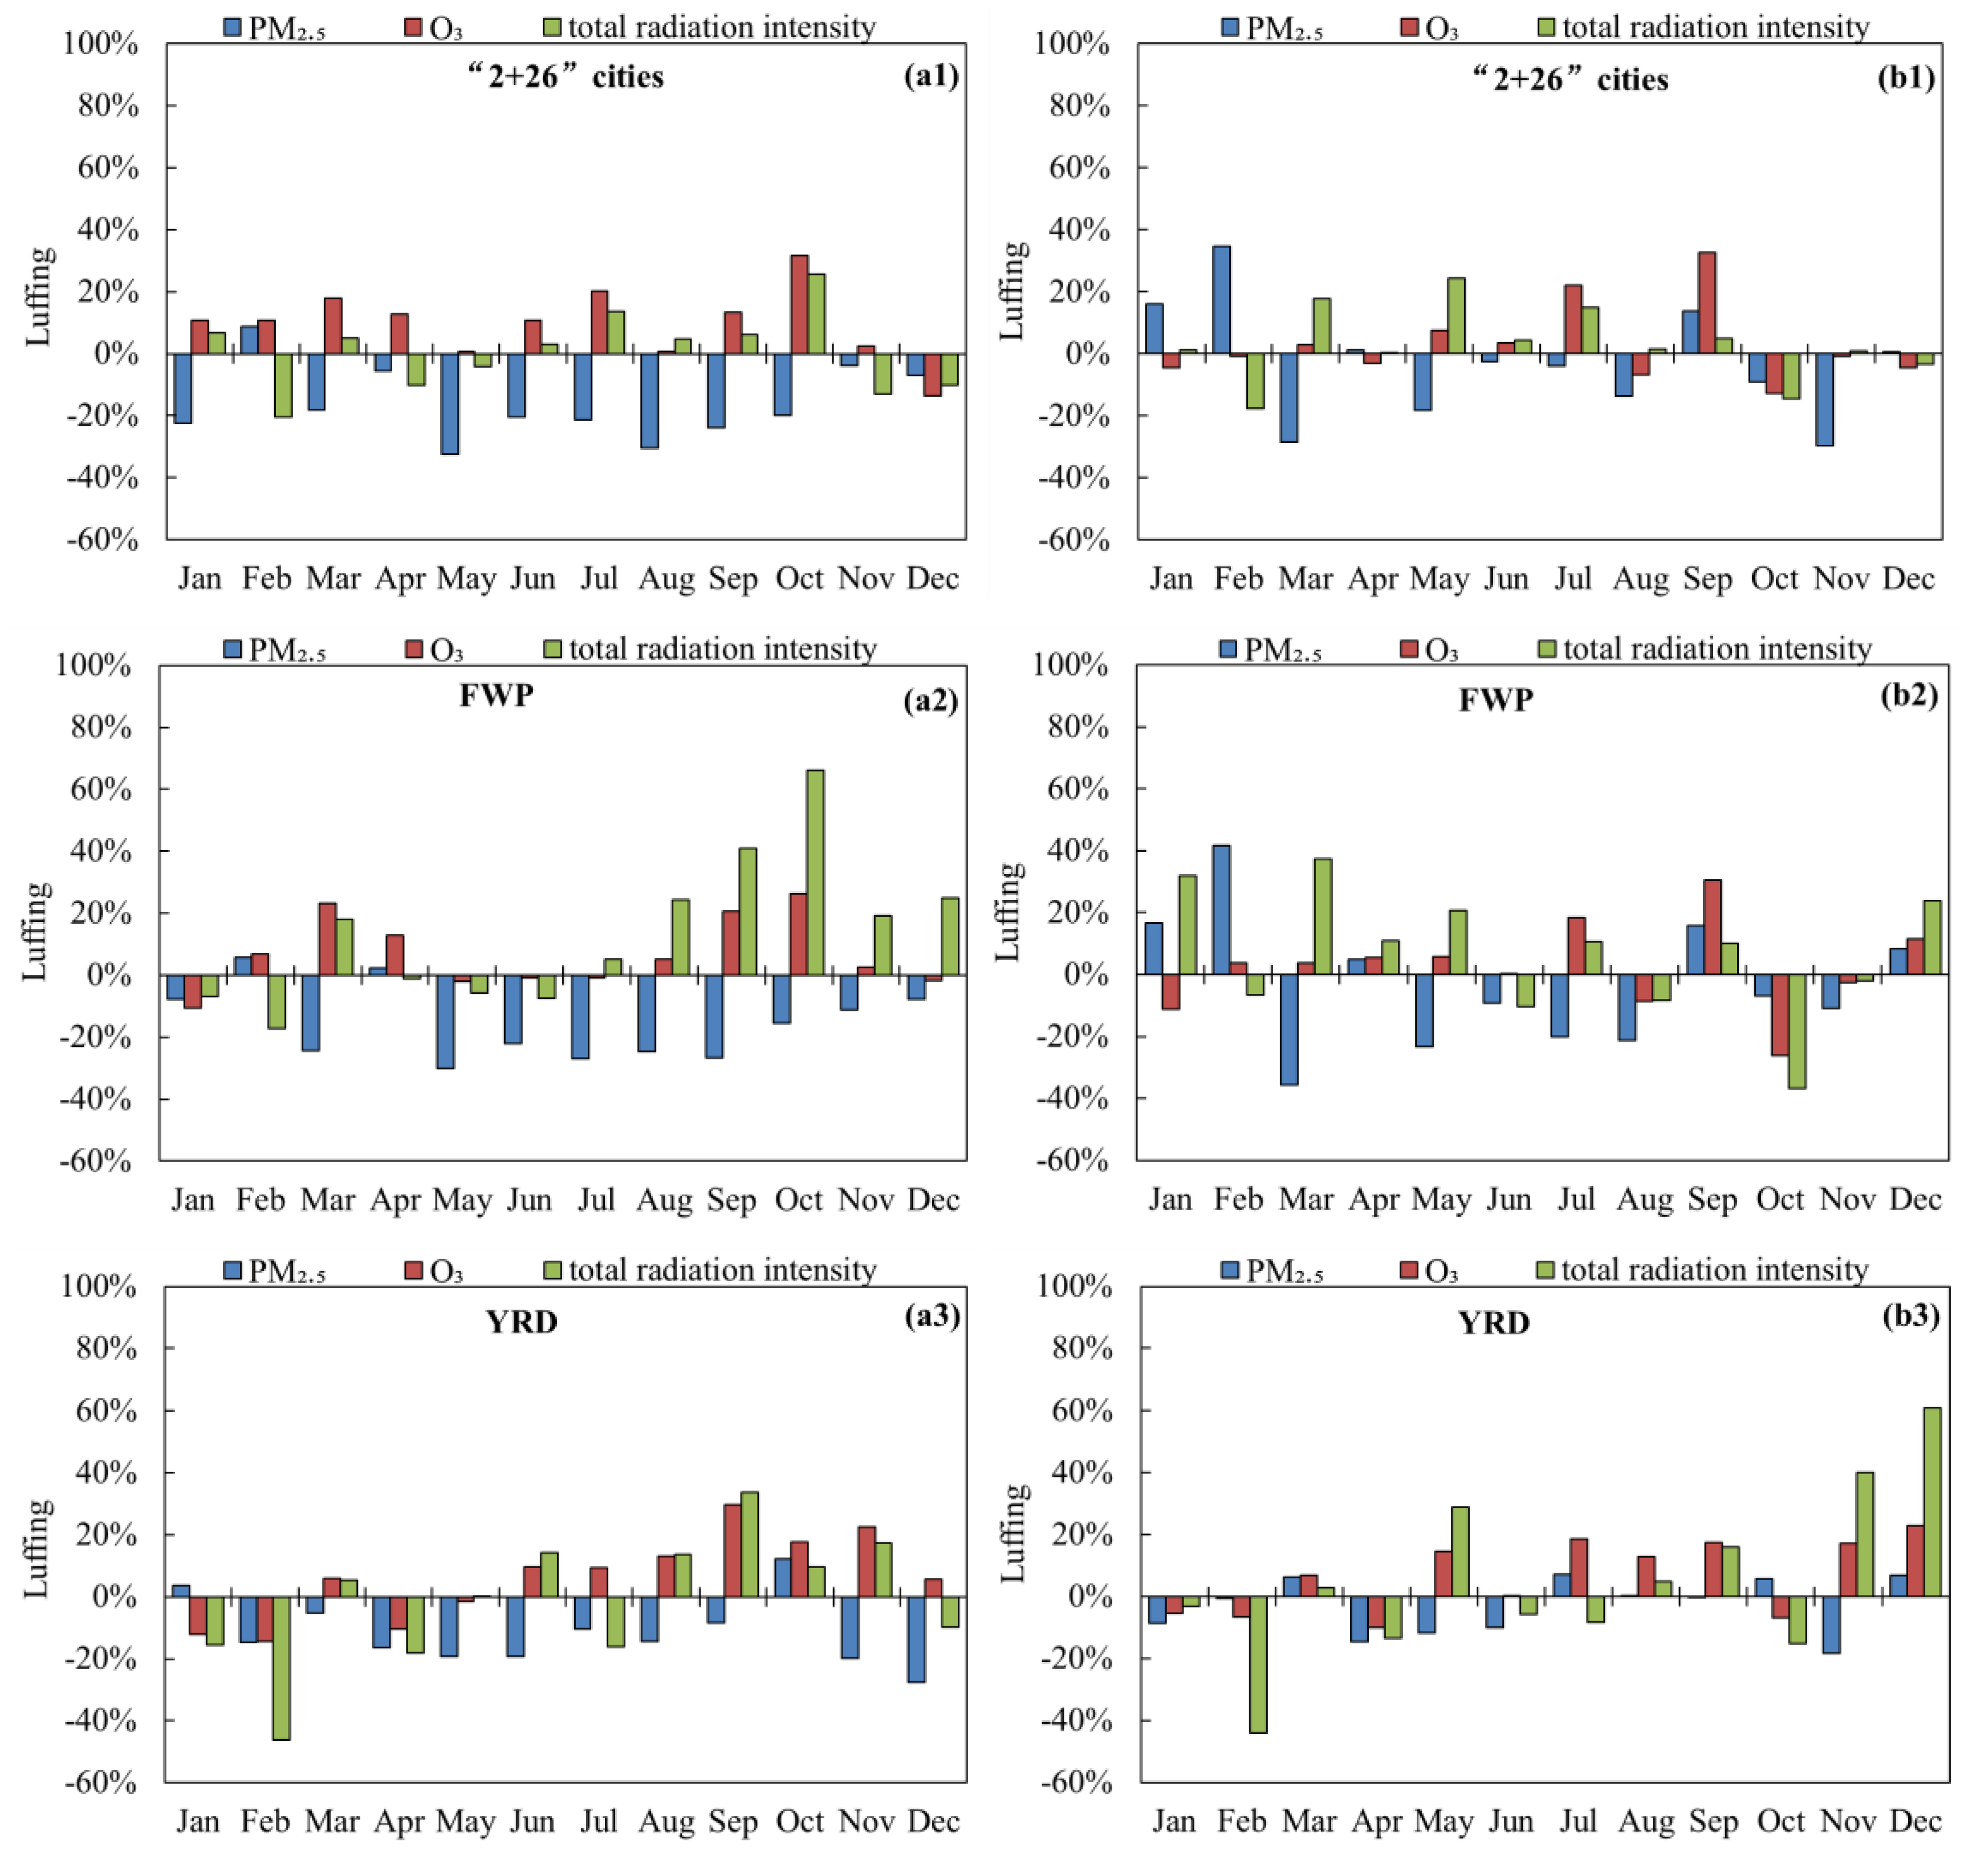
3.2. Changes in O3, PM2.5 Concentrations and Total Radiation Intensity

Figure 4 illustrates the monthly variations in PM2.5 and O3-8 h concentrations and total solar radiation intensity in key regions of China from 2017 to 2019. Overall, during late spring to early autumn, the high total solar radiation intensity, elevated temperatures and increased natural VOCs emissions [16] could lead to strong atmospheric photochemical reactions and elevate the O3 concentrations [17,18,19]. During the autumn and winter seasons, there is a significant decline in total solar radiation intensity and temperature. Furthermore, the escalation of primary emissions associated with heating activities contributes to a subsequent increase in PM2.5 concentrations. In the “2 + 26” cities, the FWP, and the YRD regions, the monthly mean O3-8 h concentrations generally follow the same trend as total solar radiation intensity, showing a significant positive correlation, with notable variations in different months. In contrast, the PRD region exhibits relatively small variations in meteorological conditions throughout the year, with less fluctuation in total solar radiation intensity compared to the three aforementioned regions, resulting in relatively smaller fluctuations in O3-8 h concentrations. Additionally, monsoon activity that affects weather conditions in China typically begins in April and September. Generally, the summer monsoon starts in April and progressively influences the central and eastern regions of China, beginning from the PRD region and moving northward, affecting the YRD region from mid-June to early July, and the North China Plain (NCP) from mid-July to late August. The winter monsoon usually starts in October, affecting the NCP and moving southward to cover the YRD region. During these periods, variations in temperature, rainfall, and regional pollutant transport lead to differences in pollutant concentrations across regions.
From August to September in 2019, continuous high temperatures in East and South China and other regions led to a sharp increase in O3 concentrations and O3 pollution days. On a global scale, 2019 was the second warmest year on record and the global O3 concentrations also abnormally increased by 10%. However, the monthly concentrations of PM2.5, O3, and total radiation intensity in 2019 of key regions of China did not exhibit clear patterns when compared to the same periods in 2017 and 2018 (Figure 5). The factors that affect the variation in solar radiation are complex, involving cloud cover, weather conditions, sunlight duration, relative humidity, and aerosol optical depth. The increase in surface radiation caused by the reduction in PM2.5 concentrations has a relatively small impact on the rise in O3 concentrations [20,21]. From the perspective of different months in key regions, the phenomena of simultaneous increases and decreases in PM2.5, O3 and solar radiation intensity exists, as well as patterns of inverse changes. Additionally, the interannual variability in total solar radiation intensity differs in different regions, with smaller variations observed in the “2 + 26” cities and larger differences in the PRD region.

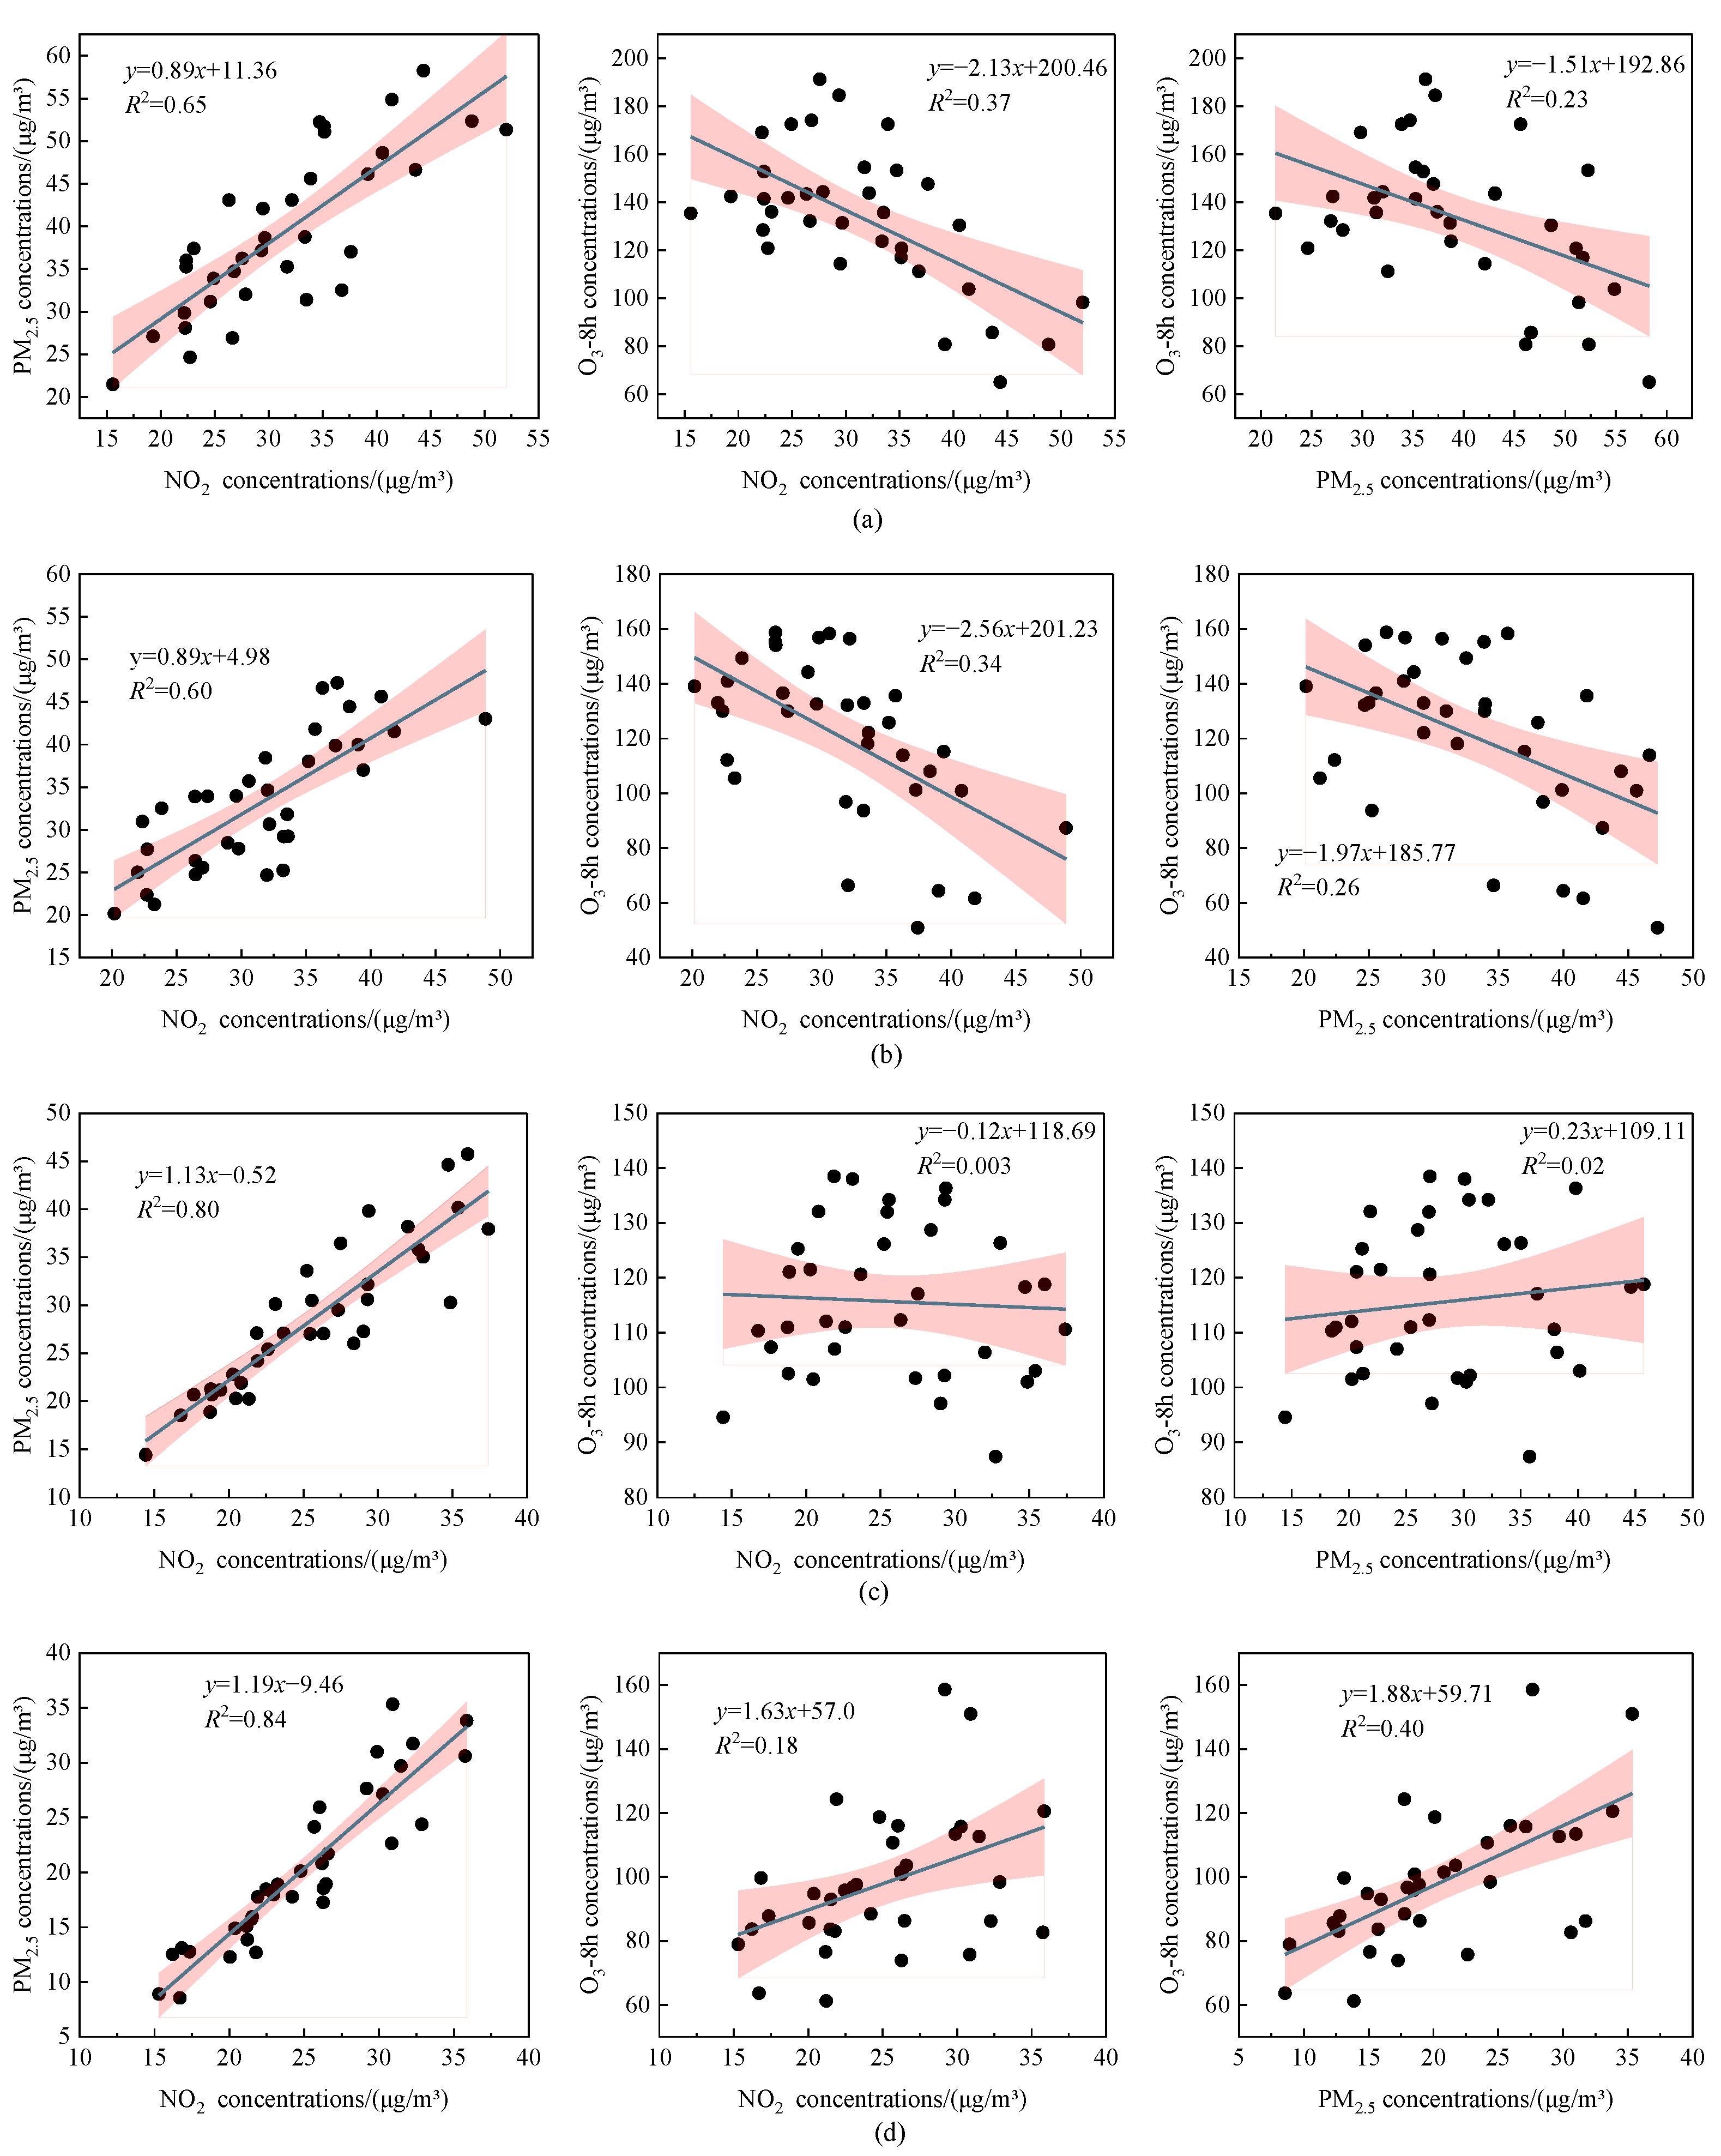
3.3. Relationships of O3 with NO2 and PM2.5

There is a nonlinear response relationship between O3 and its precursors (VOCs and NOx), and the variations in the reduction ratios of precursors may lead to short-term increases or decreases in O3 concentrations [22]. According to the National Bureau of Statistics (http://www.stats.gov.cn/sj/ndsj, accessed on 9 May 2024), with the intensification of air pollution control efforts, national NOx emissions in China decreased from 17.85 million tons in 2017 to 11.82 million tons in 2020, representing a reduction of 33.8%. Particulate matter emissions decreased from 16.84 million tons in 2017 to 6.13 million tons in 2020, a reduction of 63.6%. Meanwhile, data from the National Urban Air Quality Monitoring Network indicate that from 2017 to 2020, the NO2 concentration in ambient air decreased from 28 μg/m3 in 2017 to 24 μg/m3 in 2020, and obtained a reduction of 14.3%. PM2.5 concentration decreased from 40 μg/m3 in 2017 to 33 μg/m3 in 2020, and obtained a reduction of 17.5%. However, the O3-8 h concentration did not show a significant decreasing trend.
To analyze the impact of NO2 concentration changes on O3 and PM2.5 concentrations, the period from April to October [18], when O3 pollution is prevalent, was selected to study the relationships among the concentrations of these three pollutants in key regions of China. Monitoring data from 2017 to 2021 show (Table S1) that the annual average concentrations of PM2.5 and NO2 in key regions have generally declined steadily. The annual average O3-8 h concentrations in the “2 + 26” cities and the YRD region increased from 2017 to 2019 but decreased from 2019 to 2021, aligning with changes in NO2 concentrations. In the FWP, NO2 concentrations have overall declined, but O3-8 h concentrations have fluctuated. In the PRD region, O3-8 h concentrations have shown an oscillatory trend but also correspond with changes in NO2 concentrations. Additionally, in most regions, the monthly average values of PM2.5 and NO2 have shown a generally good synchrony downward trend across different years. However, the rise in O3 monthly average concentrations was observed in January to February over the past three years, as well as in November to December in the “2 + 26” cities, the FWP and the YRD region. During the autumn and winter seasons, O3 formation in key regions is primarily sensitive to VOCs, and the reduction in NO2 concentrations may be one of the factors contributing to the periodic increases in O3-8 h concentrations [23,24].
Additionally, impacts of the NO2 reduction on O3 concentrations vary in different regions but remain consistent with the PM2.5 concentration variation trends. The “2 + 26” cities and the YRD regions display a similar variation trend between NO2 and O3 (Figure 6a,c), which shows that the decreases in NO2 concentration initially cause the increase in O3 concentration and are followed by a decrease. Furthermore, both of them show a decreased trend in recent years from 2018 to 2019. In the FWP, the variations in NO2 and O3 concentrations exhibit opposite trends (Figure 6b), suggesting that VOCs may be a key factor for current O3 pollution control. In the PRD, the variations in NO2 and O3 concentrations show a similar trend, and the reductions in NO2 concentrations generally benefit the decrease in O3 concentrations (Figure 6d). During the implementation of the “Action Plan for Air Pollution Prevention and Control”, China made a great impact in reducing primary pollutant emissions, such as NOx and SO2, which led to a 23% reduction in NOx emissions and an 11.4% decrease in the ambient NO2 concentrations. However, due to relatively weak VOC emission reduction efforts, the O3 concentrations in 74 key cities in China increased from 139 μg/m3 in 2013 to 167 μg/m3 in 2017 [25]. Moreover, the increase in O3 concentrations during the COVID–19 pandemic indicates that the imbalance in NOx and VOC reduction ratios due to decreased human activities also significantly affects O3 concentration changes [25,26,27]. In summary, under the context of persistently high emission levels, variations in meteorological conditions and precursor emission reductions (NOx, VOCs) may lead to periodic fluctuations in O3 concentrations in China at some point [28,29,30].

4. Conclusions

China has made significant progress in improving air quality, with a notable decrease in PM2.5 concentration and a substantial reduction in the number of heavy pollution days in recent years. However, the issue of O3 pollution remains prominent. The variations in PM2.5, O3, and total radiation intensity exhibit distinct seasonal and regional differences in China. At the current stage, there is no inevitable link between the changes in PM2.5 concentration and total radiation intensity. The occurrence of pollution phenomena is the result of the combined effects of meteorological conditions, pollutant emissions, and geographical characteristics. Considering the complex nonlinear response relationship between O3 and its precursor NO2, it is necessary to consider the reduction ratios and strategies for NOx and VOCs comprehensively to avoid an increase in O3 concentration due to an imbalance precursors reduction.

Supplementary Materials

The following supporting information can be downloaded at https://www.mdpi.com/article/10.3390/atmos15121430/s1. Table S1: Monthly variations in PM2.5, O3-8 h, and NO2 concentrations in key regions of China from 2017 to 2021: (a) “2 + 26 “cities; (b) FWP; (c) YRD; and (d) PRD.

Author Contributions

Z.W.: Conceptualization, methodology, software. Y.R. and F.B.: conceptualization, supervision, writing—review and editing. D.Z.: methodology, investigation. R.G.: investigation. X.W.: investigation. H.L.: resources, funding acquisition. J.W.: investigation. All authors have read and agreed to the published version of the manuscript.

Funding

This research was funded by the Fundamental Research Funds for Central Public Welfare Scientific Research Institutes of China, Chinese Research Academy of Environmental Sciences (No. 2019YSKY-018), Environmental Protection Science and Technology Project of Fujian Province (No. 2022R021), National Natural Science Foundation of China (No.4 1907197).

Institutional Review Board Statement

Not applicable.

Informed Consent Statement

Not applicable.

Data Availability Statement

The data presented in this study are available on request from the corresponding author. The data are not publicly available due to privacy.

Conflicts of Interest

The authors declare no conflicts of interest.

References

  1. Han, H.; Liu, J.; Shu, L.; Wang, T.; Yuan, H. Local and synoptic meteorological influences on daily variability in summertime surface ozone in Eastern China. Atmos. Chem. Phys. 2020, 20, 203–222. [Google Scholar] [CrossRef]
  2. Xu, Y.L.; Xue, W.B.; Lei, Y.; Huang, Q.; Zhao, Y.; Cheng, S.Y.; Ren, Z.H.; Wang, J.N. Spatiotemporal variation in the impact of meteorological conditions on PM2.5 pollution in China from 2000 to 2017. Atmos. Environ. 2020, 223, 117215. [Google Scholar] [CrossRef]
  3. Olaguer, E.P. Atmospheric Impacts of the Oil and Gas Industry; Elsevier: Boston, MA, USA, 2017; pp. 31–45. [Google Scholar]
  4. Young, P.J.; Naik, V.; Fiore, A.M.; Gaudel, A.; Guo, J.; Lin, M.Y.; Neu, J.L.; Parrish, D.D.; Rieder, H.E.; Schnell, J.L.; et al. Tropospheric Ozone Assessment Report: Assessment of global-scale model performance for global and regional ozone distributions, variability, and trends. Elem. Sci. Anthr. 2018, 6, 10. [Google Scholar] [CrossRef]
  5. Cooper, O.R.; Parrish, D.D.; Ziemke, J.; Balashov, N.V.; Cupeiro, M.; Galbally, I.E.; Gilge, S.; Horowitz, L.; Jensen, N.R.; Lamarque, J.-F.; et al. Global distribution and trends of tropospheric ozone: An observation-based review. Elem. Sci. Anthr. 2014, 2, 000029. [Google Scholar] [CrossRef]
  6. Holland, H.D.; Turekian, K.K. Treatise on Geochemistry, 2nd ed.; Elsevier: Oxford, UK, 2014; pp. 1–18. [Google Scholar]
  7. Liu, C.H.; Deng, X.J.; Zhu, B.; Yin, C.Q. Characteristics of GSR of China’s three major economic regions in the past 10 years and its relationship with O3 and PM2.5. China Environ. Sci. 2018, 38, 2820–2829. [Google Scholar]
  8. Hou, M.Q.; Wang, W.Y.; Ming, Z.Y.; Wang, Y.L.; Zhang, J.P. Analysis on the impact of meteorological factors on ozone pollution in Chengdu. Environ. Sci. Technol. 2021, 44, 41–49. [Google Scholar]
  9. Zhang, H.; Jiang, H. Review on the causes and influencing factors of O3 pollution in China. Res. Environ. Sci. 2022, 35, 2657–2665. [Google Scholar]
  10. Tian, R.; Ma, X.; Jia, H.; Yu, F.; Sha, T.; Zan, Y. Aerosol radiative effects on tropospheric photochemistry with GEOS-Chem simulations. Atmos. Environ. 2019, 208, 82–94. [Google Scholar] [CrossRef]
  11. Zhao, S.; Hu, B.; Du, C.; Tang, L.; Ma, Y.; Liu, H.; Zou, J.; Liu, Z.; Wei, J.; Wang, Y. Aerosol optical characteristics and radiative forcing in urban Beijing. Atmos. Environ. 2019, 212, 41–53. [Google Scholar] [CrossRef]
  12. Jiang, H.; Gao, J.; Li, H.; Chu, W.; Chai, F. Preliminary research on theoretical framework of cooperative control of air pollution in China. Res. Environ. Sci. 2022, 35, 601–610. [Google Scholar]
  13. Zhang, H.; Jiang, H.; Gao, J.; Li, H. Formation mechanism and management strategy of cooperative control of PM2.5 and O3. Res. Environ. Sci. 2022, 35, 611–620. [Google Scholar]
  14. Jiang, H.; Chang, H.M. Analysis of China’s ozone pollution situation, preliminary investigation of causes and prevention and control recommendations. Res. Environ. Sci. 2021, 34, 1576–1582. [Google Scholar]
  15. Wang, X.Q.; Cheng, S.Y.; Wang, R.P. Emission characteristics and priority classification control of anthropogenic VOCs sources in Beijing-Tianjin-Hebei Region. Res. Environ. Sci. 2023, 36, 460–468. [Google Scholar]
  16. Meng, X.Y.; Li, J.Y.; Xie, S.Y.; Tang, G.G.; Xia, Q. Analysis of ozone pollution in 337 cities and key regions of China in 2017–2019. Environ. Monit. China 2021, 37, 9–17. [Google Scholar]
  17. Lin, W.P.; Guo, X.T. Spatial and temporal distribution characteristics of ozone in Urban agglomerations in China. China Environ. Sci. 2022, 42, 2481–2494. [Google Scholar]
  18. Li, H.; Peng, L.; Bi, F.; Li, L.; Bao, J.; Li, J.; Zhang, H.; Chai, F. Strategy of coordinated control of PM2.5 and ozone in China. Res. Environ. Sci. 2019, 32, 1763–1778. [Google Scholar]
  19. Liu, Y.; Li, L.; An, J.Y.; Huang, L.; Yan, R.S.; Huang, C.; Wang, H.L.; Wang, Q.; Wang, M.; Zhang, W. Estimation of biogenic VOC emissions and its impact on ozone formation over the Yangtze River Delta region, China. Atmos. Environ. 2018, 186, 113–128. [Google Scholar] [CrossRef]
  20. Mao, Z.C.; Xu, J.M.; Yang, D.D.; Yu, Z.Q.; Qu, Y.H.; Zhou, G.Q. Analysis of characteristics and meteorological causes of PM2.5-O3 compound pollution in Shanghai. China Environ. Sci. 2019, 39, 2730–2738. [Google Scholar]
  21. Hua, C.; Jiang, Q.; Chi, X.Y.; Liu, C. Meteorological characteristics of PM2.5–O3 air combined pollution in central and Eastern China in the summer half years of 2015–2020. Res. Environ. Sci. 2022, 35, 650–658. [Google Scholar]
  22. Chen, N.; Chen, L.; Wang, L.L.; Zhu, B.; Cao, W.X.; Xu, K.; Ding, Q.Q.; Lan, B.; Zhang, Z.X.; Wei, L.; et al. Characteristic and trend analysis of PM2.5 and ozone in air compound pollution in Hubei Province during 2015–2020. Res. Environ. Sci. 2022, 35, 659–672. [Google Scholar]
  23. Li, J.; Chen, X.S.; Wang, Z.F.; Du, H.Y.; Yang, W.Y.; Sun, Y.L.; Hu, B.; Li, J.J.; Wang, W.; Wang, T.; et al. Radiative and heterogeneous chemical effects of aerosols on ozone and inorganic aerosols over East Asia. Sci. Total Environ. 2018, 622/623, 1327–1342. [Google Scholar] [CrossRef] [PubMed]
  24. Li, S.M.; Liu, R.; Wang, S.; Chen, S.X. Radiative effects of particular matters on ozone pollution in six North China Cities. J. Geophys. Res. Atmos. 2021, 126, e2021JD035963. [Google Scholar] [CrossRef]
  25. Wang, N.; Lyu, X.P.; Deng, X.J.; Huang, X.; Jiang, F.; Ding, A.J. Aggravating O3 pollution due to NOx emission control in Eastern China. Sci. Total Environ. 2019, 677, 732–744. [Google Scholar] [CrossRef] [PubMed]
  26. Li, K.; Jacob, D.J.; Liao, H.; Qiu, Y.; Shen, L.; Zhai, S.; Bates, K.H.; Sulprizio, M.P.; Song, S.; Lu, X.; et al. Ozone pollution in the North China Plain spreading into the late-winter haze season. Proc. Natl. Acad. Sci. USA 2021, 118, e2015797118. [Google Scholar] [CrossRef]
  27. Li, K.; Jacob, D.J.; Liao, H.; Zhu, J.; Shah, V.; Shen, L.; Bates, K.H.; Zhang, Q.; Zhai, S. A two-pollutant strategy for improving ozone and particulate air quality in China. Nat. Geosci. 2019, 12, 906–910. [Google Scholar] [CrossRef]
  28. Zhang, K.; Liu, Z.Q.; Zhang, X.J.; Li, Q.; Jensen, A.; Tan, W.; Huang, L.; Wang, Y.J.; de Gouw, J.; Li, L. Insights into the significant increase in ozone during COVID-19 in a typical urban city of China. Atmos. Chem. Phys. 2022, 22, 4853–4866. [Google Scholar] [CrossRef]
  29. Xu, W.Y.; Zhang, G.; Wang, Y.; Tong, S.R.; Zhang, W.Q.; Ma, Z.Q.; Lin, W.L.; Kuang, Y.; Yin, L.Y.; Xu, X.B. Aerosol promotes peroxyacetyl nitrate formation during winter in the North China plain. Environ. Sci. Technol. 2021, 55, 3568–3581. [Google Scholar] [CrossRef]
  30. Wang, H.L.; Huang, C.; Tao, W.; Gao, Y.; Wang, S.; Jing, S.; Wang, W.; Yan, R.; Wang, Q.; An, J.; et al. Seasonality and reduced nitric oxide titration dominated ozone increase during COVID-19 lockdown in Eastern China. npj Clim. Atmos. Sci. 2022, 5, 24. [Google Scholar] [CrossRef]
Figure 1. Key region for air pollution prevention and control in China.
Atmosphere 15 01430 g001
Figure 2. Variations in PM2.5 and O3-8 h concentrations in key regions of China from 2015 to 2023.
Atmosphere 15 01430 g002
Figure 3. Variations in (a) PM2.5 and (b) O3-8 h daily concentrations in key regions of China from 2017 to 2021.
Atmosphere 15 01430 g003aAtmosphere 15 01430 g003b
Figure 4. Monthly variations and correlations of PM2.5 and O3-8 h concentrations and total solar radiation intensity in key regions of China from 2017 to 2019: (a) “2 + 26 “cities; (b) FWP; (c) YRD; and (d) PRD.
Atmosphere 15 01430 g004aAtmosphere 15 01430 g004b
Figure 5. (a) Compared to 2017 and (b) compared to 2018, the year-on-year changes in PM2.5 concentration, O3-8 h concentration, and total radiation intensity for each month in key regions of China in 2019.
Atmosphere 15 01430 g005aAtmosphere 15 01430 g005b
Figure 6. Correlations of mean O3-8 h, PM2.5 and NO2 concentration in key regions of China from April to October, 2017 to 2019: (a) “2 + 26 “cities; (b) FWP; (c) YRD; and (d) PRD. The pink shaded area represents the 95% confidence interval.
Atmosphere 15 01430 g006
Table 1. Regional divisions of China.
RegionCityNumber of Cities
“2 + 26” citiesBeijing, Tianjin, Shijiazhuang, Tangshan, Handan, Xingtai, Baoding, Cangzhou, Langfang, Hengshui, Taiyuan, Yangquan, Changzhi, Jincheng, Jinan, Zibo, Jining, Dezhou, Liaocheng, Binzhou, Heze, Zhengzhou, Kaifeng, Anyang, Hebi, Xinxiang, Jiaozuo, Puyang28
FWPJinzhong, Yuncheng, Linfen, Luliang, Luoyang, Sanmenxia, Xi’an, Tongchuan, Baoji, Xianyang, Weinan11
YRDShanghai, Nanjing, Wuxi, Xuzhou, Changzhou, Suzhou, Nantong, Lianyungang, Huai’an, Yancheng, Yangzhou, Zhenjiang, Taizhou, Suqian, Hangzhou, Ningbo, Wenzhou, Jiaxing, Huzhou, Jinhua, Quzhou, Zhoushan, Taizhou, Lishui, Shaoxing, Hefei, Wuhu, Bengbu, Huainan, Ma’anshan, Huaibei, Tongling, Anqing, Huangshan, Chuzhou, Fuyang, Suzhou, Lu’an, Bozhou, Chizhou, Xuancheng41
PRDGuangzhou, Foshan, Zhaoqing, Shenzhen, Dongguan, Huizhou, Zhuhai, Zhongshan, Jiangmen9
Disclaimer/Publisher’s Note: The statements, opinions and data contained in all publications are solely those of the individual author(s) and contributor(s) and not of MDPI and/or the editor(s). MDPI and/or the editor(s) disclaim responsibility for any injury to people or property resulting from any ideas, methods, instructions or products referred to in the content.

