Article

Examining the Spatial and Temporal Variation of PM2.5 and Its Linkage with Meteorological Conditions in Dhaka, Bangladesh

by
Mizanur Rahman
1,2 and
Lei Meng
1,*
1
School of Environment, Geography, and Sustainability, Western Michigan University, Kalamazoo, MI 49008, USA
2
Little Rock Water Reclamation Authority, 11 Clearwater Dr, Little Rock, AR 72204, USA
*
Author to whom correspondence should be addressed.
Atmosphere 2024, 15(12), 1426; https://doi.org/10.3390/atmos15121426
Submission received: 1 November 2024 / Revised: 20 November 2024 / Accepted: 25 November 2024 / Published: 27 November 2024
(This article belongs to the Special Issue Land-Atmosphere Interactions)

Abstract

:
This study investigates the temporal and spatial variations in PM2.5 concentrations in Dhaka, Bangladesh, from 2001 to 2023 and evaluates the impact of meteorological factors and the effectiveness of mitigation strategies on air pollution. Using satellite and ground-based data, this study analyzed the seasonal trends, daily fluctuations, and the influence of COVID-19 lockdown measures on air quality. Our findings reveal a persistent increase in PM2.5 levels, particularly during winter, with concentrations frequently exceeding WHO guidelines. Our analysis suggests significant correlations between meteorological conditions and PM2.5 concentration, highlighting the significant role of meteorological conditions, such as rainfall, humidity, and temperature, in modulating PM2.5 levels. Our analysis found that PM2.5 levels exhibited a significant inverse correlation with relative humidity (r = −0.72), rainfall (r = −0.69), and temperatures (r = −0.79), highlighting the role of meteorological conditions in mitigating pollution levels. Additionally, the study underscores the temporary improvements in air quality during lockdown periods, demonstrating the potential benefits of sustained emission control measures. The research emphasizes the need for comprehensive and multi-faceted air quality management strategies, including stringent vehicular and industrial emissions regulations, enhancement of urban green spaces, and public awareness campaigns to mitigate the adverse health impacts of PM2.5 pollution in Dhaka.

1. Introduction

Deterioration of air quality in developing countries has become a major concern due to its profound impacts on the environment, public health, and climate change [1]. In Bangladesh, rapid industrialization and urbanization have led to elevated PM2.5 emissions, resulting in deteriorating air quality and a rise in severe health issues, such as respiratory and cardiovascular diseases. Furthermore, air pollution exacerbates the effects of climate change, negatively impacting agriculture and livelihoods, thereby posing a substantial threat to the country’s socio-economic development [2].
It is well known that exposure to high PM2.5 concentrations leads to many health problems, including heart and breathing diseases. For instance, Xing et al. identified PM2.5’s ability to penetrate the lungs, causing inflammation, reduced lung function, and increased asthma and cancer risks [3]. Wang et al. found that PM2.5 exposure is linked to several cardiovascular issues and emphasized the need for public health measures to reduce exposure and mitigate risks, especially for the elderly, who are more susceptible to PM2.5-related cardiovascular effects [4]. Thangavel et al. reviewed the toxicity of PM2.5 in humans, highlighting significant health risks such as oxidative stress and inflammation, contributing to cardiopulmonary diseases, cancers, and adverse pregnancy outcomes, underscoring the urgent need for stricter air quality regulations [5]. Apte et al. assessed global mortality attributable to PM2.5, suggesting that reducing PM2.5 levels in line with WHO guidelines could prevent approximately 750,000 of the 3.2 million annual deaths attributable to PM2.5, underscoring the substantial health benefits of reducing PM2.5 concentrations, particularly in highly polluted regions [6]. Apte et al. quantified the global impact of ambient PM2.5 on life expectancy, finding that PM2.5 exposure in 2016 reduced global life expectancy by about one year and achieving WHO Air Quality Guidelines for PM2.5 could increase global life expectancy by a population median of 0.6 years, comparable to eradicating major cancers [7].
Previous studies have suggested that changes in PM2.5 concentration are often associated with socioeconomic status and environmental degradation. Ji et al. analyzed socioeconomic drivers of PM2.5 pollution in 79 developing countries, revealing that income, urbanization, and the service sector significantly impact PM2.5 levels, suggesting that economic and urban development stages play crucial roles in shaping PM2.5 pollution dynamics [8]. Eeftens et al. found particulate matter concentration higher in Southern Europe because of more local pollution sources such as industries [9]. Scolio et al. conducted a spatial analysis of intra-urban air pollution disparities in Philadelphia and found positive relationships between PM2.5 concentrations and socioeconomic variables, underscoring the importance of considering spatial autocorrelation in environmental justice studies [10]. Similarly, Gurley et al. identified indoor air pollution from biomass fuel use and poor ventilation as key contributors to higher PM2.5 levels, particularly in winter [11]. Lim et al. identified that high-risk zones were primarily located in India, China, and sub-Saharan Africa, where PM2.5 levels were influenced by population growth and urban expansion [12,13].
PM2.5 can be emitted from many different sources, including fossil fuel burning, vehicle exhaust, and land cover land use changes. For example, Lin et al. identified the primary sources of PM2.5 in China include urban dust, coal dust, and vehicle exhaust [13]. Lee et al. studied PM2.5 in Toronto, Canada, using daily measurements and source apportionment, identifying eight major sources, including coal combustion, motor vehicles, and road salt, with motor vehicles contributing about 40% of the PM2.5 [14]. PM2.5 concentrations also vary from region to region and from season to season. Jin et al. investigated spatiotemporal variations of PM2.5 emissions in China from 2005 to 2014, identifying major sources like thermal power, biomass burning, and building materials, with regional disparities influenced by urbanization and industrialization [15]. Ye et al. conducted a year-long study of PM2.5 in Shanghai, revealing significant seasonal variations and highlighting the impact of coal combustion and local sources on air quality [16]. Wang et al. studied ion chemistry and sources of PM2.5 in Beijing, finding significant seasonal variations with higher levels in winter due to coal burning and secondary transformation processes [17].
Vehicular emissions and biomass burning release several gas-phase components, primarily nitrogen oxides (NOx), sulfur dioxide (SO2), volatile organic compounds (VOCs), and ammonia (NH3) [18]. These gases contribute to PM2.5 both directly and through secondary particle formation. Gas-to-particle conversion occurs when gases like NOx and SO2 react in the atmosphere to form secondary inorganic aerosols, such as nitrates and sulfates, which are components of PM2.5. VOCs, under sunlight and oxidizing conditions, can form secondary organic aerosols (SOA), contributing significantly to PM2.5 [19,20]. Dhaka’s high humidity and warm temperatures enhance these reactions, leading to substantial secondary aerosol formation. The high sulfur content in Dhaka’s vehicular emissions is primarily due to the use of low-quality fuels that contain elevated sulfur levels [21]. Unlike in many developed countries where ultra-low sulfur diesel is mandated, Bangladesh lacks stringent regulations on fuel sulfur content, resulting in higher sulfur emissions from vehicles. Additionally, the prevalence of older vehicles that lack sulfur-reducing technologies exacerbates this issue. Thus, the high sulfur content in vehicular emissions is not a universal feature but rather a result of local regulatory conditions and fuel quality in Bangladesh.
Studies have suggested that the spatial and temporal distribution of PM2.5 concentration are significantly influenced by meteorological conditions, including temperatures, winds, relative humidity, and rainfall. Hien et al. investigated the influence of meteorological conditions on PM2.5 during the monsoon season in Hanoi, Vietnam, and found that warm air tends to produce more favorable atmosphere dispersion conditions that reduce PM2.5 concentrations than cold air [22], while Wang and Ogawa argued that high air temperatures promote photochemical processes that increase PM2.5 concentration in Nagasaki, Japan [4]. In the Khulna Metropolitan area, elevated land surface temperatures (LST) were found to be associated with increased PM2.5 levels, particularly in densely urbanized zones [23]. These different conclusions on the relationship between temperatures and PM2.5 suggest that a complex relationship exists. Wang and Ogawa also found that the correlation between PM2.5 and wind speed varies depending on the wind speed. Faisal et al. found a weak correlation between wind speed and PM2.5 in Dhaka [24]. Meng et al. found that relative humidity tends to have a positive relationship with PM2.5 because high relative humidity promotes the production of secondary aerosols, leading to increased PM2.5 concentrations [25]. The impact of precipitation on PM2.5 could vary depending on precipitation types and intensity. Li et al. found that daytime drizzle and light rain could significantly increase PM2.5 due to phase distribution changes between gas and aerosol phases in the spring season, while increased rainfall intensity and duration can remove PM2.5 efficiently [26]. In Dhaka city, previous studies have suggested that PM2.5 tends to have a positive correlation with temperatures and a negative correlation with rainfall and relative humidity [27]. Seasonal variations also impact PM2.5 levels, as lower rainfall during the winter season leads to higher concentrations of pollutants in the air [28]. PM2.5 levels peak during winter due to cooler temperatures, low wind speeds, and minimal precipitation, all of which restrict atmospheric dispersion and foster pollutant accumulation [20,29,30]. Conversely, during the monsoon season, increased rainfall, humidity, and higher temperatures facilitate wet deposition, substantially lowering PM2.5 concentrations [31,32,33]. Daily patterns show morning and evening PM2.5 peaks, aligned with rush hours and low morning temperatures, which inhibit vertical mixing.
Dhaka, the capital of Bangladesh, ranks among the world’s fastest-growing megacities and is characterized by severe ambient air pollution. Recent studies have examined the spatial and temporal variations of PM2.5 in Dhaka, Bangladesh, in relation to land use and meteorological conditions [34]. Green spaces help reduce urban PM2.5 by capturing particles on leaves, though they also contribute to PM2.5 through biogenic volatile organic compounds (BVOCs) emissions, which can form secondary organic aerosols (SOAs) under sunlight. However, the net effect remains positive, as particle capture often outweighs SOA formation, as green areas can effectively trap airborne particles, enhancing urban air quality [35]. Zarin and Esraz-Ul-Zannat analyzed land use and land cover (LULC) changes and found a positive correlation between PM2.5 concentrations and the expansion of built-up areas, while vegetation and waterbodies showed a negative correlation, indicating that urbanization significantly exacerbates air pollution [36]. Saha et al. demonstrated that urban expansion in cities like Dhaka strongly correlates with increased emissions of pollutants such as CO, NO2, and SO2, while green spaces help mitigate these effects [37]. Nayeem et al. focused on brick kilns as a major source of PM2.5 pollution in Dhaka, highlighting how their expansion from 2006 to 2018 contributed to the worsening air quality [38]. These studies have highlighted that the high levels of PM10 and PM2.5 were primarily attributed to emissions from diesel-powered vehicles, gasoline engines, brick kilns, industrial operations, vehicular exhaust with high sulfur content, and re-suspended road dust [39]. The rapid population growth, unchecked urbanization, extensive industrialization, and increasing numbers of motor vehicles have collectively exacerbated air pollution in Dhaka. The city is notably the second-highest emitter of PM2.5 globally [40].
The average atmospheric concentration of PM2.5 in Dhaka (80 µg/m3) surpasses Bangladesh’s national standard by a factor of five and the World Health Organization (WHO) standards by more than eight times, posing significant health risks to the approximately 21 million residents within the city’s 306.4 km2 area [24]. The critical level of air pollution in Dhaka has led to widespread health issues among the city’s inhabitants, including eye irritation, severe headaches, impaired blood circulation, respiratory ailments, and premature mortality. In 2019, air pollution was responsible for 78,145 to 88,229 deaths in Bangladesh, making it the second largest cause of death and disability. According to the World Bank, this severe impact on public health also had significant economic repercussions, costing the country approximately 3.9 to 4.4 percent of its GDP.
Dhaka exemplifies urban air quality challenges faced by emerging megacities. The city’s pollution profile reflects the compounded impact of vehicular emissions, industrial output, and high-density urban development [24]. This study’s focus on Dhaka offers a representative study that contributes to the broader understanding of air quality management in rapidly urbanizing regions, which consistently exceed both its national PM2.5 concentration limit as well as WHO’s recommended PM2.5 concentration limit, for example, Lahore, Peshawar, Delhi, etc. [41,42,43]. By highlighting Dhaka’s global relevance and sharing findings that can apply to other megacities, this study enhances the broader applicability of urban air quality control insights.
Given the critical air pollution levels in Dhaka City, research on variations of PM2.5 and its causes is essential for informing authorities and policymakers about strategies to improve air quality. Faisal et al. assessed temporal variations of PM2.5 and influences of COVID lockdown and meteorological conditions on PM2.5 levels in Dhaka City from 2019 to 2021 using the same datasets as those used in this paper [24]. We extended the study period from 2001 to 2023 and applied different methods (which will be described in our methodology section) to investigate the relationship between PM2.5 and meteorological conditions. Our overall goal is to investigate the inter-annual variations of PM2.5 levels and their association with meteorological factors, offering crucial insights for policymakers on emission controls, urban green spaces, and seasonal strategies to mitigate PM2.5 pollution in Dhaka. This study will also examine the impact of the COVID-19 lockdown policy on PM2.5 levels using data obtained from U.S. Embassy measurements. This paper is organized as follows: Section 2 describes the study area, datasets, and methods, followed by results and discussion in Section 3, Section 4 and Section 5. Summaries and conclusions are presented in Section 6.

2. Study Area, Dataset, and Methods

2.1. The Study Area

Dhaka is the capital city of Bangladesh and has a tropical monsoon climate. It has a hot and humid climate for most of the year, with summer temperatures (March to June) often exceeding 35 °C and milder winter temperatures (December to February) ranging from 10 °C to 20 °C [27]. The monsoon season, from June to October, brings heavy rainfall and high humidity, with around 2000 mm of annual precipitation, while there is little precipitation during the dry season from November to March.

2.2. Datasets

2.2.1. Global Annual PM2.5 Data

The global annual PM2.5 satellite data are obtained from the Socioeconomic Data and Applications Center (SEDAC), managed by the NASA Earth Science Data and Information System (ESDIS) project. This dataset was derived from multiple satellite algorithms including NADA MODerate Resolution Imaging Spectroradiameter Collection 6.1 (MODIS C6.1), Multi-annual Imaging SpectroRadiometer Version 23 (MISRv23), MODIS Multi-Angle Implementation of Atmospheric Correction Collection 6 (MAIAC C6), and the Sea-Viewing Wide Field-of-View Sensor (SeaWiFS0 Deep Blue Version 4) [44]. The annual PM2.5 grid data have a spatial resolution of 0.01 degrees. This dataset has been used in previous studies to investigate the level of PM2.5 globally and, most importantly, in developing countries where ground-level data are unavailable [8].

2.2.2. In Situ PM2.5 Data

The United States Embassy in Dhaka, Bangladesh, collects real-time atmospheric data and publicly shares this information via the AirNow Department of State (AirNow DOS). This study utilized daily PM2.5 data collected by the U.S. Embassy in Dhaka for the years 2018, 2020, 2022 and 2023. For the correlation analysis, PM2.5 and meteorological data from 2018, 2022 and 2023 were analyzed, and the years 2019 to 2021 were excluded to minimize the potential influences of the COVID-19 lockdown on air quality trends. The impact of the COVID-19 lockdown on air quality was examined separately. Data were obtained using this link of the U.S. Embassies and Consulates at AirNow.gov (accessed on 30 October 2024). The U.S. Embassy employs a beta attenuation monitor (BAM)—1020, PM Coarse System, which measures the local PM2.5 dataset on an hourly basis. The BAM—1020 is designed for continuous monitoring of PM2.5 and features a mechanism that filters out larger particles (>2.5 µm), allowing air to pass through a heated chamber (up to 20 °C) impacting a filter tape exposed to beta radiation. The degree of radiation absorption by the particulate matter on the filter tape is crucial for PM2.5 calculation, following sensitive calibration procedures. Numerous studies have validated BAM as a reliable method for continuous monitoring, confirming that brief exposure to beta radiation does not alter particle size or composition under normal operational conditions [45,46,47]. After collecting the data, it was processed to obtain the monthly average PM2.5 and average daily PM2.5 to analyze and then these were presented through various visualization techniques. It should be noted that the measurement at the U.S. Embassy may not represent the average PM2.5 concentration in Dhaka City. However, it is reasonable to assume that the trend and variation of PM2.5 levels are likely representative of those observed throughout Dhaka city. We are unable to verify this due to data limitations.

2.2.3. The Meteorological Variables Used in This Study

Meteorological conditions significantly influence air pollution events and emission control [30]. This study employs daily average PM2.5 concentration data alongside daily meteorological data, including rainfall, temperature, humidity, and wind speed, to evaluate the impact of climatic factors on PM2.5 concentrations in Dhaka City. The data were obtained from NASA’s Prediction of Worldwide Energy Resources (POWER) Project, which provides a comprehensive array of meteorological information. The meteorological data in POWER have a spatial resolution of ½ a degree latitude by 5/8-degree longitude and were based upon Goddard’s Global Modeling and Assimilation Office (GMAO) Modern Era Retrospective-Analysis for Research and Applications (MERRA-2) assimilation model products and GMAO Forward Processing—Instrument Teams (FP-IT) GEOS 5.12.4 near-real-time products. More details on data description can be found at POWER|DAV, https://power.larc.nasa.gov/data-access-viewer/ (accessed on 1 November 2024). As PM2.5 data were measured using the machine installed in the U.S. embassy in Dhaka City, the corresponding meteorological data were collected from the nearest grid cell to the U.S. embassy (Scheme 1).

2.3. Methods

In this study, variations in PM2.5 on daily, monthly, and annual time scales in Dhaka City will be investigated with Pearson’s r correlation and trend analyses. Pearson’s r correlation was selected due to its straightforward interpretation and effectiveness in highlighting linear relationships between PM2.5 and meteorological variables, which are key to this study’s objectives. In this study, we investigated the impact of the COVID-19 lockdown policy and meteorological factors on PM2.5 separately. The correlation analysis between PM2.5 and meteorological factors explicitly excluded PM2.5 data from 2019 and 2020 that were influenced by the COVID-19 lockdown policy.

3. Results

3.1. Annual Variations in PM2.5 Concentrations in Dhaka City from 2001 to 2019

It can be seen from Figure 1 that a significant escalation in air pollution over the years occurs. In 2001 (Figure 1a), the annual average PM2.5 levels were predominantly within the 50–60 µg/m3 range, not aligning with WHO’s interim target of 5 µg/m3 for annual mean concentrations. By 2005 (Figure 1b), a noticeable shift toward higher concentrations of 61–70 µg/m3 began, indicating a continuous deviation from WHO’s guidelines and an increase in PM2.5 concentration. This upward trend continued into 2010 (Figure 1c), when the entire city fell within the 61–70 µg/m3 range, moving further away from the acceptable limits set by WHO.
The situation worsened by 2015 (Figure 1d), when PM2.5 concentrations increased dramatically, with substantial areas falling within the 71–80 µg/m3 range and some regions exceeding 81 µg/m3. This categorically places Dhaka’s air quality in the hazardous zone, significantly above the WHO’s recommended annual mean of 5 µg/m3. According to our study, the annual PM2.5 concentration is at least 10 times higher than the annual limit, which is very concerning. By 2019 (Figure 1e), the pollution remained critically high, predominantly within the 71–80 µg/m3 range, underscoring the persistent and severe air quality issues in Dhaka City.
There is a steady increase in annual mean PM2.5 concentrations averaged over Dhaka from 2001 to 2019, peaking in 2015 before experiencing a slight decline in 2019 (Figure 2). This trend indicates a worsening of air quality over the years, with a notable peak likely due to increased urbanization and industrial activities. Despite the slight improvement post 2015, the PM2.5 levels in 2019 remain significantly high, underscoring the need for continued and enhanced air quality management efforts.
Comparing these trends with WHO’s air quality guidelines, it is evident that Dhaka City has consistently exceeded the safe limits for PM2.5 concentrations. Over the years, the increase in PM2.5 levels reflects urban expansion, increased vehicular emissions, industrial activities, and possibly biomass burning [36,48]. This degradation poses significant health risks, including respiratory and cardiovascular diseases, as PM2.5 is known for its adverse health impacts [49].
In Dhaka, the spatial distribution of PM2.5 concentrations aligns closely with specific pollution sources, particularly in industrial zones (in peripheral areas), high-traffic corridors, and densely populated areas (slums or low-income people’s living areas). Industrial areas on the city’s outskirts, such as Tejgaon, are significant contributors due to emissions from brick kilns, manufacturing facilities, and factories using coal and low-grade fuels with limited emissions control. These industries generate high levels of particulate pollution, impacting surrounding areas. Within the city center, traffic corridors—such as Mirpur Road, Airport Road, and Farm Gate—experience elevated PM2.5 levels due to heavy vehicle emissions, road dust, and congestion. Emissions from two-stroke engines and older vehicles further increase PM2.5, posing significant health risks in these densely populated zones. On the other hand, the central area receives more attention from the government to keep it as safe as possible in terms of various pollution, including PM2.5 pollution, because these are generally living places for high-income people and where diplomatic areas and important governmental agencies are located.
The data underscore the urgent need for stringent air quality management and pollution control measures in Dhaka to protect public health and comply with international air quality standards. The consistent failure to meet WHO guidelines points to the necessity for comprehensive strategies to reduce emissions and improve air quality in the coming years.

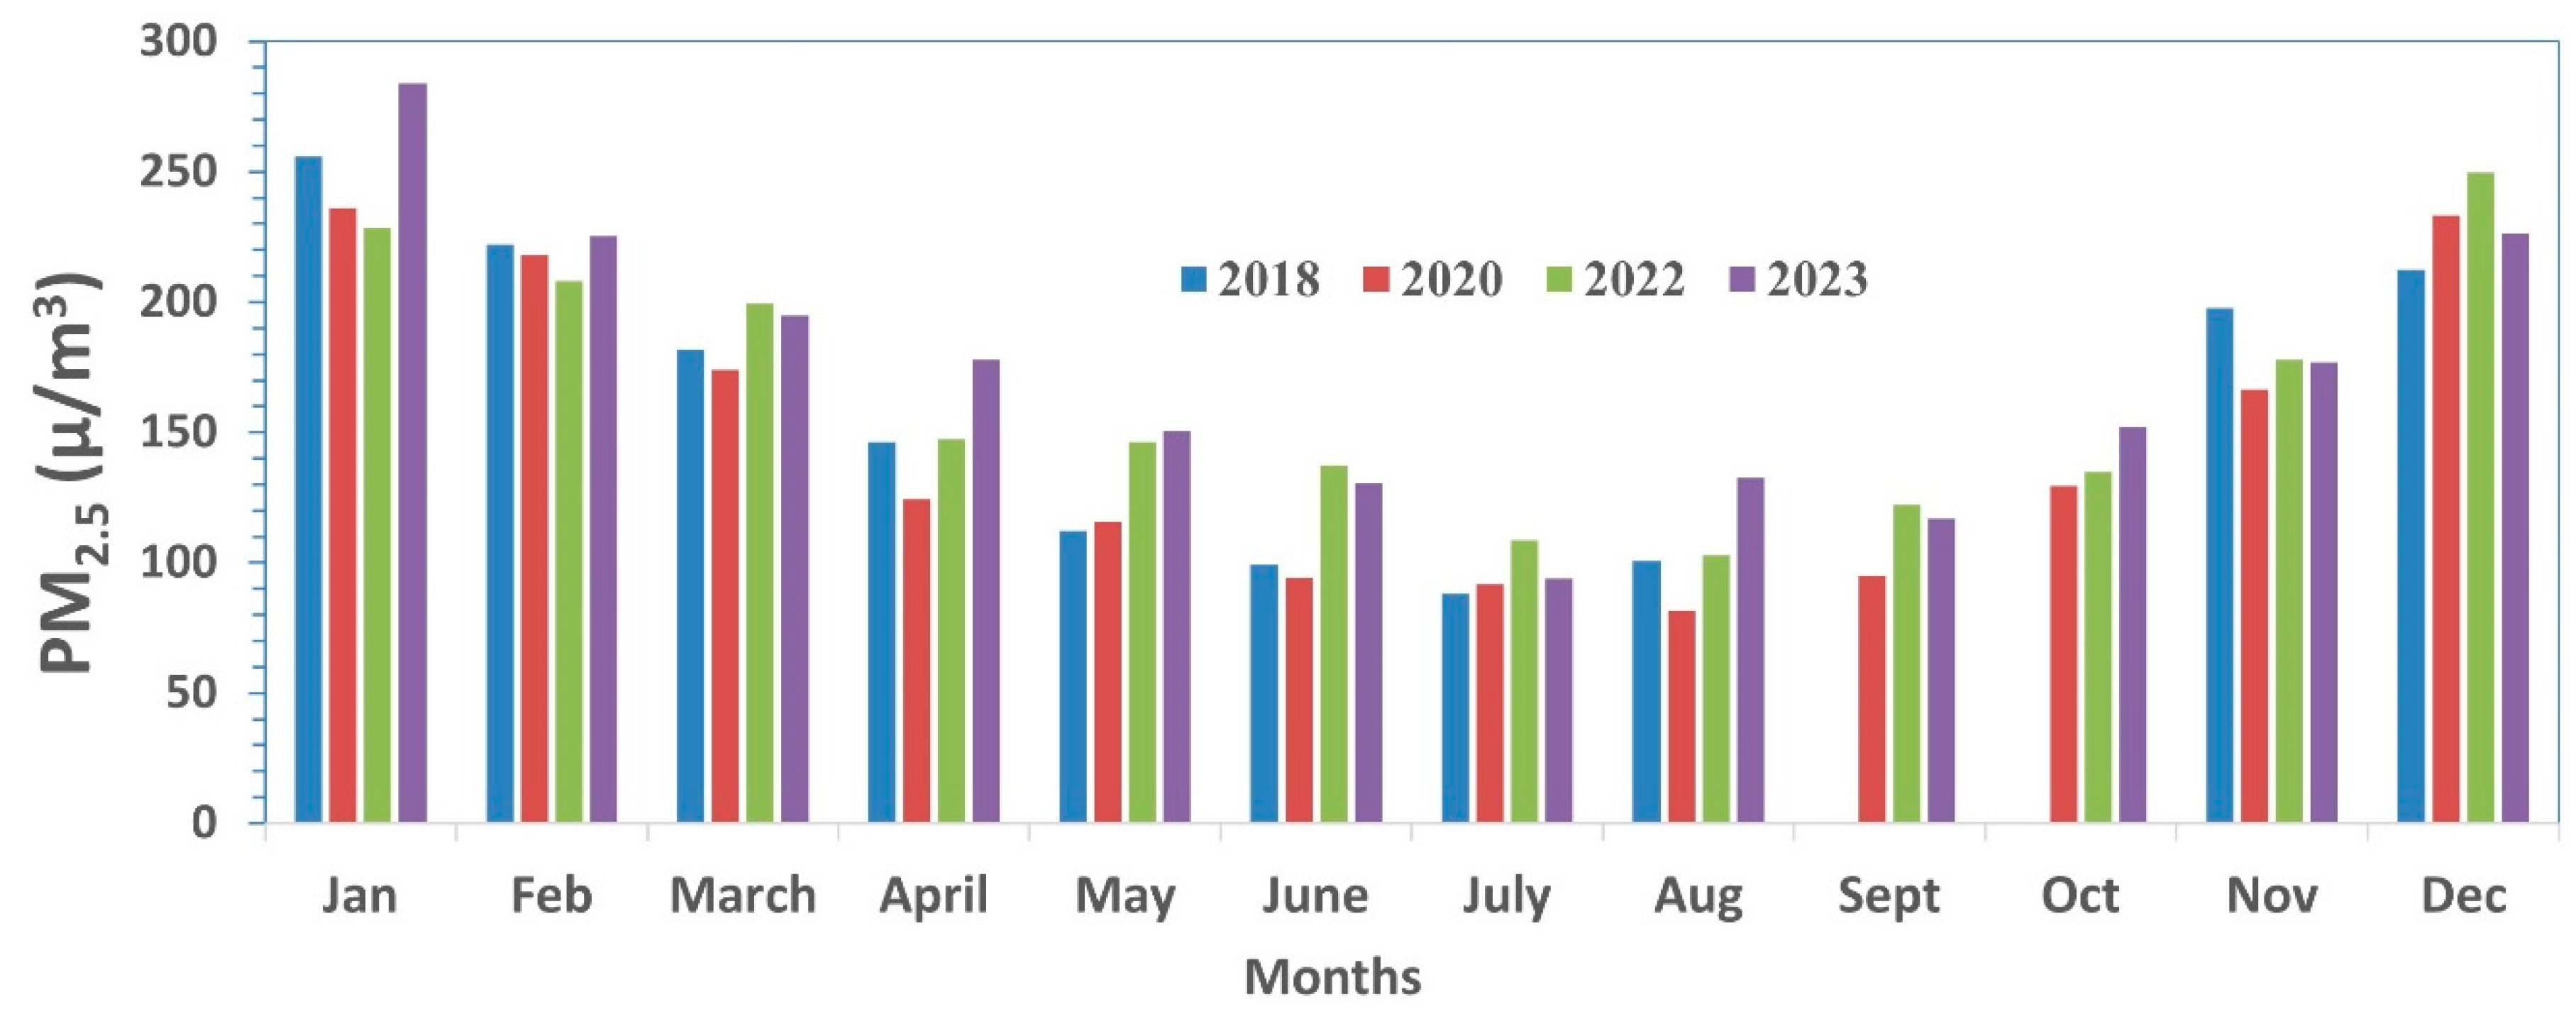
3.2. Seasonal Variations of PM2.5 Concentration in Dhaka City

There are significant seasonal and inter-annual variations in monthly PM2.5 concentrations from 2018 to 2023 (Table 1). Figure 3 suggests that PM2.5 levels are highest during winter (from December to February) and lowest during monsoon (June to August). January has the highest monthly PM2.5 concentration, with values exceeding 250 µg/m3 in 2018 and 2023 (Figure 3).The higher concentrations in winter are possibly due to increased heating activities [50], and agricultural-waste burning activities are common in the post-harvest season (November–April) [51]. The monsoon season has the lowest concentrations of PM2.5 among all seasons, reflecting the cleansing effect of frequent rains. April and May of 2020 had the lowest PM2.5 concentrations (Figure 3), likely due to COVID-19 lockdowns that reduced industrial and vehicular emissions.
The standard deviations show substantial variability in monthly PM2.5 concentrations between years, especially during transition periods such as March and December. For example, December 2022 exhibited a high level of variability with a standard deviation of 69.8.
The mean values for PM2.5 show a noticeable year-to-year fluctuation, with 2023 experiencing a sharp rise in January (283.9 µg/m3), compared to 2022 (228.4 µg/m3), indicating worsening air quality (Table 1 and Figure 3). The data also reveal a decrease in PM2.5 levels during the monsoon season (June to August), with mean values such as 93.7 µg/m3 in July 2023, supporting the role of rainfall in removing particulate matter through washout processes.
The consistent seasonal pattern in PM2.5 levels, with higher pollution during winter and lower levels during the monsoon, underscores the dual impact of local and transboundary pollution sources. Biomass combustion is a major contributor during the non-monsoon periods, while fossil fuel combustion dominates during the monsoon season [52]. The data highlight the need for targeted pollution control strategies to mitigate adverse health effects, particularly in winter. Implementing stricter emission controls, promoting cleaner heating alternatives, and enhancing public transportation are essential measures to address the severe winter pollution and ensure compliance with international air quality standards.

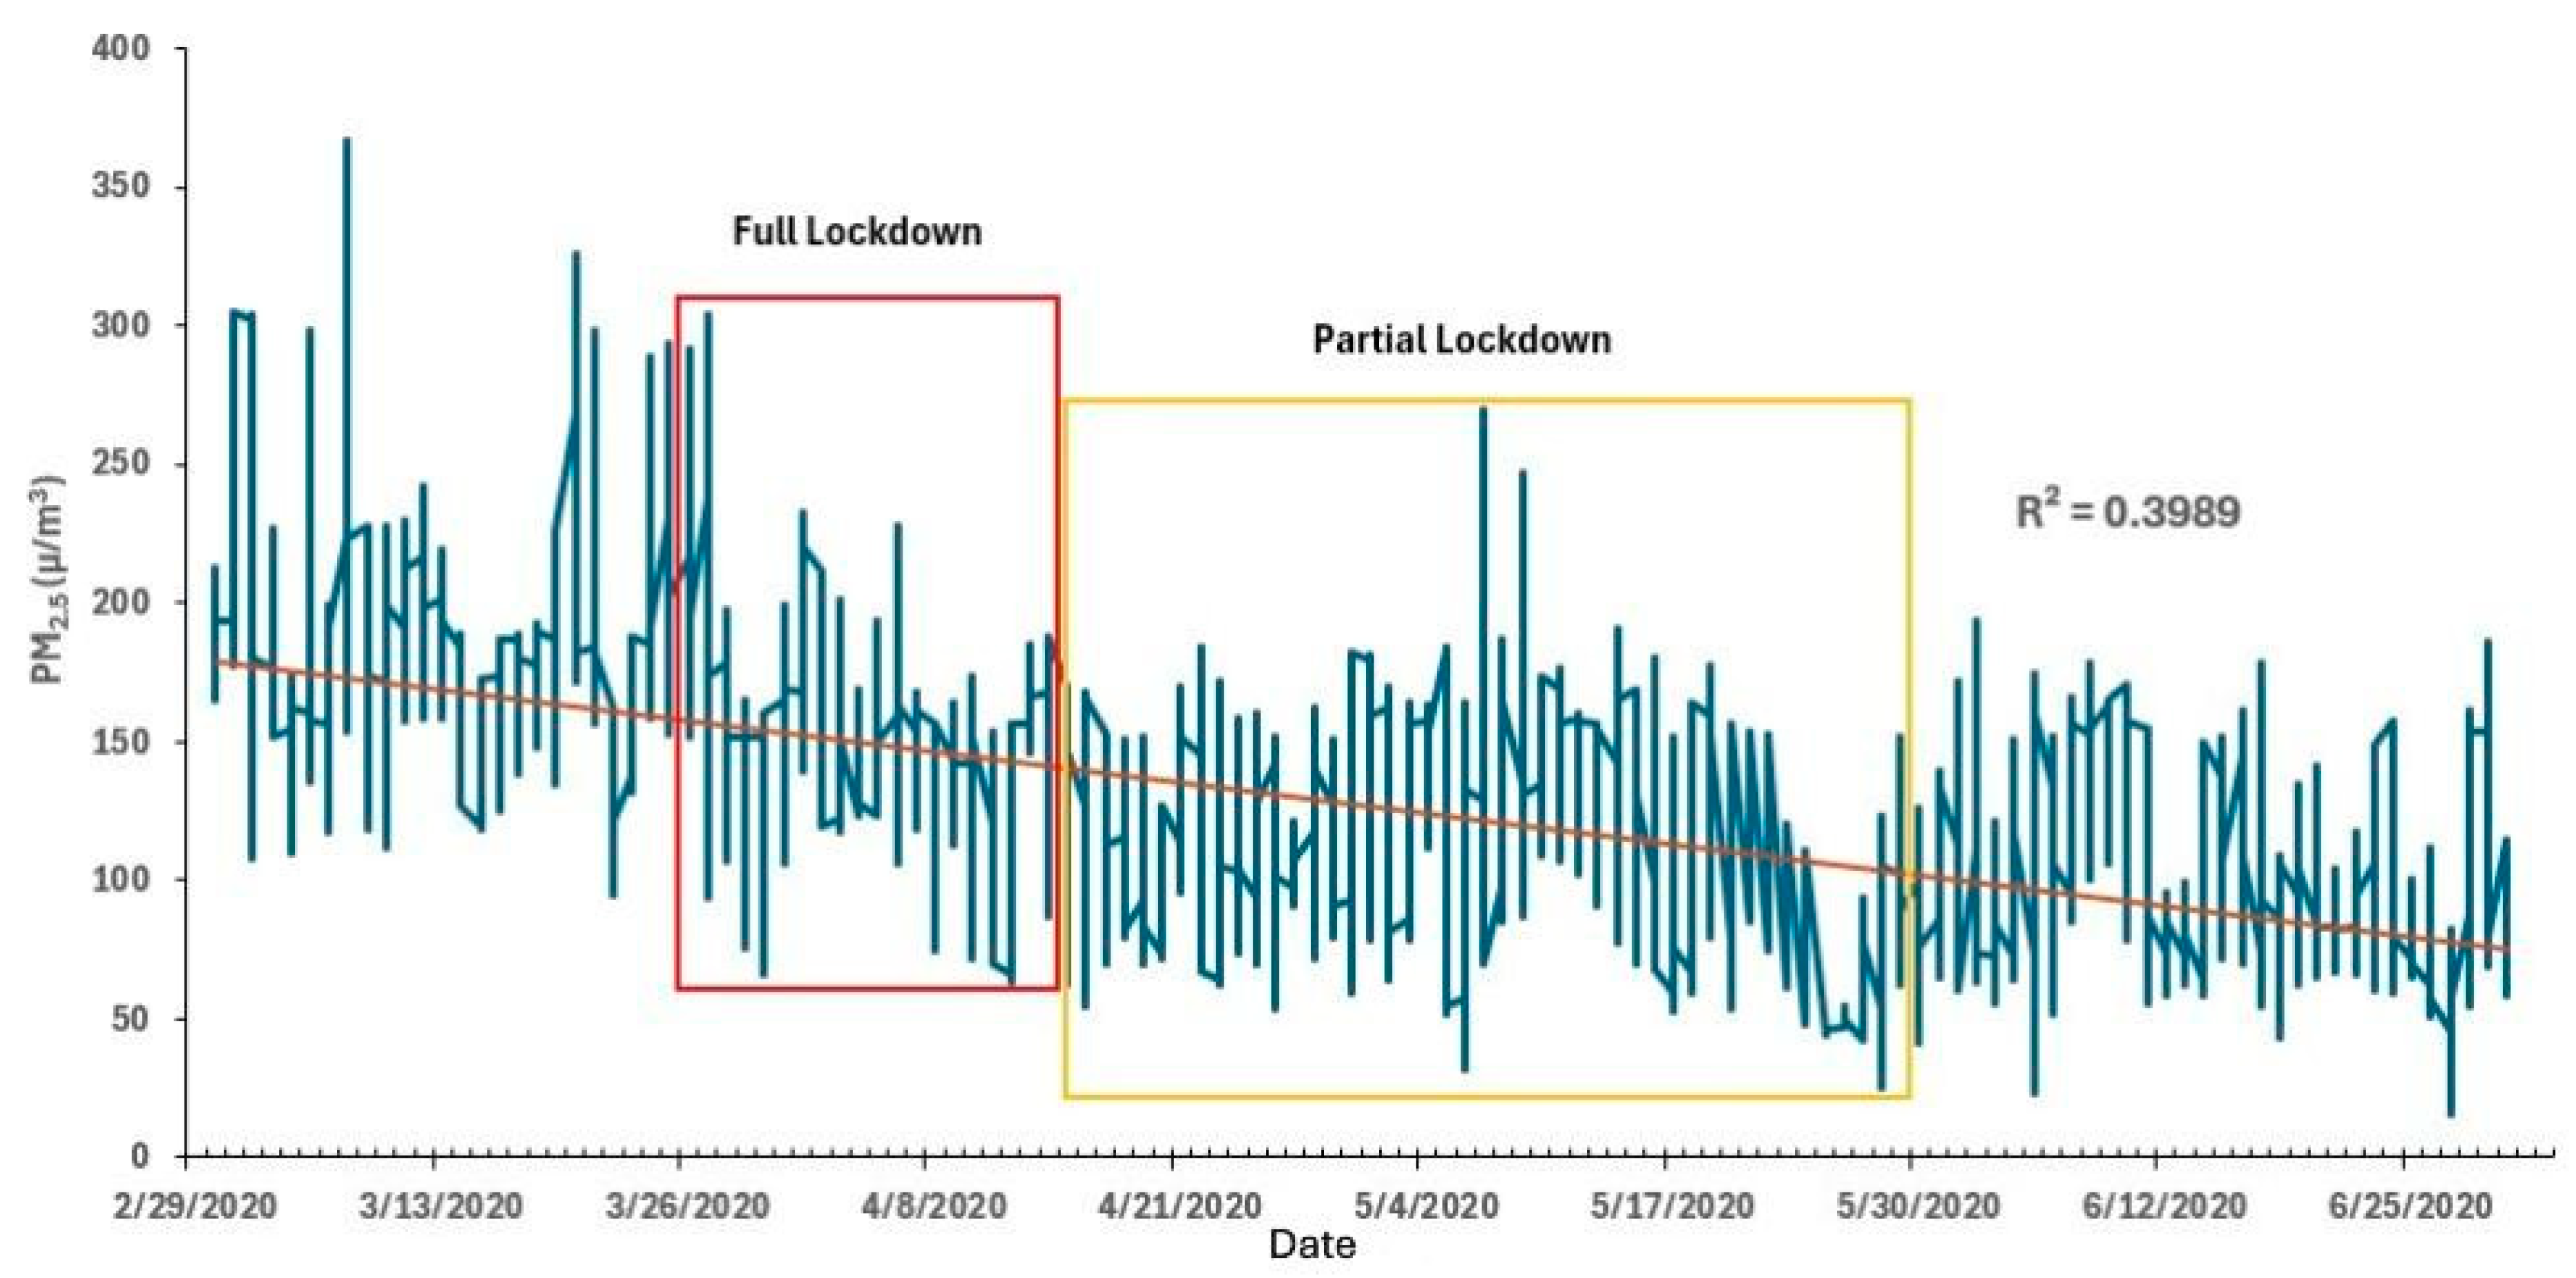
3.3. Hourly PM2.5 Variation in Pre-COVID, COVID, and Post-COVID Periods

Figure 4 shows the hourly PM2.5 concentration change from 29 February to 25 June 2020. Our study divided this period into pre-COVID, COVID lockdown, and post-COVID periods, where different lockdown policies were implemented. In the pre-COVID period from January to March, the daily average PM2.5 was 236.1, 218.0 and 173.8 µg/m3, respectively. On the other hand, during lockdowns (partial and strict lockdowns) from April to May, the daily average PM2.5 is 124.8 and 115.9 µg/m3, respectively (Table 1), which is significantly lower than that in the pre-COVID period. This comparison clearly demonstrates the impact of COVID-19 policy on PM2.5 concentrations.
With the onset of the full lockdown on 26 March 2020 to 12 April 2020, indicated by the red box in Table 1, a notable decline in PM2.5 levels was observed. This reduction can be attributed to decreased vehicular traffic, reduced industrial activity, and overall lower human mobility, primary sources of air pollution in urban areas. The full lockdown period shows a more consistent and significant decrease (approximately 29% from before lockdown) in PM2.5 concentrations, reflecting the immediate impact of stringent restrictions on pollution levels.
As the lockdown transitioned to a partial lockdown from 13 April 2020 to 30 May 2020, marked by the yellow box, there was an observed fluctuation in PM2.5 levels with a slight upward trend. This period likely saw a gradual resumption of economic activities and increased vehicular movement, leading to a rise in pollution levels, though not reaching the pre-lockdown peaks. The partial lockdown still maintained some restrictions, contributing to lower pollution than normal conditions but higher than during the full lockdown.
The overall trendline shows a downward slope throughout the period, indicating a general decline in PM2.5 concentrations. The R2 value of 0.3989 suggests a moderate correlation between the lockdown measures and the reduction in PM2.5 levels, implying that while lockdowns significantly impacted air quality, other factors also played a role. The data underscore the effectiveness of reduced human activities in lowering air pollution levels, highlighting the potential benefits of sustained pollution control measures. The temporary improvement in air quality during the lockdown periods suggests that similar, more permanent strategies could be implemented to maintain healthier air quality levels post-pandemic. Additionally, this analysis demonstrates the potential for temporary interventions to serve as real-world experiments for understanding and managing urban air quality. Policymakers can leverage these insights to develop targeted measures that balance economic activities with environmental health.

4. Relationship Between Daily PM2.5 and Meteorological Factors

It has been shown that meteorological conditions can have significant impacts on PM2.5 concentrations. In this section, we will examine the relationship between daily PM2.5 and several meteorological conditions over the selected years within the study period: 2018, 2022 and 2023. Data from years 2019 and 2020 were not included because PM2.5 concentrations in these two years were strongly affected by COVID lockdown policies, as shown in Section 3.

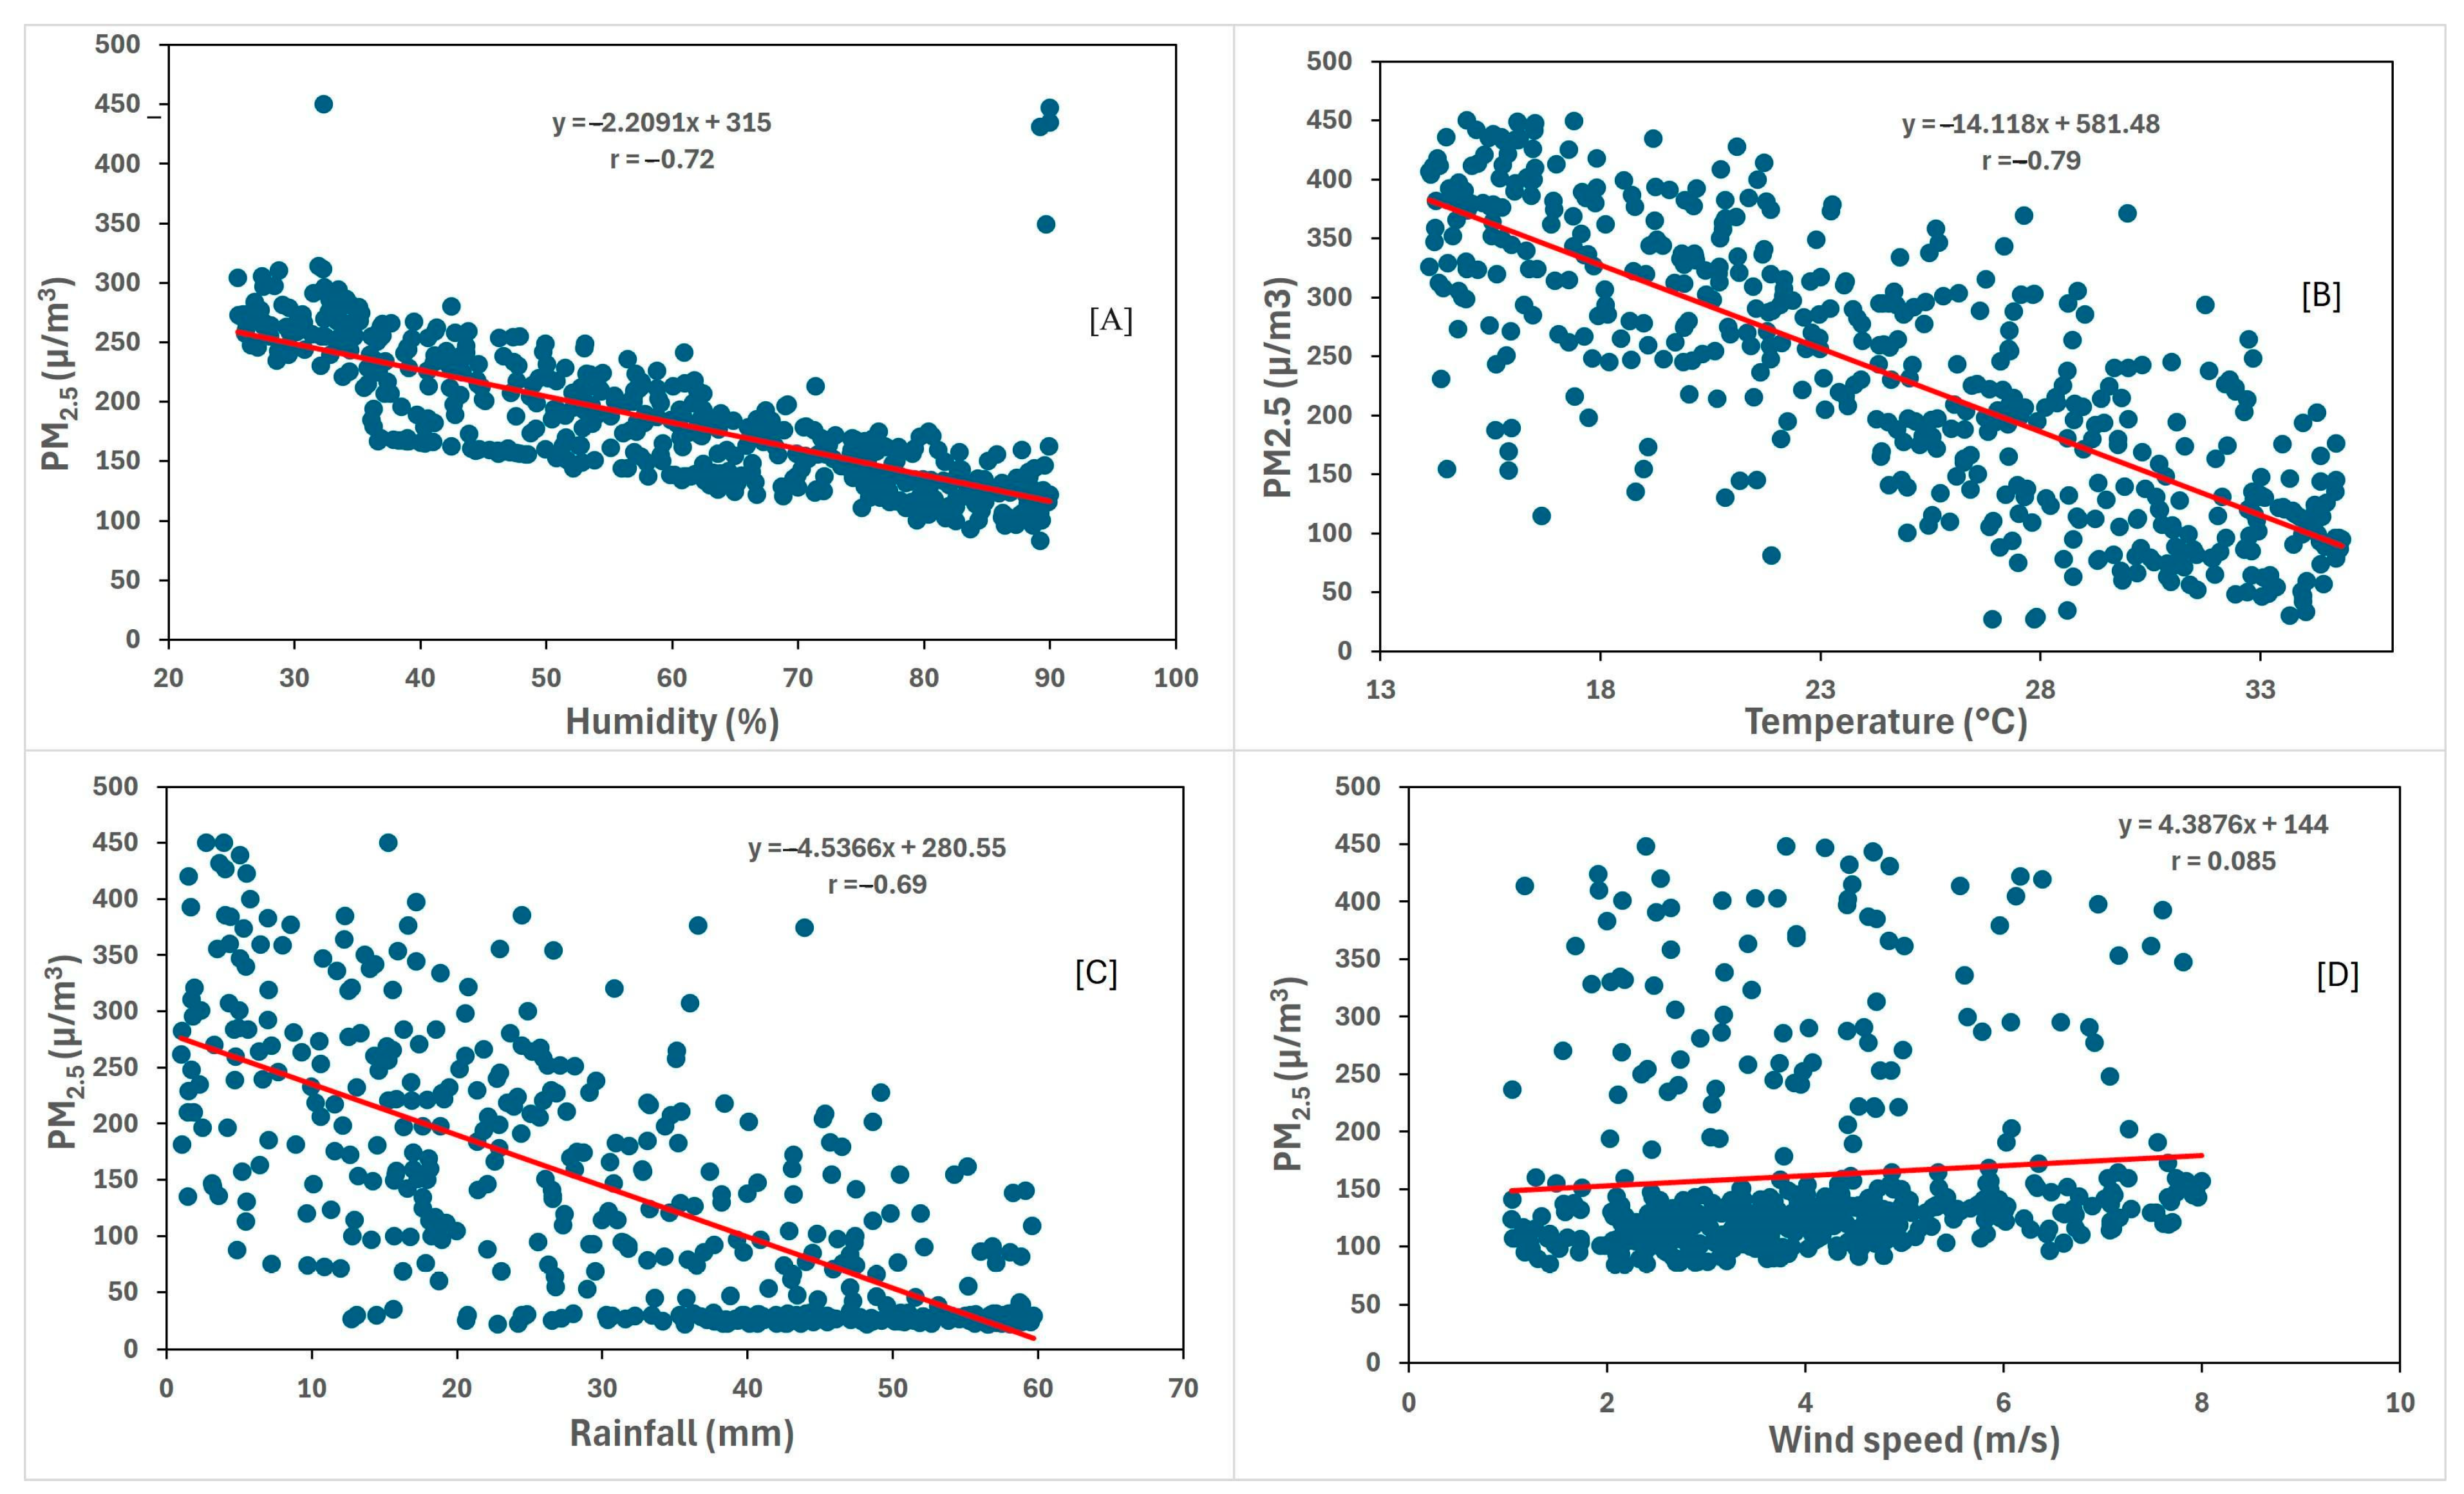
4.1. Relationship Between PM2.5 and Relative Humidity

As shown in Figure 5A, the correlation between daily PM2.5 concentrations and relative humidity reveals a strong negative correlation, with a correlation coefficient of (r = −0.72), indicating that higher relative humidity is significantly associated with lower PM2.5 concentrations. This strong inverse relationship reinforces the notion that moisture in the air facilitates the deposition and removal of particulate matter through processes such as particle coagulation and scavenging, reducing PM2.5 levels. This negative relationship is due to the process of wet deposition, where higher humidity enhances the likelihood of water vapor condensing on particles. As these particles become heavier, they are removed from the atmosphere, effectively reducing PM2.5 concentrations [53]. These results highlight relative humidity’s key role, particularly during the rainy season, in improving air quality by mitigating the accumulation of harmful particulate matter in the atmosphere. This finding underscores the need for air quality management strategies that account for fluctuations in humidity levels, as they can substantially influence pollution dynamics [54]. The regression line and clear downward trend in the scatter plot further emphasize the importance of considering humidity in air quality models and forecasts for regions like Dhaka.

4.2. Relationship Between PM2.5 and Temperature

The relationship between PM2.5 concentrations and temperature, as shown in Figure 5B, shows a stronger negative correlation than previously observed [24], with a correlation coefficient of (r = −0.79). This negative correlation suggests that higher temperatures are consistently associated with lower PM2.5 concentrations. Temperature plays a distinct role in influencing atmospheric mixing. Higher temperatures, common during pre-monsoon and monsoon seasons, enhance vertical mixing, whereby air pollutants are dispersed more effectively away from the surface, resulting in lower PM2.5 concentrations near ground level [24]. In contrast, cooler winter temperatures reduce atmospheric mixing, leading to pollutant accumulation in lower atmospheric layers, which contributes to the observed seasonal peaks in PM2.5 during winter [31]. As temperature increases, atmospheric turbulence and vertical mixing enhance the dispersion of particulate matter, preventing its accumulation. Additionally, chemical reactions driven by higher temperatures can convert certain particulate matter into less harmful compounds. The regression line in the scatter plot reinforces this trend, showing a steep decline in PM2.5 levels as temperatures rise. This strong correlation points to the significant influence of temperature on pollution levels, particularly during warmer periods. Understanding this relationship can help inform air quality predictions, as elevated temperatures can lead to better air quality, which has implications for public health, especially during Dhaka’s hot summer months.

4.3. Relationship Between PM2.5 and Rainfall

This analysis only includes days with precipitation exceeding 0.5 mm/day. This is different from Faisal et al.’s paper in which they seemed to include days without precipitation (see their Figure 4a) [24]. Our analysis suggests that a negative correlation exists between PM2.5 concentrations and rainfall with a correlation coefficient of (r = −0.69) (Figure 5C). This indicates that higher rainfall is strongly associated with lower PM2.5 levels. The steep slope of the regression line indicates that even modest increases in rainfall can result in significant reductions in particulate matter, primarily due to the washout effect. Raindrops capture and remove airborne particles, cleaning the atmosphere and thus improving air quality. Rainfall reduces PM2.5 levels through wet deposition, whereby raindrops capture airborne particles and bring them to the ground, effectively “cleansing” the air [55]. This mechanism is particularly impactful during Dhaka’s monsoon season, contributing to lower PM2.5 concentrations. The scatter plot shows that during periods of higher rainfall, PM2.5 concentrations are significantly lower, highlighting the crucial role rainfall plays in mitigating air pollution, particularly during the monsoon season in Dhaka. This relationship emphasizes the importance of rainfall in reducing particulate pollution and improving air quality, which should be a key consideration in air quality management strategies, especially in planning for dry seasons when rain is scarce.

4.4. Relationship Between PM2.5 and Wind Speed

Our result suggests that there are no significant relationships between PM2.5 and wind speed in the study area. This is consistent with the results in Faisal et al.’s paper [24]. Other studies have suggested that the relationship between wind and PM2.5 varies significantly from season to season and from region to region. For example, Chen et al. found that winds do not have consistent impacts on PM2.5 levels across seasons [56]. Yang et al. found both positive and negative relationships between PM2.5 and wind across China [57].

5. Discussion

The comprehensive analysis of PM2.5 concentrations in Dhaka from 2001 to 2023 highlights significant temporal and spatial variations, emphasizing the city’s persistent and severe nature of air pollution. Our findings reveal that PM2.5 levels frequently exceed World Health Organization (WHO) guidelines, particularly during winter [58]. The high concentrations of PM2.5 during this season can be attributed to increased combustion activities, including heating fuels and biomass burning, in addition to industrial activity, brick kilns, and meteorological conditions that favor the accumulation of pollutants [34]. The study also underscores the significant role of meteorological factors such as rainfall, humidity, and temperature in modulating PM2.5 levels but no significant impact of wind speed in PM2.5. Higher humidity and rainfall are associated with lower PM2.5 concentrations, likely due to the enhanced deposition and washout effect, whereas higher temperatures promote atmospheric mixing and chemical reactions that reduce particulate matter concentrations [59].
The city’s climate and weather conditions influence the dynamics and severity of air pollution. While the rain helps wash away pollutants, high humidity, and stagnant air can trap pollutants close to the ground, worsening air quality [54]. From November to March, the dry season often sees a spike in air pollution levels due to the accumulation of pollutants from vehicular emissions, industrial activities, and construction. Recent rapid urbanization has increased vehicular emissions, contributing significantly to air pollution, industrial pollution from brick kilns (58%), motor vehicles (10.4%), road dust (7.70%), soil dust (7.57%), fugitive Pb (7.63%), biomass burning (7.37%), and sea salt (1.33%) [20]. Construction activities also contribute to dust and particulate matter in the air. Understanding these seasonal patterns is crucial for developing effective air quality management and mitigation strategies in Dhaka.
The temporary reduction in PM2.5 levels observed during the COVID-19 lockdown periods offers a natural experiment that underscores the potential benefits of sustained emission control measures. The significant decline in PM2.5 levels during full lockdowns, when vehicular and industrial activities were minimized, demonstrates the substantial impact of human activities on air quality. This observation aligns with studies conducted in other global cities during the pandemic, such as in China (in Hubei Province, Wuhan), Portugal, and Dubai, where significant air quality improvements were noted due to reduced anthropogenic activities [60,61,62,63]. However, the subsequent rebound in pollution levels as economic activities resumed highlights the ongoing challenges in managing urban air pollution. This pattern is consistent with findings from studies in other rapidly urbanizing regions in China, emphasizing the need for continuous and stringent air quality management policies [64,65,66].
Comparison with other studies reveals similarities and unique aspects of Dhaka’s air pollution profile. Similar seasonal variations were identified in PM2.5 concentrations in other cities and megacities, with winter months showing higher pollution levels due to similar meteorological and anthropogenic factors [67,68,69,70,71]. Gao et al. found significant correlations between meteorological factors and PM2.5 concentrations, with temperature showing the strongest relationship [63]. Regions like Europe exhibit significant within-area variability influenced by local sources, highlighting the complexity of PM2.5 pollution dynamics [9,72,73,74]. Our analysis suggests that meteorological conditions play a critical role in influencing air pollution levels, emphasizing the need for integrated approaches to manage air quality in Dhaka City. Furthermore, the health impacts observed in Dhaka, including respiratory and cardiovascular diseases, are in line with global findings that link PM2.5 exposure to severe health risks [6,75,76,77,78]. These underscore the global relevance of our findings while highlighting the need for region-specific strategies to address sources and patterns of air pollution in Dhaka. The results of this study indicate that PM2.5 concentrations in Dhaka exhibit significant seasonal variability, with the highest levels occurring in winter and the lowest during the monsoon season. Pearson correlation analyses demonstrated strong correlations between meteorological factors, such as temperature, rainfall, humidity, and PM2.5 levels, underscoring the influence of climatic conditions on air pollution in the city. Similar results were also found in other research [31,53]. Biomass combustion was found to be a major contributor to PM2.5 levels during non-monsoon periods, while fossil fuel combustion dominated during the monsoon season, highlighting the dual impact of local and transboundary pollution sources [38]. To effectively reduce PM2.5 levels and improve air quality in Dhaka, a comprehensive policy approach targeting primary pollution sources is essential. Key recommendations include reducing vehicular emissions by promoting public transportation, cycling, and walking, along with investing in clean transit options like electric buses. Stricter vehicle emissions standards and a transition to electric and hybrid vehicles are also critical steps. Industrial emissions can be controlled by enforcing regulations that require factories to adopt cleaner technologies, transition to low-emission fuels, and improve process efficiency. Additionally, construction-related pollution should be mitigated through dust control measures and the use of eco-friendly building materials. Expanding urban green spaces, such as green belts, parks, and rooftop gardens, can further improve air quality by acting as natural filters.
Seasonal strategies are also crucial, particularly during winter when PM2.5 levels are highest. Implementing stricter controls on biomass burning and traffic restrictions in high-emission areas during this period can significantly reduce pollution. Encouraging the use of clean energy in industrial zones aligns with these seasonal measures, helping to manage pollutant levels throughout the year. Policymakers are urged to integrate these findings into urban planning and health protection strategies, laying a foundation for a healthier urban environment in Dhaka.

6. Conclusions

This research highlights several key findings that underscore the significant impact of PM2.5 pollution on air quality in Dhaka City from 2001 to 2023. The study reveals that PM2.5 levels in Dhaka consistently exceed the World Health Organization’s (WHO’s) recommended limits, particularly during the winter months. Given the severe nature of the air pollution observed, this poses substantial health risks to the city’s population. Meteorological factors such as temperature, humidity, and rainfall influence PM2.5 concentrations. The study found that higher humidity and rainfall are associated with lower PM2.5 levels due to the cleansing effects of moisture and precipitation. Conversely, colder, drier periods, particularly in winter, see a rise in PM2.5 concentrations, likely due to increased combustion activities, including the use of heating fuels and biomass burning.
The COVID-19 lockdowns provided a natural experiment illustrating the potential benefits of stringent emission control measures. During periods of reduced human activity, particularly during full lockdowns, there was a marked reduction in PM2.5 levels. This finding suggests that sustained and comprehensive air quality management strategies could significantly improve air quality in Dhaka.
Despite a slight improvement in PM2.5 levels during the post-2015 period, air quality remains critically poor, indicating the need for ongoing and enhanced efforts to manage air pollution. The study concludes by emphasizing the importance of implementing multi-faceted air quality management strategies, including stricter vehicular and industrial emissions regulations, promoting cleaner technologies, and expanding urban green spaces to mitigate the adverse health impacts of PM2.5 pollution in Dhaka.
These findings contribute to the broader understanding of urban air pollution dynamics in rapidly developing regions, highlighting the urgent need for effective and sustained intervention strategies to protect public health and improve environmental quality in Dhaka.

Author Contributions

Conceptualization and methods, M.R. and L.M.; formal analysis, M.R.; data curation, M.R.; writing—original draft preparation, M.R.; writing—review and editing, L.M.; visualization, M.R.; supervision, L.M.; project administration, L.M. All authors have read and agreed to the published version of the manuscript.

Funding

This research received no external funding.

Institutional Review Board Statement

Not applicable.

Informed Consent Statement

Not applicable.

Data Availability Statement

NASA POWER Meteorology datasets can be obtained from https://power.larc.nasa.gov/. In-site PM2.5 dataset is obtained from the U.S. Embassies and Consulates at AirNow.gov. Global annual PM data are downloaded from https://www.earthdata.nasa.gov/centers/sedac-daac, accessed on 30 October 2024.

Acknowledgments

We thank the anonymous reviewers for their constructive suggestions/comments that have greatly improved the quality of this paper.

Conflicts of Interest

The authors declare no conflicts of interest.

References

  1. Rentschler, J.; Leonova, N. Global air pollution exposure and poverty. Nat. Commun. 2023, 14, 4432. [Google Scholar] [CrossRef] [PubMed]
  2. Ericksen, N.J.; Ahmad, Q.K.; Chowdhury, A.R. Socio-economic Implications of Climate Change for Bangladesh. In The Implications of Climate and Sea–Level Change for Bangladesh; Springer: Dordrecht, The Netherlands, 1996; pp. 205–287. [Google Scholar] [CrossRef]
  3. Xing, Y.F.; Xu, Y.H.; Shi, M.H.; Lian, Y.X. The impact of PM2.5 on the human respiratory system. J. Thorac. Dis. 2016, 8, E69–E74. [Google Scholar] [CrossRef] [PubMed]
  4. Wang, J.; Ogawa, S. Effects of meteorological conditions on PM2.5 concentrations in Nagasaki, Japan. Int. J. Environ. Res. Public Health 2015, 12, 9089–9101. [Google Scholar] [CrossRef] [PubMed]
  5. Thangavel, P.; Park, D.; Lee, Y.-C. Recent Insights into Particulate Matter (PM2.5)-Mediated Toxicity in Humans: An Overview. Int. J. Environ. Res. Public Health 2022, 19, 7511. [Google Scholar] [CrossRef] [PubMed]
  6. Apte, J.S.; Marshall, J.D.; Cohen, A.J.; Brauer, M. Addressing Global Mortality from Ambient PM2.5. Environ. Sci. Technol. 2015, 49, 8057–8066. [Google Scholar] [CrossRef]
  7. Apte, J.S.; Brauer, M.; Cohen, A.J.; Ezzati, M.; Pope, C.A., III. Ambient PM2.5 Reduces Global and Regional Life Expectancy. Environ. Sci. Technol. Lett. 2018, 5, 546–551. [Google Scholar] [CrossRef]
  8. Ji, X.; Yao, Y.; Long, X. What causes PM2.5 pollution? Cross-economy empirical analysis from socioeconomic perspective. Energy Policy 2018, 119, 458–472. [Google Scholar] [CrossRef]
  9. Eeftens, M.; Tsai, M.-Y.; Ampe, C.; Anwander, B.; Beelen, R.; Bellander, T.; Cesaroni, G.; Cirach, M.; Cyrys, J.; De Hoogh, K.; et al. Spatial variation of PM2.5, PM10, PM2.5 absorbance and PMcoarse concentrations between and within 20 European study areas and the relationship with NO2—Results of the ESCAPE project. Atmos. Environ. 2012, 62, 303–317. [Google Scholar] [CrossRef]
  10. Scolio, M.; Borha, C.; Kremer, P.; Shakya, K.M. Spatial Analysis of Intra-Urban Air Pollution Disparities through an Environmental Justice Lens: A Case Study of Philadelphia, PA. Atmosphere 2024, 15, 755. [Google Scholar] [CrossRef]
  11. Gurley, E.S.; Salje, H.; Homaira, N.; Ram, P.K.; Haque, R.; Petri, W.A.; Bresee, J.; Moss, W.J.; Luby, S.P.; Breysse, P.; et al. Seasonal concentrations and determinants of indoor particulate matter in a low-income community in Dhaka, Bangladesh. Environ. Res. 2013, 121, 11–16. [Google Scholar] [CrossRef]
  12. Lim, C.H.; Ryu, J.; Choi, Y.; Jeon, S.W.; Lee, W.K. Understanding global PM2.5 concentrations and their drivers in recent decades (1998–2016). Environ. Int. 2020, 144, 106011. [Google Scholar] [CrossRef] [PubMed]
  13. Lin, Y.; Zou, J.; Yang, W.; Li, C.-Q. A review of recent advances in research on PM2.5 in China. Int. J. Environ. Res. Public Health 2018, 15, 438. [Google Scholar] [CrossRef] [PubMed]
  14. Lee, P.K.H.; Brook, J.R.; Dabek-Zlotorzynska, E.; Mabury, S.A. Identification of the Major Sources Contributing to PM2.5Observed in Toronto. Environ. Sci. Technol. 2003, 37, 4831–4840. [Google Scholar] [CrossRef] [PubMed]
  15. Jin, Q.; Fang, X.; Wen, B.; Shan, A. Spatio-temporal variations of PM2.5 emission in China from 2005 to 2014. Chemosphere 2017, 183, 429–436. [Google Scholar] [CrossRef] [PubMed]
  16. Ye, B.; Ji, X.; Yang, H.; Yao, X.; Chan, C.K.; Cadle, S.H.; Chan, T.; Mulawa, P.A. Concentration and chemical composition of PM2.5 in Shanghai for a 1-year period. Atmos. Environ. 2003, 37, 499–510. [Google Scholar] [CrossRef]
  17. Wang, Y.; Zhuang, G.; Tang, A.; Yuan, H.; Sun, Y.; Chen, S.; Zheng, A. The ion chemistry and the source of PM2.5 aerosol in Beijing. Atmos. Environ. 2005, 39, 3771–3784. [Google Scholar] [CrossRef]
  18. Jiang, K.; Xing, R.; Luo, Z.; Huang, W.; Yi, F.; Men, Y.; Zhao, N.; Chang, Z.; Zhao, J.; Pan, B.; et al. Pollutant emissions from biomass burning: A review on emission characteristics, environmental impacts, and research perspectives. Particuology 2024, 85, 296–309. [Google Scholar] [CrossRef]
  19. Desservettaz, M.; Pikridas, M.; Stavroulas, I.; Bougiatioti, A.; Liakakou, E.; Hatzianastassiou, N.; Sciare, J.; Mihalopoulos, N.; Bourtsoukidis, E. Emission of volatile organic compounds from residential biomass burning and their rapid chemical transformations. Sci. Total. Environ. 2023, 903, 166592. [Google Scholar] [CrossRef]
  20. Rahman, M.; Mahamud, S.; Thurston, G.D. Recent spatial gradients and time trends in Dhaka, Bangladesh, air pollution and their human health implications. J. Air Waste Manag. Assoc. 2019, 69, 478–501. [Google Scholar] [CrossRef]
  21. Fattah, A.; Zannat, E.U.; Morshed, S.R.; Roni, A.T. Modeling the impact of motorized vehicles’ activities on emissions and economic losses in a fast-growing developing city, Dhaka, Bangladesh. J. Transp. Health 2022, 25, 101377. [Google Scholar] [CrossRef]
  22. Hien, P.D.; Bac, V.T.; Tham, H.C.; Nhan, D.D.; Vinh, L.D. Influence of meteorological conditions on PM2.5 and PM2.5À10 concentrations during the monsoon season in Hanoi, Vietnam. Atmos. Pollut. Res. 2002, 8, 29–37. [Google Scholar]
  23. Hassan, S.; Gomes, R.F.L.; Bhuiyan, M.A.H.; Rahman, M.T. Land Use and the Climatic Determinants of Population Exposure to PM2.5 in Central Bangladesh. Pollutants 2023, 3, 381–395. [Google Scholar] [CrossRef]
  24. Faisal, A.-A.; Al Kafy, A.; Fattah, A.; Jahir, D.M.A.; Al Rakib, A.; Rahaman, Z.A.; Ferdousi, J.; Huang, X. Assessment of temporal shifting of PM2.5, lockdown effect, and influences of seasonal meteorological factors over the fastest-growing megacity, Dhaka. Spat. Inf. Res. 2022, 30, 441–453. [Google Scholar] [CrossRef]
  25. Meng, C.; Cheng, T.; Bao, F.; Gu, X.; Wang, J.; Zuo, X.; Shi, S. The impact of meteorological factors on fine particulate pollution in Northeast China. Aerosol Air Qual. Res. 2020, 20, 1618–1628. [Google Scholar] [CrossRef]
  26. Li, Y.; Zhou, L.; Liu, H.; Liu, S.; Feng, M.; Song, D.; Tan, Q.; Jiang, H.; Zuoqiu, S.; Yang, F. Disparities in precipitation effects on PM2.5 mass concentrations and chemical compositions: Insights from online monitoring data in Chengdu. J. Environ. Sci. 2024, in press. [CrossRef]
  27. Mazumder, P.; Bin Kabir, S.; Saju, J.A.; Islam, M.R.; Emon, A.I. Measuring and modeling PM2.5 zonal distributions, assembling geospatial and meteorological variables in the Khulna metropolitan area. Urban Clim. 2023, 49, 101518. [Google Scholar] [CrossRef]
  28. Moniruzzaman, M.; Shaikh, A.A.; Saha, B.; Shahrukh, S.; Jawaa, Z.T.; Khan, F. Seasonal changes and respiratory deposition flux of PM2.5 and PM10 bound metals in Dhaka, Bangladesh. Chemosphere 2022, 309, 136794. [Google Scholar] [CrossRef]
  29. Islam, A.R.M.T.; Al Awadh, M.; Mallick, J.; Pal, S.C.; Chakraborty, R.; Fattah, A.; Ghose, B.; Kakoli, M.K.A.; Islam, A.; Naqvi, H.R.; et al. Estimating ground-level PM2.5 using subset regression model and machine learning algorithms in Asian megacity, Dhaka, Bangladesh. Air Qual. Atmos. Health 2023, 16, 1117–1139. [Google Scholar] [CrossRef]
  30. Sarwar, G.; Hogrefe, C.; Henderson, B.H.; Foley, K.; Mathur, R.; Murphy, B.; Ahmed, S. Characterizing variations in ambient PM2.5 concentrations at the U.S. Embassy in Dhaka, Bangladesh using observations and the CMAQ modeling system. Atmos. Environ. 2023, 296, 119587. [Google Scholar] [CrossRef]
  31. Kulsum, U.; Moniruzzaman, M.; Kulsum, R.A.U. Quantifying the Relationship of Vegetation Cover and Air Pollution: A Spatiotemporal Analysis of PM2.5 and NDVI in Greater Dhaka, Bangladesh. Jagannath Univ. J. Sci. 2021, 7, 54–63. Available online: https://www.researchgate.net/publication/353609676 (accessed on 1 November 2024).
  32. Begum, B.A.; Hossain, A.; Nahar, N.; Markwitz, A.; Hopke, P.K. Organic and black carbon in PM2.5 at an urban site at Dhaka, Bangladesh. Aerosol Air Qual. Res. 2012, 12, 1062–1072. [Google Scholar] [CrossRef]
  33. Mukta, T.A.; Hoque, M.M.M.; Sarker, M.E.; Hossain, M.N.; Biswas, G.K. Seasonal variations of gaseous air pollutants (SO2, NO2, O3, CO) and particulates (PM2.5, PM10) in Gazipur: An industrial city in Bangladesh. Adv. Environ. Technol. 2020, 6, 195–209. [Google Scholar] [CrossRef]
  34. Begum, B.A.; Hopke, P.K. Ambient air quality in Dhaka Bangladesh over two decades: Impacts of policy on air quality. Aerosol Air Qual. Res. 2018, 18, 1910–1920. [Google Scholar] [CrossRef]
  35. Rahman, M.; Meng, L.; Mathews, A.J.; Bertman, S. Spatiotemporal Analysis of Urban Growth and PM2.5 Concentrations in Sylhet, Bangladesh. Atmosphere 2024, 15, 1305. [Google Scholar] [CrossRef]
  36. Zarin, T.; Zannat, E.U. Assessing the potential impacts of LULC change on urban air quality in Dhaka city. Ecol. Indic. 2023, 154, 110746. [Google Scholar] [CrossRef]
  37. Saha, M.; Al Kafy, A.; Bakshi, A.; Nath, H.; Alsulamy, S.; Rahaman, Z.A.; Saroar, M. The urban air quality nexus: Assessing the interplay of land cover change and air pollution in emerging South Asian cities. Environ. Pollut. 2024, 361, 124877. [Google Scholar] [CrossRef]
  38. Al Nayeem, A.; Hossain, M.S.; Majumder, A.K.; Carter, W.S. Spatiotemporal Variation of Brick Kilns and it’s relation to Ground-level PM2.5 through MODIS Image at Dhaka District, Bangladesh. Int. J. Environ. Pollut. Environ. Model. 2019, 2, 277–284. [Google Scholar]
  39. Motalib, M.A.; Lasco, R.D. Assessing Air Quality in Dhaka City. 2013. Available online: www.ijsr.net (accessed on 30 October 2024).
  40. Khuda, K.E. Air pollution in the capital city of bangladesh: Its causes and impacts on human health. Pollution 2020, 6, 737–750. [Google Scholar] [CrossRef]
  41. World’s Most Polluted Cities in 2023-PM2.5 Ranking|IQAir. Available online: https://www.iqair.com/world-most-polluted-cities (accessed on 17 November 2024).
  42. Rahman, R.; Lateh, H. Climate change in Bangladesh: A spatio-temporal analysis and simulation of recent temperature and rainfall data using GIS and time series analysis model. Theor. Appl. Clim. 2015, 128, 27–41. [Google Scholar] [CrossRef]
  43. Hammer, M.S.; van Donkelaar, A.; Li, C.; Lyapustin, A.; Sayer, A.M.; Hsu, N.C.; Levy, R.C.; Garay, M.J.; Kalashnikova, O.V.; Kahn, R.A.; et al. Global Estimates and Long-Term Trends of Fine Particulate Matter Concentrations (1998–2018). Environ. Sci. Technol. 2020, 54, 7879–7890. [Google Scholar] [CrossRef]
  44. Mohtar, Z.A.; Yusof, N.F.F.M.; Yahaya, A.S.; Ramli, N.A.; Yahya, A.S. Comparison of Particulate Matter (PM10) Monitoring Using Beta Attenuation Monitor (BAM) and Simple Instrument. Artic. Int. J. Eng. Technol. 2013, 3, 358. Available online: https://www.researchgate.net/publication/330555668 (accessed on 30 August 2024).
  45. Chung, A.; Chang, D.P.; Kleeman, M.J.; Perry, K.D.; Cahill, T.A.; Dutcher, D.; McDougall, E.M.; Stroud, K. Comparison of real-time instruments used to monitor airborne particulate matter. J. Air Waste Manag. Assoc. 2001, 51, 109–120. [Google Scholar] [CrossRef] [PubMed]
  46. Pérez, I.A.; García, M.; Sánchez, M.L.; Pardo, N.; Fernández-Duque, B. Key points in air pollution meteorology. Int. J. Environ. Res. Public Health 2020, 17, 8349. [Google Scholar] [CrossRef] [PubMed]
  47. Krittanawong, C.; Qadeer, Y.K.; Hayes, R.B.; Wang, Z.; Thurston, G.D.; Virani, S.; Lavie, C.J. PM2.5 and cardiovascular diseases: State-of-the-Art review. Int. J. Cardiol. Cardiovasc. Risk Prev. 2023, 19, 200217. [Google Scholar] [CrossRef] [PubMed]
  48. Deng, L.; Bi, C.; Jia, J.; Zeng, Y.; Chen, Z. Effects of heating activities in winter on characteristics of PM2.5-bound Pb, Cd and lead isotopes in cities of China. J. Clean. Prod. 2020, 265, 121826. [Google Scholar] [CrossRef]
  49. Ommi, A.; Emami, F.; Zíková, N.; Hopke, P.K.; Begum, B.A. Trajectory-based models and remote sensing for biomass burning assessment in Bangladesh. Aerosol Air Qual. Res. 2017, 17, 465–475. [Google Scholar] [CrossRef]
  50. Rahman, M.; Begum, B.A.; Hopke, P.K.; Nahar, K.; Thurston, G.D. Assessing the PM2.5 impact of biomass combustion in megacity Dhaka, Bangladesh. Environ. Pollut. 2020, 264, 114798. [Google Scholar] [CrossRef]
  51. Zhou, Y.; Yue, Y.; Bai, Y.; Zhang, L. Effects of Rainfall on PM2.5 and PM10 in the Middle Reaches of the Yangtze River. Adv. Meteorol. 2020, 2020, 2398146. [Google Scholar] [CrossRef]
  52. Wang, X.; Zhang, R.; Yu, W. The Effects of PM2.5 Concentrations and Relative Humidity on Atmospheric Visibility in Beijing. J. Geophys. Res. Atmos. 2019, 124, 2235–2259. [Google Scholar] [CrossRef]
  53. Chen, Z.; Cai, J.; Gao, B.; Xu, B.; Dai, S.; He, B.; Xie, X. Detecting the causality influence of individual meteorological factors on local PM2.5 concentration in the Jing-Jin-Ji region. Sci. Rep. 2017, 7, 40735. [Google Scholar] [CrossRef]
  54. Yang, Q.; Yuan, Q.; Li, T.; Shen, H.; Zhang, L. The relationships between PM2.5 and meteorological factors in China: Seasonal and regional variations. Int. J. Environ. Res. Public Health 2017, 14, 1510. [Google Scholar] [CrossRef]
  55. Xie, Y.; Liu, Z.; Wen, T.; Huang, X.; Liu, J.; Tang, G.; Yang, Y.; Li, X.; Shen, R.; Hu, B.; et al. Characteristics of chemical composition and seasonal variations of PM2.5 in Shijiazhuang, China: Impact of primary emissions and secondary formation. Sci. Total. Environ. 2019, 677, 215–229. [Google Scholar] [CrossRef] [PubMed]
  56. Chen, S.-L.; Chang, S.-W.; Chen, Y.-J.; Chen, H.-L. Possible warming effect of fine particulate matter in the atmosphere. Commun. Earth Environ. 2021, 2, 208. [Google Scholar] [CrossRef]
  57. Chen, L.; Mao, F.; Hong, J.; Zang, L.; Chen, J.; Zhang, Y.; Gan, Y.; Gong, W.; Xu, H. Improving PM2.5 predictions during COVID-19 lockdown by assimilating multi-source observations and adjusting emissions. Environ. Pollut. 2021, 297, 118783. [Google Scholar] [CrossRef] [PubMed]
  58. Slezakova, K.; Pereira, M.C. 2020 COVID-19 lockdown and the impacts on air quality with emphasis on urban, suburban and rural zones. Sci. Rep. 2021, 11, 21336. [Google Scholar] [CrossRef] [PubMed]
  59. Benchrif, A.; Wheida, A.; Tahri, M.; Shubbar, R.M.; Biswas, B. Air quality during three COVID-19 lockdown phases: AQI, PM2.5 and NO2 assessment in cities with more than 1 million inhabitants. Sustain. Cities Soc. 2021, 74, 103170. [Google Scholar] [CrossRef] [PubMed]
  60. Yao, L.; Kong, S.; Zheng, H.; Chen, N.; Zhu, B.; Xu, K.; Cao, W.; Zhang, Y.; Zheng, M.; Cheng, Y.; et al. Co-benefits of reducing PM2.5 and improving visibility by COVID-19 lockdown in Wuhan. NPJ Clim. Atmos. Sci. 2021, 4, 40. [Google Scholar] [CrossRef]
  61. Li, S.; Xie, G.; Ren, J.; Guo, L.; Yang, Y.; Xu, X. Urban PM2.5 concentration prediction via attention-based CNN–LSTM. Appl. Sci. 2020, 10, 1953. [Google Scholar] [CrossRef]
  62. Chen, W.; Zhang, F.; Zhu, Y.; Yang, L.; Bi, P. Analysis of the impact of multiscale green landscape on urban PM2.5. Air Qual. Atmos. Health 2022, 15, 1319–1332. [Google Scholar] [CrossRef]
  63. Gao, G.; Pueppke, S.G.; Tao, Q.; Wei, J.; Ou, W.; Tao, Y. Effect of urban form on PM2.5 concentrations in urban agglomerations of China: Insights from different urbanization levels and seasons. J. Environ. Manag. 2022, 327, 116953. [Google Scholar] [CrossRef]
  64. Chen, Z.; Chen, D.; Zhao, C.; Kwan, M.-P.; Cai, J.; Zhuang, Y.; Zhao, B.; Wang, X.; Chen, B.; Yang, J.; et al. Influence of meteorological conditions on PM2.5 concentrations across China: A review of methodology and mechanism. Environ. Int. 2020, 139, 105558. [Google Scholar] [CrossRef]
  65. Chen, L.; Zhu, J.; Liao, H.; Yang, Y.; Yue, X. Meteorological influences on PM2.5 and O3 trends and associated health burden since China’s clean air actions. Sci. Total. Environ. 2020, 744, 140837. [Google Scholar] [CrossRef] [PubMed]
  66. Tai, A.P.K.; Mickley, L.J.; Jacob, D.J. Correlations between fine particulate matter (PM2.5) and meteorological variables in the United States: Implications for the sensitivity of PM2.5 to climate change. Atmos. Environ. 2010, 44, 3976–3984. [Google Scholar] [CrossRef]
  67. Wang, H.; Zhang, L.; Wu, R.; Cen, Y. Spatio-temporal fusion of meteorological factors for multi-site PM2.5 prediction: A deep learning and time-variant graph approach. Environ. Res. 2023, 239, 117286. [Google Scholar] [CrossRef] [PubMed]
  68. Cheng, B.; Ma, Y.; Feng, F.; Zhang, Y.; Shen, J.; Wang, H.; Guo, Y.; Cheng, Y. Influence of weather and air pollution on concentration change of PM2.5 using a generalized additive model and gradient boosting machine. Atmos. Environ. 2021, 255, 118437. [Google Scholar] [CrossRef]
  69. Ahmed, F.; Bayazid, A.Z.M.; Islam, M.; Rahaman, Z.; Al Muntasir, F. The terrible air pollution in Dhaka city is getting worse. GSC Adv. Res. Rev. 2024, 19, 42–52. [Google Scholar] [CrossRef]
  70. Chen, Z.-Y.; Petetin, H.; Turrubiates, R.F.M.; Achebak, H.; García-Pando, C.P.; Ballester, J. Population exposure to multiple air pollutants and its compound episodes in Europe. Nat. Commun. 2024, 15, 2094. [Google Scholar] [CrossRef]
  71. de Hoogh, K.; Chen, J.; Gulliver, J.; Hoffmann, B.; Hertel, O.; Ketzel, M.; Bauwelinck, M.; van Donkelaar, A.; Hvidtfeldt, U.A.; Katsouyanni, K.; et al. Spatial PM2.5, NO2, O3 and BC models for Western Europe—Evaluation of spatiotemporal stability. Environ. Int. 2018, 120, 81–92. [Google Scholar] [CrossRef]
  72. Chen, J.; de Hoogh, K.; van Donkelaar, A.; Ketzel, M.; Hertel, O.; Gulliver, J.; Martin, R.; Brunekreef, B.; Hoek, G. Assessing spatial variation of PM2.5 and NO2 across Europe using Geographically Weighted Regression. Environ. Epidemiol. 2019, 3 (Suppl. S1), 65. [Google Scholar] [CrossRef]
  73. Zhu, Y.; Shi, Y. Spatio-temporal variations of PM2.5 concentrations and related premature deaths in Asia, Africa, and Europe from 2000 to 2018. Environ. Impact Assess. Rev. 2023, 99, 107046. [Google Scholar] [CrossRef]
  74. Hael, A. Modeling spatial–temporal variability of PM2.5 concentrations in Belt and Road Initiative (BRI) region via functional adaptive density approach. Environ. Sci. Pollut. Res. 2023, 30, 110931. [Google Scholar] [CrossRef]
  75. Yang, S.; Fang, D.; Chen, B. Human health impact and economic effect for PM2.5 exposure in typical cities. Appl. Energy 2019, 249, 316–325. [Google Scholar] [CrossRef]
  76. Feng, S.; Gao, D.; Liao, F.; Zhou, F.; Wang, X. The health effects of ambient PM2.5 and potential mechanisms. Ecotoxicol. Environ. Saf. 2016, 128, 67–74. [Google Scholar] [CrossRef] [PubMed]
  77. Lu, Z.; Guan, Y.; Shao, C.; Niu, R. Assessing the health impacts of PM2.5 and ozone pollution and their comprehensive correlation in Chinese cities based on extended correlation coefficient. Ecotoxicol. Environ. Saf. 2023, 262, 115125. [Google Scholar] [CrossRef] [PubMed]
  78. Nan, N.; Yan, Z.; Zhang, Y.; Chen, R.; Qin, G.; Sang, N. Overview of PM2.5 and health outcomes: Focusing on components, sources, and pollutant mixture co-exposure. Chemosphere 2023, 323, 138181. [Google Scholar] [CrossRef]
Scheme 1. Study area map.
Atmosphere 15 01426 sch001
Figure 1. Spatial distribution of mean annual PM2.5 concentrations in Dhaka City from 2001 to 2019.
Atmosphere 15 01426 g001
Figure 2. Satellite-based mean annual PM2.5 concentrations from 2001 to 2019.
Atmosphere 15 01426 g002
Figure 3. Average monthly variation of PM2.5 in Dhaka City for 2018, 2020, 2022 and 2023.
Atmosphere 15 01426 g003
Figure 4. PM2.5 concentrations during COVID-19 full lockdown and partial lowdown periods.
Atmosphere 15 01426 g004
Figure 5. Relationship between daily PM2.5 and relative humidity (A), temperatures (B), rainfall (C), and wind speed (D).
Atmosphere 15 01426 g005
Table 1. Descriptive statistics monthly PM2.5 (µg/m3) from 2018 to 2023.
YearMonthMeanMedianStd_DeMinMaxYearMonthMeanMedianStd_DevMinMax
2018January255.824962.261605812020January236.122666.292447
2018February221.919472.941236032020February218.0199.555.892482
2018March181.917048.41715202020March173.816841.466367
2018April146.215341.45224162020April124.212337.654233
2018May112.011136.51281972020May115.911441.325270
2018June99.279533.1681852020June94.418532.116194
2018July88.278331.55241982020July91.618233.736210
2018August100.5100.535.37291882020August81.767436.212190
2018September 2020September95.118638.518187
2018October 2020October129.414242.315263
2018November197.518353.59664522020November166.416849.523334
2018December212.220450.07704082020December233.322350.3158434
YearMonthMeanMedianStd_DeMinMaxYearMonthMeanMedianStd_DevMinMax
2022January228.421455.51594892023January283.927271.1160539
2022February207.919348.81094462023February225.119873.2128598
2022March199.618550.11275182023March194.717856.685569
2022April147.415318.9862112023April177.916262.987487
2022May146.115428.2772792023May150.615427.358250
2022June137.314524.9731852023June130.5146.536.333204
2022July108.510424.1611612023July93.78822.249172
2022August102.79532.8351932023August132.4136.535.938275
2022September122.1117.537.5452822023September116.911335.545217
2022October134.615142.9133072023October152.116140.155267
2022November177.917535.8793162023November176.817655.218360
2022December249.823169.81505102023December226.4217.563.463423
Note that data were not available for September and October of 2018.
Disclaimer/Publisher’s Note: The statements, opinions and data contained in all publications are solely those of the individual author(s) and contributor(s) and not of MDPI and/or the editor(s). MDPI and/or the editor(s) disclaim responsibility for any injury to people or property resulting from any ideas, methods, instructions or products referred to in the content.

