Article

Triple Collocation-Based Uncertainty Analysis and Data Fusion of Multi-Source Evapotranspiration Data Across China

1
Overseas Expertise Introduction Center for Discipline Innovation of Watershed Ecological Security in the Water Source Area of the Middle Route of South-to-North Water Diversion, College of Water Resources and Modern Agriculture, Nanyang Normal University, Nanyang 473061, China
2
School of Geography and Planning, Sun Yat-Sen University, Guangzhou 510006, China
*
Author to whom correspondence should be addressed.
Atmosphere 2024, 15(12), 1410; https://doi.org/10.3390/atmos15121410
Submission received: 31 October 2024 / Revised: 21 November 2024 / Accepted: 23 November 2024 / Published: 24 November 2024
(This article belongs to the Section Atmospheric Techniques, Instruments, and Modeling)

Abstract

:
Accurate estimation of evapotranspiration (ET) is critical for understanding land-atmospheric interactions. Despite the advancement in ET measurement, a single ET estimate still suffers from inherent uncertainties. Data fusion provides a viable option for improving ET estimation by leveraging the strengths of individual ET products, especially the triple collocation (TC) method, which has a prominent advantage in not relying on the availability of “ground truth” data. In this work, we proposed a framework for uncertainty analysis and data fusion based on the extended TC (ETC) and multiple TC (MTC) variants. Three different sources of ET products, i.e., the Global Land Evaporation and Amsterdam Model (GLEAM), the fifth generation of European Reanalysis-Land (ERA5-Land), and the complementary relationship model (CR), were selected as the TC triplet. The analyses were conducted based on different climate zones and land cover types across China. Results show that ETC presents outstanding performance as most areas conform to the zero-error correlations assumption, while nearly half of the areas violate this assumption when using MTC. In addition, the ETC method derives a lower root mean square error (RMSE) and higher correlation coefficient (Corr) than the MTC one over most climate zones and land cover types. Among the ET products, GLEAM performs the best, while CR performs the worst. The merged ET estimates from both ETC and MTC methods are generally superior to the original triplets at the site scale. The findings indicate that the TC-based method could be a reliable tool for uncertainty analysis and data fusion.

1. Introduction

Evapotranspiration (ET) plays a pivotal role in the water, energy and carbon cycles on the Earth’s surface [1,2,3,4]. Over 60% of precipitation returns to the atmosphere through ET process on average [5], accompanied by more than 50% of net radiation energy consumption reaching the land surface [6]. Accurate estimation of ET is essential for many applications, such as climate change assessment, irrigation scheduling, crop yield estimation, water resources management, and ecological sustainability [7,8,9,10,11]. However, the involvement of sensitive climate feedback, heterogeneous land surfaces, and environmental conditions, along with their spatial and temporal variability, usually result in uncertainties in ET estimation from local to global scales [12].
ET can be estimated in various ways: (1) in situ measurement, (2) remote sensing-based retrieval, and (3) land surface model simulation. In situ measurement, including lysimeter, eddy covariance (EC), large aperture scintillometers, and the Bowen ration method, can provide credible observations to monitor ET at a specific site and local scales. However, flux site observations often suffer from the issue of energy balance closure, and the cost of deployments and maintenance of instruments over complex terrains are relatively expensive. The development of satellite technology has promoted the ability to obtain large-scale distributed ET estimates. Generally, remote sensing-based ET estimates can mainly be divided into empirical methods [13,14,15], micrometeorological theoretical models [16,17,18,19,20] and energy balance models [21,22,23]. The remotely sensed ET products include the Moderate Resolution Imaging Spectroradiometer (MODIS) [18,24], the Penman-Monteith-Leuning (PML) [25,26], the process-based land surface evapotranspiration/heat flux algorithm (P-LSH) [27], and the Global Land Evaporation Amsterdam Model (GLEAM) [28]. In addition, reanalysis systems were also applied to reproduce long-term terrestrial data at large spatial scales, which can take advantage of the land surface model and data assimilation algorithms. The reanalysis datasets, including the fifth-generation ECMWF reanalysis (ERA5) and its upgraded products, the Global Land Data Assimilation System (GLDAS) and the Modern-Era Retrospective Analysis for Research and Applications (MERRA), can also yield temporally spatially continuous ET estimates with high-resolution [29]. Despite the emergence of numerous ET products, large uncertainties still exist compared with ground-based measurements, which probably result from the variation of climate conditions and diverse vegetation types [30,31,32,33].
To utilize the strength of individual estimation, the fusion technique of multi-source data provides a suitable option for addressing these issues. The commonly introduced fusion methods include simple averaging [34], Bayesian model averaging [35], reliability ensemble averaging [36], geographical differential analysis [37], and simple Taylor skill score [38]. However, all these approaches require the selection of a reference dataset as a benchmark, namely “truth value” [39]. Although in situ observation is suitably considered as a reference, the regions with reliable and dense station data are limited or unavailable [40]. The triple collocation (TC) method has emerged as a promising technique for estimating uncertainty and merging data [41,42,43]. Stoffelen et al. [41] developed the TC method, which uses statistical relationships to estimate the random error standard deviation for three collocated datasets. It does not require the use of reference data. Put another way, the error associated with the target dataset is considered a reliable representation of the uncertainty related to that system without assuming a reference dataset. Over the years, the TC method has been further modified into various forms, including categorical triple collocation (CTC), extended triple collocation (ETC), and multiplicative triple collocation (MTC). Among them, CTC was mainly used for the categorical geophysical variables (e.g., land cover type, cloud presence/absence, wildfire burned area status, landslide occurrence, and landscape freeze/thaw) [44], while ETC and MTC were applied for continuous meteorological and hydrological variables (e.g., wind speed and stress [45], leaf area index [46], terrestrial water storage [47], soil moisture [48,49,50,51] and precipitation [52,53,54]). As for evapotranspiration, to the best of our knowledge, Khan et al. [31] first adopted the ETC method to explore the error structure and reliability of three ET datasets, including MODIS, GLEAM and GLDAS, and generated a suitable ET product based on the three collocated datasets over East Asia. Guo et al. [55] systematically investigated the consistency and uncertainty of eight ET products, including remote sensing-based, land surface model-based and merging-based datasets over China based on the ETC method. Optimally considering the zero-error cross-correlation assumption within the TC method, a novel data merging framework based on ETC was developed by Li et al. [56], and it was used for ET fusion employing multi-source gridded ET datasets (e.g., Global Land Surface Satellite (GLASS), GLEAM, FLUXCOM and PML) in the Nordic region. The results revealed that TC-based merged ET outperforms all original products with lower errors, suggesting the good feasibility and reliability of the ETC method for improving ET accuracy. Additionally, Park et al. [43] adopted the ETC method to calculate the uncertainties of ET and its components (i.e., transpiration, soil evaporation and interception loss), and the weight factors were obtained for merging ET. The results showed that merged ET was more similar to site-based observation in magnitude.
Previous studies have demonstrated that the ETC method has great potential in ET data fusion without the requirement of flux gauge data. However, there is a lack of studies on ET data fusion using the MTC method. In addition, further enhancement is required to investigate the differential application of ET fusion using ETC and MTC methods across various climate zones and land use cover types in China. To fill these knowledge gaps, this study focused on the discrepancy in performances between ETC and MTC methods. The novelties of this study include (1) estimating the uncertainties of multi-source gridded ET products with ETC and MTC approaches; (2) investigating the differences between the results obtained from two methods under diverse climate conditions and land cover classifications; (3) elucidating which method is more effective in ET data fusion over China.

2. Materials and Methods
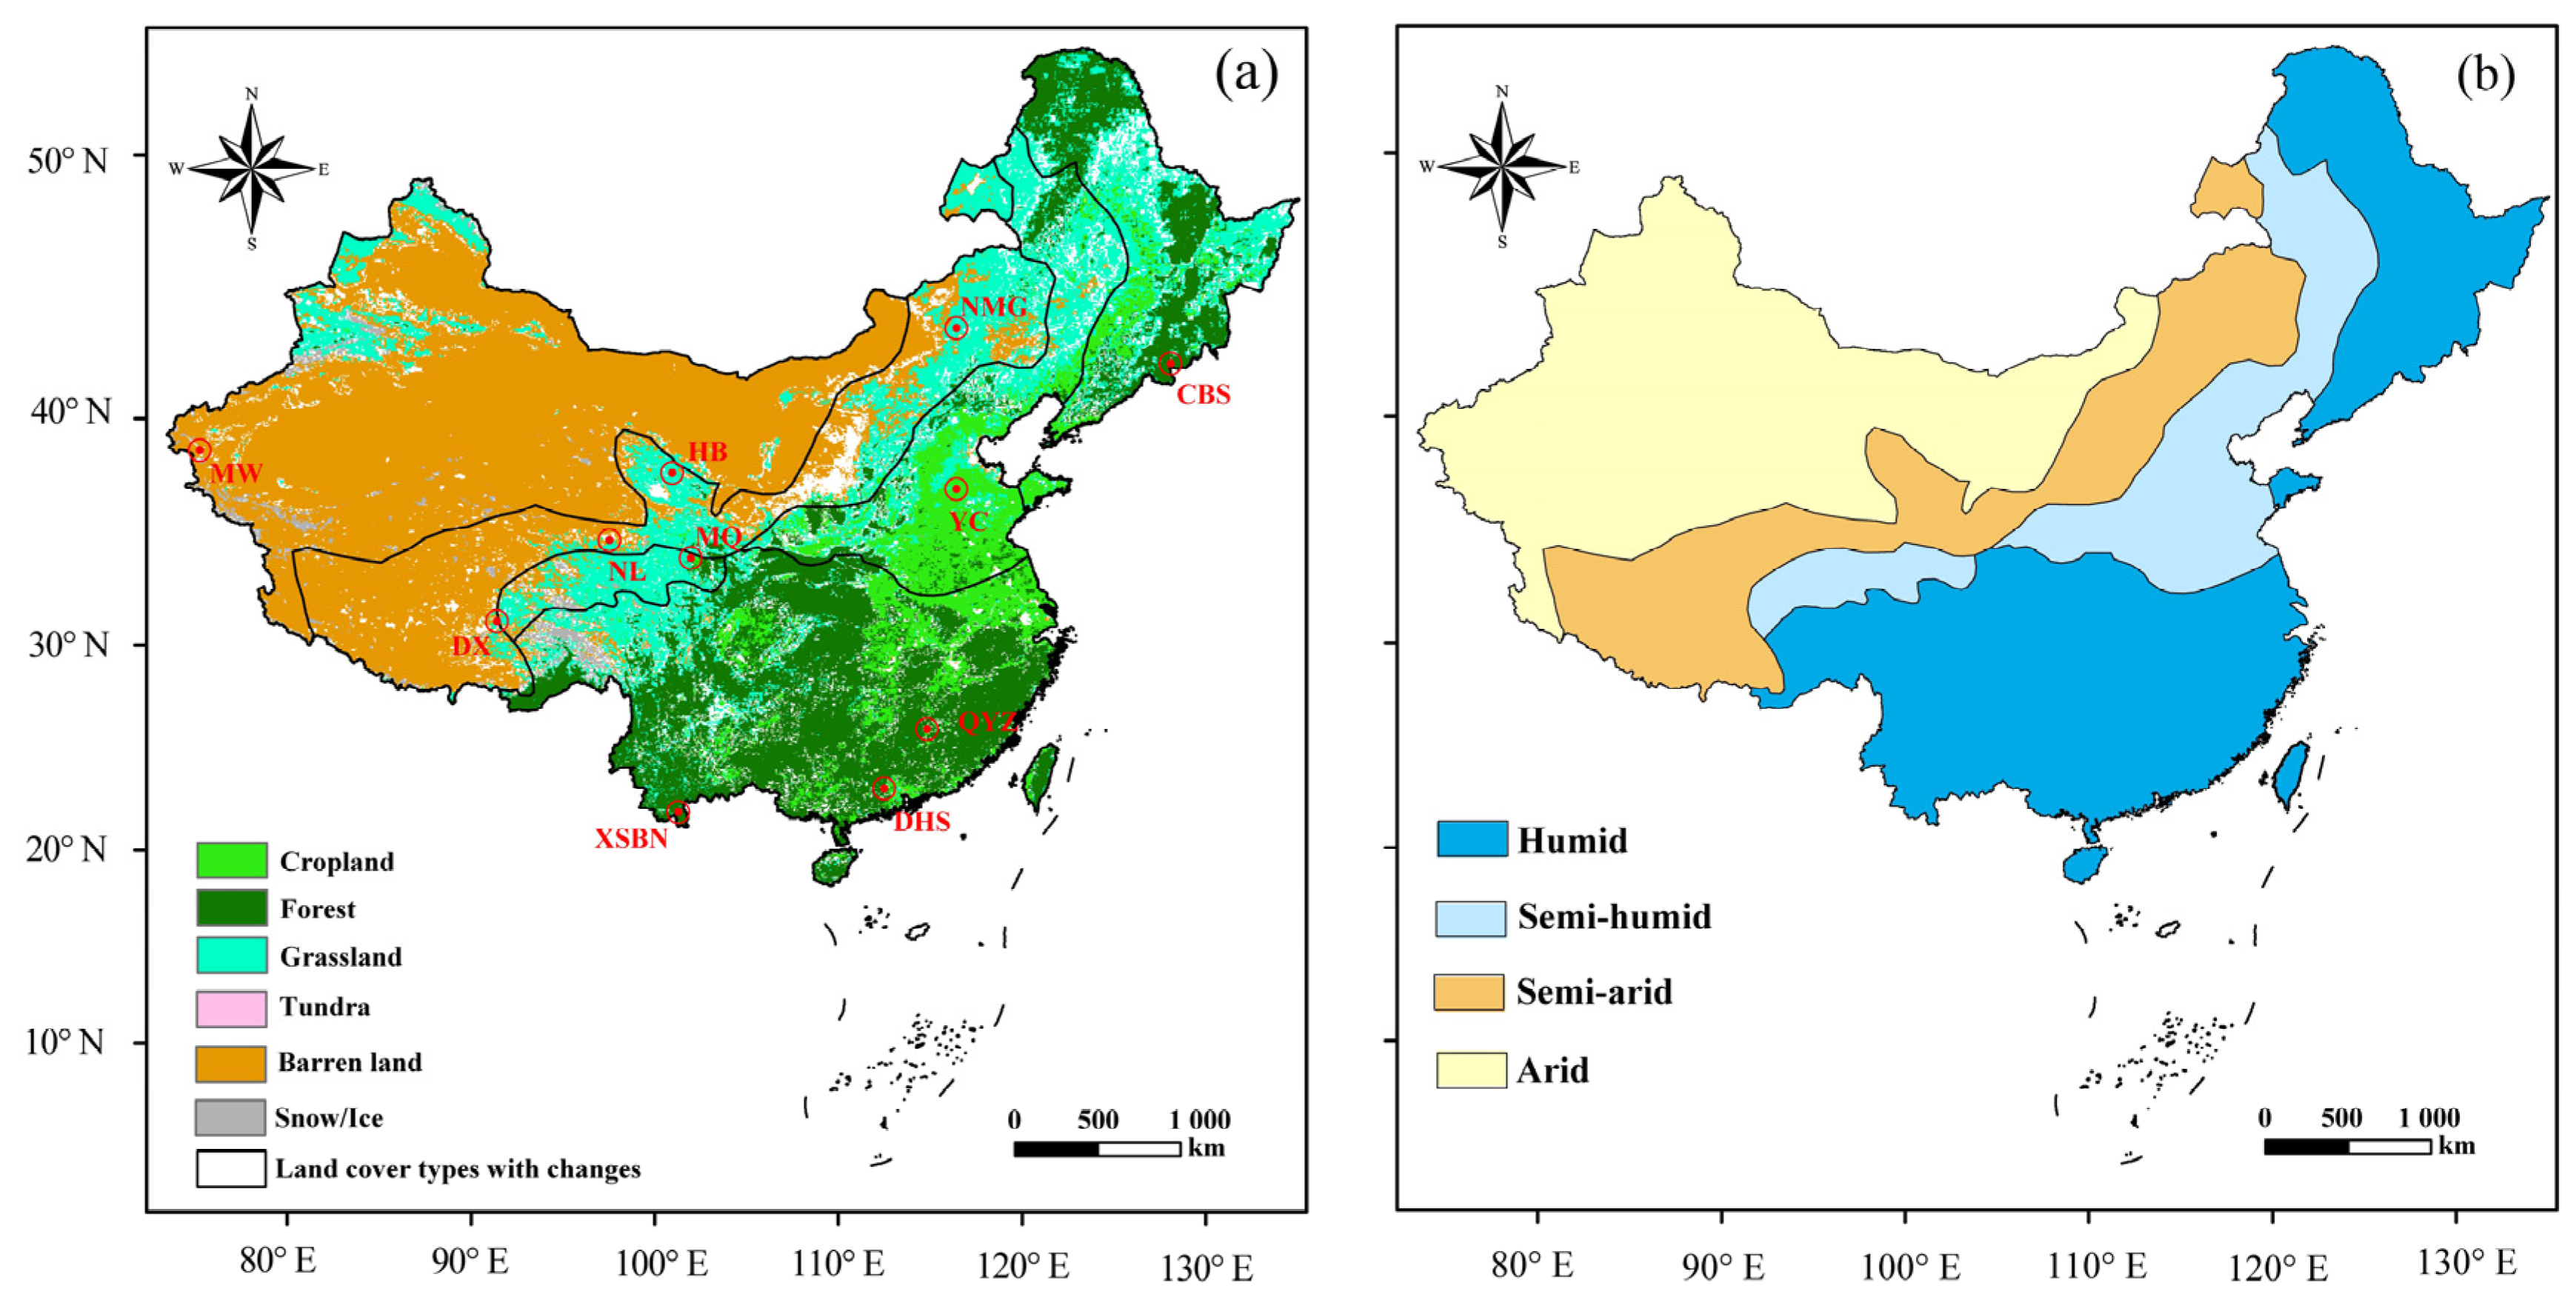
2.1. Study Area

The study area covers China, ranging from 70° E to 140° E longitude and 15° N to 55° N latitude, as shown in Figure 1. To comprehensively understand the performance of merging ET, the result analyses were conducted at multiple spatial scales, including the land cover type, climate zone, and point. The land cover types data were derived from the GLASS-GLC dataset, which is an annual global land cover type dataset with a long-term (34 years, from 1982 to 2015) and high-resolution (5 km) [57]. The land cover types of this dataset are categorized into seven classes, namely cropland, forest, grassland, shrubland, tundra, barren land, and snow/ice, and the accuracy can reach 82.8%. In this study, we applied ArcGIS to extract the grid cells without changes during the specified period to avoid the impact of land cover type changes on ET estimates. In addition, according to the climate conditions, the study area is divided into arid, semi-arid, semi-humid, and humid regions [58,59].

2.2. Datasets

2.2.1. Evapotranspiration Data

For three selected different sources ET dataset products, the GLEAM ET product was chosen as a representative of the remote sensing-based ET dataset, the ERA5-Land ET product was served as a representative of the reanalysis ET product, and CR ET was taken as a typical product representing the complementary relationship model-based ET product.
GLEAM ET dataset was generated based on the Priestley-Taylor equation with observed data (e.g., net radiation, precipitation, surface soil moisture skin temperature, vegetation optical depth, and air temperature) obtained from satellite-based microwave sensors as input [60,61,62,63]. In GLEAM, the cover-dependent potential evaporation (PET) was calculated, and then it was converted into actual transpiration or bare soil evaporation using multiplicative stress factor and specific algorithms [28]. GLEAM ET has been proven to be superior in accuracy in large-scale multi-dataset comparison studies compared with other satellite-based ET products [36,64,65]. In this study, the GLEAM 3.6a ET dataset was employed, which integrated a novel data assimilation scheme, an enhanced water balance module, and a series of evaporative stress functions. It provides daily ET estimations at 0.25° spatial resolution, covering the period from 1980 to 2021. This product can be freely downloaded from the website (https://www.gleam.eu, accessed on 30 October 2024).
ERA5-Land served as a new land component of the fifth generation of European Reanalysis (ERA5) datasets, representing the movement of water and energy cycles over the terrestrial surface [66]. The substantial improvement in ERA5-Land was that the original horizontal resolution was refined from 0.25°/0.7° (ERA5/ERA-Interim) to 0.1° by employing finer meteorological forcing datasets. The atmospheric variables at 10 m above the land surface were interpolated to a spatial resolution of 0.1°. Moreover, the temporal resolution of ERA5-Land can reach 1 hr. Benefiting from the high-quality meteorological forcing data and advancement in assimilation, ERA5-Land ET is superior to other ET reanalysis products and suitable for hydrological studies [67,68,69]. The dataset is accessed at the Copernicus Climate Change Service (https://cds.climate.copernicus.eu, accessed on 30 October 2024).
CR ET is a long-term terrestrial ET product developed by Ma et al. [70]. This dataset was derived from a recently proposed nonlinear complementary relationship model [71]. The original CR method was introduced by Bouchet [72], which emphasized the feedback mechanism between actual ET and potential ET under the same environmental condition. Ma et al. [70] further improved this model and generated a corresponding CR-based ET product. A series of independent evaluations were conducted to validate the reliability of this product [70]. Therefore, the CR model has been considered one of the most attractive tools for estimating ET due to its accuracy and minimal data requirement (only atmospheric forcing input). The monthly CR ET dataset is available from the National Tibetan Plateau Data Center (https://poles.tpdc.ac.cn, accessed on 30 October 2024), with a spatial resolution of 0.1° across China, spanning from 1982 to 2017.

2.2.2. Flux Tower Data

In this study, we selected observed flux data (ET in energy) based on 11 EC-based flux towers to assess the performance of merging ET data at specific sites. The geographical locations of these observation sites are presented in Figure 1, and the information is listed in Table 1. Among them, the sites of Haibei, Inner Mongolia, Dangxiong, Changbaishan, Qianyanzhou, Dinghushan, Xishuangbanna and Yucheng are from ChinaFLUX (http://www.chinaflux.org/enn/index.aspx, accessed on 30 October 2024), and the Maqu, MAWORS and Ngoring Lake sites come from the National Tibetan Plateau Data Center (https://data.tpdc.ac.cn, accessed on 30 October 2024), collected by Ma et al. [73]. Furthermore, post-processing, including quality check procedures based on meteorological statistical tests (e.g., outlier removal and coordinate rotation), and gap-filling procedures were conducted for all observations. Beyond that, the observation data is thermal flux data with a unit of W/m2, which was converted to equivalent ET with a unit of mm/month using Equation (1) to match the ET products and their fusion data.
E T = L E / λ
where λ is the latent heat of vaporization assumed to be a constant of 2.45 MJ/kg.

2.3. Methodology

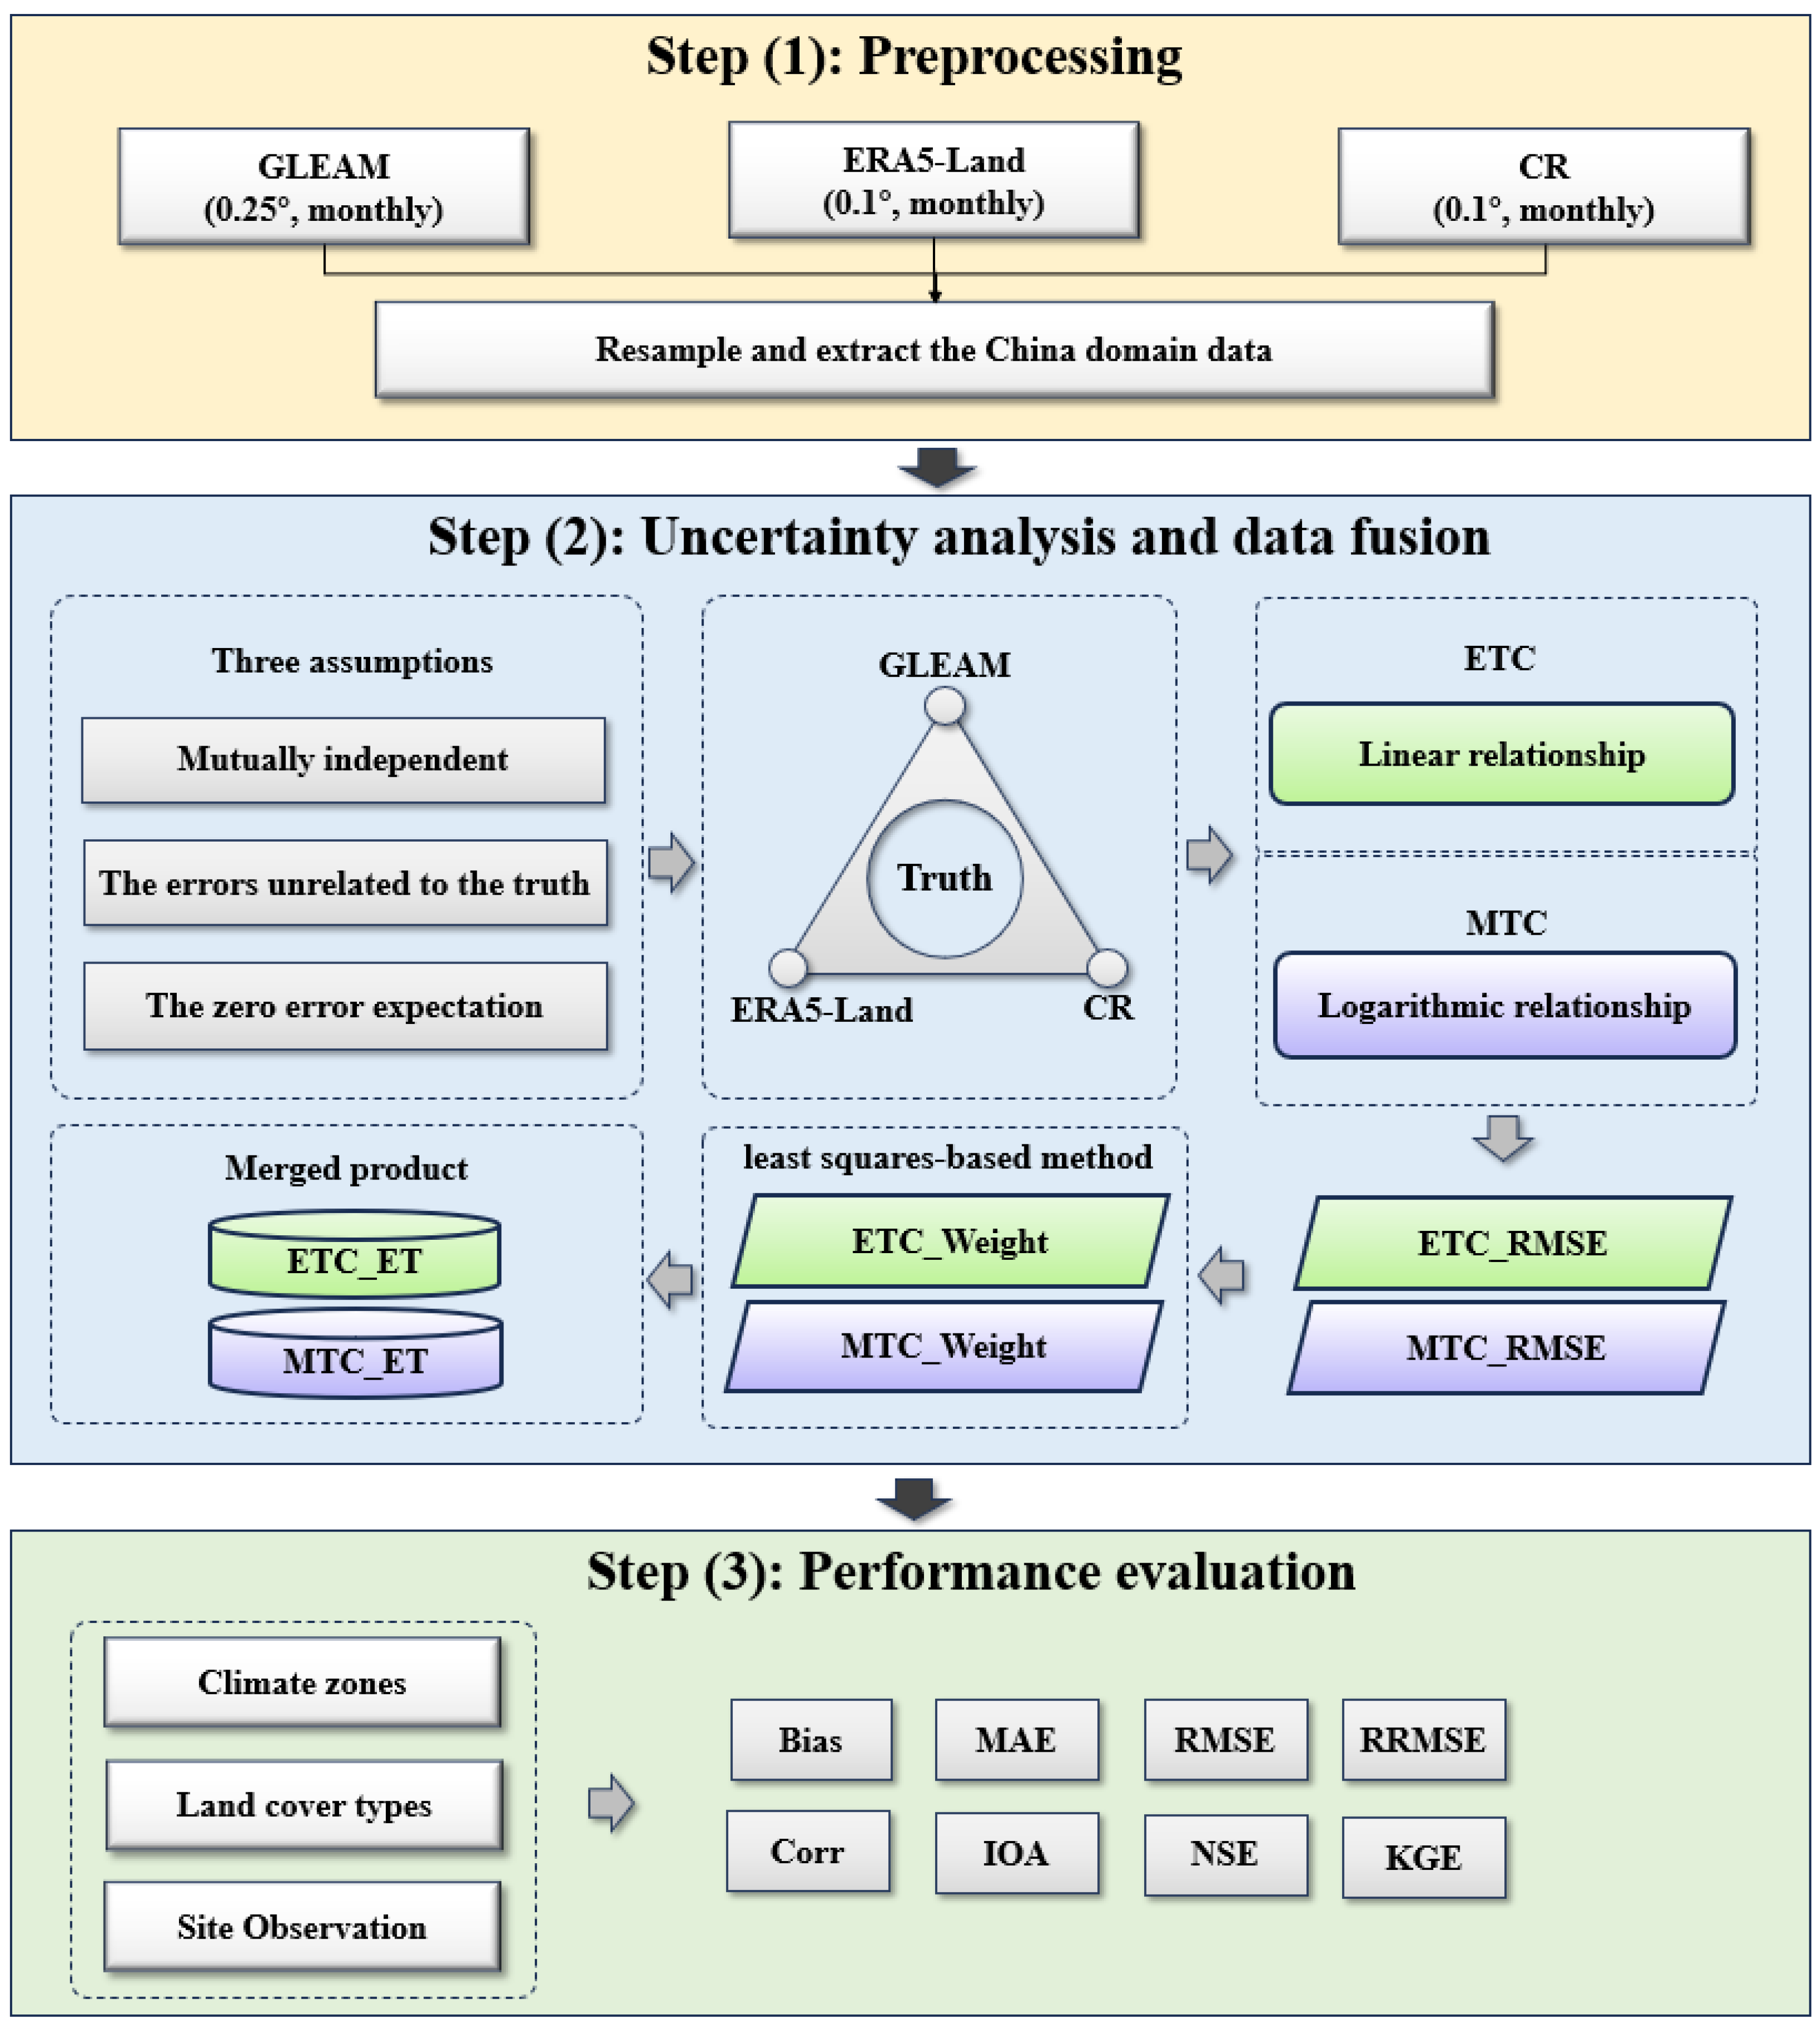
2.3.1. Framework for Uncertainty Analysis and Data Fusion of ET

This study aimed to propose a framework for uncertainty analysis and data fusion with ETC and MTC methods, as depicted in Figure 2. It consists of three main steps:
Step (1): Preprocessing. GLEAM ET data were resampled to a spatial resolution of 0.1° × 0.1° using the bilinear interpolation method to ensure consistency with ERA5-Land and CR. Subsequently, the monthly ET data from the overlap period (1982–2017) were extracted from the three ET products for data fusion.
Step (2): Uncertainty analysis and data fusion. GLEAM, ERA5-Land and CR products were employed as collocated input data, and ETC and MTC methods were applied to analyze the uncertainty of original ET products based on three basic assumptions (e.g., the random errors of the three input datasets are independent; the random errors of the three input measurements are uncorrelated with the truth value; the expectation of random errors from the three input datasets are zero). The ET fusion process included three main stages: First, deriving the RMSE values of the three collocated ET products using both ETC and MTC methods. Second, the fusion weights are calculated based on the RSME values using the least squares method. Third, merged ET data can be generated by combining the original parent ET products with fusion weights. Detailed information on ETC and MTC methods will be provided in the next section.
Step (3): Performance evaluation. The performances of ET fusion products, derived from the two fusion methods, were evaluated from the perspectives of different climate zones and land cover types. Additionally, the performances of merged ET in point scale were also assessed using site-based observation via eight statistical metrics.

2.3.2. Extended Triple Collocation (ETC)

The ETC method is used to calculate the root mean squared error (RMSE) and correlation coefficient (Corr) without giving a reference [49,74,75]. In the ETC method, a linear relationship is assumed between the estimation of each geophysical variable (e.g., evapotranspiration, soil moisture, or precipitation) and the truth value, which can be expressed as:
E i = α i + β i E t r u e + ε i
where E i ( i = 1 , 2 , 3 ) represents the i th measurements (here is original ET dataset product) of the true value E t r u e with random error ε i ( i = 1 , 2 , 3 ); α i and β i denote the slope and intercept of ordinary least squares (OLS), respectively. Note that the ETC model requires three independent input measurements and follows three assumptions [75], as follows: (1) the random errors of the three input datasets are independent; (2) the random errors of the three input measurements are uncorrelated with the truth value; (3) the expectation of random errors from the three input datasets are zero. With these assumptions, the calculation of error covariance C i j , between i th and j th input, can be expressed as:
C i j = C o v E i , E j = β i β j σ E t r u e 2
σ E i 2 = D E i = D α i + β i E t r u e + ε i = β i 2 σ E t r u e 2 + σ ε i 2
where D · and C o v · represent the variance and covariance, respectively; σ denotes the standard variance. Combining Equations (3) and (4), we can deduce the RMSE ( σ ε i 2 ) between each collocated estimate and the truth value without knowing σ E t r u e , as follows:
σ ε i 1 2 = σ E 1 2 β 1 2 σ E t r u e 2 = C 11 C 12 C 13 C 23
σ ε i 2 2 = σ E 2 2 β 2 2 σ E t r u e 2 = C 22 C 12 C 23 C 13
σ ε i 3 2 = σ E 3 2 β 3 2 σ E t r u e 2 = C 33 C 13 C 23 C 12

2.3.3. Multiplicative Triple Collocation (MTC)

In the ETC method, the random error ( ε i ) is supposed to be an additive factor. Meanwhile, the MTC method applied a multiplicative model to estimate the error of collocated measurements [76]. As a result, the multiplicative error model is defined as follows:
E i = α i E t r u e β i e ε i
According to natural logarithmic of Equation (8), we can make the substitution of α i = l n α i , R i = l n E i , R t r u e = l n E t r u e . Therefore, the equation can be simplified to the linear form:
R i = α i + β i E t r u e + ε i
Then, similar to the solutions of RMSE in the ETC method, the RMSE in the MTC method can also be derived based on Equations (5)–(7). Furthermore, it is noteworthy that RMSE results are in logarithmic scale in the MTC model [76], and the real RMSE ( σ E i ) can be expressed as follows:
σ E i = μ E i σ R i
where σ E i denotes the RMSE in logarithmic scale; μ E i represents the average of the original collocated ET data.

2.3.4. Least Squares-Based Data Fusion Method

In this study, we adopted the least squares-based method to merge ET data. In the fusion method, the optimal weight of each collocated measurement was calculated based on RMSE obtained from ETC or MTC. The basic functions of the least squares were formulated as follows:
E f = ω 1 E 1 + ω 2 E 2 + ω 3 E 3
ω 1 + ω 2 + ω 3 = 1
where E f is the fused ET estimation; ω 1 , ω 2 and ω 3 are the weight of three collocated measurements, respectively, and the sum of them should be 1.0 to obtain an unbiased E f . Combined with the independent assumption of collocated triplet and following the principle of minimizing σ E f 2 , we can deduce the variance of the fused product [77]. The error variance equations can be written as:
σ E f 2 = ω 1 2 σ E 1 2 + ω 2 2 σ E 2 2 + ω 3 2 σ E 3 2
ω 1 = σ E 2 2 σ E 3 2 σ E 1 2 σ E 2 2 + σ E 1 2 σ E 3 2 + σ E 2 2 σ E 3 2
ω 2 = σ E 1 2 σ E 3 2 σ E 1 2 σ E 2 2 + σ E 1 2 σ E 3 2 + σ E 2 2 σ E 3 2
ω 3 = σ E 1 2 σ E 2 2 σ E 1 2 σ E 2 2 + σ E 1 2 σ E 3 2 + σ E 2 2 σ E 3 2
Then, the merged result of multi-source ET data can be obtained by using Equation (11) according to the above weights. In addition, it should be noted that the E f result merged by the ETC method are the real merged results. However, the MTC model, E f result is the result in logarithmic scale. Consequently, it should be transformed into a real merged result through inverse function, as follows:
E f = e x p ω 1 E 1 + ω 2 E 2 + ω 3 E 3

2.4. Evaluation Metrics

Eight different statistical metrics, including the Bias, mean absolute error (MAE), RMSE, relative RMSE (RRMSE), Corr, index of agreement (IOA), Kling-Gupta efficiency (KGE) and Nash–Sutcliffe efficiency coefficient (NSE) were used to evaluate the merged results.
B i a s = 1 n i = 1 n M i O i
M A E = 1 n i = 1 n M i O i
R M S E = 1 n i = 1 n M i O i 2
R R M S E = R M S E O ¯ × 100 %
C o r r = i = 1 n M i M ¯ O i O ¯ i = 1 n M i M ¯ 2 i = 1 n O i O ¯ 2
I O A = 1 i = 1 n M i O i 2 i = 1 n M i O ¯ + O i O ¯ 2
K G E = 1 C o r r 1 2 + α 1 2 + β 1 2
N S E = 1 i = 1 n M i O i 2 i = 1 n O i O ¯ 2
where M i and O i represent the merged and observed ET values, respectively; the subscript i denotes the sample number at i th position or i th time step; n denotes the total number of grid cells or time steps; M ¯ and O ¯ denote the spatial or temporal mean of the merged ET and observed ET values, respectively; α is the ratio between the standard deviation of merged ET and standard deviation of observed ET; β represents the ratio between the mean value of merged ET and the mean value of observed ET.

3. Results

In this section, we first compared the performances of three parent ET products (i.e., GLEAM, ERA5-Land, and CR) over four climate zones (i.e., arid, semi-arid, semi-humid, and humid zones). Then, the uncertainties of three ET products derived from ETC and MTC methods over different climate zones and land cover types were analyzed. Afterward, the merging weights and dominant ET datasets were analyzed based on the two methods, followed by the assessment of the performances of data fusion with in situ ET observation at a point scale. For better comparison from multiple scales, some data preprocessing is required. The GLASS-GLC land cover type dataset was upscaled into 0.1° using the nearest neighbor resampling method. All the analysis and assessment were conducted at the temporal scale of the month and spatial scale of 0.1° × 0.1° grid cell. In addition, given that there may be a violation of the ETC and MTC methods assumptions, these pixels violating assumptions have been excluded to keep consistency.

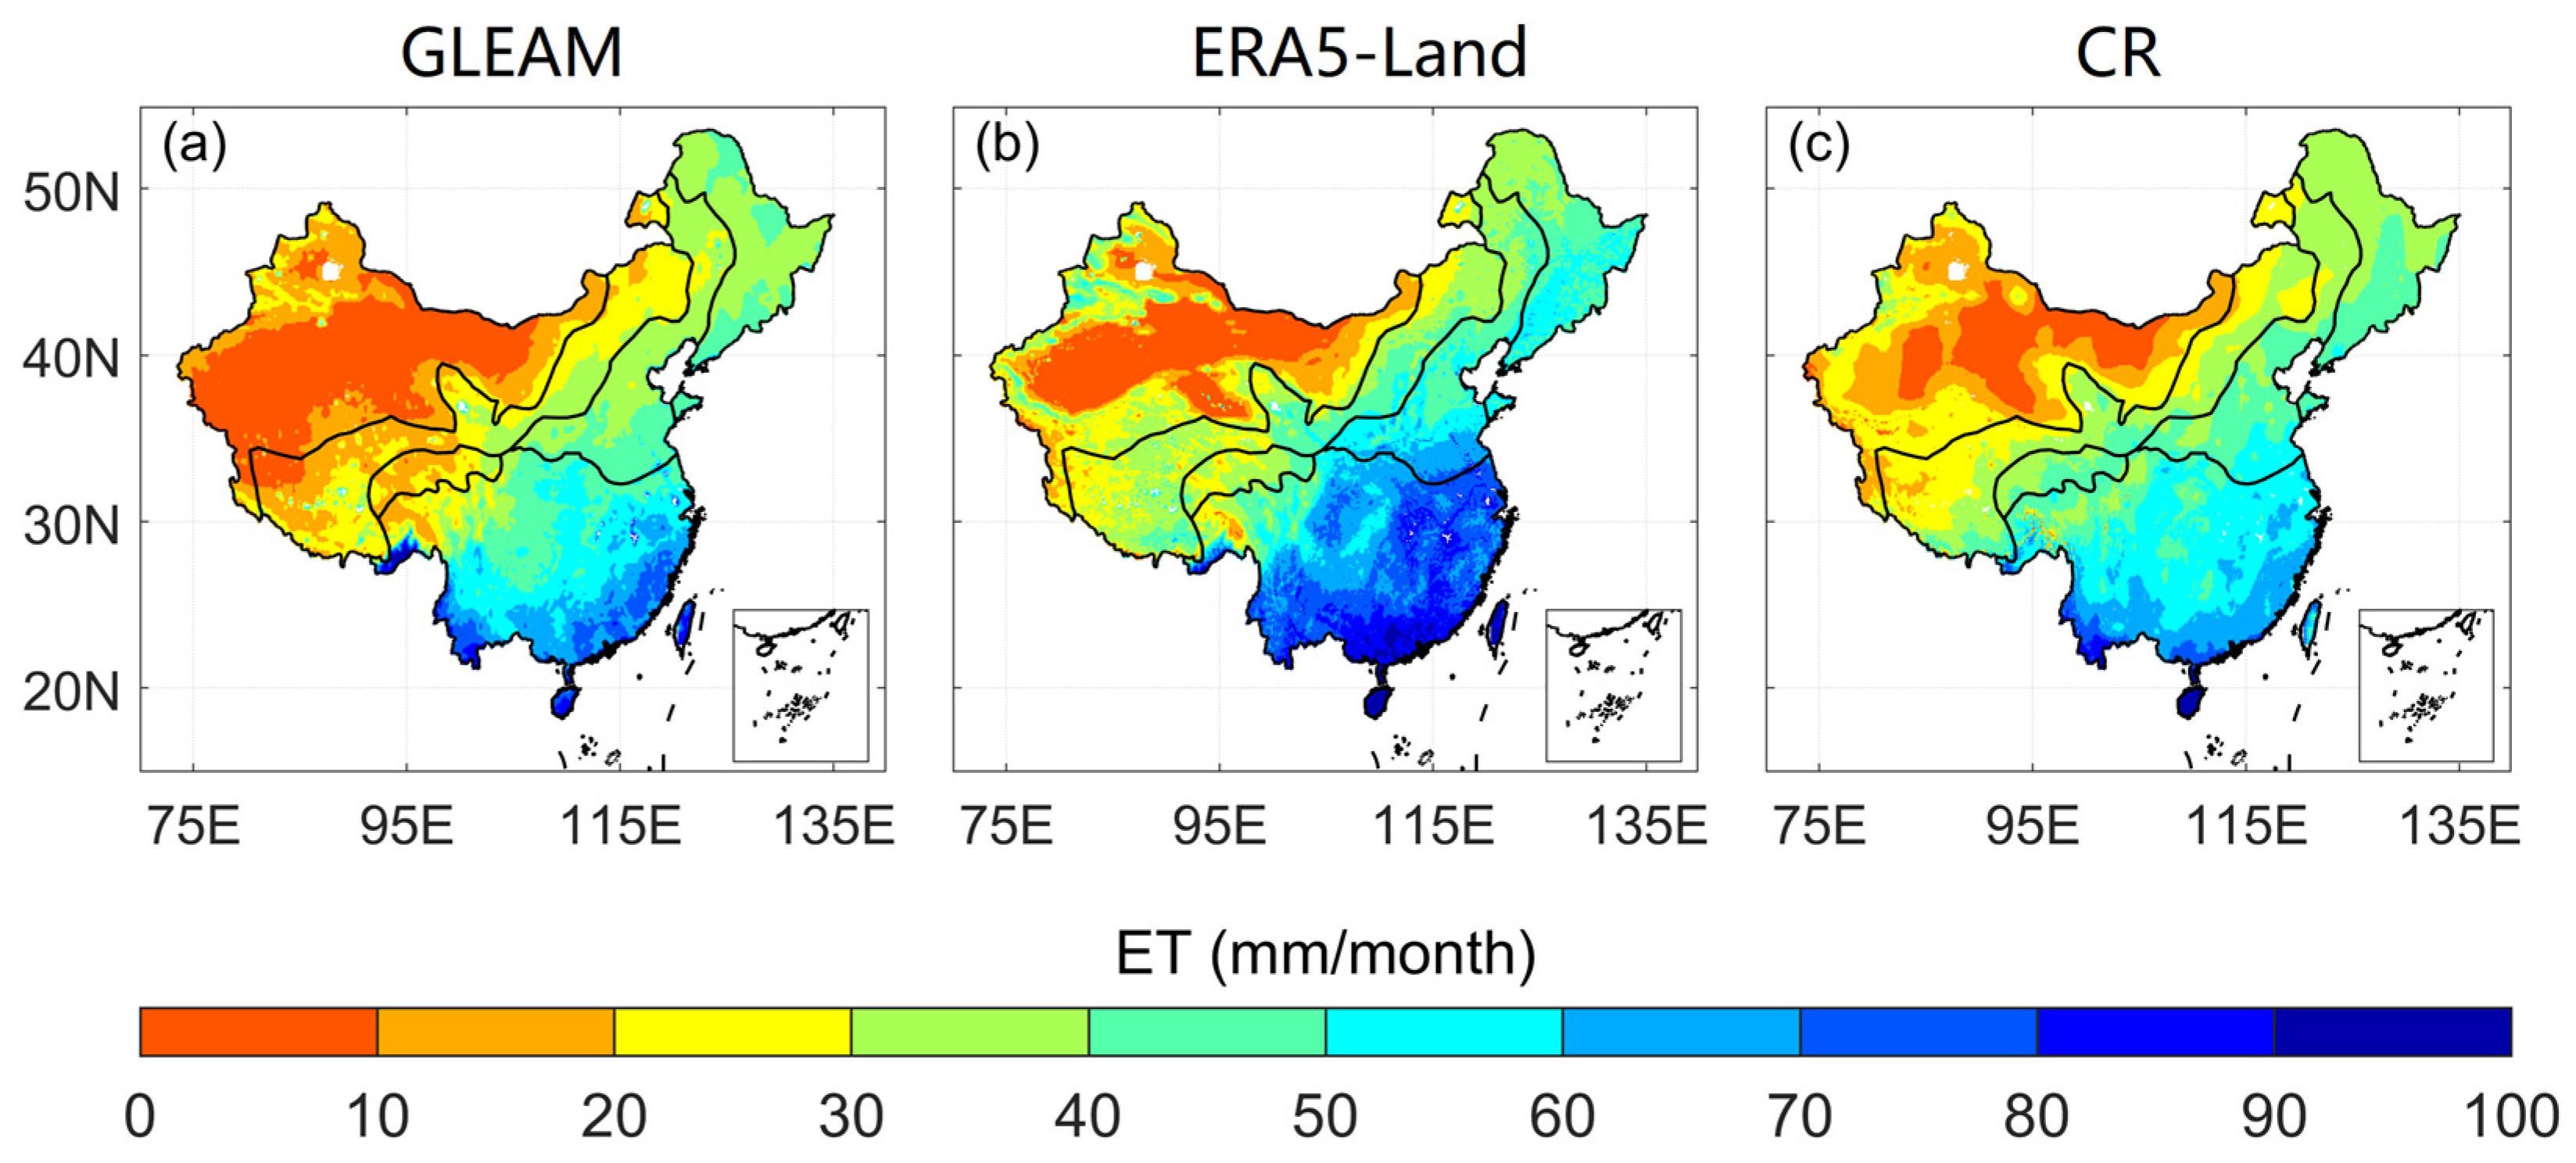
3.1. Intercomparison of Three Collocated ET Products

The spatial distributions of multi-year monthly average ET derived from three parent ET products are displayed in Figure 3, and the statistical indices of ET over four climate zones are provided in Table 2. As a whole, the three ET products consistently show a southeast-to-northwest decreasing trend in the multi-year monthly ET over China. Areal average ET value from CR (35.59 mm/month) is larger than that from GLEAM (30.67 mm/month) but smaller than that from ERA5-Land (41.66 mm/month). This spatial gradient is basically consistent with the division from the arid zone to the humid zone. In terms of extreme values, the highest monthly ET is distributed in southmost China, located in a humid region, where the ET values can reach 141.73 mm/month for GLEAM, 141.90 mm/month for ERA5-Land, and 112.67 mm/month. By contrast, the lowest monthly ET is in the northwest of China, distributed in an arid region, where the ET values are only 0.66, 0.10, and 0.58 mm/month for GLEAM, ERA5-Land, and CR, respectively. Among the three ET products, ERA5-Land shows higher ET values, especially in humid zones, while GLEAM generally tends to present lower ET values, especially in arid regions.

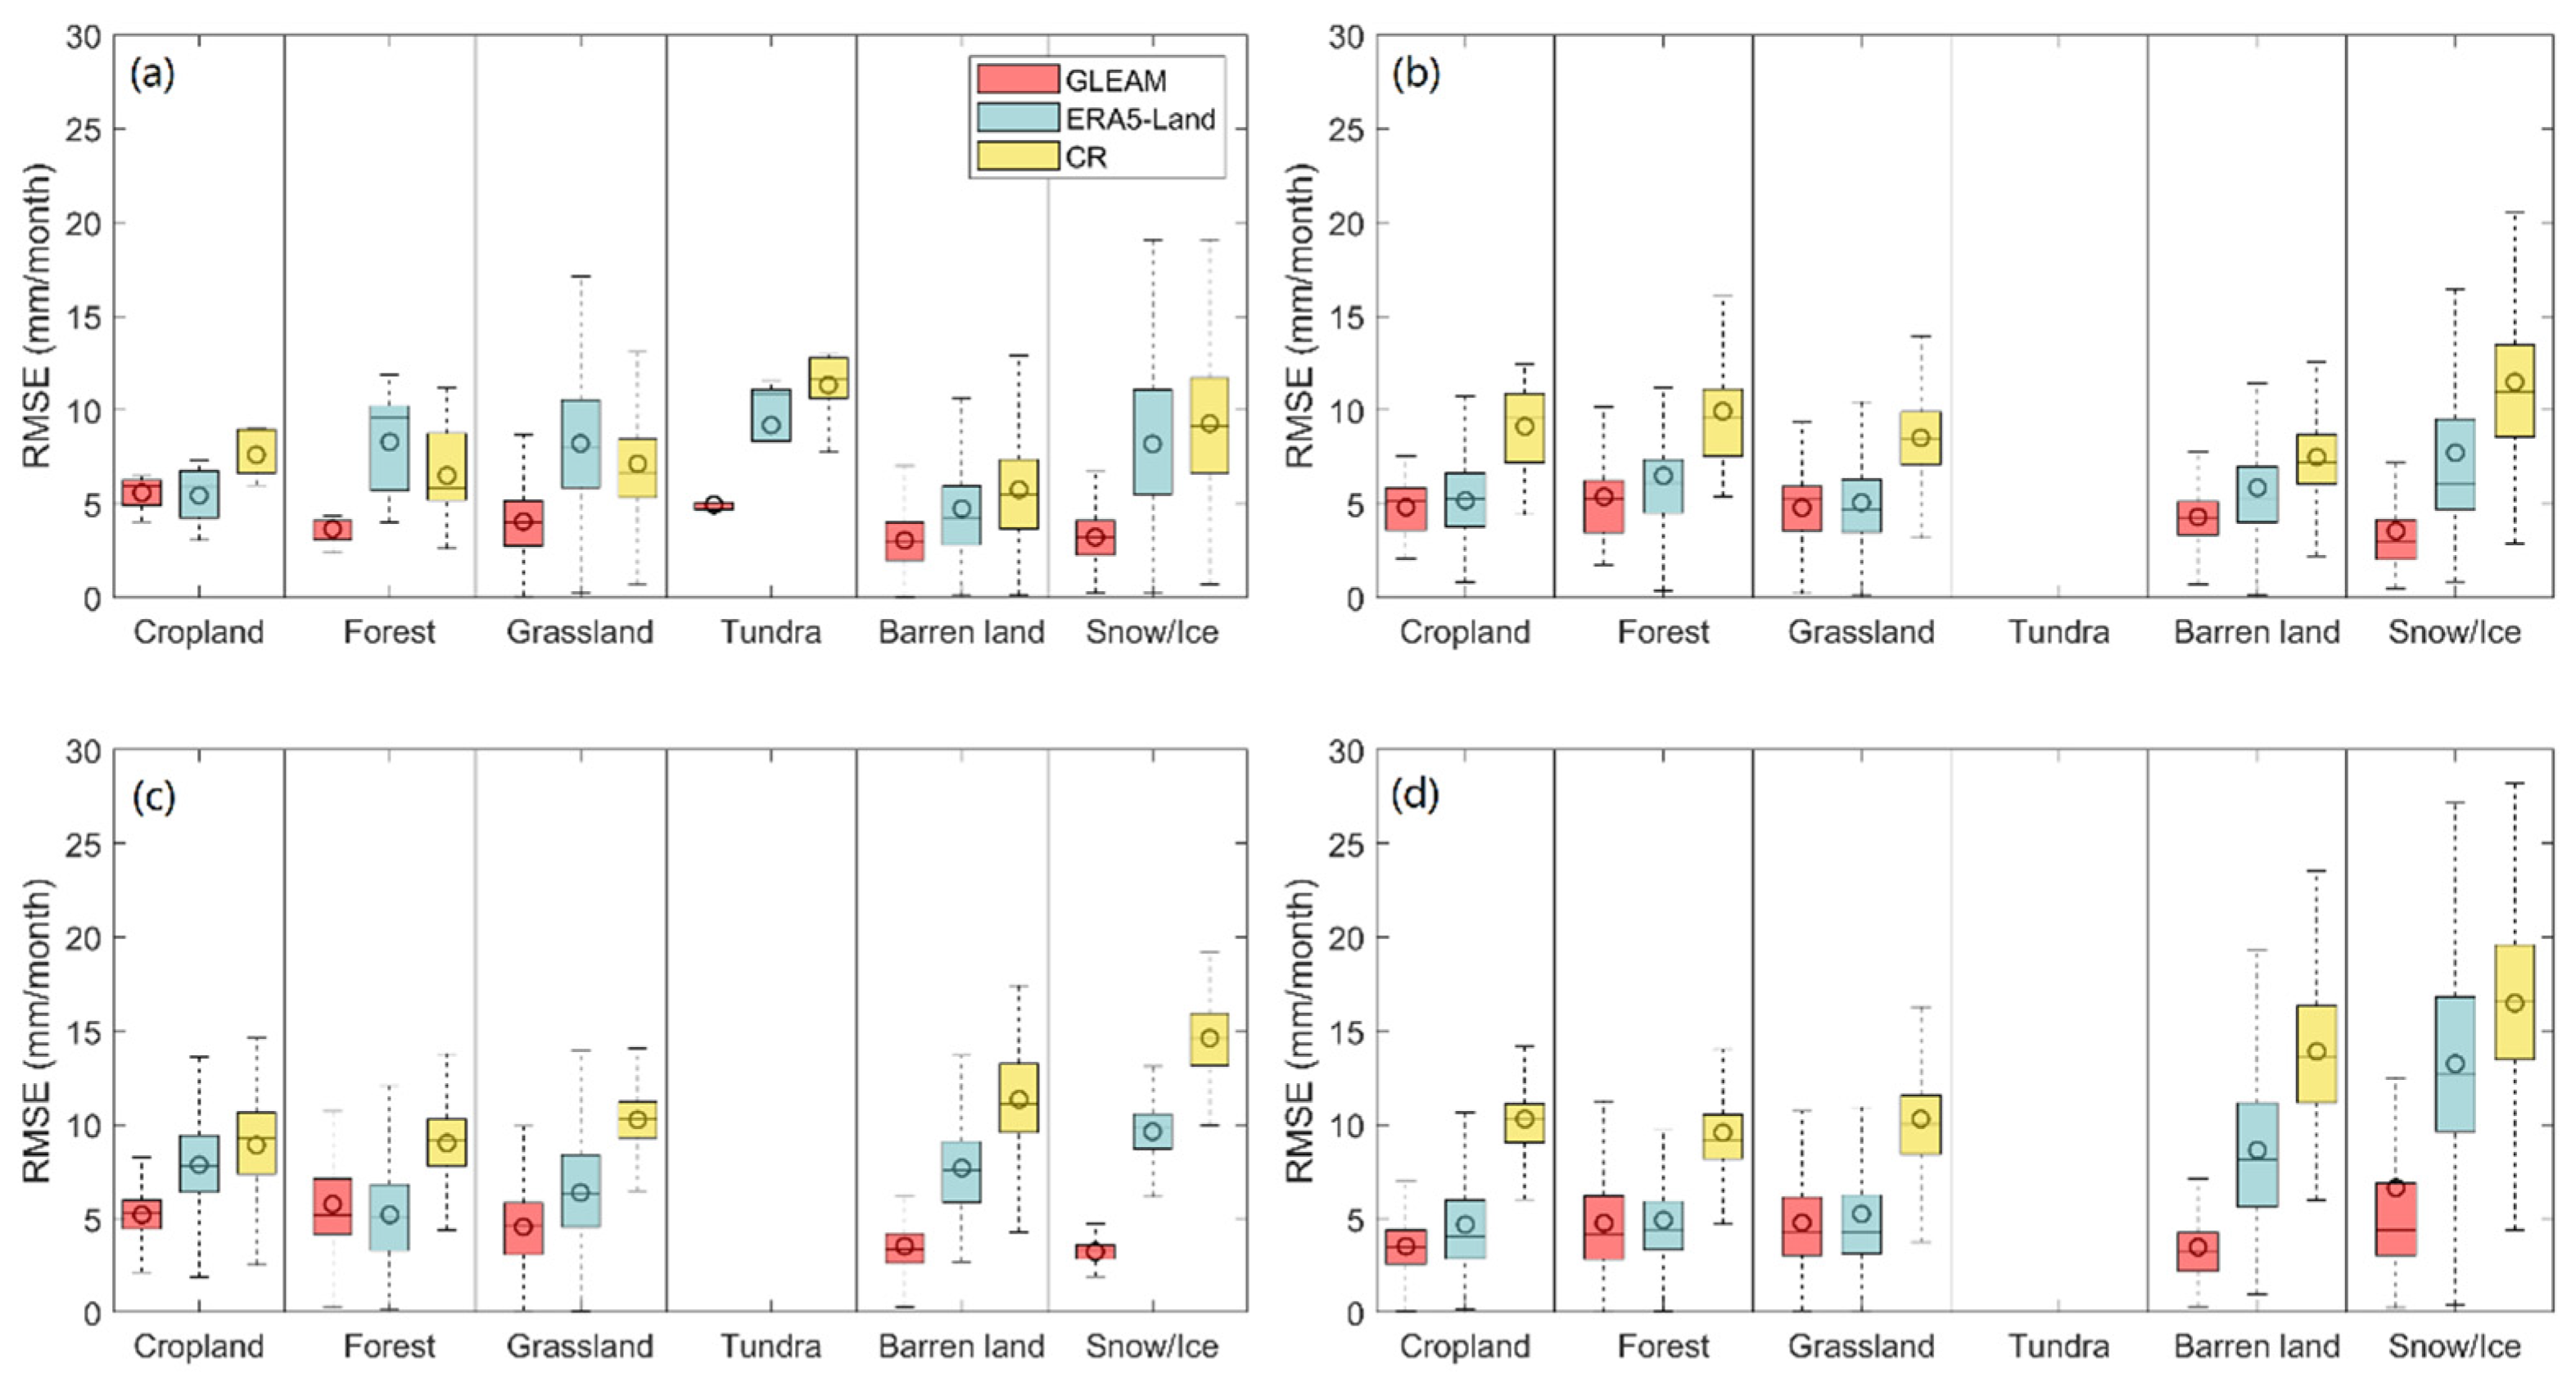
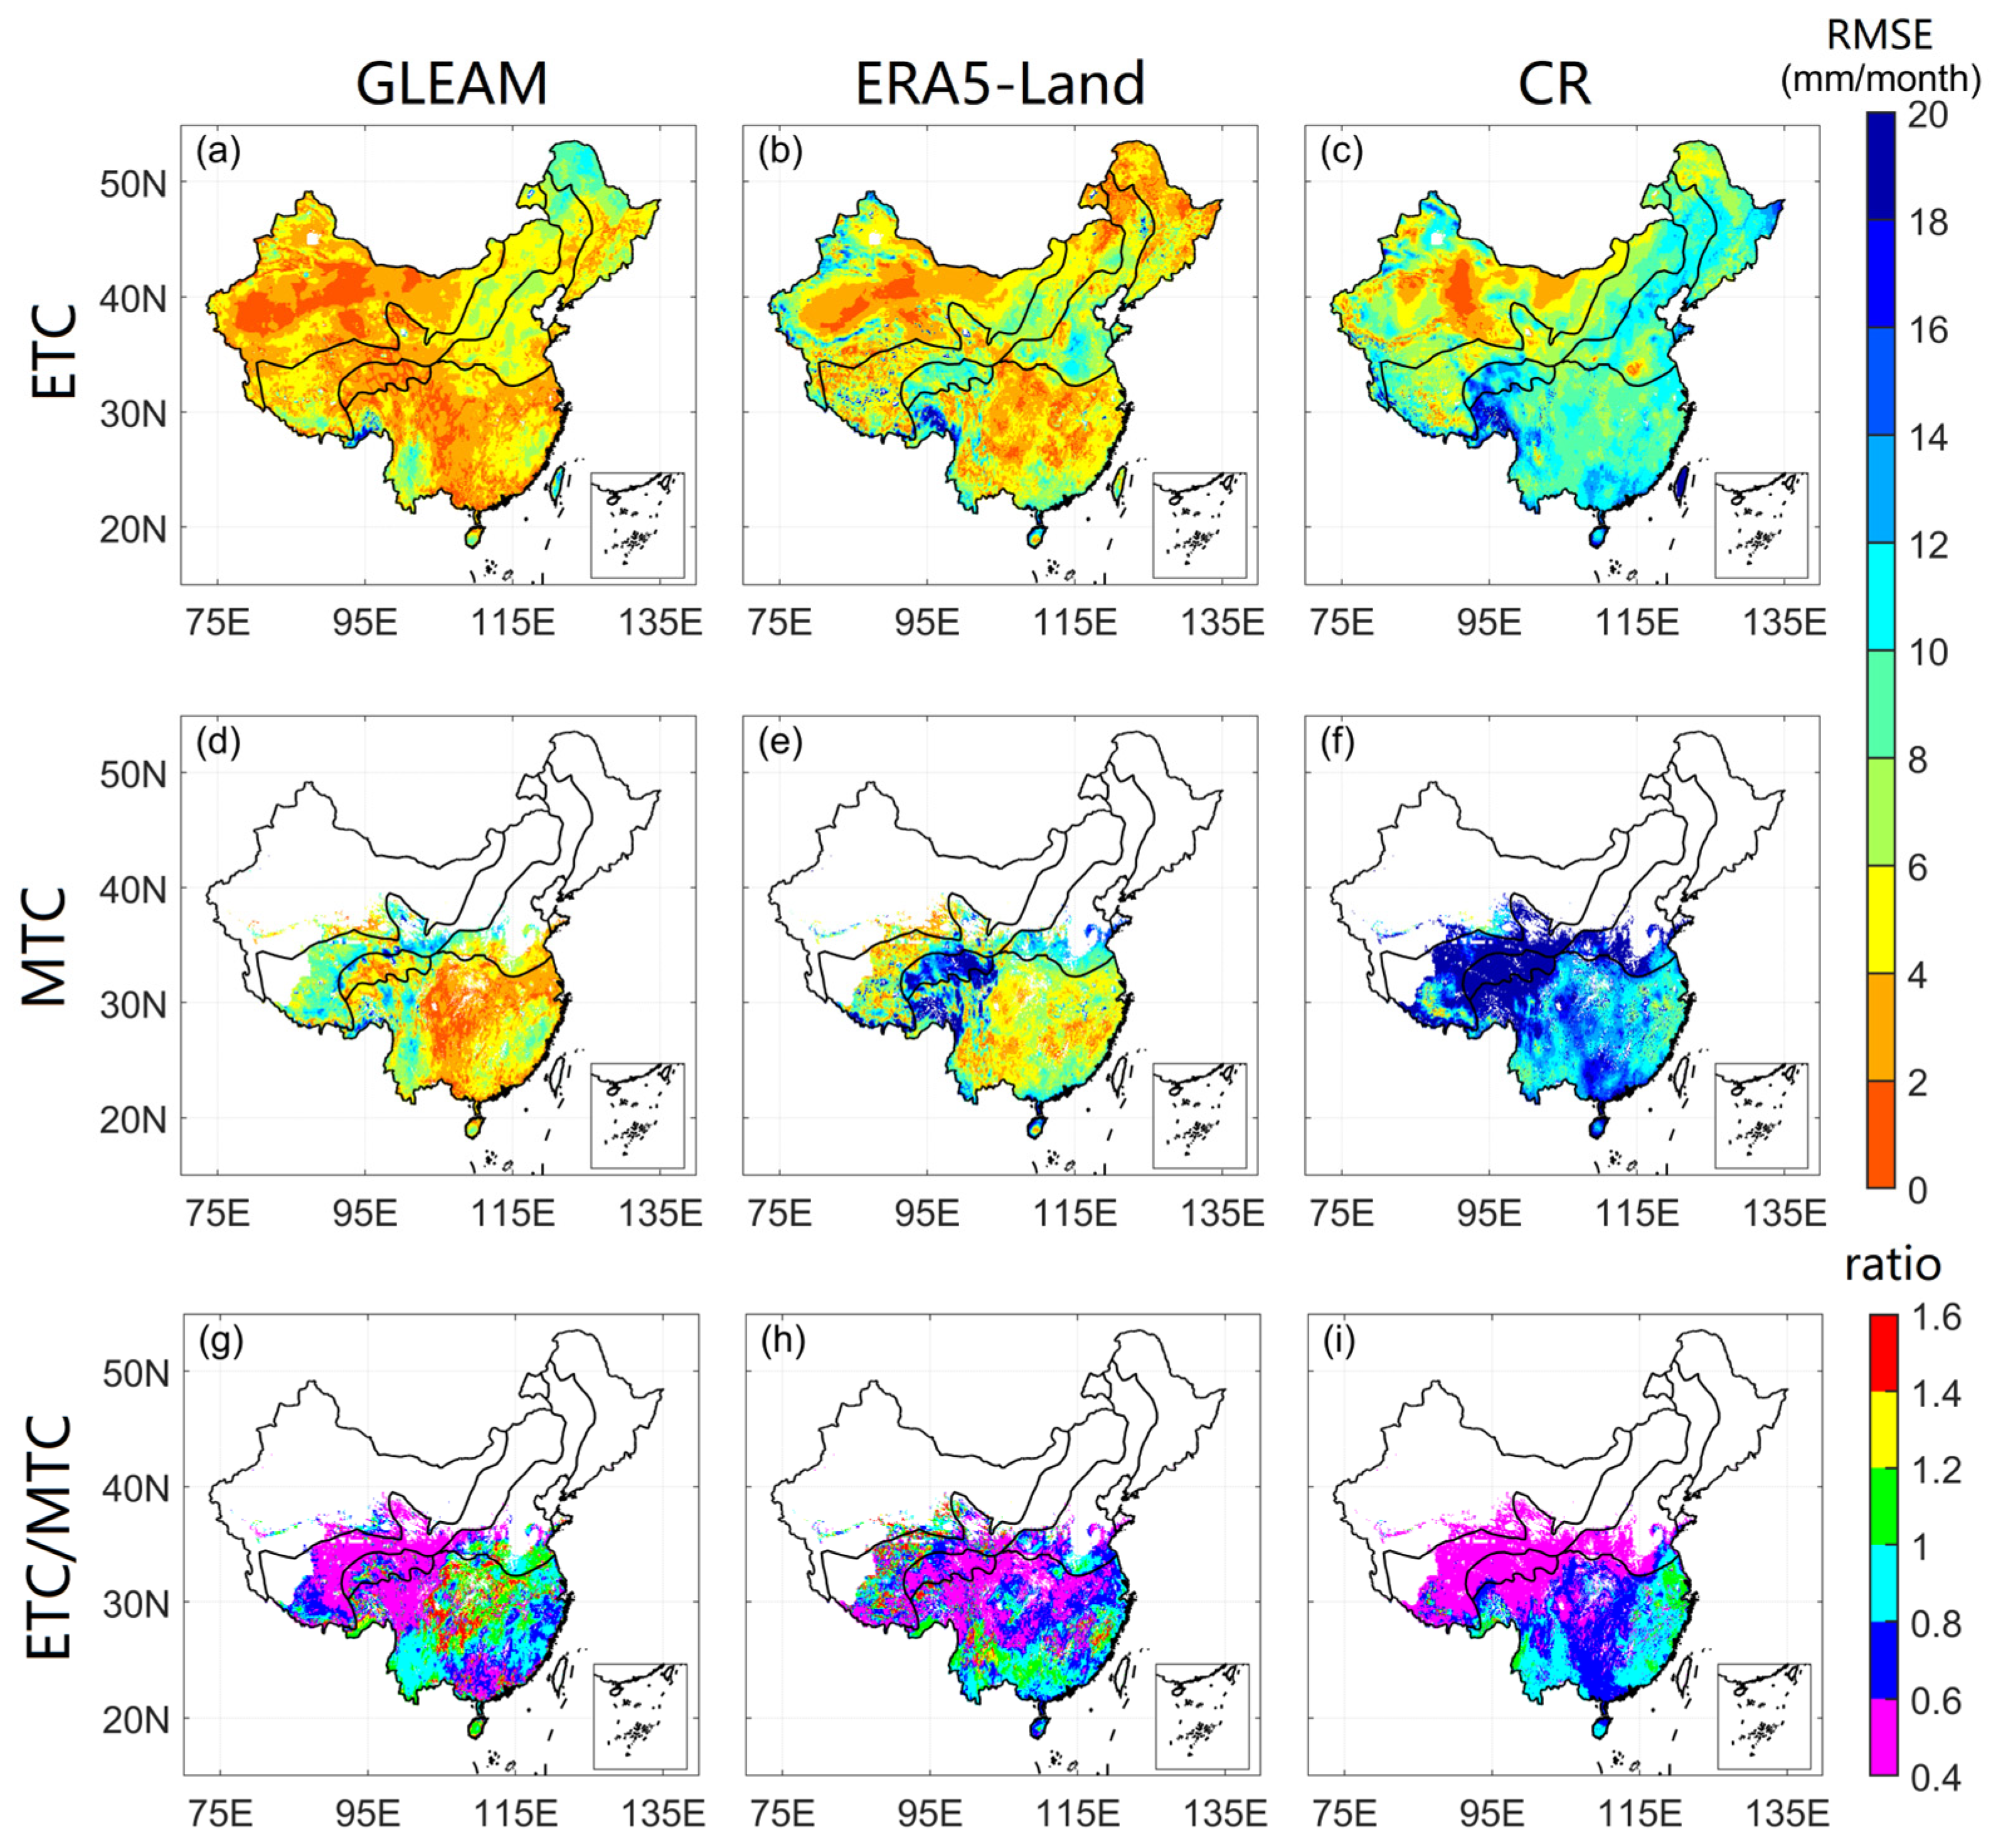
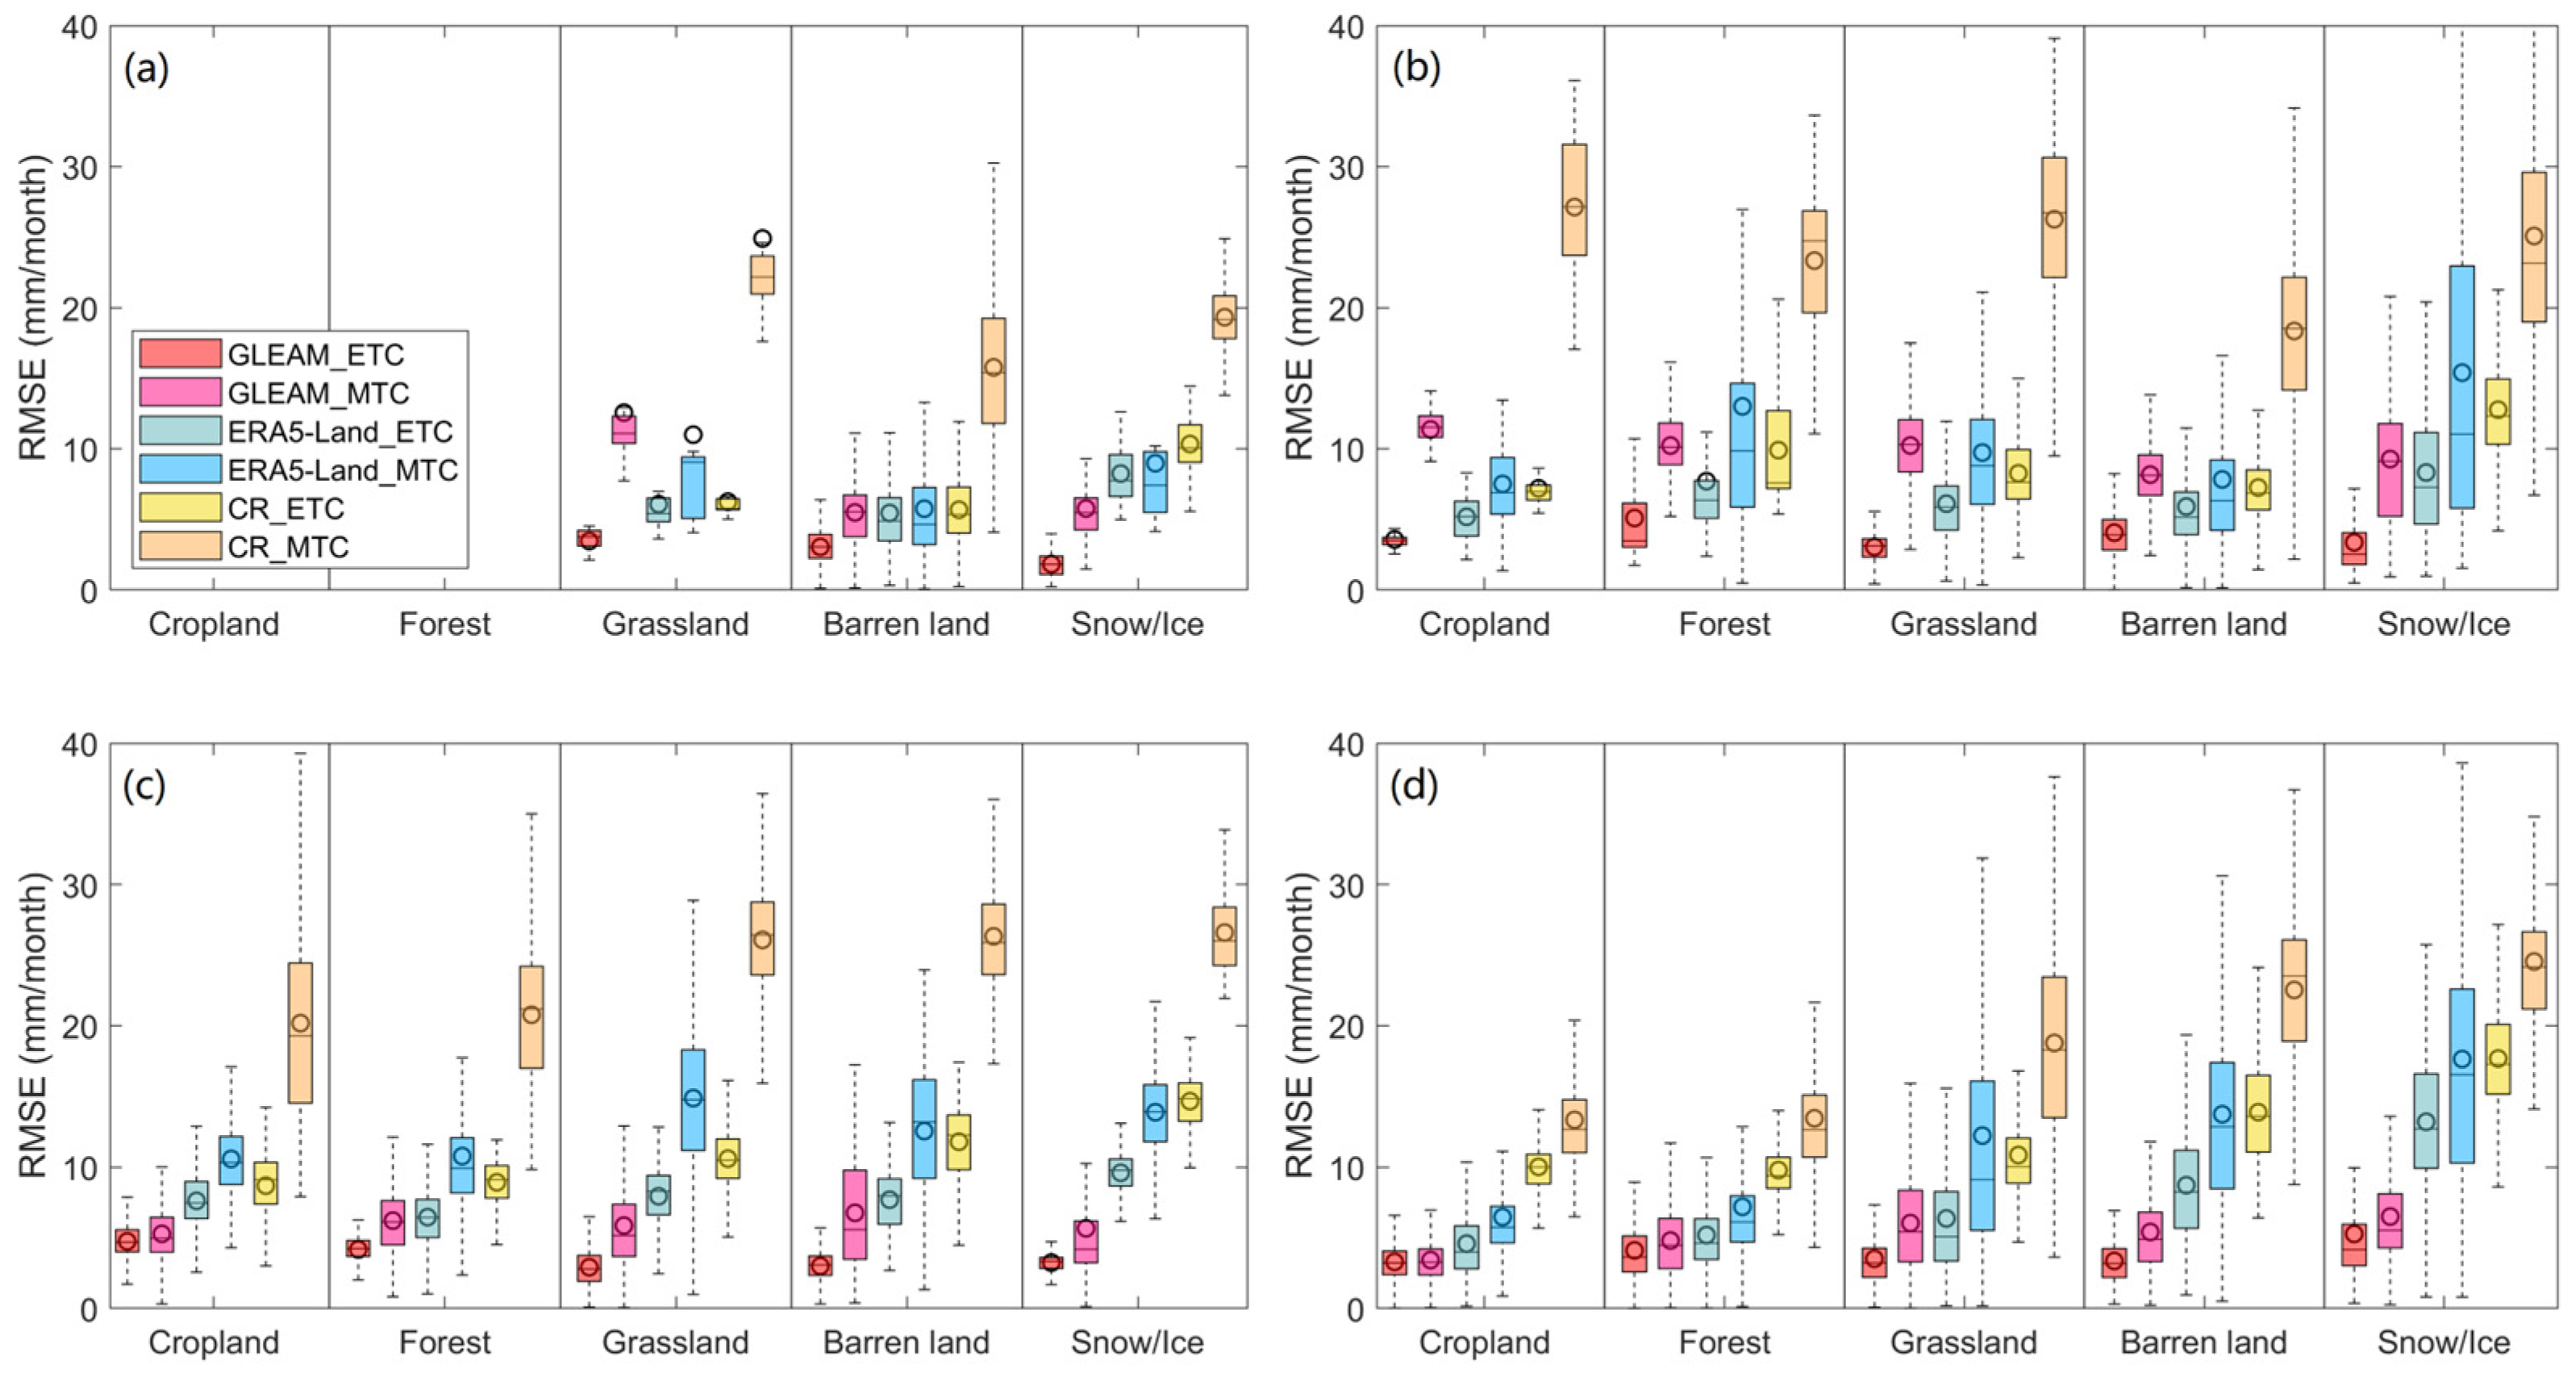
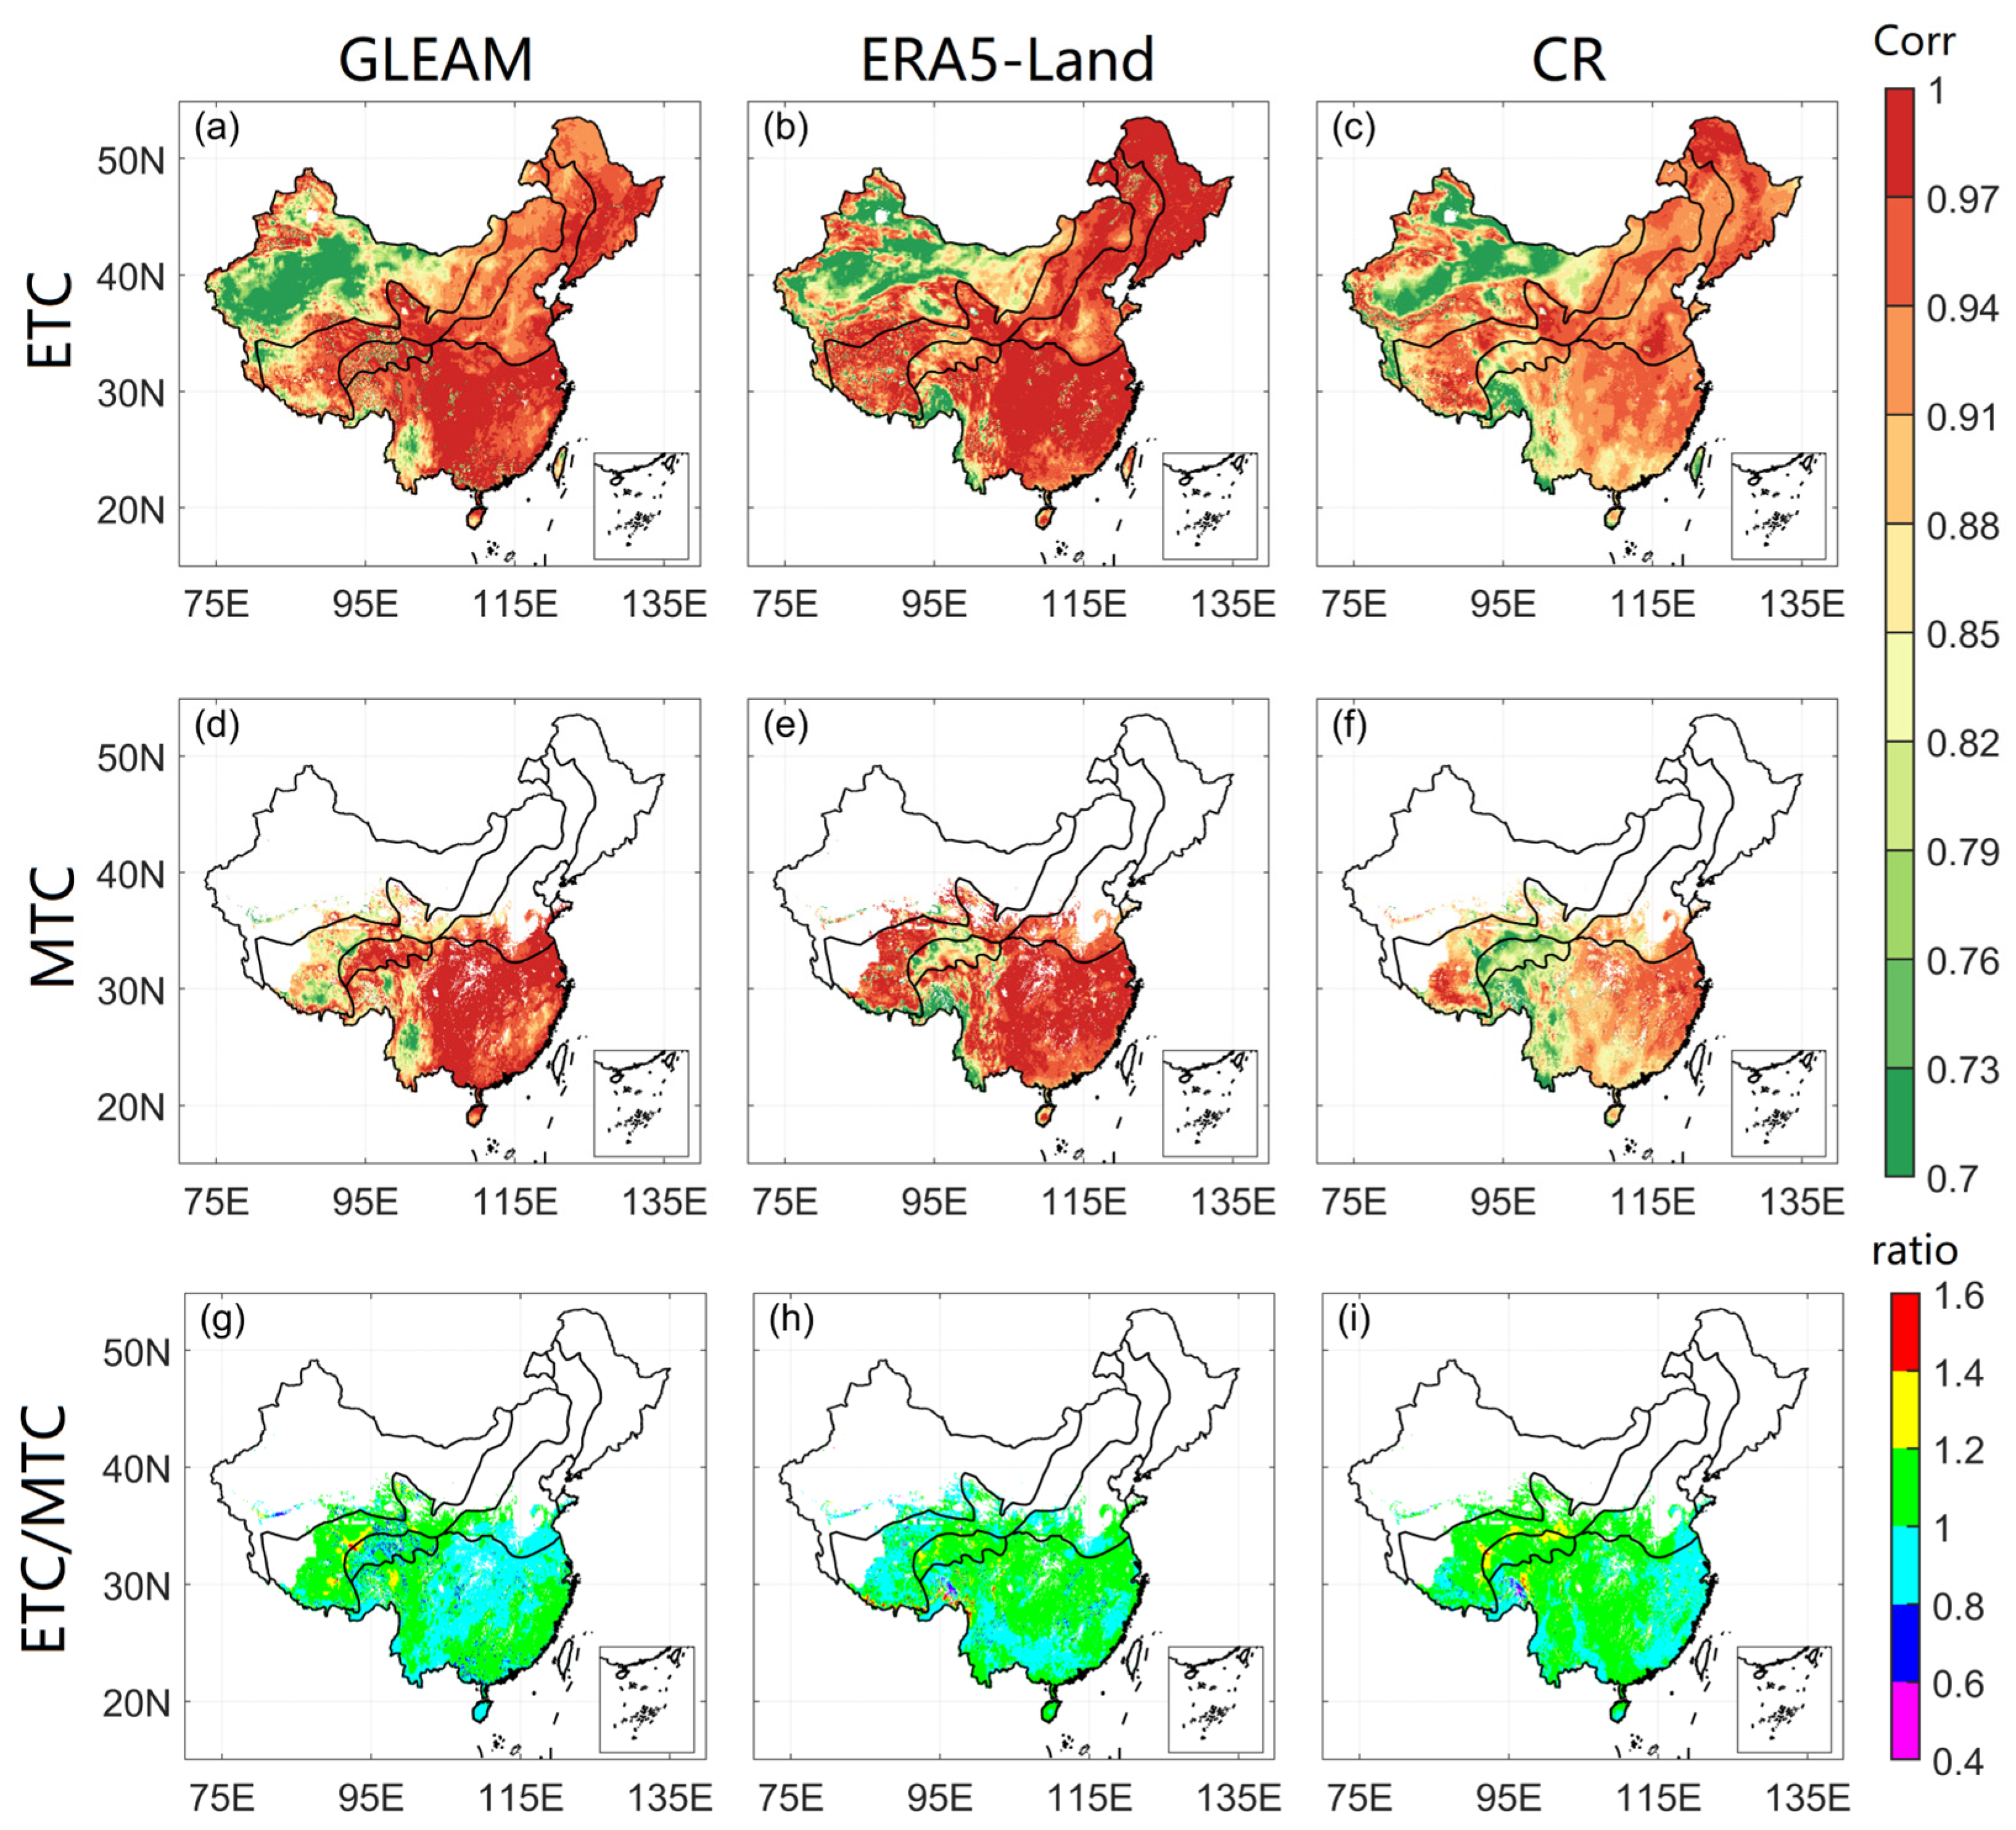
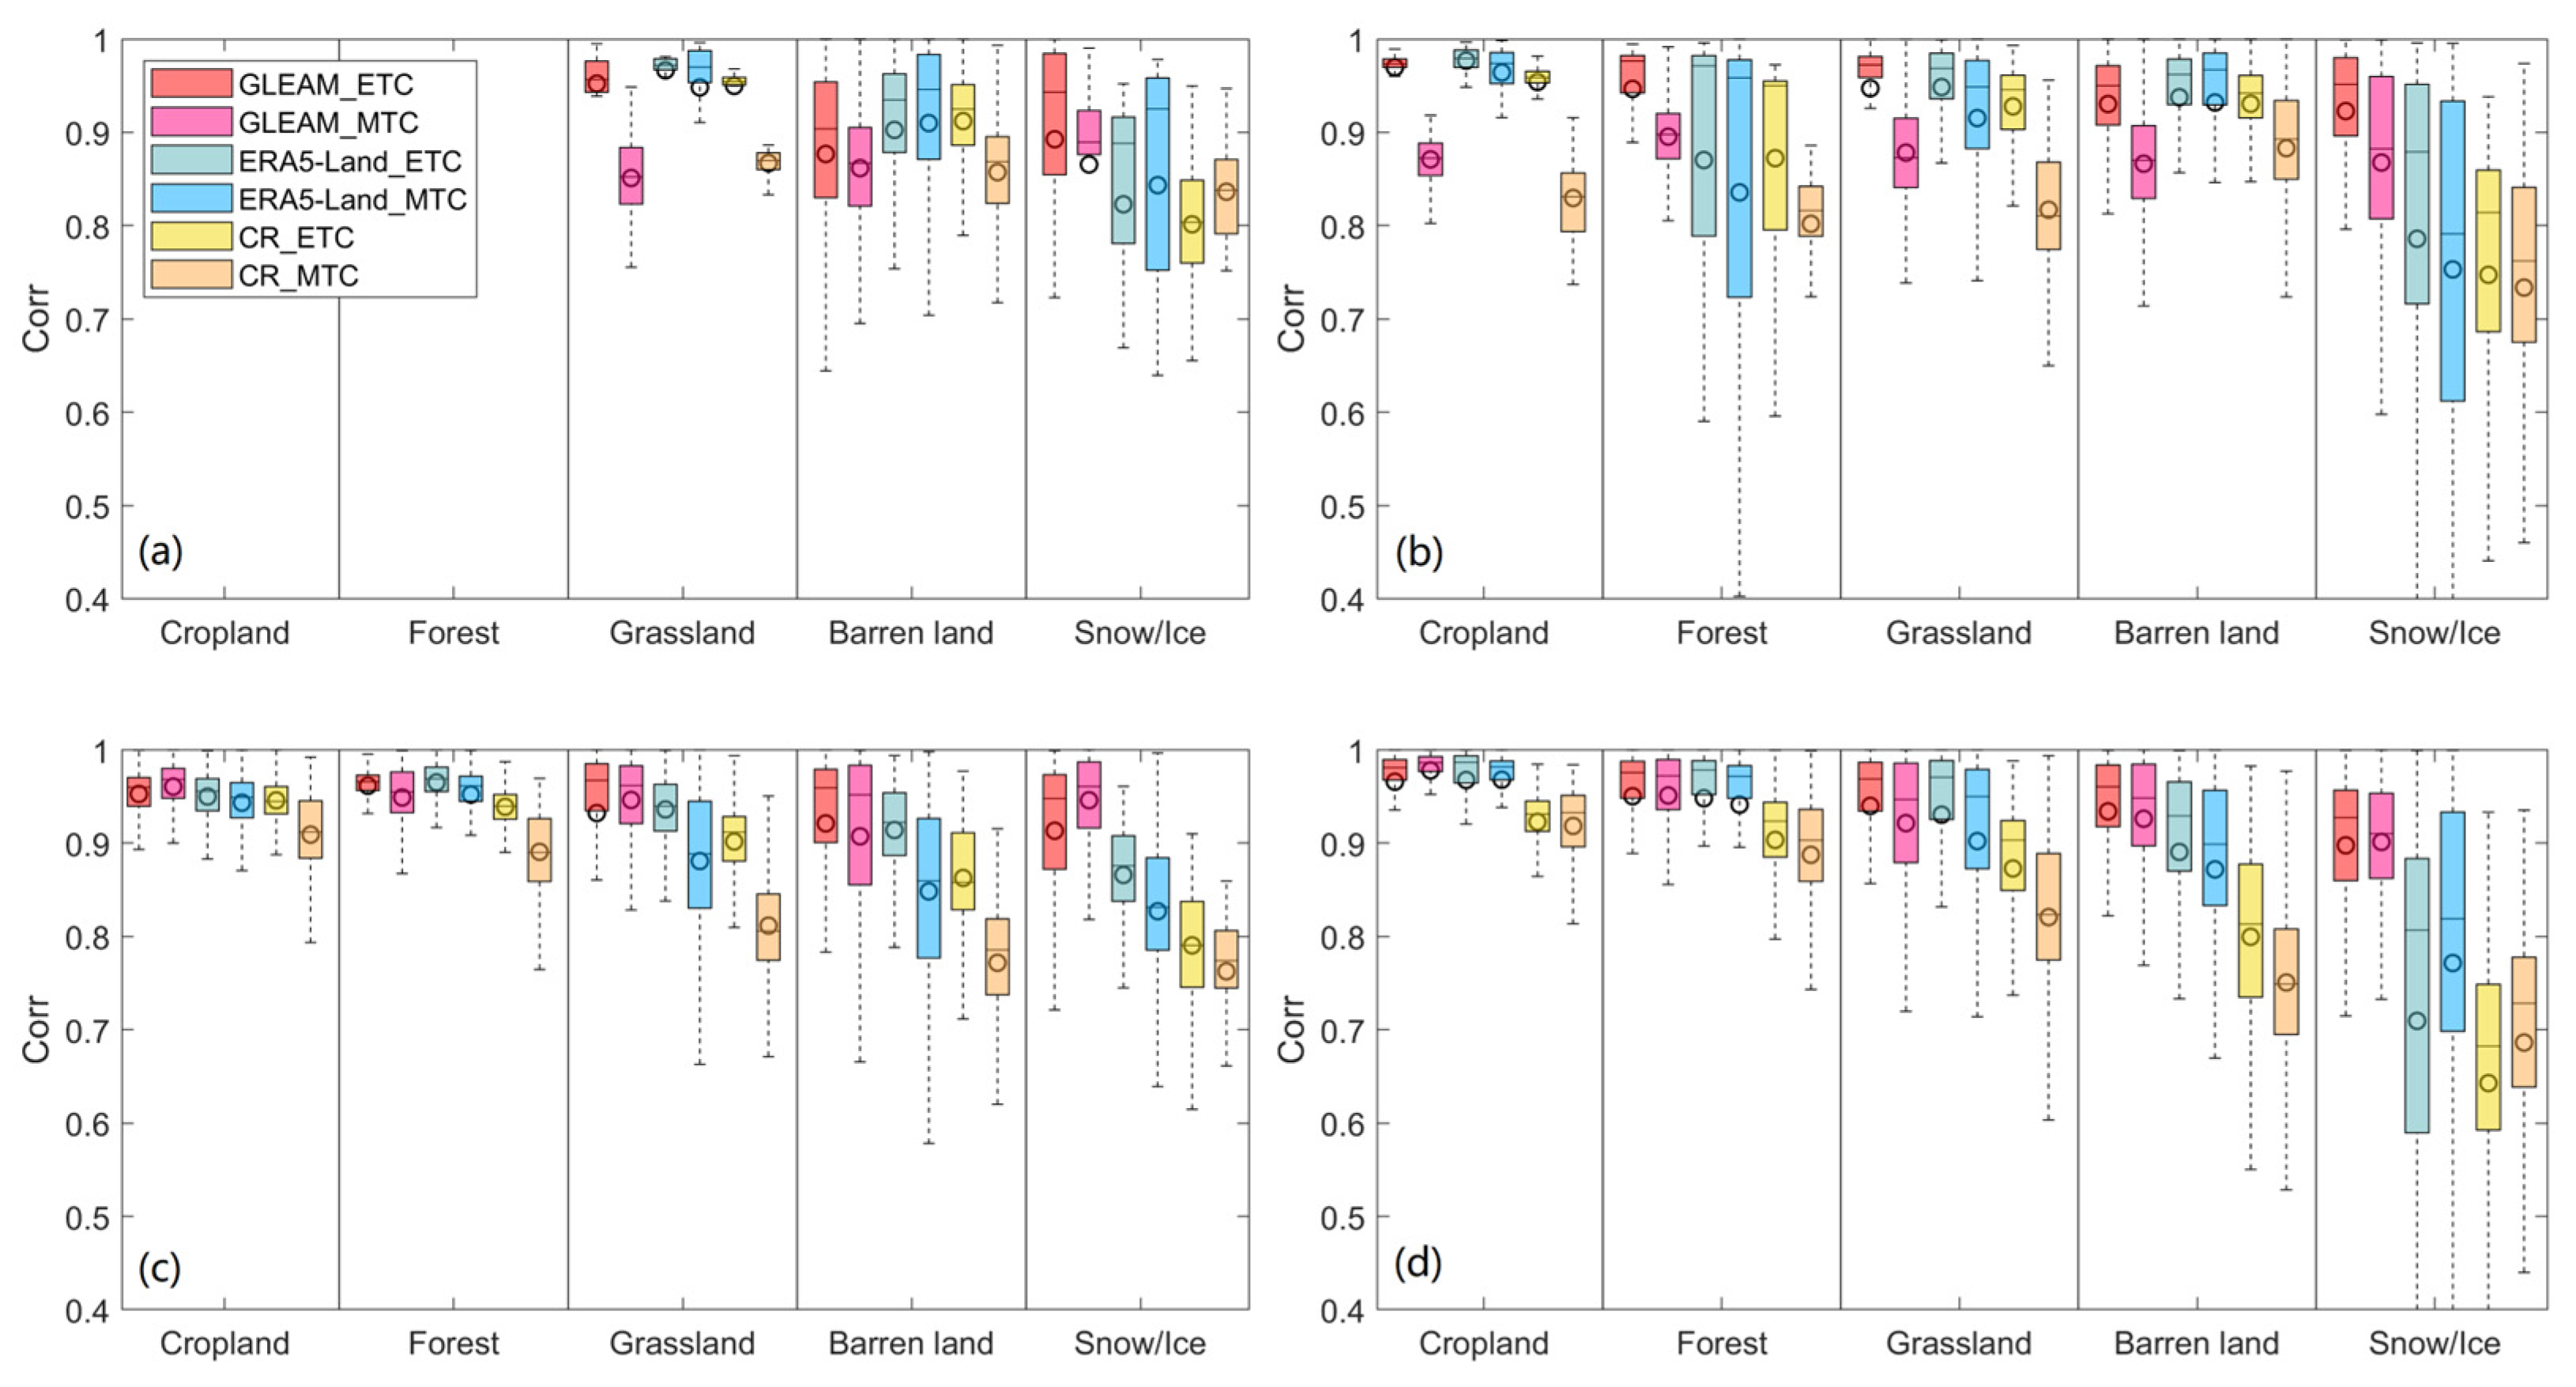
3.2. Uncertainties Analysis

Figure 4 depicts the spatial distributions of the RMSE estimated using ETC and MTC methods and the ratio of the RMSE from the ETC method to that from the MTC method for the three ET products. It is noted that almost all the grid cells conform to the original assumptions of zero-error correlations through the ETC method. However, approximately half of the number of grid cells using the MTC method offend the original assumptions, which mainly appear in the areas of middle and high latitudes (e.g., 35° N and north), including most areas of the arid zone, parts of the semi-arid zone and semi-humid zone. In the humid zone, most areas comply better with the original assumptions except for northeastern China. With the ETC method, three ET products present generally comparable spatial patterns of RMSE. The higher RMSEs mainly appear in southern and western humid regions, with values exceeding 10 mm/month. By contrast, the lower RMSEs are mainly founded in the central arid zone, where the values are less than 2 mm/month. For China as a whole, with the ETC method, GLEAM has higher similarity with ERA5-Land in both spatial feature and magnitude of RMSE (domain averaged RMSE values are 4.18 and 5.51 mm/month for GLEAM and ERA5-Land, respectively), while the RMSE values of CR are 8.39 mm/month, which are generally larger than GLEAM and ERA5-Land. With the MTC method, three ET products show significant differences in both spatial distribution and RMSE magnitude. For example, the higher RMSE values of GLEAM are mainly distributed in the western semi-arid, southwestern and southeastern humid zones, with values of nearly 12 mm/month. However, they mainly appear in western semi-humid in ERA5-Land and CR, with values above 20 mm/month. Due to the absence of grid cells violating original assumptions, the areally averaged RMSE values are 5.68, 8.78 and 16.85 mm/month, which is greater than that from the ETC method. Regarding the ratio of the RMSE values from the ETC method to that from the MTC method (Figure 4g,h), the better values (0.8~1.2) mainly exist in the southwestern humid zone for GLEAM, southern humid zone for ERA5-Land, and southwestern and southeastern humid zone for CR, which indicates that the ETC and MTC methods have fundamentally consistent performances in RMSE estimates over above regions. However, all three ET products show smaller ratio values (<0.4) in the south of the semi-humid and sumi-humid, especially in part of the Qinghai-Tibetan Plateau (QTP) region, revealing that the RMSE values derived from ETC are significantly less than that from MTC method. Additionally, only a few pixels with greater ratio values (>1.6) are scattered in the humid zone for three products. Therefore, the result indicates that the ETC method generally tends to yield a lower RMSE than the MTC method over the overlap regions, compared with the unknown truth value. Among the three ET collocated products, GLEAM performs best in most areas of China with lower RMSE, followed by ERA5-Land, and CR performs worst with higher RMSE.
To further explore the discrepancies between ETC-derived and MTC-derived RMSE under various land cover types, the boxplots of RMSE of monthly ET under cropland, forest, grassland, barren land, and snow/ice across four climate zones in China are illustrated in Figure 5. It should be noted that only the grid cells in overlap regions from the two methods are retained for comparison, while the boxplots of RMSE for the whole of China with the ETC method are given in Figure A1. Beyond that, there is no grid cell of cropland and forest located in arid zones; thereby, no associated statistical results are shown (Figure 5a). It can be seen that RMSE results differ with land cover types. In arid zones, barren land has lower RMSE values, while grassland and snow/ice have higher RMSE values. In the humid zone, cropland and forest have lower RMSE values than barren land and snow/ice. Additionally, as for the two methods (i.e., ETC or MTC), the performance in estimating RMSE for different ET products is various. For example, in a semi-arid zone, the ETC method tends to generate lower RMSE for GLEAM than that for ERA5-Land over cropland, grassland, and barren land, while the results are opposite with the MTC method. Moreover, the discrepancies between the two methods resulted from land cover types being more minor in the humid zone compared with other climate zones. Nevertheless, RMSE values estimated by the ETC method are generally lower than that by the MTC method under almost all land cover types, especially under cropland, grassland, and snow/ice. Minimal differences exist in barren land over the arid zone, which is likely to be explained by the scarcity of available water stored in the soil layer. Furthermore, it is noteworthy that the discrepancies between ETC-based and MTC-based RMSE gradually diminished from arid to humid zones. Among the three ET products, CR performs the prominent differences in RMSE estimated by ETC as well as the MTC method, followed by ERA5-Land, and GLEAM performs the smallest differences. It implied that GLEAM has relatively more stable and robust performance, and CR is more sensitive to the fusion method. Likewise, we also evaluated the correlation coefficient estimated through ETC and MTC methods, which are displayed in Figure 6 and Figure 7 and A2. Except for the grid cells violating original assumptions, both ETC and MTC methods estimate higher Corr values, with most of the values greater than 0.90. The higher Corr values occur in the central and eastern regions of the humid zone. However, lower Corr values are mainly distributed over the western arid zone and the western humid zone. For the ratio of Corr, all intersection areas from the two methods present better values of 0.8–1.2, indicating ETC has a similar performance in estimating Corr to the MTC method. In terms of land cover types, RMSE values estimated by the two methods have comparable performance under cropland, forest, and grassland with high values above 0.8, while poor performance occurs in barren land and snow/ice. Overall, the differences between Corr derived from the ETC and MTC methods are smaller than those of RMSE values over various climate zones and land cover types.

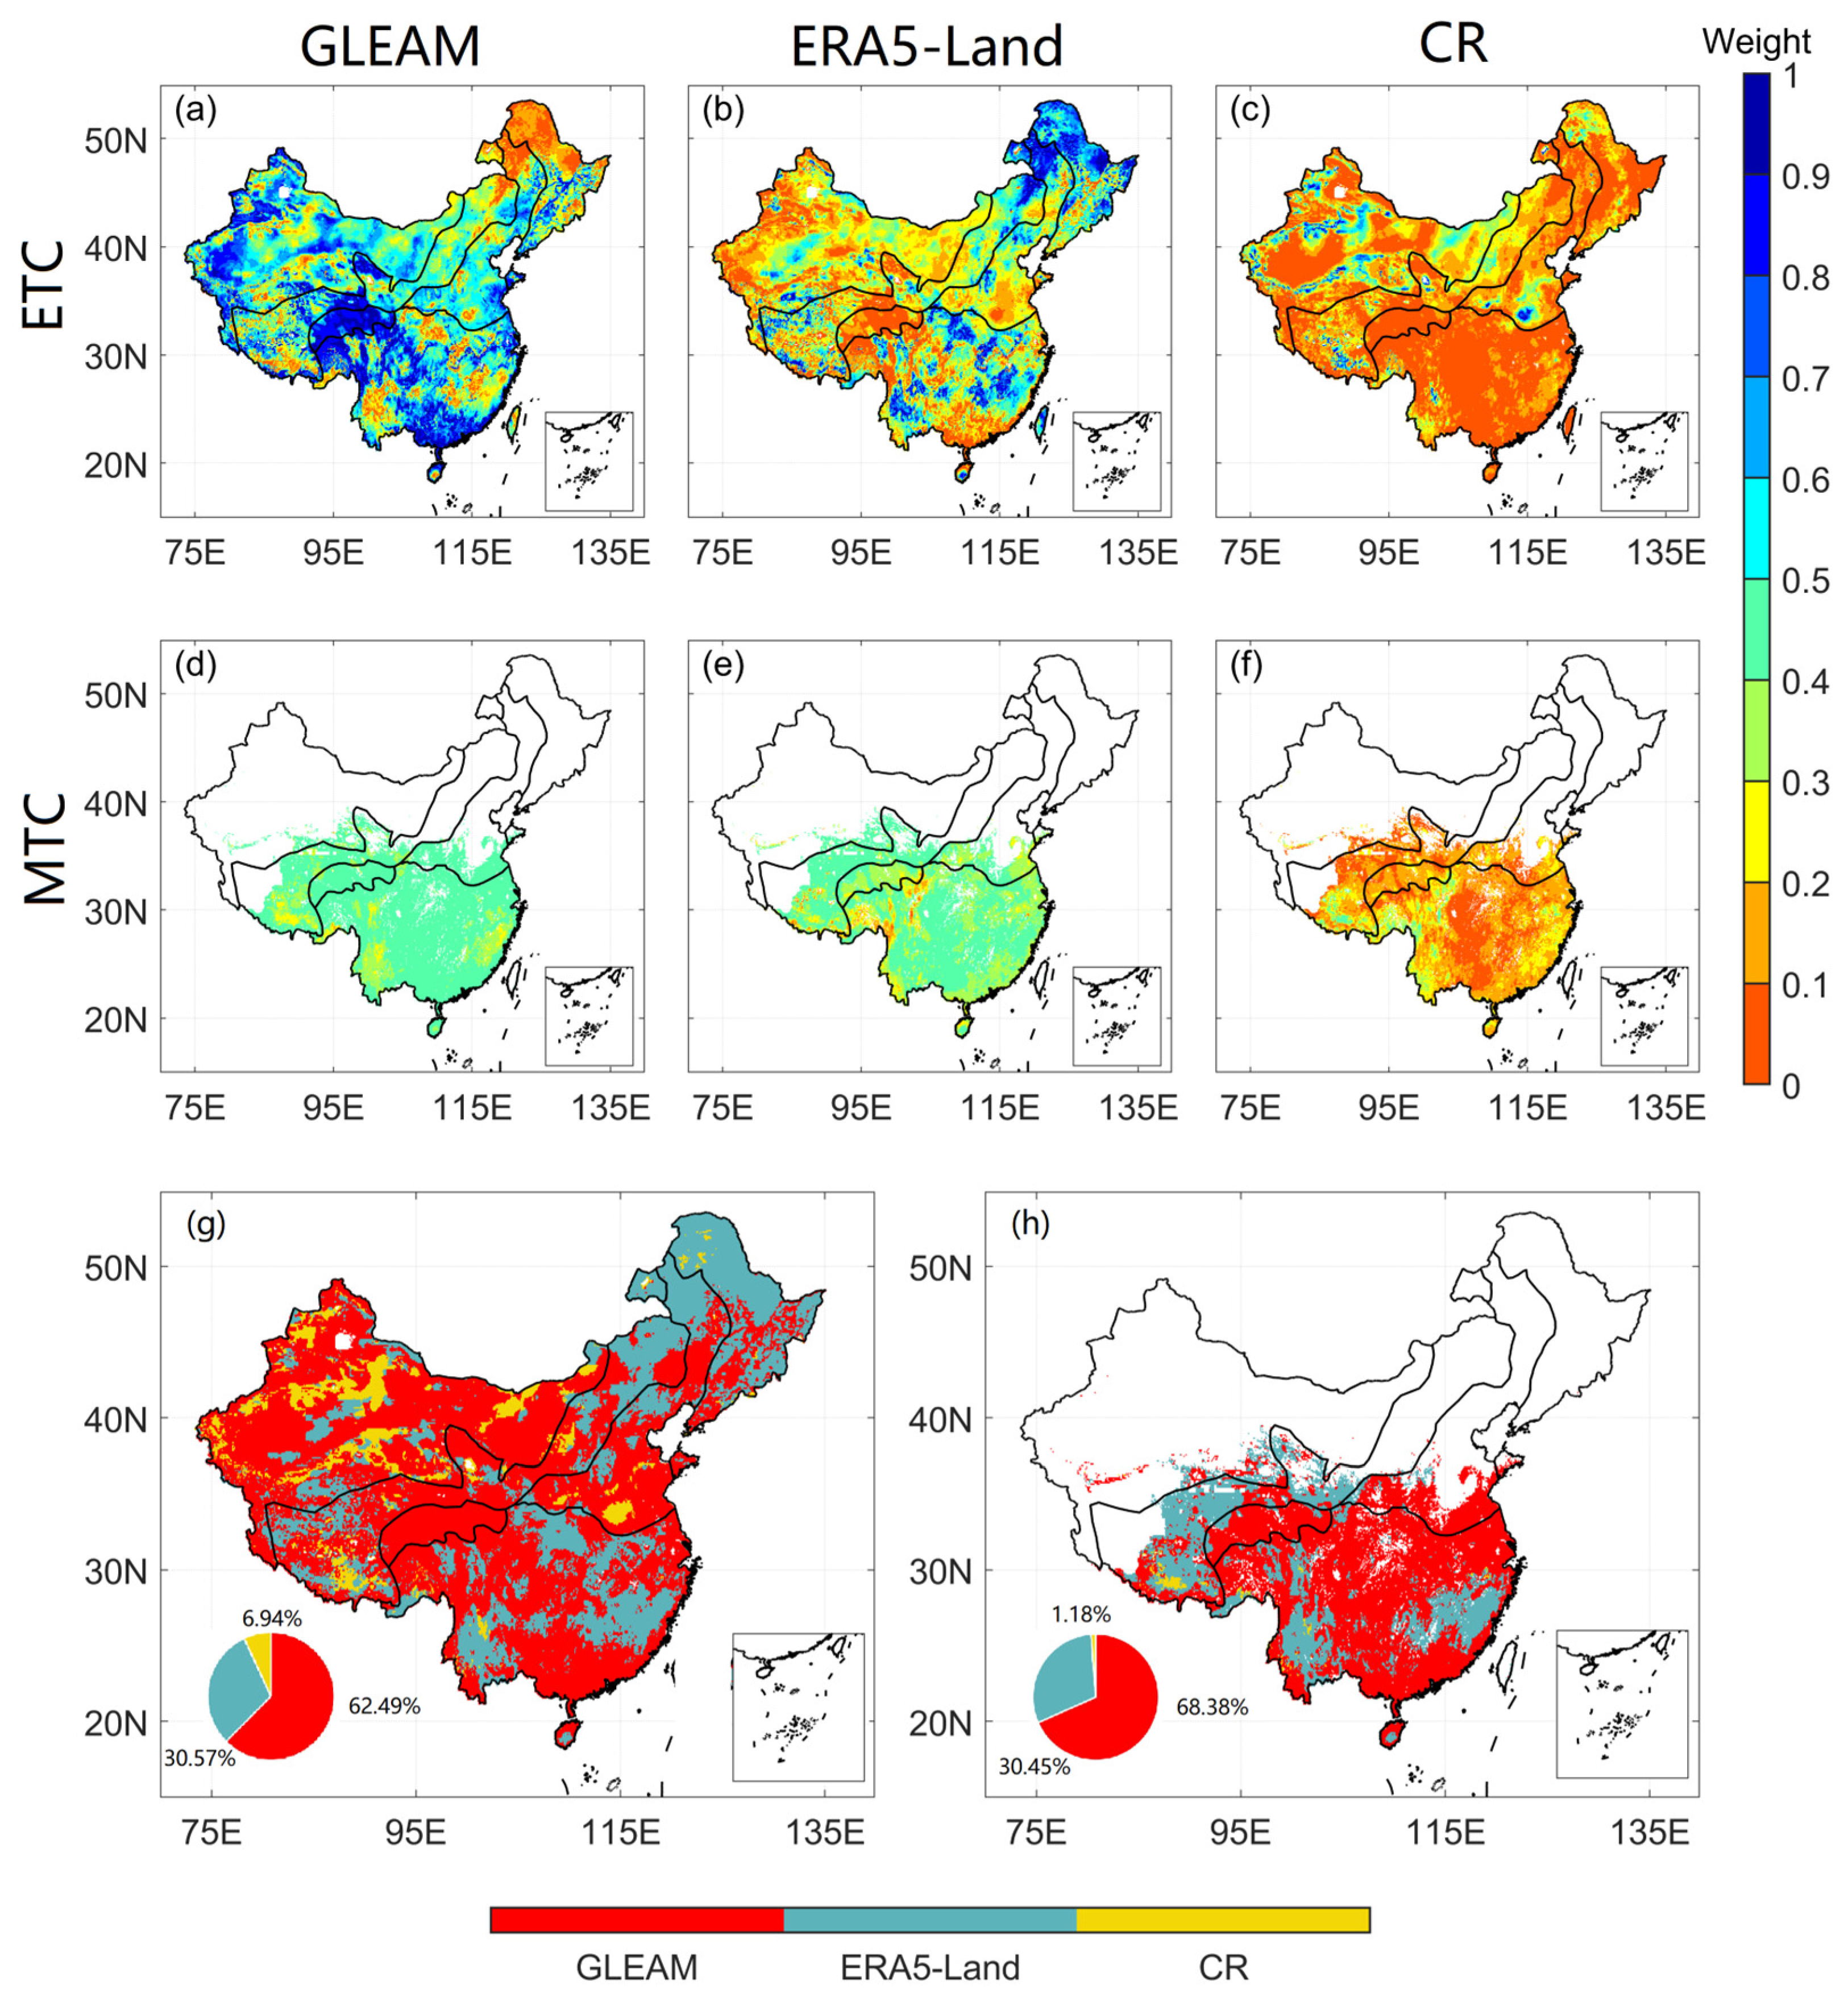
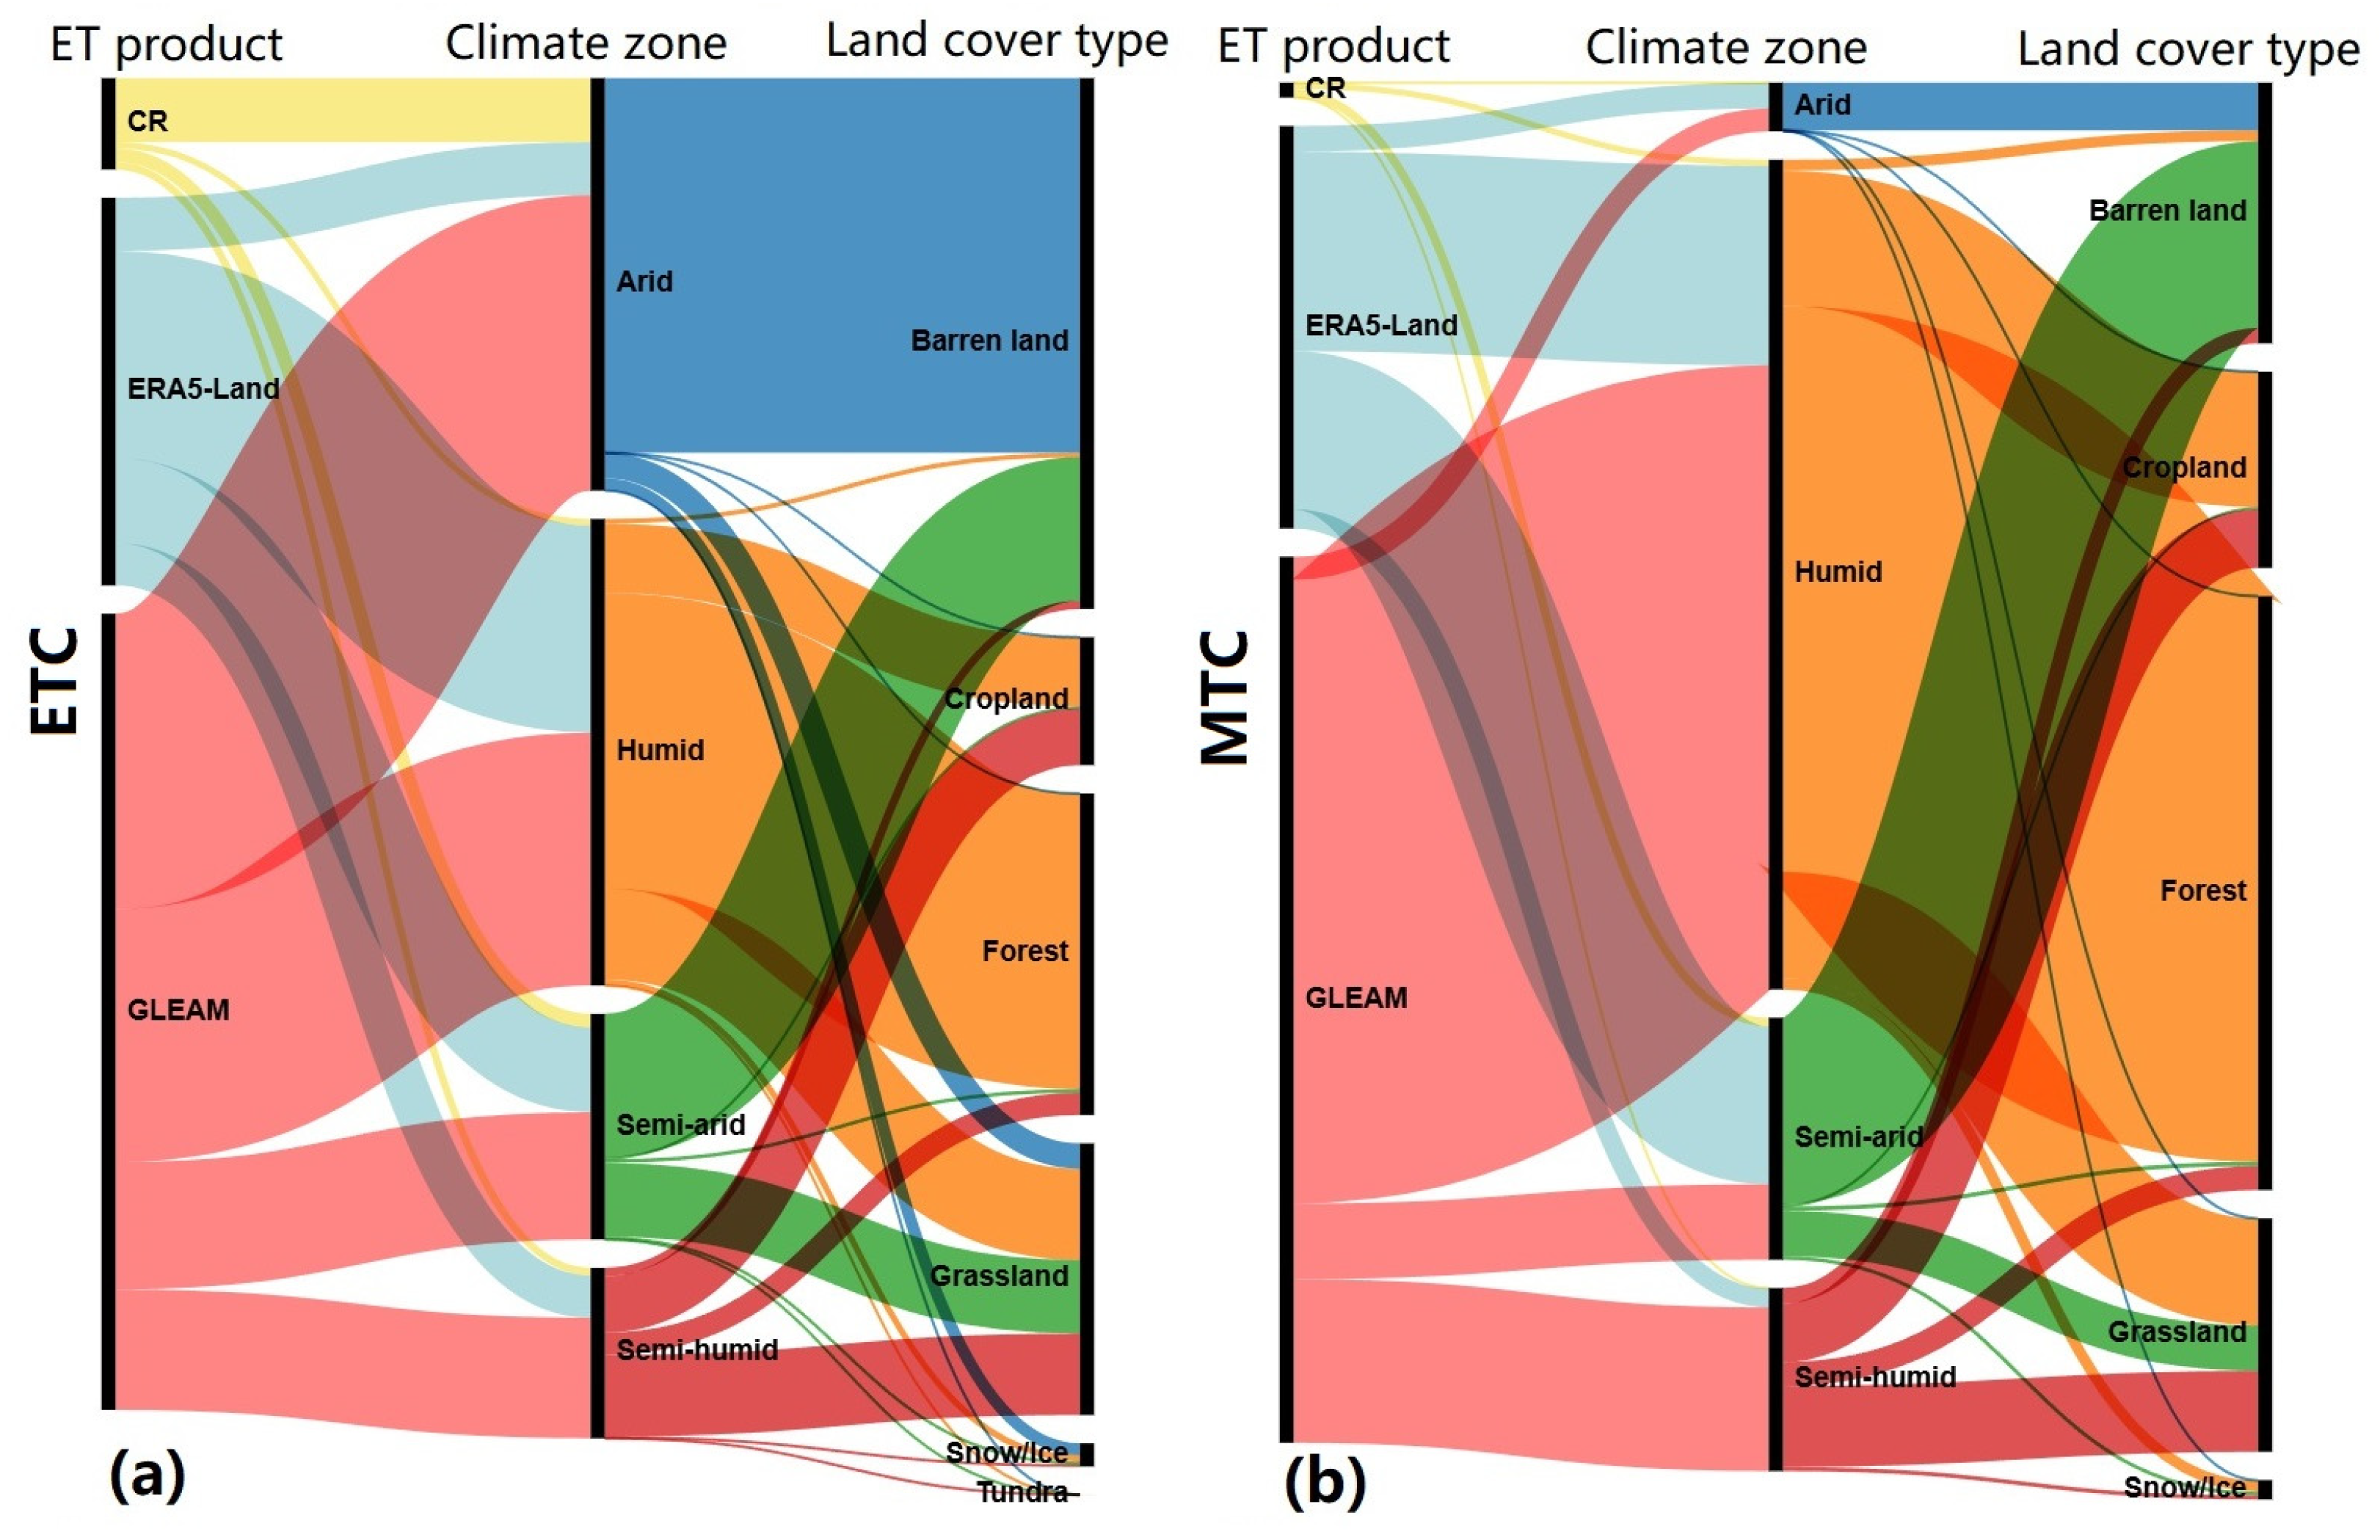
3.3. Weight Analysis

As mentioned in the method part, we can obtain the merging weights of the three ET products based on RMSE. Figure 8 illustrates the spatial distributions of weights of three ET products and the best ET products for every grid cell derived from the ETC and MTC methods. For the ETC method, it can be observed that GLEAM has larger weights than that from ERA5-Land and CR over most regions, with weight values above 0.6 (Figure 8a–c). The significantly larger weights are mainly located in the western arid zone, semi-humid zone, and western and southern humid zone, where the weight values are close to 1. In comparison, ERA5-Land has larger weights over northeast China and part areas of the southern humid zone. As for CR, most areas have smaller weights (<0.1), except for a small part of North China Plain in semi-humid. Different from the ETC method, the MTC method estimates concentrated weight values, and the range between the minimum and maximum values is only about 0.3 (Figure 8d–f). In addition, it is noteworthy that GLEAM has very similar weights to ERA5-Land in both spatial patterns and magnitudes, and both two products present similar weights (approximately 0.4), while CR yields smaller weights over most areas, which is consistent with that from the ETC method. By the principle of maximum weight, we selected the best ET product for every pixel. As shown in Figure 8g,h, GLEAM has the best performance in most regions, taking up 62.49% for ETC and 68.38% for the MTC method. At the same time, ERA5-Land performs well in northeastern China, southwestern humid zone (e.g., Yunnan province), southeastern humid zone (e.g., Jiangsu province and Fujian province), with area proportion of 30.57% for ETC and 30.45% for MTC method. CR product performs well only in several dispersed regions (e.g., the northwest desert region, southern of QTP and north China Plain), occupying 6.94% and 1.18% of the domain for ETC and MTC, respectively.
To further quantitatively investigate the characteristics of the best ET product, the climate zone and land cover type sources of the best ET product derived from the ETC and MTC methods are exhibited in Figure 9. From the perspective of ET products, in ETC, GLEAM mainly performs better in arid zone and humid zone, with proportion values of 37.09% and 31.78%, respectively, while the semi-arid zone and semi-humid zone share the rest proportion, with values of 15.99% and 15.14%. ERA5-Land achieves superior performance in humid zone, with a greater proportion value of 53.47%, and CR performs well in arid zone, with a proportion value of 70.01%. In MTC, GLEAM has comparable performance with ETC over humid zone and semi-humid zone, but with smaller percents over arid zone and semi-humid zone. In terms of climate zone, all four climate regions include a greater number of grid cells stemming from GLEAM within the ETC method. However, only humid zone and semi-humid zone have comparable partition results with ETC. In arid zone and semi-arid zone, ERA5-Land takes up the dominant position, which may be explained that most of grid cells, located in arid zone and semi-arid zone, violate the original assumption of TC-based method, and only a few grid cells remain when using the MTC method. From the viewpoint of land cover type, the ETC method performs well over barren land, since most areas of barren land are distributed in arid zone and semi-arid zone, where MTC are ineffective. For forest and cropland, mainly located in humid zone, both ETC and MTC methods can estimate RMSE and show comparable performances. Additionally, despite snow/ice accounts only for a relatively less part of mainland, both of the two methods are still capable. Besides, it should be noted that the tundra grid cells without changes are outside the applicability scope of the MTC method and, thus, are not shown in the MTC method.

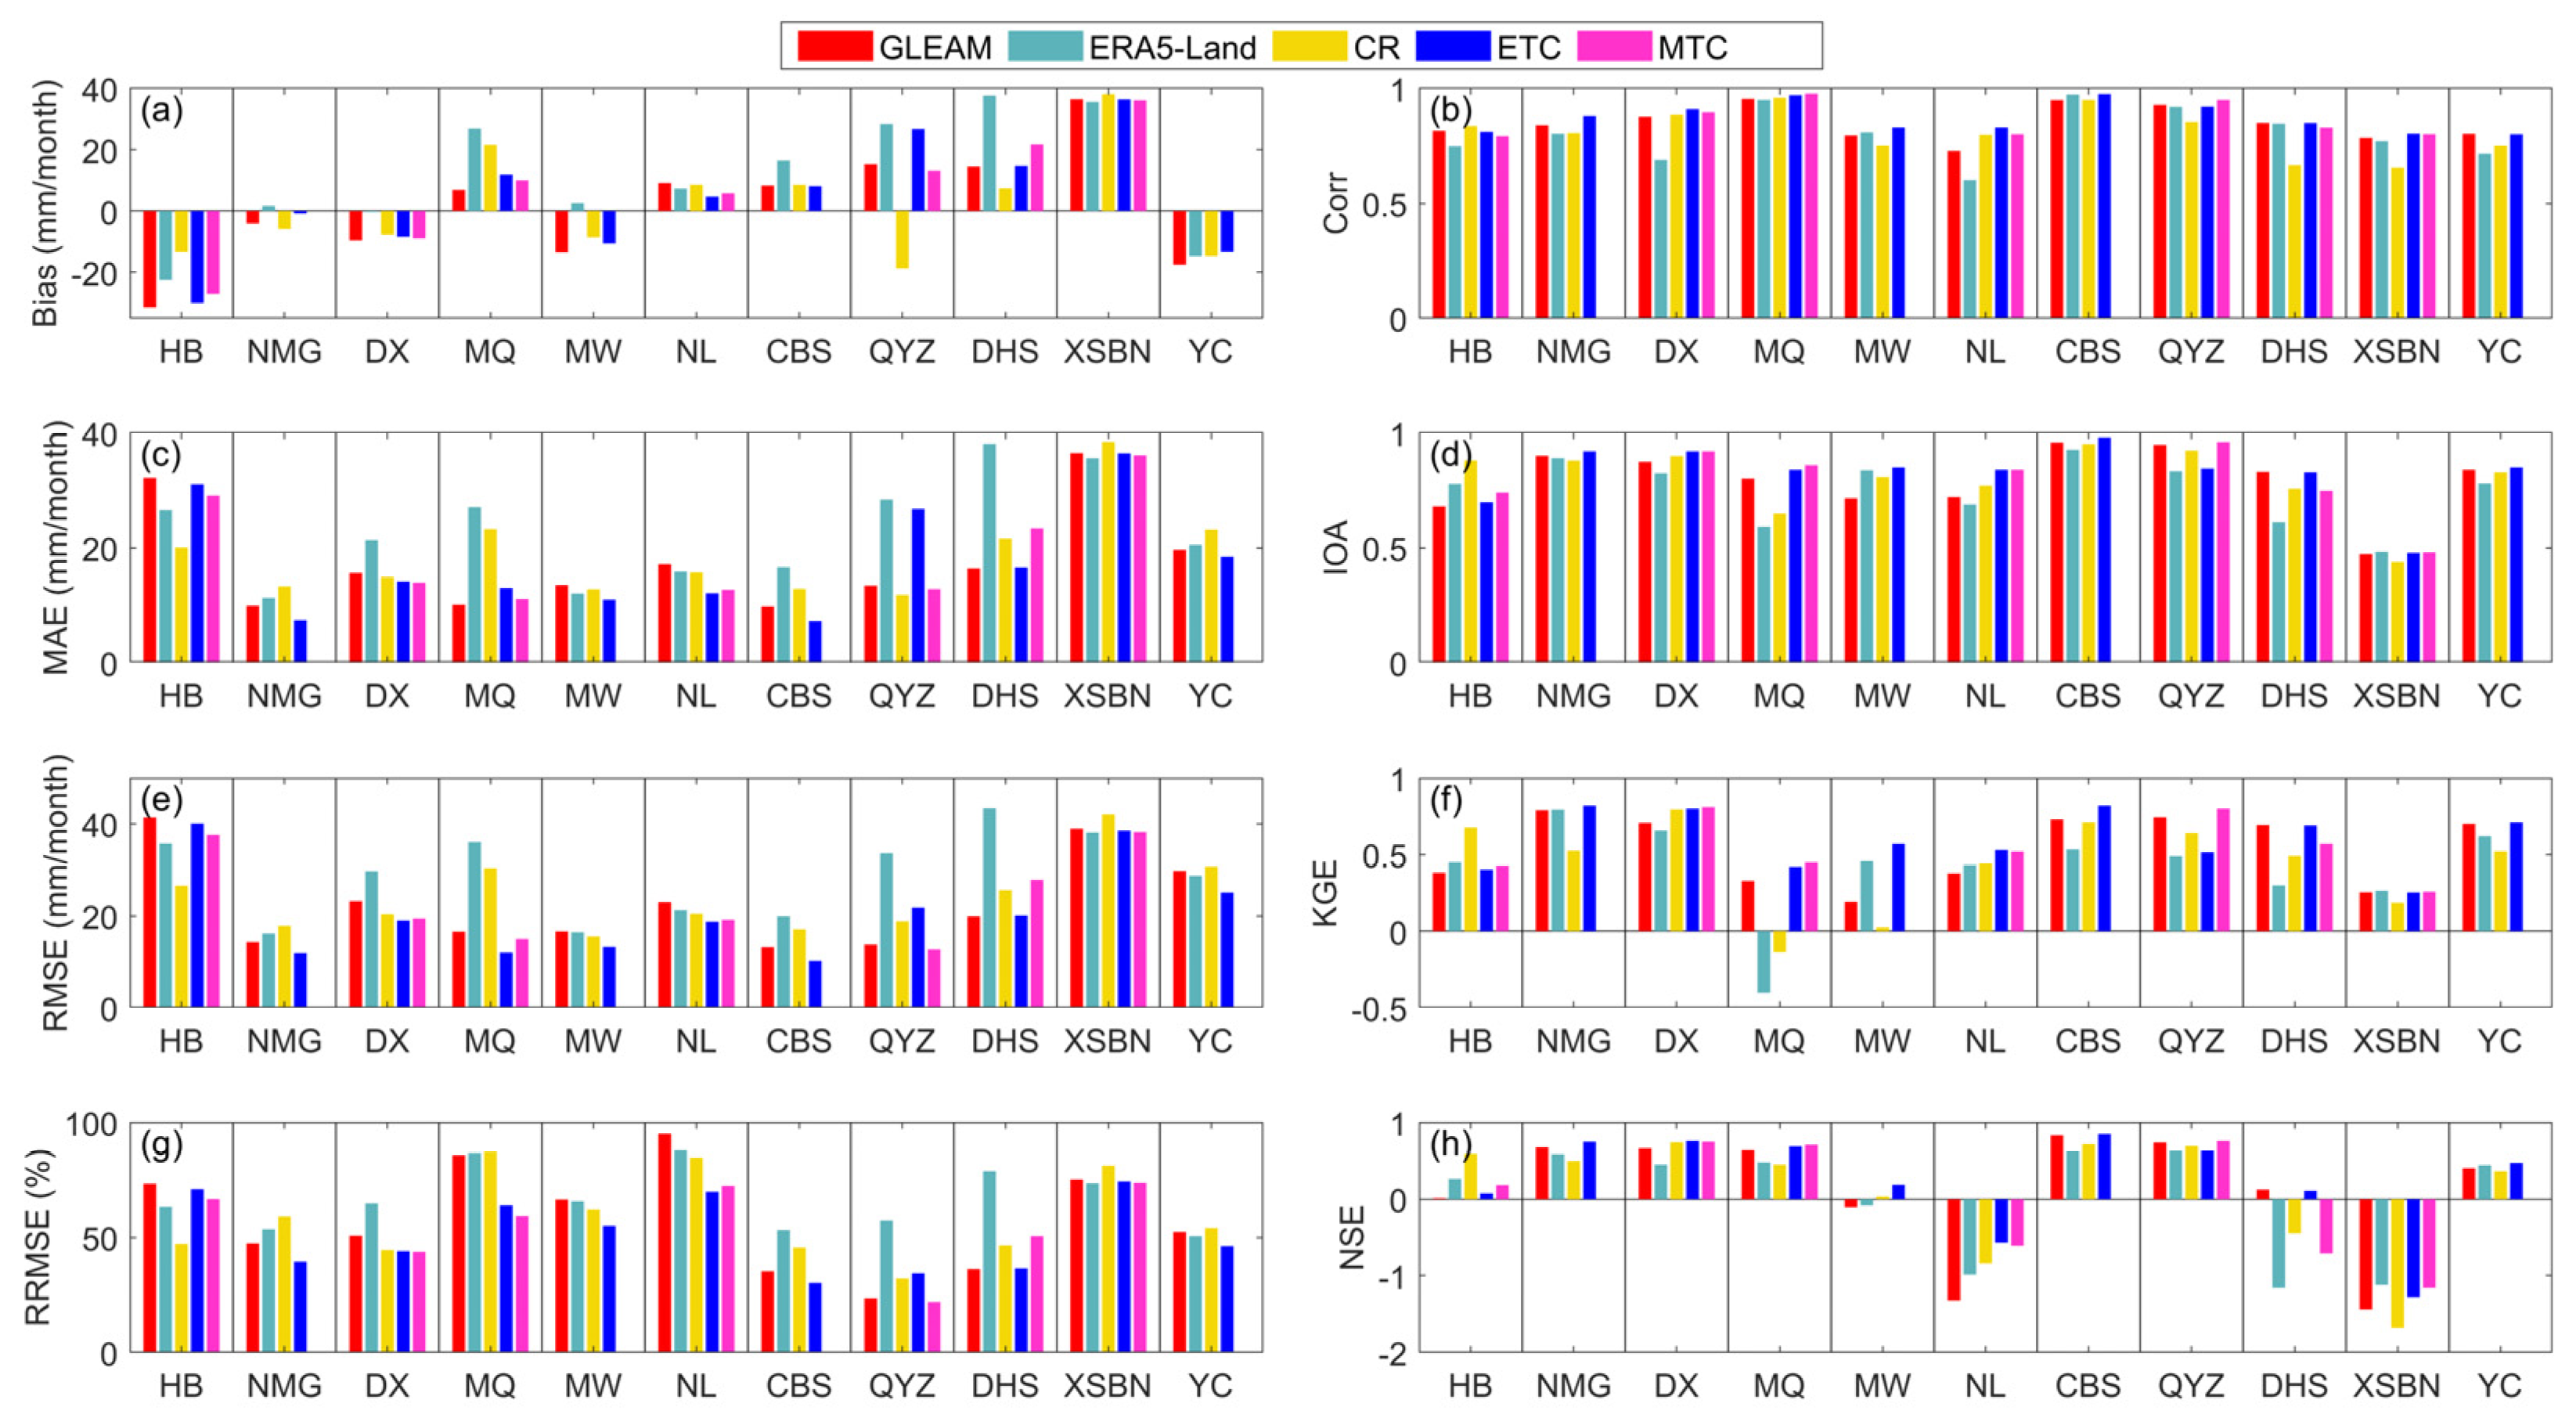
3.4. Assessment with Site-Based Observation Data

In this study, we employed ET measurements from 11 flux tower sites to explore the performances of ETC and MTC methods in ET fusion. The ET observation data from tower sites were not considered input for ETC and MTC to allow independent assessment of individual ET products (i.e., GLEAM, ERA5-Land and CR) and merged ET (ETC and MTC) estimates, and the statistical performances were illustrated in Figure 10. It should be noted that the statistical analysis was conducted based on the periods of in situ data, which could vary with sites. The amount of site data ranged from three years (36 months) to eight years (96 months), and the statistical metrics were the average of the specific periods at each site. Notably, due to the violation of assumption with the MTC method, four sites, including NMG, MA, CBS and YC sites, have no statistical results for them within MTC. In Figure 10, both ETC and MTC have improvement effectiveness varying with sites. For instance, at the DX site, ETC and MTC yield a substantial improvement in Corr, KGE, and NSE when compared against ERA5-Land (Corr from 0.69 to 0.91 and 0.90, KGE from 0.66 to 0.80 and 0.81, and NSE from 0.45 to 0.76 and 0.75, respectively). At the CBS site, although the original collocated ET products have outstanding performance, they can still be further improved by the ETC method. The Corr values of GLEAM, ERA5-Land, and CR at the CBS site are 0.95, 0.97 and 0.95, respectively, which are modified to 0.98 with the ETC method. Beyond that, the NSE values are elevated from 0.83 (GLEAM), 0.62 (ERA5-Land) and 0.72 (CR) to 0.85 (ETC), and the IOA values are improved from 0.96 (GLEAM), 0.93 (ERA5-Land) and 0.95 (CR) to 0.98 (ETC), respectively, indicating that merged ET estimates showed more similar temporal behavior to station-based measurements compared to the original ET product. Regarding Bias, MAE, RMSE, and RRMSE, both ETC and MTC generally achieve superior statistical performances than individual ET products. However, the effectiveness of merged ET may be diminished by systematic underestimation or overestimation. For example, there are entire underestimations for all three original ET products existing at the HB site, resulting in lower merged ET values stemming from the weighting scheme. Therefore, the effectiveness and promotion of ET fusion is limited. In addition, the opposite behaviors appear at the XSBN sites, where the general overestimation can be observed in all three original ET products, which leads to the negative NSE values of merged ET. The magnitudes of the MAE values for ETC and MTC (36.45 and 36.13 mm/month) are even larger than that of the ERA5-Land (35.61 mm/month), and the NSE value for ETC and MTC (−1.28 and −1.16) is smaller than that of the original ERA5-Land (−1.12). Moreover, the fusion effectiveness can be impacted by the weight factors to varying degrees. At the DHS site, the excellent performance comes from GLEAM, which is captured by both the ETC and MTC methods as the dominant ET product with merged weights of 0.60 and 0.45, respectively. As a consequence, merged ET shows higher Corr (0.85 and 0.84), IOA (0.83 and 0.82), and KGE (0.69 and 0.68) for ETC and MTC methods, respectively. However, not all sites’ best performance can be detected by the ETC method. For instance, at the YC site, where there is cropland, ERA5-Land presents a more prominent performance, with a bias of −4.8 mm/month, IOA of 0.84 and KGE of 0.70, but ETC gives the highest weight to GLEAM, which causes the discounted merged effectiveness (the bias is −13.4 mm/month, IOA is 0.83 and KGE is 0.67). Furthermore, owing to the breach of the original assumption, the MTC method cannot achieve merged ET at the YC site. In summary, comparing the two methods, ETC performs better than MTC at 8 of 11 sites, while MTC has better performances only at the HB and QYZ sites.

4. Discussion

In this study, three gridded evapotranspiration products (GLEAM, ERA5-Land and CR) were selected to investigate the performances of the two TC-based methods (ETC and MTC) in uncertainty estimation and data fusion. In addition, the in-situ ET observations were employed for independent validation. Although valuable results have been obtained, there are still several issues worth discussing.

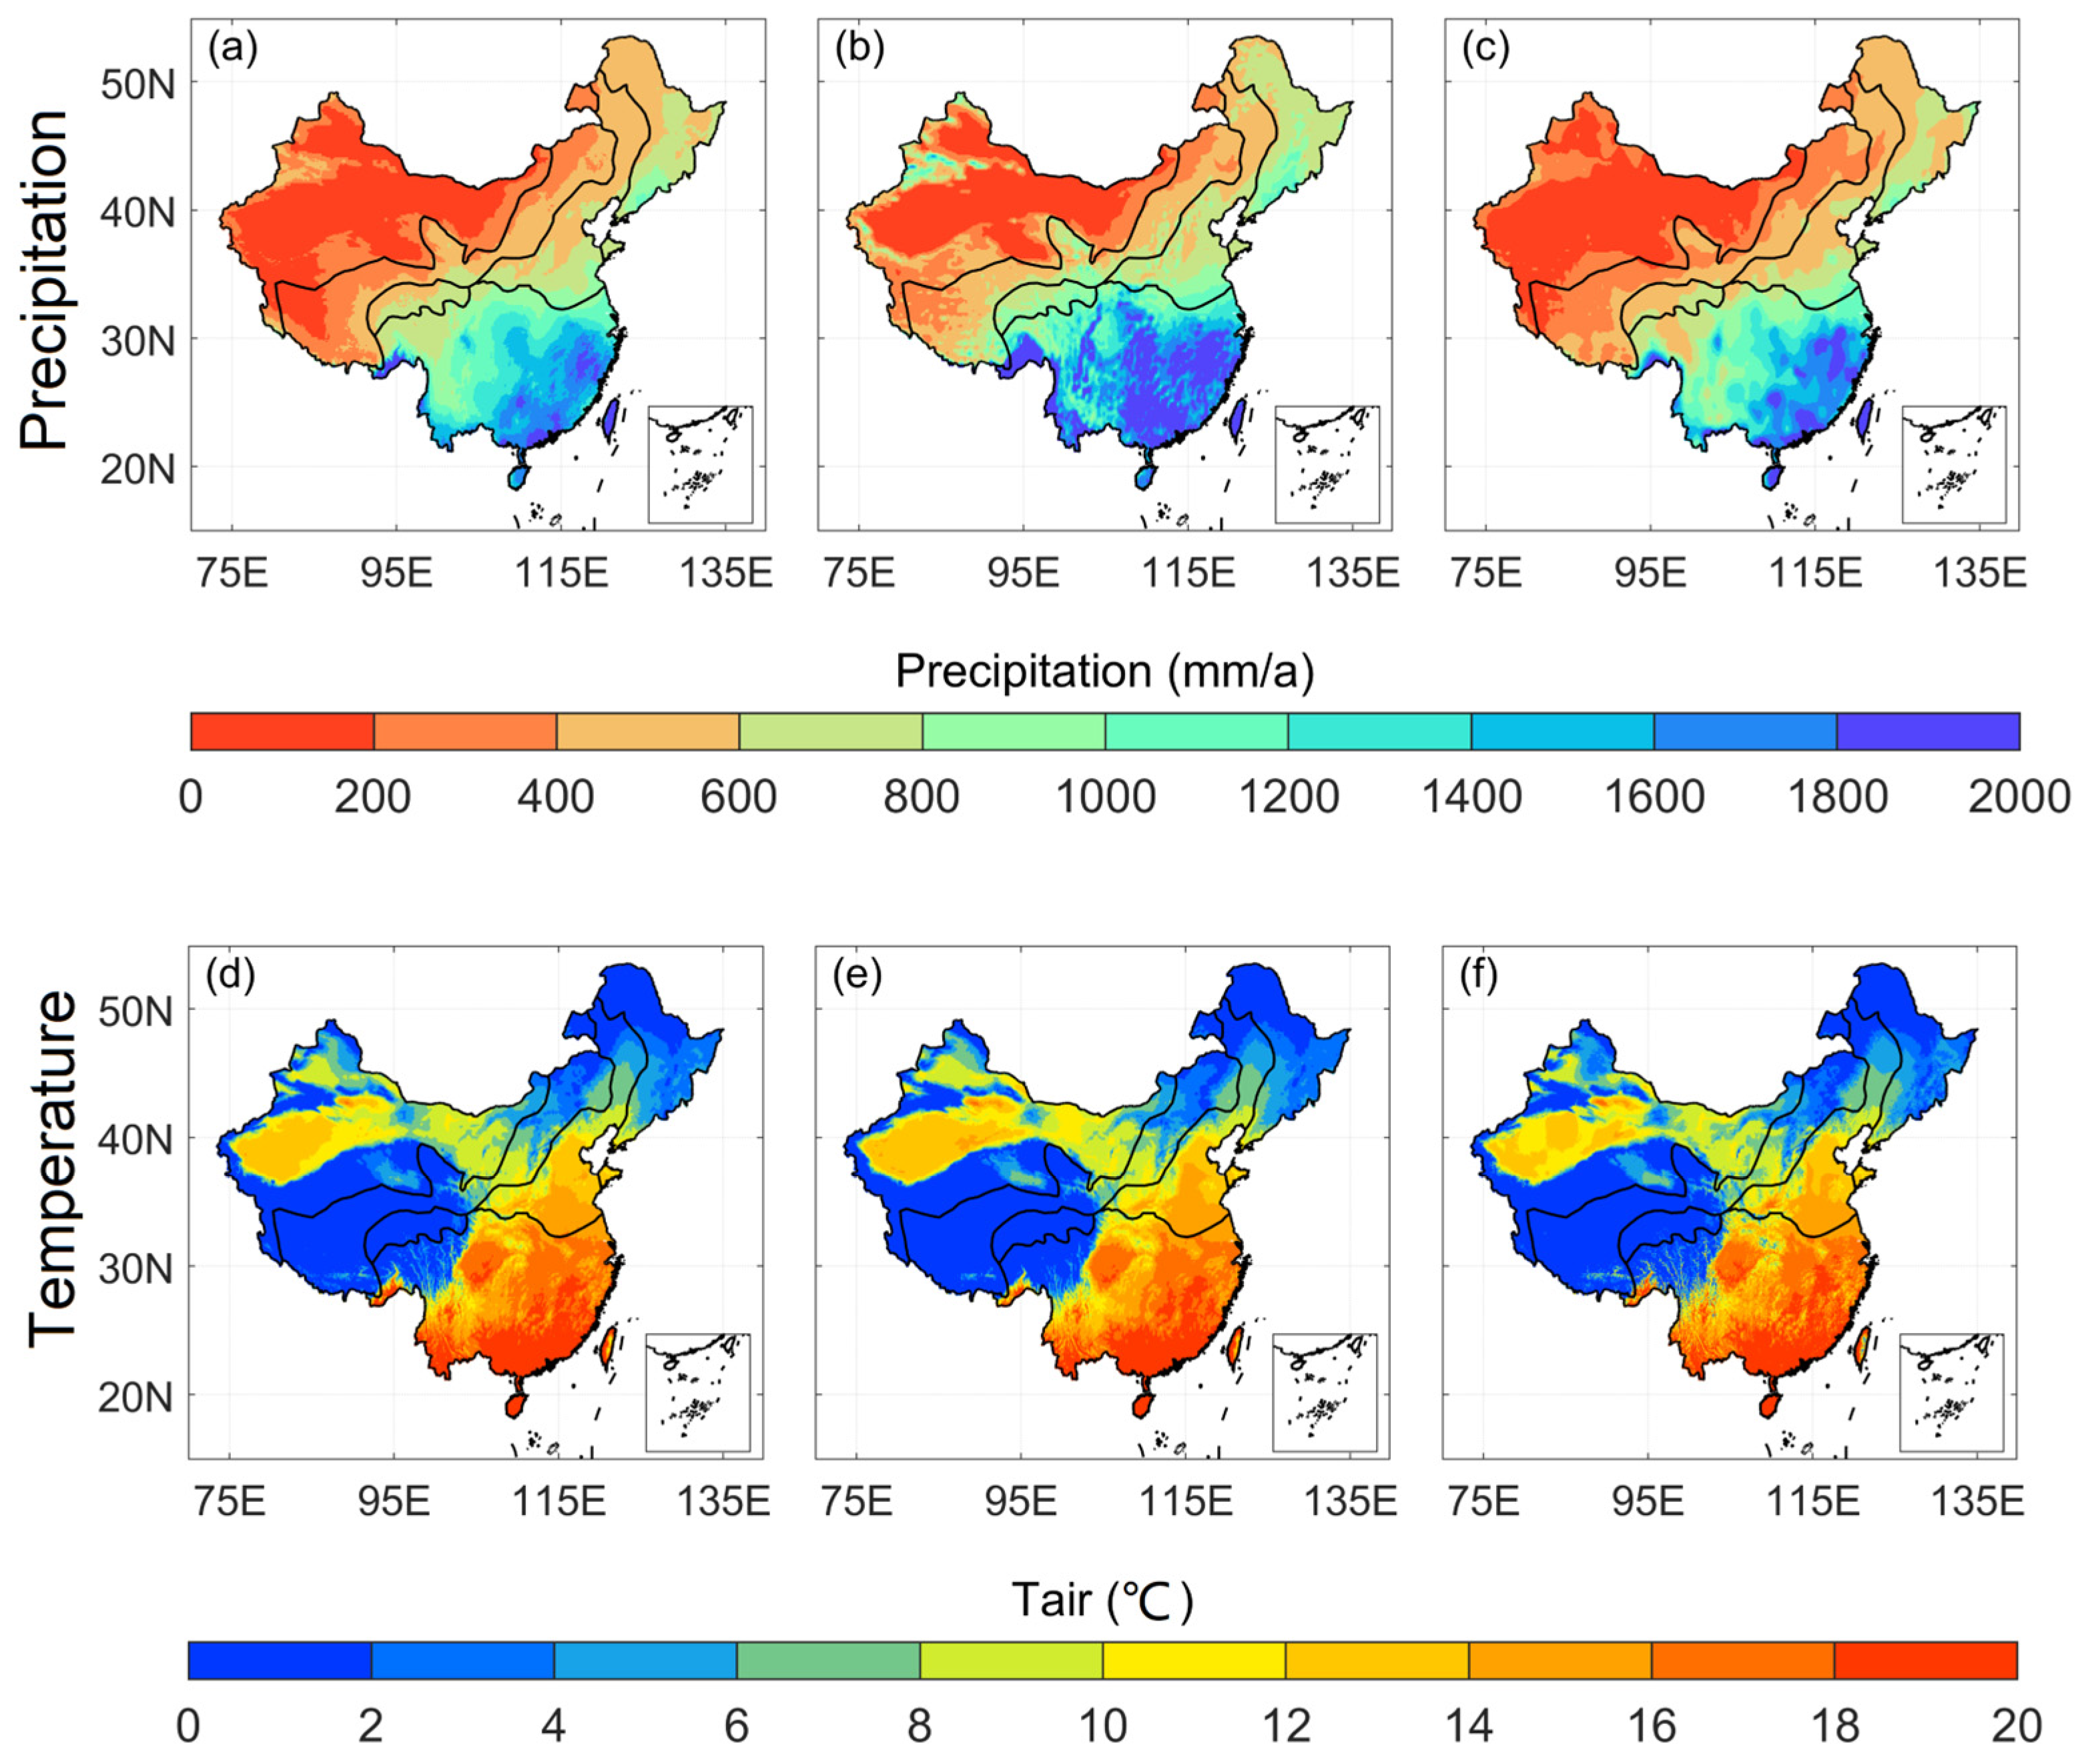
4.1. Intercomparison of Critical Meteorological Factors Affecting Evapotranspiration

ET is a comprehensive process affected by various meteorological and environmental factors, among which precipitation and near-surface air temperature are particularly critical. The former provides a water supply, while the latter creates energy conditions for the ET process. The precipitation adopted by the GLEAM model is the Multi-Source Weighted-Ensemble Precipitation (MSWEP) dataset, and the near-surface air temperature is the Multi-Source Weather (MSWX) dataset. ERA5-Land has its own precipitation and near-surface air temperature datasets. As for CR, the China Meteorological Forcing Dataset (CMFD) was used as the forcing dataset, which includes precipitation and near-surface air temperature. The spatial patterns of multi-year averaged values of precipitation and near-surface air temperature during 1982–2017 are illustrated in Figure 11. It can be observed that all three precipitation datasets generally show a comparable spatial distribution with a gradual decrease from southeast to northwest, which is similar to that of ET (Figure 3). However, discrepancies also exist among them. The amount of domain-averaged precipitation over China for ERA5-Land (821.9 mm/a) is dramatically greater than that of MSWEP (623.44 mm/a) and CMFD (607.82 mm/a). The higher precipitation usually leads to a higher ET, especially in the humid zone, where the precipitation is sufficient. It can be used to explain why the ET amount of ERA5-Land in the humid zone (62.94 mm/month) is obviously greater than that of both GLEAM (50.19 mm/month) and CR (51.91 mm/month). Regarding near-surface air temperature, the MSWX, CMFD, and ERA5-Land perform at a more comparable spatial distribution and magnitude. The lower near-surface air temperature values exist in the Qinghai-Tibetan Plateau and northeastern China, while the higher values appear in southern China. Beyond that, the area-averaged values of MSWX, CMFD and ERA5-Land are 6.94, 6.42 and 6.38 °C, respectively. Therefore, ET seems to be more sensitive to precipitation than near-surface air temperature, which implies that once systematic bias exists in precipitation, it is probably inherited by the ET process, resulting in inaccurate ET measurements. As a result, the fusion ET could also be somewhat influenced.

4.2. Impact of Discrepancy Between ETC and MTC Method on Fusion Effectiveness

The substantial discrepancy between ETC and MTC methods is due to the treatment of random error. In the ETC method, random error is supposed to be an additive factor, while it is a multiplicative factor in the MTC method. Thus, the original linear relationship between the parent ET product and ET truth value is transformed into a logarithmic equation. This difference may affect the results of data fusion for the specific hydrological variable, such as precipitation. For example, if no rainfall at a certain period (e.g., day, week), the amount of precipitation is zero. It is workable in the case of linear relationships, while it is awkward under the condition of a logarithmic equation because the exponents cannot be zero. However, these phenomena do not occur in ET because the ET process is continuous, and the amount is always larger than zero. Chen et al. [78] applied the ETC and MTC methods to precipitation merging over the Yangtze River basin, and the results revealed that the MTC method showed a consistent performance with ETC by employing the multiplicative error model. However, the zero values need to be replaced with smaller values (e.g., 10−3, 10−4), and it had a great influence on error estimation. Nevertheless, in terms of ET, the MTC method is partially invalid. Nearly half of the number of grid cells, located at 35° N and north, offend the original assumption of zero-error cross-correlation within the MTC method. It might be related to the statistical distribution characteristics of hydrometeorological variables. Precipitation variable usually follows a normal or Gamma distribution, while the ET variables may not have normal distribution characteristics. In addition, it may also be attributed to the complexity of ET, which is related to a variety of other elements (e.g., temperature, wind, humidity). Li et al. [42] employed a TC-based method to evaluate the error characteristics of five widely used ET products and found that the violation of zero-error cross-correlation generally existed because the requirement of three completely independent products was very challenging. In summary, compared with the ETC method, the MTC method requires stricter independence of input datasets.

4.3. Impact of the Multi-Source ET Products on Fusion Effectiveness

Considering the different sources, GLEAM, ERA5-Land, and CR ET products were screened out as collocated products for ET merging. One reason is that these three ET products can represent three different types of ET estimates, which have less overlap of information and, thereby, can be taken as independent of each other. The other reason is that both GLEAM and ERA5-Land have pretty outstanding performances in the same type of ET estimates, which had been reported by previous studies [79,80]; besides, CR is also very competitive, representing the calibration-free nonlinear complementary relationship model [35], with high spatial resolution. From the results of weight obtained in this study, both ETC and MTC generate higher weights for GLEAM, which are consistent with the previous study in the Nordic region by Li et al. [56], indicating that GLEAM has stable performances over Asia as well as Europe. Actually, the selection of multi-source ET products could unexpectedly impact the effectiveness of ET fusion. The essence of data fusion based on TC-based methods is a weighted average, which implies that the merged ET values are always between the maximum value and minimum value. As a result, it is difficult to obtain pretty good results of the fusion ET when the three original candidate products systematically overestimate or underestimate ET against in-situ ET observation, which can be observed at the HB and XSBN sites. Similar results were also reported by Sun et al. [79], which found that almost all the reanalysis ET products present systematic overestimation at the XSBN site. Moreover, unlike precipitation, ET estimates are usually generated based on multiple meteorological forces and land surface data, and these ancillary datasets could be inevitably shared by many ET products. Therefore, the basic assumption of zero-error correlations is probably offended to varying degrees. He et al. [81] discovered that the fusion results are subjected to the selection of collocated ET products, and there is the optimal triplet of satellite-derived ET products with regard to providing reliable error estimation and data fusion when using the ETC method. However, from the results obtained from MTC in this study, it can be inferred that the MTC method is more sensitive to the collocated product estimates. Consequently, further study is worthy of studying the effectiveness of ET fusion with ETC and MTC methods under different ET collocated triplets.

4.4. Mismatch Between Site-Based Observation and Gridded-Based Estimation

Due to the lack of accurate grid-based reference ET data, the in-situ flux tower observations were used to evaluate the performances of the ETC and MTC methods. In this study, we adopted 11 sites from ChinaFLUX. Although the sites are sparse, the distribution is scattered, covering the arid region (1 site), semi-arid region (4 sites), semi-humid region (2 sites), and humid region (4 sites), and the land use type of which includes grassland (6 sites), forest (4 sites), and cropland (1 site). Hence, the result of assessment based on sites is still meaningful and valuable. In addition, it should be considered that the discrepancies between flux tower observations and gridded ET products may inevitably cause spatial representativeness errors because of the limited footprint of sites [34,82]. However, comparative evaluation, comparison, and validation for gridded ET products with in-situ observations still widely exist. Additionally, several studies reported that the comparison of point-to-pixel actually makes no apparent impact on the evaluation results, especially in high spatial resolution (e.g., 0.1°, 0.05°), due to the consistent land cover types and less heterogeneity within one pixel. Comparatively, more uncertainties may be introduced during the upscaling of observed data when matching with the gridded cell [11]. In addition, the EC systems are susceptible to the energy imbalance problem, which may not be the “truth value”. Therefore, the employment of site-based observation data in this study only serves as an auxiliary part to help understand the discrepancies in results between ETC and MTC. Nevertheless, continuous and joint efforts should be made to explore a more efficient and practical resolution to solve the issue of mismatch between site-based observation and gridded-based estimation.

5. Conclusions

A comprehensive framework for uncertainty analysis and data fusion based on ETC and MTC methods was proposed, and multi-source ET data (e.g., GLEAM, ERA5-Land and CR) were employed to explore the differences in performances between ETC and MTC methods. ETC has better applicability in uncertainties analysis of multi-source gridded ET products than MTC because almost all the grid cells within ETC can conform to the original assumption of zero-error correlations of the TC-based method, while they are violated to varying degrees in the MTC method. The ETC method tends to estimate lower RMSE and higher correlation coefficients than the MTC method over most climate zones and land cover types. For collocated ET products, GLEAM has the best performance, with a contribution to merged ET exceeding 60%, followed by ERA5-Land, with a contribution of approximately 30%, and CR has the worst performance, with a contribution of less than 7%, when using both ETC and MTC. At site scale, both ETC-based and MTC-based merged ET products have superior performances to each contributor at most of the sites with better statistical metrics, while the effectiveness of fusion could be limited when the systematic overestimation or underestimation appears in the original collocated ET products against site-based observations. Overall, ETC has better applicability and effectiveness than MTC, while MTC is more sensitive to the collocated product estimates. This study demonstrated the effectiveness of the TC-based methods in uncertainty analysis and data fusion. However, this work still has some limitations. For example, only three ET products were selected as the collocated triplets, which may not reflect the type they belong to. In addition, the treatment of spatial interpolation may bring some uncertainties to the fusion results. Beyond that, there were significant discrepancies in applicability to different variables (e.g., ET, precipitation, and soil moisture), which are worthy of further study in the future.

Author Contributions

Conceptualization, D.W. (Dayang Wang) and S.L.; methodology, D.W. (Dayang Wang) and S.L.; software, D.W. (Dayang Wang) and S.L.; validation, D.W. (Dayang Wang) and S.L.; formal analysis, D.W. (Dayang Wang) and S.L.; resources, D.W. (Dayang Wang), D.W. (Dagang Wang) and S.L.; data curation, D.W. (Dayang Wang) and S.L.; Writing—original draft preparation, D.W. (Dayang Wang); review and editing, D.W. (Dayang Wang), D.W. (Dagang Wang) and S.L.; visualization, D.W. (Dayang Wang) and S.L.; supervision, D.W. (Dagang Wang) and S.L.; project administration, D.W. (Dayang Wang) and S.L.; funding acquisition, D.W. (Dayang Wang), D.W. (Dagang Wang) and S.L. All authors have read and agreed to the published version of the manuscript.

Funding

This study was financially supported by the Natural Science Foundation of Henan (No. 242300420354), the Nanyang Key Technology R&D Program (No. 23KJGG254), the High-Level Talent Introduction Research Project of the Nanyang Normal University (No. 2023ZX017), the National Natural Science Foundation of China (No. 52079151), the National Natural Science Foundation Projects of International Cooperation and Exchanges (No. 52111540261), the Henan provincial key science and technology research project (No. 232102321101, No. 232102321142, and No. 242102320091) and the Natural Science Foundation of Jiangsu Province (No. BK20230957), Key Project of Basic and Frontier Technology Research in Nanyang City (23JCQY1004), Henan Province’s Water Conservancy Science and Technology Research and Development (CG202453).

Institutional Review Board Statement

Not applicable.

Informed Consent Statement

Not applicable.

Data Availability Statement

The GLEAM ET data are available from https://www.gleam.eu, accessed on 31 October 2024; The ERA5-Land ET data are available from https://cds.climate.copernicus.eu, accessed on 31 October 2024; The CR ET data are available from https://data.tpdc.ac.cn, accessed on 31 October 2024; The flux tower data are available from http://www.cnern.org.cn and https://data.tpdc.ac.cn, accessed on 31 October 2024.

Conflicts of Interest

The authors declare no conflicts of interest.

Appendix A

Figure A1. Boxplots of the RMSE of monthly ET from three ET products under different land cover types over (a) arid zone, (b) semi-arid zone, (c) semi-humid zone, and (d) humid zone by using the ETC method. There is no grid cell for tundra located in semi-arid, semi-humid, or humid zones.
Atmosphere 15 01410 g0a1
Figure A2. Boxplots of the Corr of monthly ET from three ET products under different land cover types over (a) arid zone, (b) semi-arid zone, (c) semi-humid zone, and (d) humid zone by using the ETC method. There is no grid cell for tundra located in semi-arid, semi-humid, or humid zones.
Atmosphere 15 01410 g0a2

References

  1. Fisher, J.B.; Melton, F.; Middleton, E.; Hain, C.; Anderson, M.; Allen, R.; McCabe, M.; Hook, S.; Baldocchi, D.; Philip, A.; et al. The future of evapotranspiration: Global requirements for ecosystem functioning, carbon and climate feedbacks, agricultural management, and water resources. Water Resour. Res. 2017, 53, 2618–2626. [Google Scholar] [CrossRef]
  2. Katul, G.G.; Oren, R.; Manzoni, S.; Higgins, C.; Parlange, M.B. Evapotranspiration: A process driving mass transport and energy exchange in the soil–plant–atmosphere–climate system. Rev. Geophys. 2012, 50, 2011RG000366. [Google Scholar] [CrossRef]
  3. Li, C.; Liu, Z.; Yang, W.; Tu, Z.; Han, J.; Li, S.; Yang, H. CAMELE: Collocation-Analyzed Multi-source Ensembled Land Evapotranspiration Data. Earth Syst. Sci. Data 2024, 16, 1811–1846. [Google Scholar] [CrossRef]
  4. Yang, Y.; Roderick, M.L.; Guo, H.; Miralles, D.G.; Zhang, L.; Fatichi, S.; Luo, X.; Zhang, Y.; McVicar, T.R.; Tu, Z.; et al. Evapotranspiration on a greening Earth. Nat. Rev. Earth Environ. 2023, 4, 626–641. [Google Scholar] [CrossRef]
  5. Oki, T.; Kanae, S. Global hydrological cycles and world water resources. Science 2006, 313, 1068–1072. [Google Scholar] [CrossRef]
  6. Brutsaert, W.; Parlange, M.B. Hydrologic cycle explains the evaporation paradox. Nature 1998, 396, 30. [Google Scholar] [CrossRef]
  7. Ding, Y.; Lu, Z.; Wu, L.; Zhou, L.; Ao, T.; Xu, J.; Wei, R. Evaluating the spatiotemporal dynamics of driving factors for multiple drought types in different climate regions of China. J. Hydrol. 2024, 640, 131710. [Google Scholar] [CrossRef]
  8. Liu, Y.; Zhou, Y.; Ju, W.; Chen, J.; Wang, S.; He, H.; Wang, D.; Guan, F.; Zhao, Y.; Li, Y.; et al. Evapotranspiration and water yield over China’s landmass from 2000 to 2010. Hydrol. Earth Syst. Sci. 2013, 17, 4957–4980. [Google Scholar] [CrossRef]
  9. Vicente-Serrano, S.M.; Miralles, D.G.; Domínguez-Castro, F.; Azorin-Molina, C.; El Kenawy, A.; McVicar, T.R.; Tomás-Burguera, M.; Beguería, S.; Maneta, M.; Peña-Gallardo, M. Global Assessment of the Standardized Evapotranspiration Deficit Index (SEDI) for Drought Analysis and Monitoring. J. Clim. 2018, 31, 5371–5393. [Google Scholar] [CrossRef]
  10. Zhang, L.; Chang, J.; Guo, A.; Zhou, K.; Yang, G.; Zou, D. Ecological drought evolution characteristics under different climatic regions in the Yangtze River basin. J. Hydrol. 2023, 629, 130573. [Google Scholar] [CrossRef]
  11. Zhou, S.; Wang, Y.; Li, Z.; Chang, J.; Guo, A.; Zhou, K. Characterizing spatio-temporal patterns of multi-scalar drought risk in China. Ecol. Indic. 2021, 131, 108189. [Google Scholar] [CrossRef]
  12. Long, D.; Longuevergne, L.; Scanlon, B.R. Uncertainty in evapotranspiration from land surface modeling, remote sensing, and GRACE satellites. Water Resour. Res. 2014, 50, 1131–1151. [Google Scholar] [CrossRef]
  13. Jung, M.; Koirala, S.; Weber, U.; Ichii, K.; Gans, F.; Camps-Valls, G.; Papale, D.; Schwalm, C.; Tramontana, G.; Reichstein, M. The FLUXCOM ensemble of global land-atmosphere energy fluxes. Sci. Data 2019, 6, 74. [Google Scholar] [CrossRef] [PubMed]
  14. Tangune, B.F.; Escobedo, J.F. Reference evapotranspiration in São Paulo State: Empirical methods and machine learning techniques. Int. J. Water Res. Environ. Eng. 2018, 10, 33–44. [Google Scholar]
  15. Wang, X.; Yao, Y.; Zhao, S.; Jia, K.; Zhang, X.; Zhang, Y.; Zhang, L.; Xu, J.; Chen, X. MODIS-based estimation of terrestrial latent heat flux over North America using three machine learning algorithms. Remote Sens. 2017, 9, 1326. [Google Scholar] [CrossRef]
  16. Anayah, F.M.; Kaluarachchi, J.J. Improving the complementary methods to estimate evapotranspiration under diverse climatic and physical conditions. Hydrol. Earth Syst. Sci. 2014, 18, 2049–2064. [Google Scholar] [CrossRef]
  17. Leuning, R.; Zhang, Y.; Rajaud, A.; Cleugh, H.; Tu, K. A simple surface conductance model to estimate regional evaporation using MODIS leaf area index and the Penman-Monteith equation. Water Resour. Res. 2008, 44, W10419. [Google Scholar] [CrossRef]
  18. Mu, Q.; Zhao, M.; Running, S.W. Improvements to a MODIS global terrestrial evapotranspiration algorithm. Remote Sens. Environ. 2011, 115, 1781–1800. [Google Scholar] [CrossRef]
  19. Penman, H.L. Natural evaporation from open water, hare soil and grass. Proc. R. Soc. Lond. A Math. Phys. Sci. 1948, 193, 120–145. [Google Scholar]
  20. Priestley, C.H.B.; Taylor, R.J. On the assessment of surface heat flux and evaporation using large-scale parameters. Mon. Weather Rev. 1972, 100, 81–92. [Google Scholar] [CrossRef]
  21. Anderson, M.C.; Norman, J.M.; Kustas, W.P.; Houborg, R.; Starks, P.J.; Agam, N. A thermal-based remote sensing technique for routine mapping of land-surface carbon, water and energy fluxes from field to regional scales. Remote Sens. Environ. 2008, 112, 4227–4241. [Google Scholar] [CrossRef]
  22. Bastiaanssen, W.G.M.; Menenti, M.; Feddes, R.A.; Holtslag, A.A.M. A remote sensing surface energy balance algorithm for land (SEBAL)—1. Formulation. J. Hydrol. 1998, 212, 198–212. [Google Scholar] [CrossRef]
  23. Sun, H.; Yang, Y.; Wu, R.; Gui, D.; Xue, J.; Liu, Y.; Yan, D. Improving estimation of cropland evapotranspiration by the Bayesian model averaging method with surface energy balance models. Atmosphere 2019, 10, 188. [Google Scholar] [CrossRef]
  24. Mu, Q.; Heinsch, F.A.; Zhao, M.; Running, S.W. Development of a global evapotranspiration algorithm based on MODIS and global meteorology data. Remote Sens. Environ. 2007, 111, 519–536. [Google Scholar] [CrossRef]
  25. Zhang, Y.; Leuning, R.; Hutley, L.B.; Beringer, J.; McHugh, I.; Walker, J.P. Using long-term water balances to parameterize surface conductances and calculate evaporation at 0.05 spatial resolution. Water Resour. Res. 2010, 46, W05512. [Google Scholar] [CrossRef]
  26. Zhang, Y.; Kong, D.; Gan, R.; Chiew, F.H.S.; McVicar, T.R.; Zhang, Q.; Yang, Y. Coupled estimation of 500m and 8day resolution global evapotranspiration and gross primary production in 2002–2017. Remote Sens. Environ. 2019, 222, 165–182. [Google Scholar] [CrossRef]
  27. Zhang, K.; Kimball, J.S.; Nemani, R.R.; Running, S.W.; Hong, Y.; Gourley, J.J.; Yu, Z. Vegetation greening and climate change promote multidecadal rises of global land evapotranspiration. Sci. Rep. 2015, 5, 15956. [Google Scholar] [CrossRef]
  28. Martens, B.; Miralles, D.G.; Lievens, H.; van der Schalie, R.; de Jeu, R.A.M.; Fernández-Prieto, D.; Beck, H.E.; Dorigo, W.A.; Verhoest, N.E.C. GLEAM v3: Satellite-based land evaporation and root-zone soil moisture. Geosci. Model Dev. 2017, 10, 1903–1925. [Google Scholar] [CrossRef]
  29. Bai, P.; Liu, X. Intercomparison and evaluation of three global high-resolution evapotranspiration products across China. J. Hydrol. 2018, 566, 743–755. [Google Scholar] [CrossRef]
  30. Liu, H.; Xin, X.; Su, Z.; Zeng, Y.; Lian, T.; Li, L.; Yu, S.; Zhang, H. Intercomparison and evaluation of ten global ET products at site and basin scales. J. Hydrol. 2022, 617, 128887. [Google Scholar] [CrossRef]
  31. Khan, M.S.; Liaqat, U.W.; Baik, J.; Choi, M. Stand-alone uncertainty characterization of GLEAM, GLDAS and MOD16 evapotranspiration products using an extended triple collocation approach. Agric. For. Meteorol. 2018, 252, 256–268. [Google Scholar] [CrossRef]
  32. Xu, T.; Guo, Z.; Xia, Y.; Ferreira, V.G.; Liu, S.; Wang, K.; Yao, Y.; Zhang, X.; Zhao, C. Evaluation of twelve evapotranspiration products from machine learning, remote sensing and land surface models over conterminous United States. J. Hydrol. 2019, 578, 124105. [Google Scholar] [CrossRef]
  33. Yilmaz, M.T.; Crow, W.T.; Anderson, M.C.; Hain, C. An objective methodology for merging satellite- and model- based soil moisture products. Water Resour. Res. 2012, 48, W11502. [Google Scholar] [CrossRef]
  34. Ershadi, A.; McCabe, M.F.; Evans, J.P.; Chaney, N.W.; Wood, E.F. Multi-site evaluation of terrestrial evaporation models using FLUXNET data. Agr. Forest Meteorol. 2014, 187, 46–61. [Google Scholar] [CrossRef]
  35. Ma, N.; Szilagyi, J.; Jozsa, J. Benchmarking largescale evapotranspiration estimates: A perspective from a calibration-free complementary relationship approach and FLUXCOM. J. Hydrol. 2020, 590, 125221. [Google Scholar] [CrossRef]
  36. Lu, J.; Wang, G.; Chen, T.; Shijie, L.; Hagan, D.; Kattel, G.; Peng, J.; Jiang, T.; Su, B. A harmonized global land evaporation dataset from reanalysis products covering 1980–2017. Earth Syst. Sci. Data 2021, 13, 5879–5898. [Google Scholar] [CrossRef]
  37. Baik, J.; Park, J.; Ryu, D.; Choi, M. Geospatial blending to improve spatial mapping of precipitation with high spatial resolution by merging satellite-based and ground-based data. Hydrol. Process. 2016, 30, 2789–2803. [Google Scholar]
  38. Yao, Y.; Liang, S.; Li, X.; Zhang, Y.; Chen, J.; Jia, K.; Zhang, X.; Fisher, J.; Wang, X.; Zhang, L. Estimation of high-resolution terrestrial evapotranspiration from Landsat data using a simple Taylor skill fusion method. J. Hydrol. 2017, 553, 508–526. [Google Scholar] [CrossRef]
  39. Dong, J.; Crow, W.T. The added value of assimilating remotely sensed soil moisture for estimating summertime soil moisture air temperature coupling strength. Water Resour. Res. 2018, 54, 6072–6084. [Google Scholar] [CrossRef]
  40. Li, C.; Tang, G.; Hong, Y. Cross-evaluation of ground-based, multi-satellite and reanalysis precipitation products: Applicability of the Triple Collocation method across China. J. Hydrol. 2018, 562, 71–83. [Google Scholar] [CrossRef]
  41. Stoffelen, A. Toward the true near-surface wind speed: Error modeling and calibration using triple collocation. J. Geophys. Res. Ocean. 1998, 103, 7755–7766. [Google Scholar] [CrossRef]
  42. Li, C.; Yang, H.; Yang, W.; Liu, Z.; Jia, Y.; Li, S.; Yang, D. Error Characterization of Global Land Evapotranspiration Products: Collocation-based approach. J. Hydrol. 2022, 612, 128102. [Google Scholar] [CrossRef]
  43. Park, J.; Baik, J.; Choi, M. Triple collocation based multi-source evaporation and transpiration merging. Agric. Forest Meteorol. 2023, 331, 109353. [Google Scholar] [CrossRef]
  44. McColl, K.A.; Roy, A.; Derksen, C.; Konings, A.G.; Alemohammed, S.H.; Entekhabi, D. Triple collocation for binary and categorical variables: Application to validating landscape freeze/thaw retrievals. Remote Sens. Environ. 2016, 176, 31–42. [Google Scholar] [CrossRef]
  45. Vogelzang, J.; Stoffelen, A.; Verhoef, A.; Figa-Saldaña, J. On the quality of high-resolution scatterometer winds. J. Geophys. Res. 2011, 116, C10033. [Google Scholar] [CrossRef]
  46. Fang, H.; Wei, S.; Jiang, C.; Scipal, K. Theoretical uncertainty analysis of global MODIS, CYCLOPES, and GLOBCARBON LAI products using a triple collocation method. Remote Sens. Environ. 2012, 124, 610–621. [Google Scholar] [CrossRef]
  47. Van Dijk, A.I.J.M.; Renzullo, L.J.; Wada, Y.; Tregoning, P. A global water cycle reanalysis (2003–2012) merging satellite gravimetry and altimetry observations with a hydrological multi-model ensemble. Hydrol. Earth Syst. Sci. 2014, 18, 2955. [Google Scholar] [CrossRef]
  48. Gruber, A.; Su, C.H.; Zwieback, S.; Crow, W.; Dorigo, W.; Wagner, W. Recent advances in (soil moisture) triple collocation analysis. Int. J. Appl. Earth Obs. Geoinf. 2016, 45, 200–211. [Google Scholar] [CrossRef]
  49. Kim, S.; Parinussa, R.M.; Liu, Y.; Johnson, F.M.; Sharma, A. A framework for combining multiple soil moisture retrievals based on maximizing temporal correlation. Geophys. Res. Lett. 2015, 42, 6662–6670. [Google Scholar] [CrossRef]
  50. Kim, S.; Pham, H.T.; Liu, Y.; Marshall, L.; Sharma, A. Improving the Combination of Satellite Soil Moisture Data Sets by Considering Error Cross Correlation: A Comparison Between Triple Collocation (TC) and Extended Double Instrumental Variable (EIVD) Alternative. IEEE Trans. Geosci. Remote Sens. 2021, 59, 7285–7295. [Google Scholar] [CrossRef]
  51. Su, C.; Ryu, D.; Crow, W.T.; Western, W.A. Beyond triple collocation: Applications to soil moisture monitoring. J. Geophys. Res. Atmos. 2014, 119, 6419–6439. [Google Scholar] [CrossRef]
  52. Dong, J.; Crow, W.T.; Chen, X.; Tangdamrongsub, N.; Gao, M.; Sun, S.; Qiu, J.; Wei, L.; Gao, H.; Duan, Z. Statistical uncertainty analysis-based precipitation merging (SUPER): A new framework for improved global precipitation estimation. Remote Sens. Environ. 2022, 283, 113299. [Google Scholar] [CrossRef]
  53. Duan, Z.; Duggan, E.; Chen, C.; Gao, H.; Dong, J.; Liu, J. Comparison of traditional method and triple collocation analysis for evaluation of multiple gridded precipitation products across Germany. J. Hydrometeorol. 2021, 22, 2983–2999. [Google Scholar] [CrossRef]
  54. Wei, L.; Jiang, S.; Ren, L.; Yuan, S.; Liu, Y.; Yang, X.; Wang, M.; Zhang, L.; Yu, H.; Duan, Z. An extended triple collocation method with maximized correlation for near global-land precipitation fusion. Geophys. Res. Lett. 2023, 50, e2023GL105120. [Google Scholar] [CrossRef]
  55. Guo, L.; Wu, Y.; Zheng, H.; Zhang, B.; Fan, L.; Chi, H.; Yan, B.; Wang, X. Consistency and uncertainty of gridded terrestrial evapotranspiration estimations over China. J. Hydrol. 2022, 612, 128245. [Google Scholar] [CrossRef]
  56. Li, X.; Zhang, W.; Vermeulen, A.; Dong, J.; Duan, Z. Triple collocation-based merging of multi-source gridded evapotranspiration data in the Nordic Region. Agric. Forest Meteorol. 2023, 335, 109451. [Google Scholar] [CrossRef]
  57. Liu, H.; Gong, P.; Wang, J.; Clinton, N.; Bai, Y.; Liang, S. Annual dynamics of global land cover and its long-term changes from 1982 to 2015. Earth Syst. Sci. Data 2020, 12, 1217–1243. [Google Scholar] [CrossRef]
  58. Shi, X.; She, D.; Xia, J. The intercomparison of six 0.1°×0.1° spatial resolution evapotranspiration products across China. J. Hydrol. 2024, 633, 130949. [Google Scholar] [CrossRef]
  59. Zheng, H.; Miao, C.; Li, X.; Kong, D.; Gou, J.; Wu, J.; Zhang, S. Effects of vegetation changes and multiple environmental factors on evapotranspiration across China over the past 34 years. Earth’s Future 2022, 10, e2021EF002564. [Google Scholar] [CrossRef]
  60. Joyce, R.J.; Janowiak, J.E.; Arkin, P.A.; Xie, P. CMORPH: A method that produces global precipitation estimates from passive microwave and infrared data at high spatial and temporal resolution. J. Hydrometeorol. 2004, 5, 487–503. [Google Scholar] [CrossRef]
  61. Huffman, G.J.; Adler, R.F.; Morrissey, M.M.; Bolvin, D.T.; Curtis, S.; Joyce, R.; McGavock, B.; Susskind, J. Global precipitation at one-degree daily resolution from multisatellite observations. J. Hydrometeorol. 2001, 2, 36–50. [Google Scholar] [CrossRef]
  62. Miralles, D.G.; Holmes, T.R.H.; De Jeu, R.A.M.; Gash, J.H.; Meesters, A.G.C.A.; Dolman, A.J. Global land-surface evaporation estimated from satellite-based observations. Hydrol. Earth Syst. Sci. 2011, 15, 453–469. [Google Scholar] [CrossRef]
  63. Owe, M.; de Jeu, R.; Holmes, T. Multisensor historical climatology of satellite-derived global land surface moisture. J. Geophys. Res.-Earth Surf. 2008, 113, F01002. [Google Scholar] [CrossRef]
  64. Jia, Y.; Li, C.; Yang, H.; Yang, W.; Liu, Z. Assessments of three evapotranspiration products over China using extended triple collocation and water balance methods. J. Hydrol. 2022, 614, 128594. [Google Scholar] [CrossRef]
  65. Liu, W.; Wang, L.; Zhou, J.; Li, Y.; Sun, F.; Fu, G.; Li, X.; Sang, Y. A worldwide evaluation of basin-scale evapotranspiration estimates against the water balance method. J. Hydrol. 2016, 538, 82–95. [Google Scholar] [CrossRef]
  66. Muñoz-Sabater, J.; Dutra, E.; Agustí-Panareda, A.; Albergel, C.; Arduini, G.; Balsamo, G.; Boussetta, S.; Choulga, M.; Harrigan, S.; Hersbach, H.; et al. ERA5-Land: A state-of-the-art global reanalysis dataset for land applications. Earth Syst. Sci. Data 2021, 13, 4349–4383. [Google Scholar] [CrossRef]
  67. Dai, A. The diurnal cycle from observations and ERA5 in surface pressure, temperature, humidity, and winds. Clim. Dynam. 2023, 61, 2965–2990. [Google Scholar] [CrossRef]
  68. Wu, X.; Su, J.; Ren, W.; Lu, H.; Yuan, F. Statistical comparison and hydrological utility evaluation of ERA5-Land and IMERG precipitation products on the Tibetan Plateau. J. Hydrol. 2023, 620, 129384. [Google Scholar] [CrossRef]
  69. Song, Y.; Wei, J. Diurnal cycle of summer precipitation over the North China Plain and associated land-atmosphere interactions: Evaluation of ERA5 and MERRA-2. Int. J. Climatol. 2021, 41, 6031–6046. [Google Scholar] [CrossRef]
  70. Ma, N.; Szilagyi, J.; Zhang, Y.; Liu, W. Complementary-relationship-based modeling of terrestrial evapotranspiration across china during 1982–2012: Validations and Spatiotemporal Analyses. J. Geophys. Res.-Atmos. 2019, 124, 4326–4351. [Google Scholar] [CrossRef]
  71. Szilagyi, J.; Crago, R.; Qualls, R. A calibration-free formulation of the complementary relationship of evaporation for continental-scale hydrology. J. Geophys. Res.-Atmos. 2017, 122, 264–278. [Google Scholar] [CrossRef]
  72. Bouchet, R.J. Evapotranspiration réelle, évapotranspiration potentielle, et production Agricole. Ann. Agron. 1963, 14, 743–824. [Google Scholar]
  73. Ma, Y.; Xie, Z.; Chen, Y.; Liu, S.; Che, T.; Xu, Z.; Shang, L.; He, X.; Meng, X.; Ma, W. Dataset of spatially extensive long-term quality-assured land–atmosphere interactions over the Tibetan Plateau. Earth Syst. Sci. Data 2024, 16, 3017–3043. [Google Scholar] [CrossRef]
  74. Baik, J.; Liaqat, U.W.; Choi, M. Assessment of satellite-and reanalysis-based evapotranspiration products with two blending approaches over the complex landscapes and climates of Australia. Agric. Forest Meteorol. 2018, 263, 388–398. [Google Scholar] [CrossRef]
  75. McColl, K.A.; Vogelzang, J.; Konings, A.G.; Entekhabi, D.; Piles, M.; Stoffelen, A. Extended triple collocation: Estimating errors and correlation coefficients with respect to an unknown target. Geophys. Res. Lett. 2014, 41, 6229–6236. [Google Scholar] [CrossRef]
  76. Alemohammad, S.H.; McColl, K.A.; Konings, A.G.; Entekhabi, D.; Stoffelen, A. Characterization of precipitation product errors across the United States using multiplicative triple collocation. Hydrol. Earth Syst. Sci. 2015, 19, 3489–3503. [Google Scholar] [CrossRef]
  77. Lyu, F.; Tang, G.; Behrangi, A.; Wang, T.; Tan, X.; Ma, Z.; Xiong, W. Precipitation Merging Based on the Triple Collocation Method Across Mainland China. IEEE Trans. Geosci. Remote Sens. 2021, 59, 3161–3176. [Google Scholar] [CrossRef]
  78. Chen, C.; He, M.; Chen, Q.; Zhang, J.; Li, Z.; Wang, Z.; Duan, Z. Triple collocation-based error estimation and data fusion of global gridded precipitation products over the Yangtze River basin. J. Hydrol. 2022, 605, 127307. [Google Scholar] [CrossRef]
  79. Sun, R.; Duan, Q.; Wang, J. Understanding the spatial patterns of evapotranspiration estimates from land surface models over China. J. Hydrol. 2021, 595, 126021. [Google Scholar] [CrossRef]
  80. Yao, T.; Lu, H.; Yu, Q.; Feng, S.; Xue, Y.; Feng, W. Uncertainties of three high-resolution actual evapotranspiration products across China: Comparisons and applications. Atmos. Res. 2023, 286, 106682. [Google Scholar] [CrossRef]
  81. He, Y.; Wang, C.; Hu, J.; Mao, H.; Duan, Z.; Qu, C.; Li, R.; Wang, M.; Song, X. Discovering Optimal Triplets for Assessing the Uncertainties of Satellite-Derived Evapotranspiration Products. Remote Sens. 2023, 15, 3215. [Google Scholar] [CrossRef]
  82. Peng, D.; Zhang, X.; Wu, C.; Huang, W.; Gonsamo, A.; Huete, A.R.; Didan, K.; Tan, B.; Liu, X.; Zhang, B. Intercomparison and evaluation of spring phenology products using National Phenology Network and AmeriFlux observations in the contiguous United States. Agric. For. Meteorol. 2017, 242, 33–46. [Google Scholar] [CrossRef]
Figure 1. The map of the study area includes (a) the land cover types without changes during 1982–2015, the locations of EC sites (the red circle signs), and (b) the four different climate zones, yellow, orange, light blue, and deep blue, represent arid, semi-arid, semi-humid, and humid regions, respectively.
Atmosphere 15 01410 g001
Figure 2. Framework for uncertainty analysis and data fusion of ET.
Atmosphere 15 01410 g002
Figure 3. Spatial distributions of the multi-year monthly averaged ET in China from (a) GLEAM, (b) ERA5-Land, and (c) CR during the period of 1982–2017.
Atmosphere 15 01410 g003
Figure 4. Spatial distributions of the RMSE of monthly ET from (a,d) GLEAM, (b,e) ERA-Land, and (c,f) CR using the ETC method (ac) and MTC method (df). The ratio of the RMSE from the ETC method to that from the MTC method for the three ET products (g) GLEAM, (h) ERA5-Land and (i) CR. The grid cells violating the assumptions of two methods were masked out.
Atmosphere 15 01410 g004
Figure 5. Boxplots of the RMSE of monthly ET from three ET products under different land cover types over (a) arid, (b) semi-arid, (c) semi-humid, and (d) humid zones by using the ETC and MTC methods.
Atmosphere 15 01410 g005
Figure 6. Spatial distributions of the Corr of monthly ET from (a,d) GLEAM, (b,e) ERA-Land, and (c,f) CR using the ETC method (ac) and MTC method (df). The ratio of the RMSE from the ETC method to that from the MTC method for the three ET products (g) GLEAM, (h) ERA5-Land and (i) CR. The grid cells violating the assumptions of two methods were masked out.
Atmosphere 15 01410 g006
Figure 7. Boxplots of the Corr of monthly ET from three ET products under different land cover types over (a) arid, (b) semi-arid, (c) semi-humid, and (d) humid zones by using the ETC and MTC methods.
Atmosphere 15 01410 g007
Figure 8. Spatial distributions of weights of ET from (a,d) GLEAM, (b,e) ERA-Land, and (c,f) CR using the ETC method (ac) and MTC method (df), and the distributions of the best ET product based on ETC method (g) and MTC method (h).
Atmosphere 15 01410 g008
Figure 9. Alluvial diagram of best ET product with (a) ETC method and (b) MTC method. The black stick represents a unique type in the selected dimension (e.g., the left is ET product, the middle represents climate zone, and the right denotes land cover type), and its height indicates the proportion of the corresponding type. Curved lines of the same color are used to divide certain types, the width of which denotes the proportion.
Atmosphere 15 01410 g009
Figure 10. Statistical characteristics of (a) Bias, (b) Corr, (c) MAE, (d) IOA, (e) RMSE, (f) KGE, (g) RRMSE and (h) NSE from individual ET products (e.g., GLEAM, ERA5-Land and CR) and merged ET (e.g., ETC and MTC) at 11 flux tower locations during the data period.
Atmosphere 15 01410 g010
Figure 11. Spatial patterns of precipitation and near-surface air temperature used for generating (a,d) GLEAM, (b,e) ERA5-Land and (c,f) CR ET over China during the period of 1982–2017.
Atmosphere 15 01410 g011
Table 1. The summary of in-situ sites used in this study.
Site NameLatitude and LongitudeElevation (m)Land Cover TypeData Period
Haibei (HB)37.62° N, 101.31° E3250Grassland2003–2010
Inner Mongolia (NMG)44.50° N, 117.17° E1189Grassland2004–2010
Dangxiong (DX)30.85° N, 91.08° E4333Grassland2004–2010
Maqu (MQ)33.92° N, 102.15° E3434Grassland2014–2017
MAWORS (MW)38.41° N, 75.05° E6647Grassland2015–2017
Ngoring Lake (NL)34.91° N, 97.55° E4280Grassland2014–2017
Changbaishan (CBS)42.40° N, 128.1° E738Forest2003–2010
Qianyanzhou (QYZ)26.74° N, 115.05° E102Forest2003–2010
Dinghushan (DHS)23.17° N, 112.57° E300Forest2003–2010
Xishuangbanna (XSBN)21.95° N, 101.2° E750Forest2003–2010
Yucheng (YC)36.95° N, 116.6° E28Cropland2003–2010
Table 2. The statistical indices on the intercomparison of three collocated ET products over four climate zones.
ProductClimate ZoneMin (mm/month)Max
(mm/month)
Average
(mm/month)
GLEAMArid0.6650.909.49
Semi-arid3.3791.1623.26
Semi-humid8.5280.5734.30
Humid10.10141.7350.19
ERA5-LandArid0.1083.6217.10
Semi-arid1.3168.2835.31
Semi-humid16.5891.4547.37
Humid1.51141.9062.94
CRArid0.5844.2716.14
Semi-arid1.5377.3930.80
Semi-humid20.4063.8340.91
Humid0.15112.6751.91
Disclaimer/Publisher’s Note: The statements, opinions and data contained in all publications are solely those of the individual author(s) and contributor(s) and not of MDPI and/or the editor(s). MDPI and/or the editor(s) disclaim responsibility for any injury to people or property resulting from any ideas, methods, instructions or products referred to in the content.

