WRF-ROMS-SWAN Coupled Model Simulation Study: Effect of Atmosphere–Ocean Coupling on Sea Level Predictions Under Tropical Cyclone and Northeast Monsoon Conditions in Hong Kong
Abstract
1. Introduction
2. Data and Methods
2.1. Model Configuration
2.2. Selected Cases
2.3. Method of Analysis
3. Results
3.1. TC Tracks and Intensity
- (i)
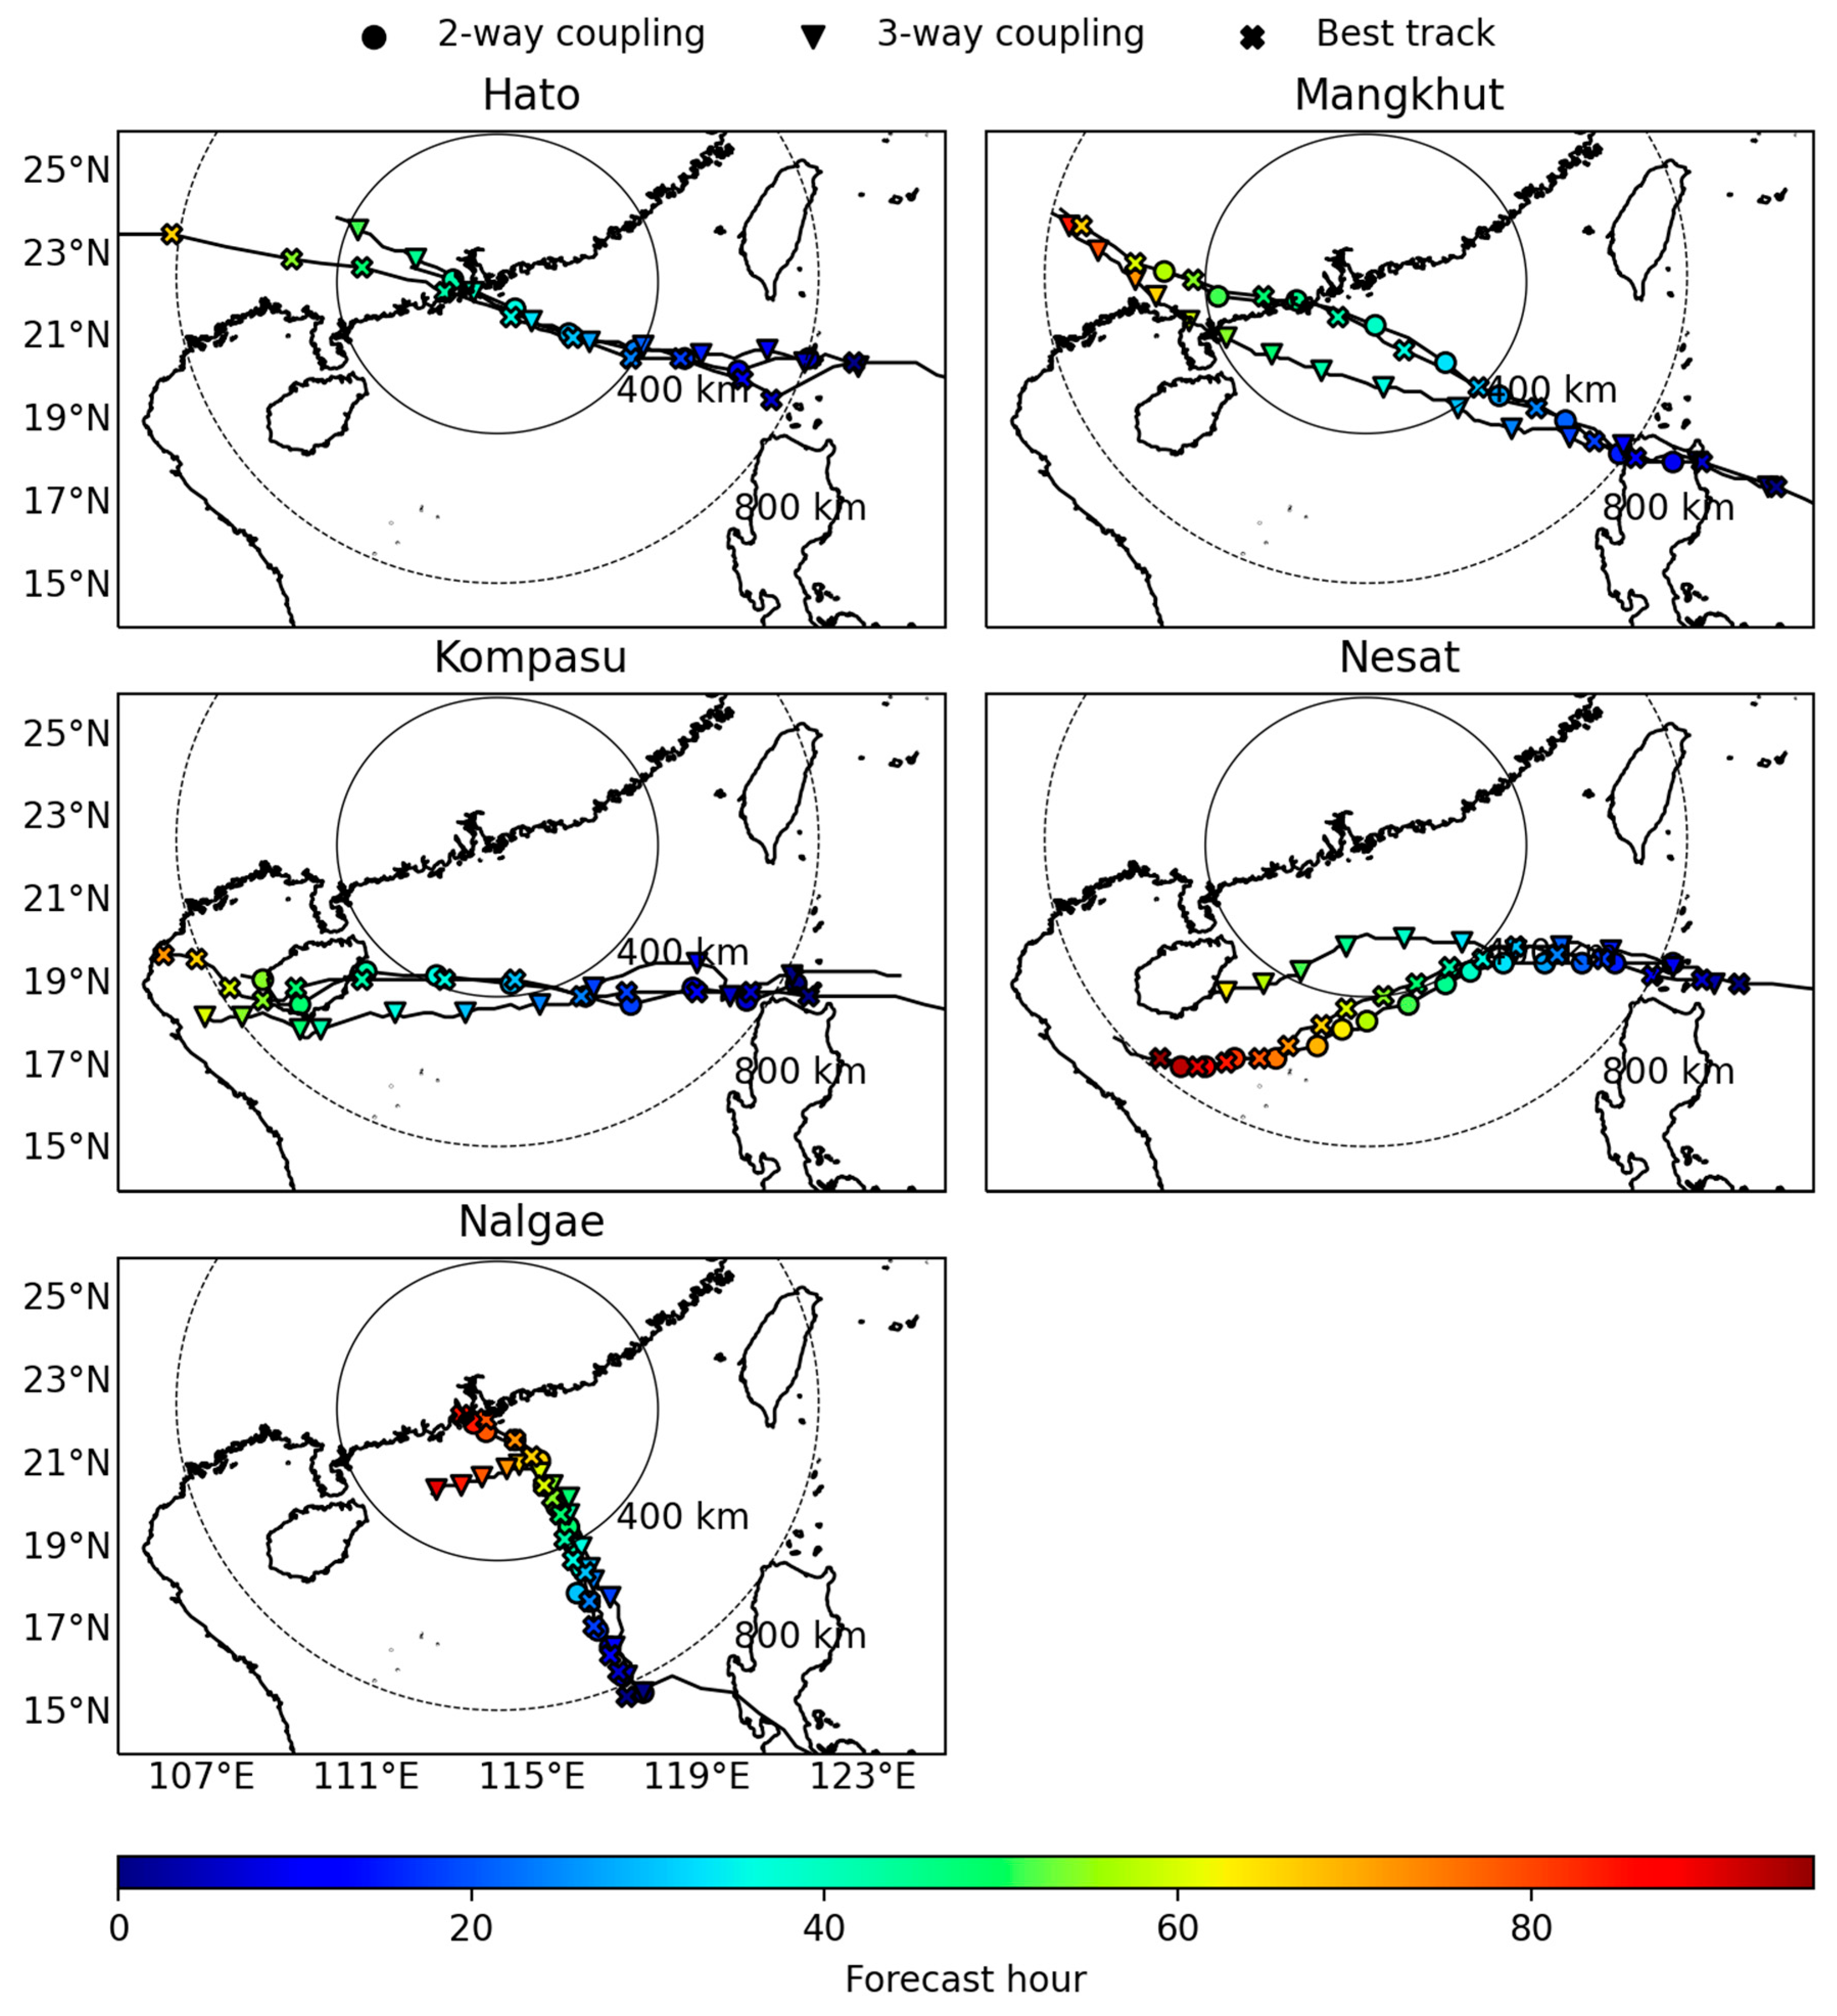
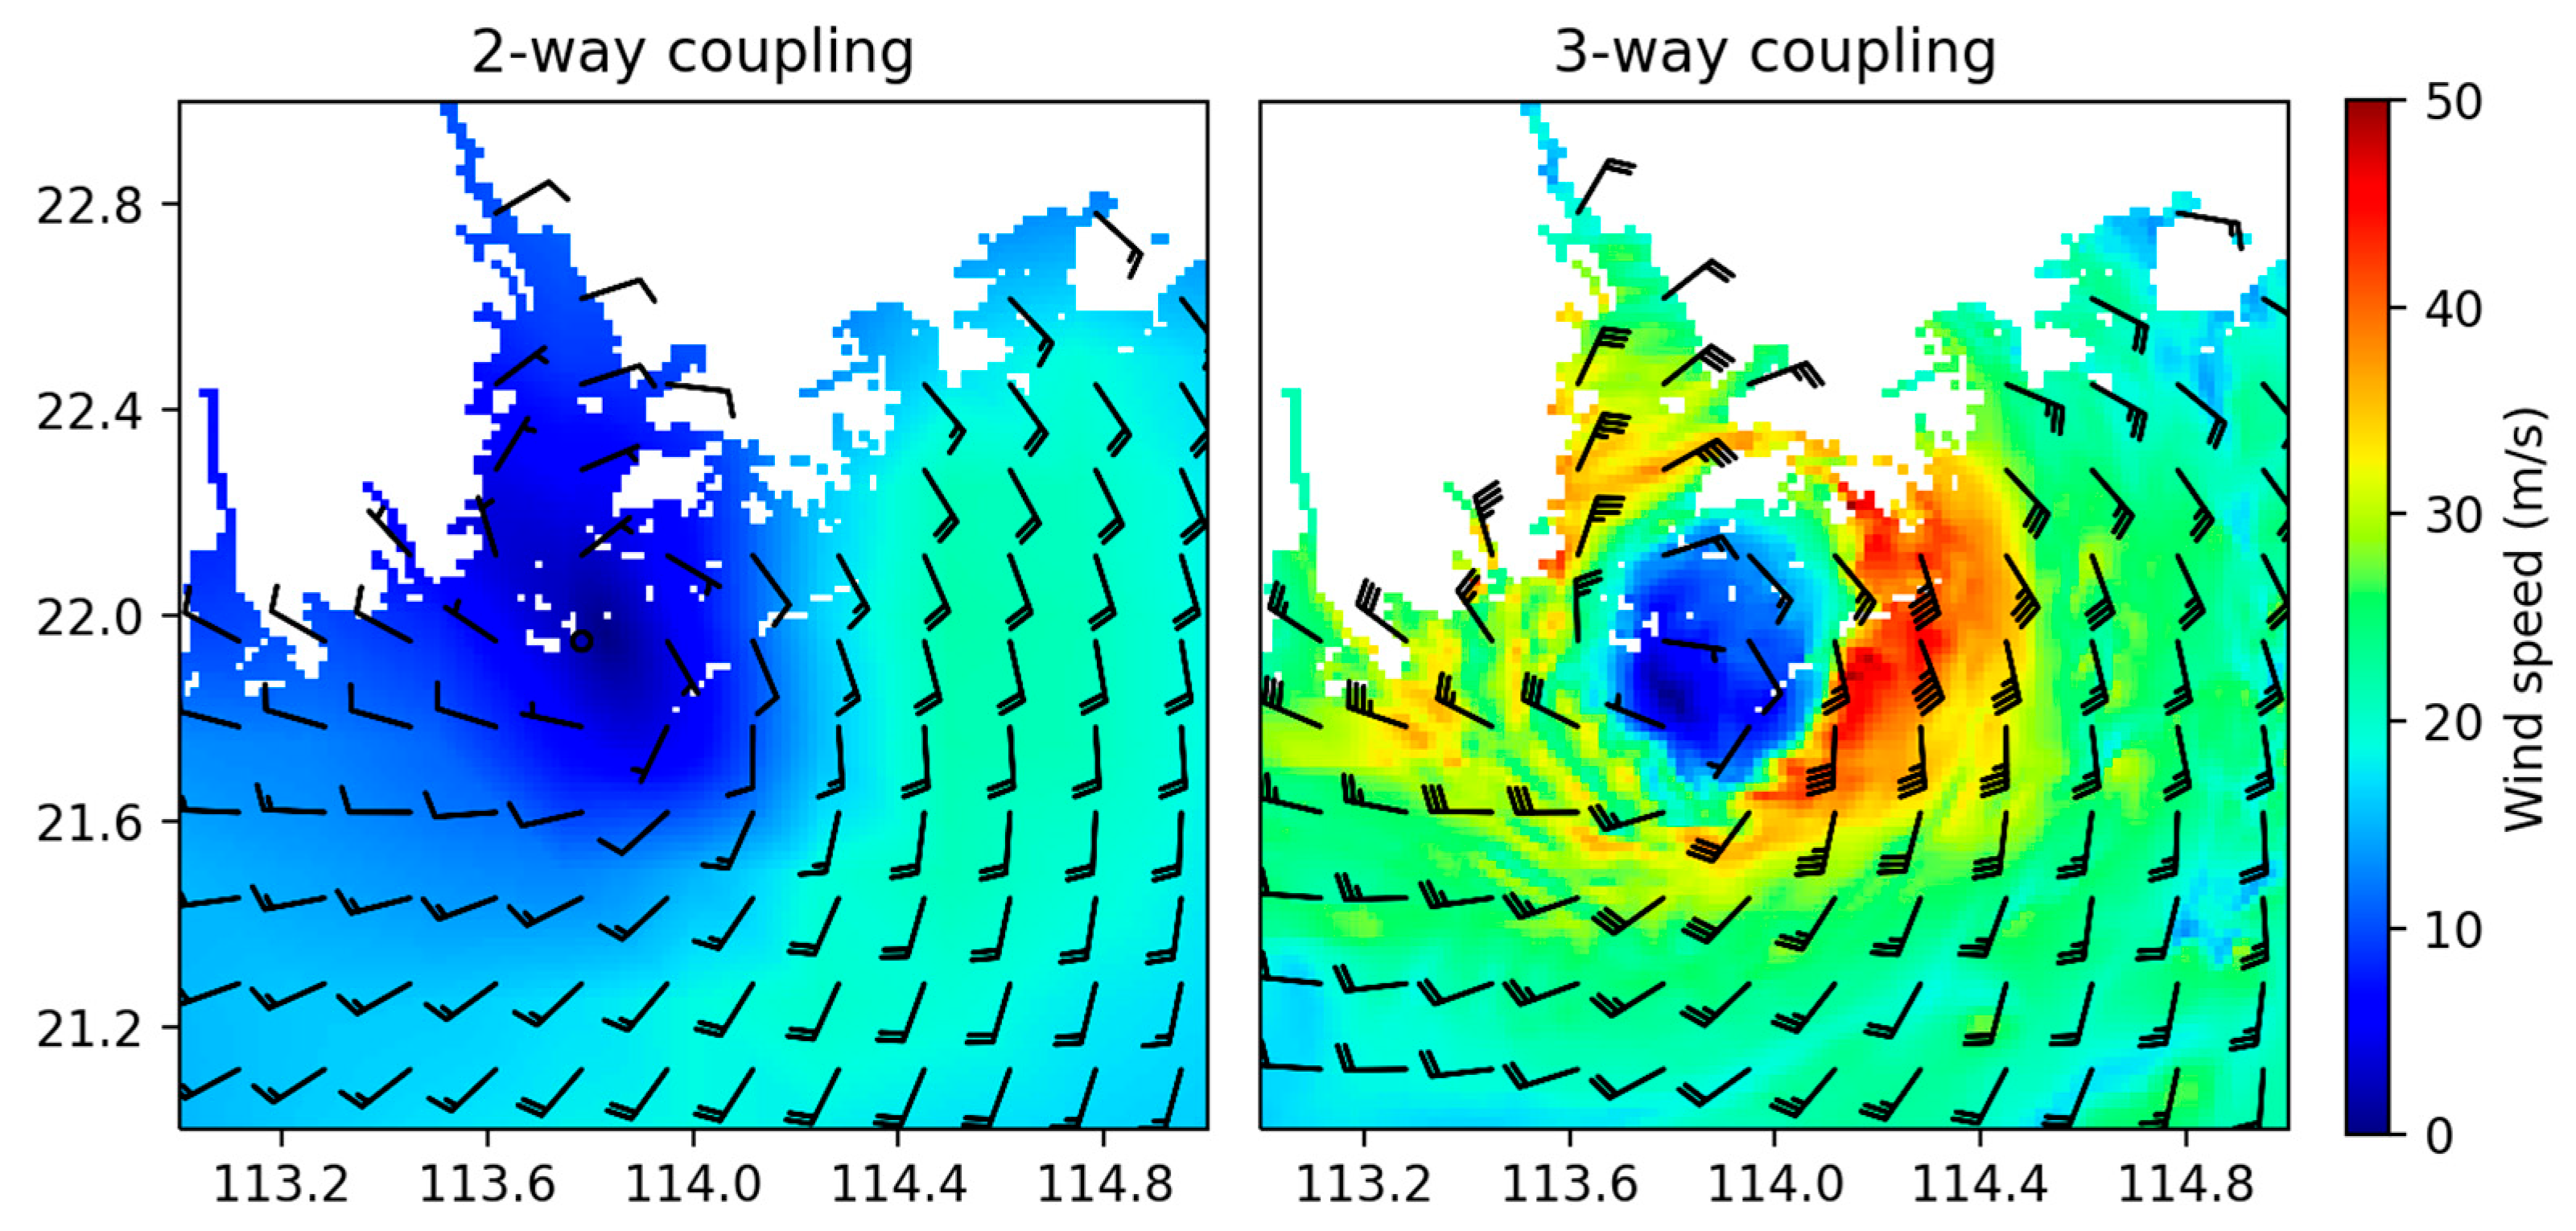
- Hato: The tracks from the ERA5 dataset and the three-way coupling model simulations were consistent with the HKO’s TC best-track data, except that the storms tracked slightly more eastward after landfall at Zhuhai in the three-way coupling model run. The intensity was significantly underestimated for the two-way coupling model simulation. The minimum central pressure from the best-track data was 950 hPa, while that derived from the ERA5 atmospheric forcing was 984 hPa. The maximum sustained wind speed was 24.2 m/s, which was 53.0% lower than the best-track value of 51.4 m/s. On the other hand, the intensification of the storm was well simulated by the 3-way coupling model simulation, with a minimum central pressure of 965 hPa and a maximum sustained wind speed of 45.3 m/s;
- (ii)
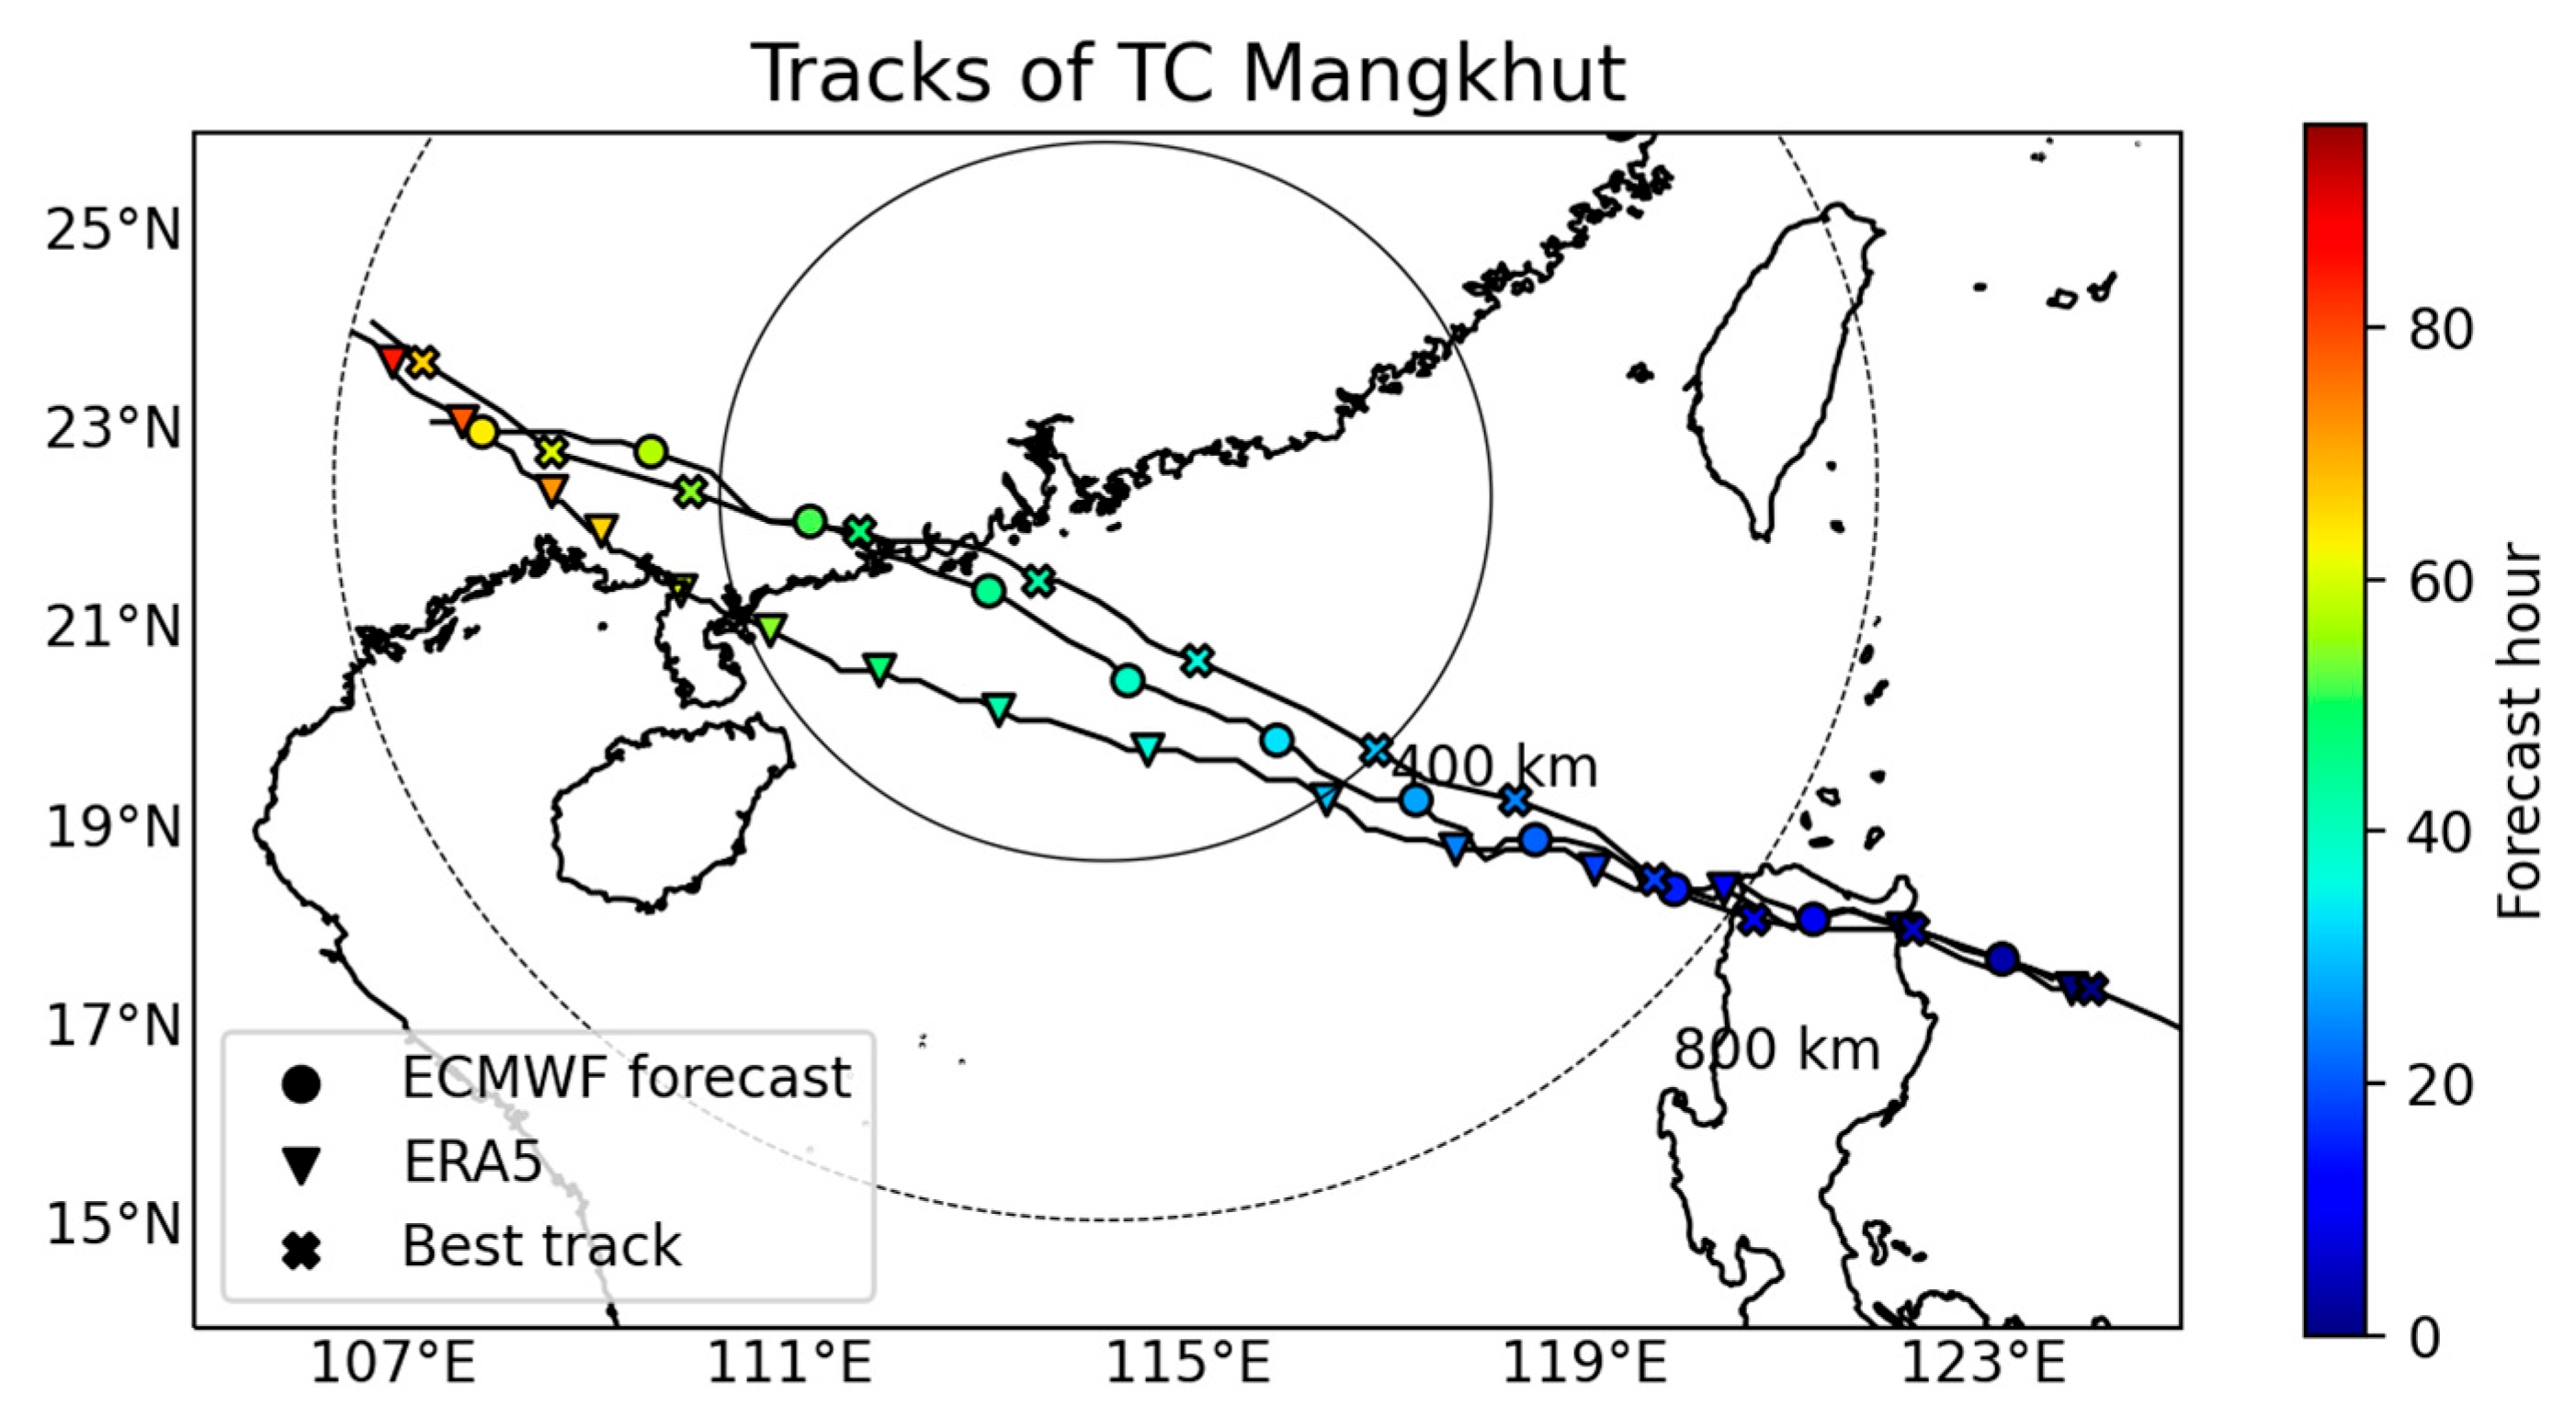
- Mangkhut: The track from the ERA5 dataset aligned with the best track, but the intensity of the storm was underestimated, with the maximum sustained wind being only 32.9 m/s. For the three-way coupling model simulation, while the estimated maximum central wind speed of 59.7 m/s was closer to the best-track value of 69.4 m/s with around 14% underestimation, the storm track deviated significantly westward and made landfall at Zhanjian which was further away from Hong Kong;
- (iii)
- Kompasu: The track extracted from the ERA5 reanalysis generally agreed with the best-track data, while for three-way coupling, the storm tracked more southwards and passed Hainan Island to its south rather than making landfall over it as in the best-track data;
- (iv)
- Nesat: The storm tracked more northwards at a higher translational speed and made landfall on Hainan Island, leading to dissipation at a time earlier than the ERA5 reanalysis and the best-track data. This might be caused by a relatively poor description of the evolution of the ridge located near the storm, as the ridge intersected with the boundary of the domain NSCS. Constructing a larger regional model domain might improve the simulation results;
- (v)
- Nalgae: The track from the ERA5 dataset was consistent with the best-track data, while the TC in the three-way coupling model simulation turned westward with a much larger angle and dissipated at a location further away from Hong Kong.
3.2. Comparison with Observations at WGL Station
- (i)
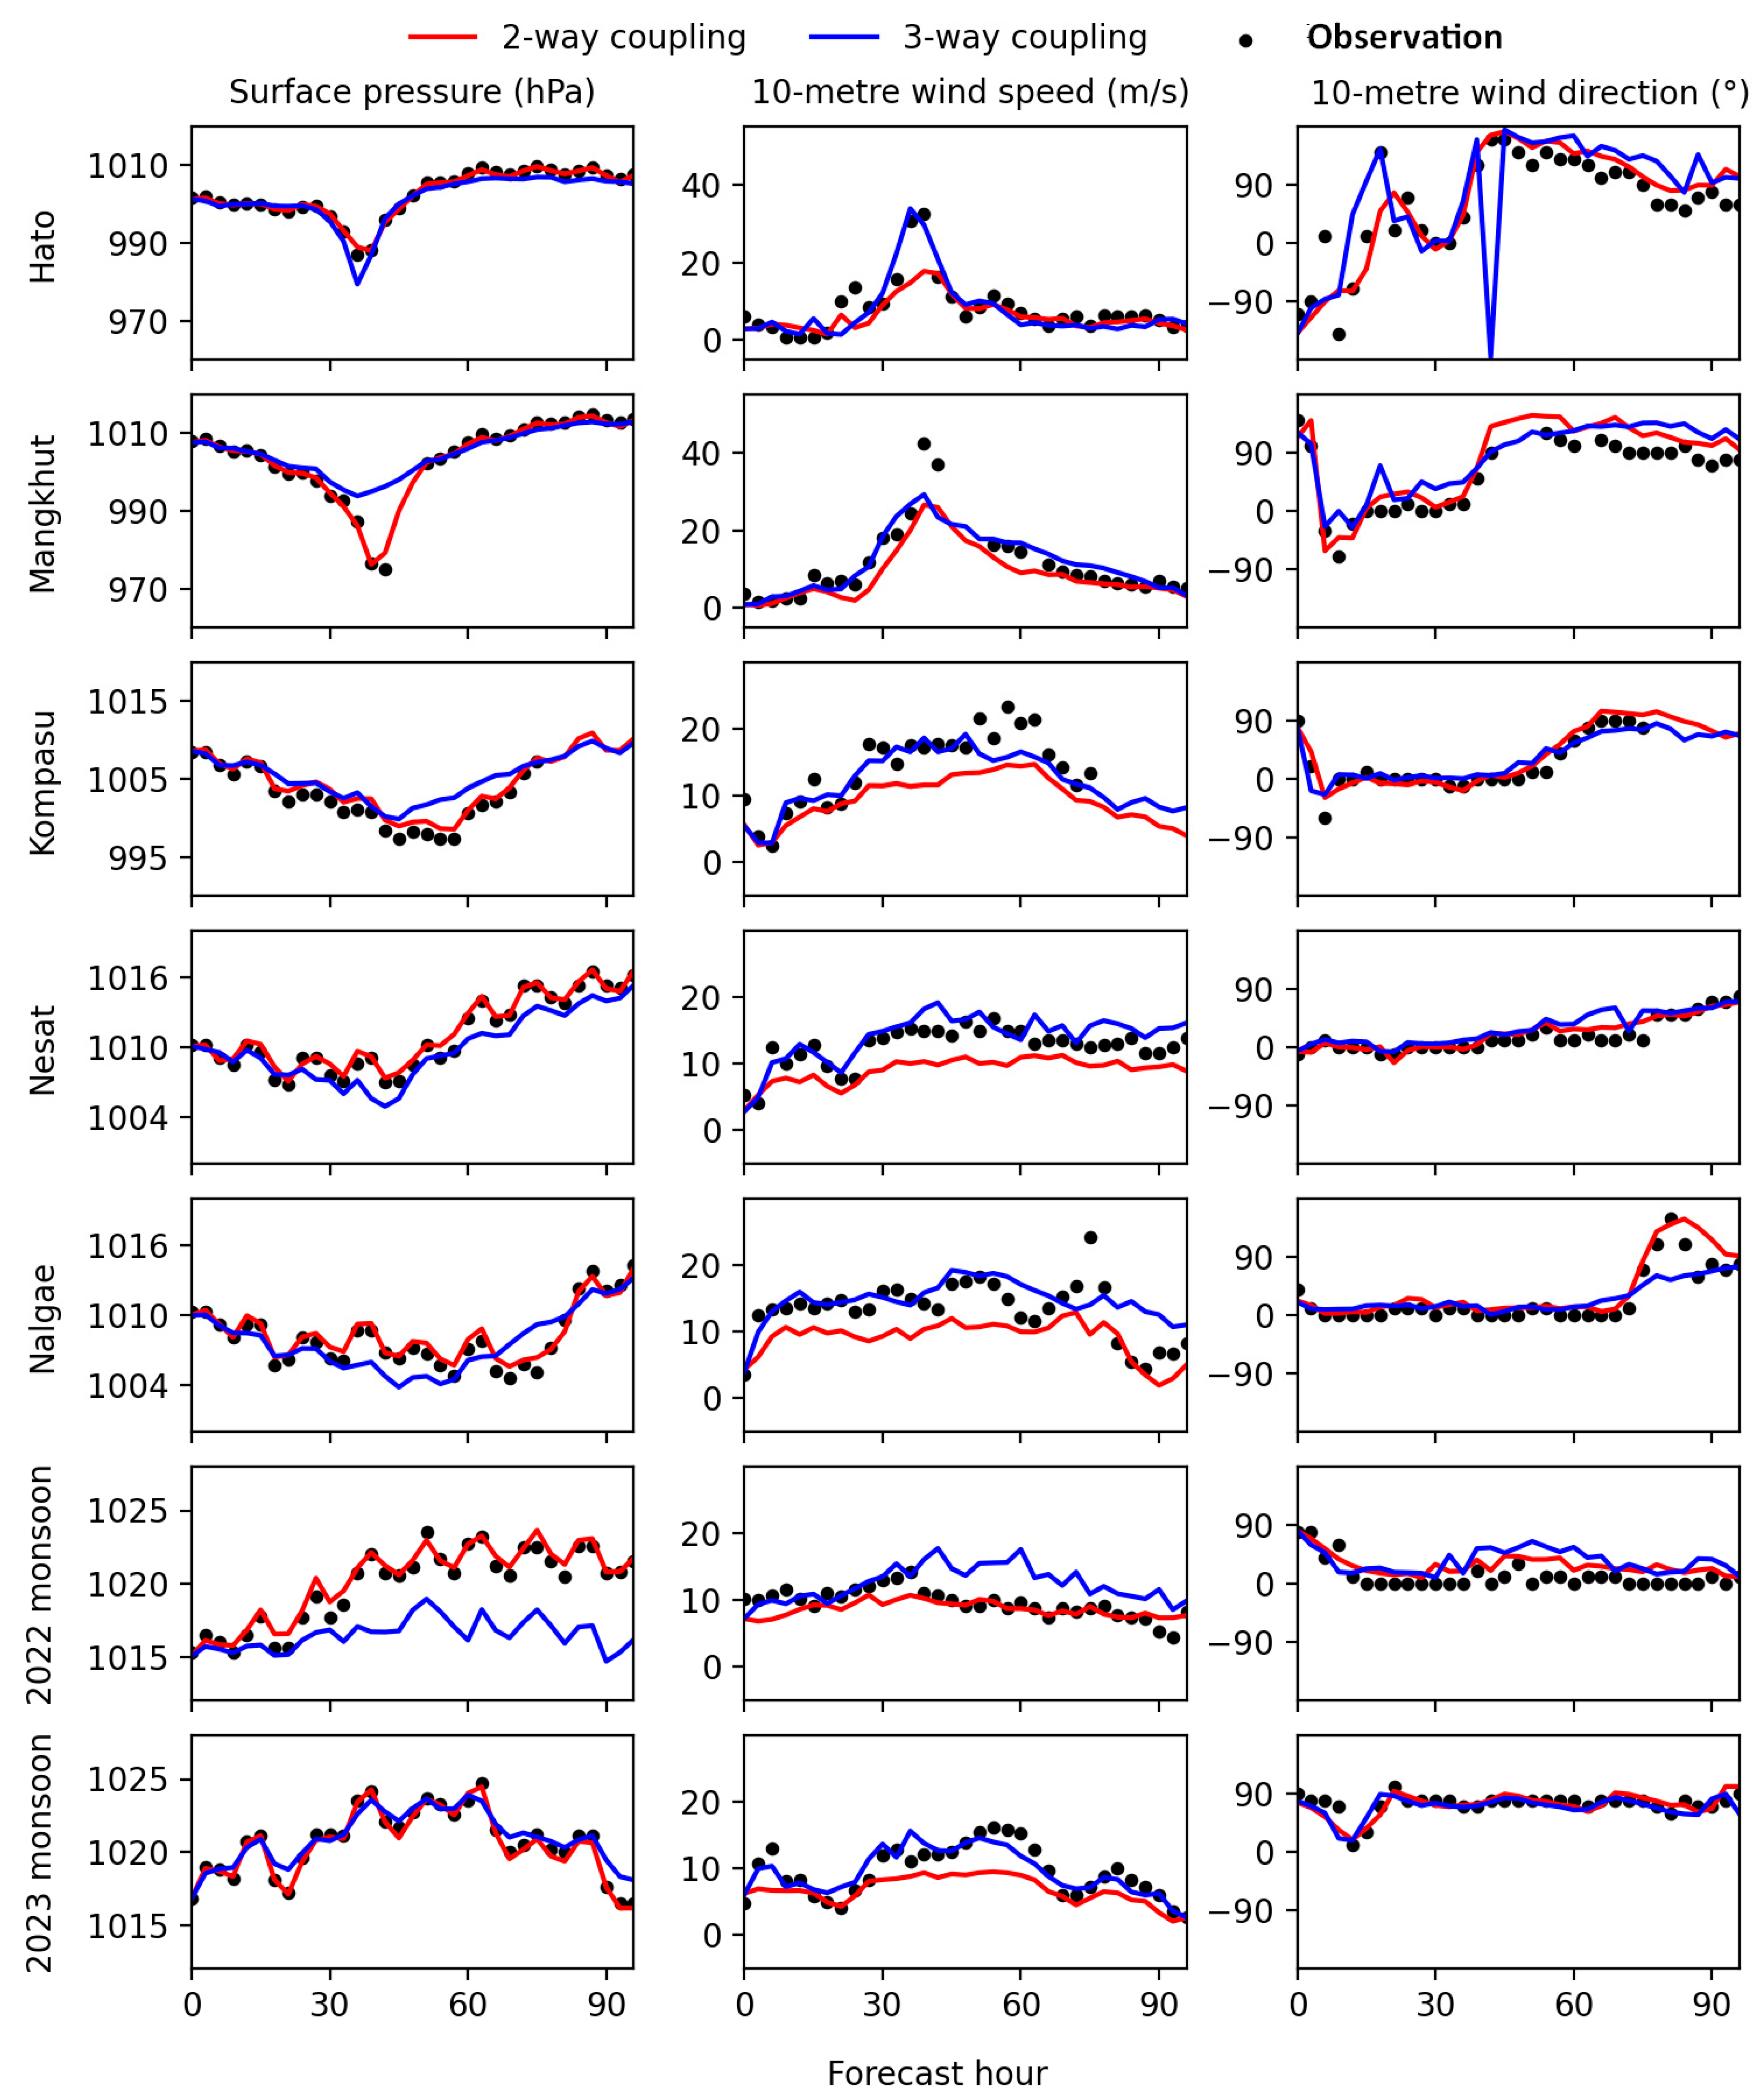
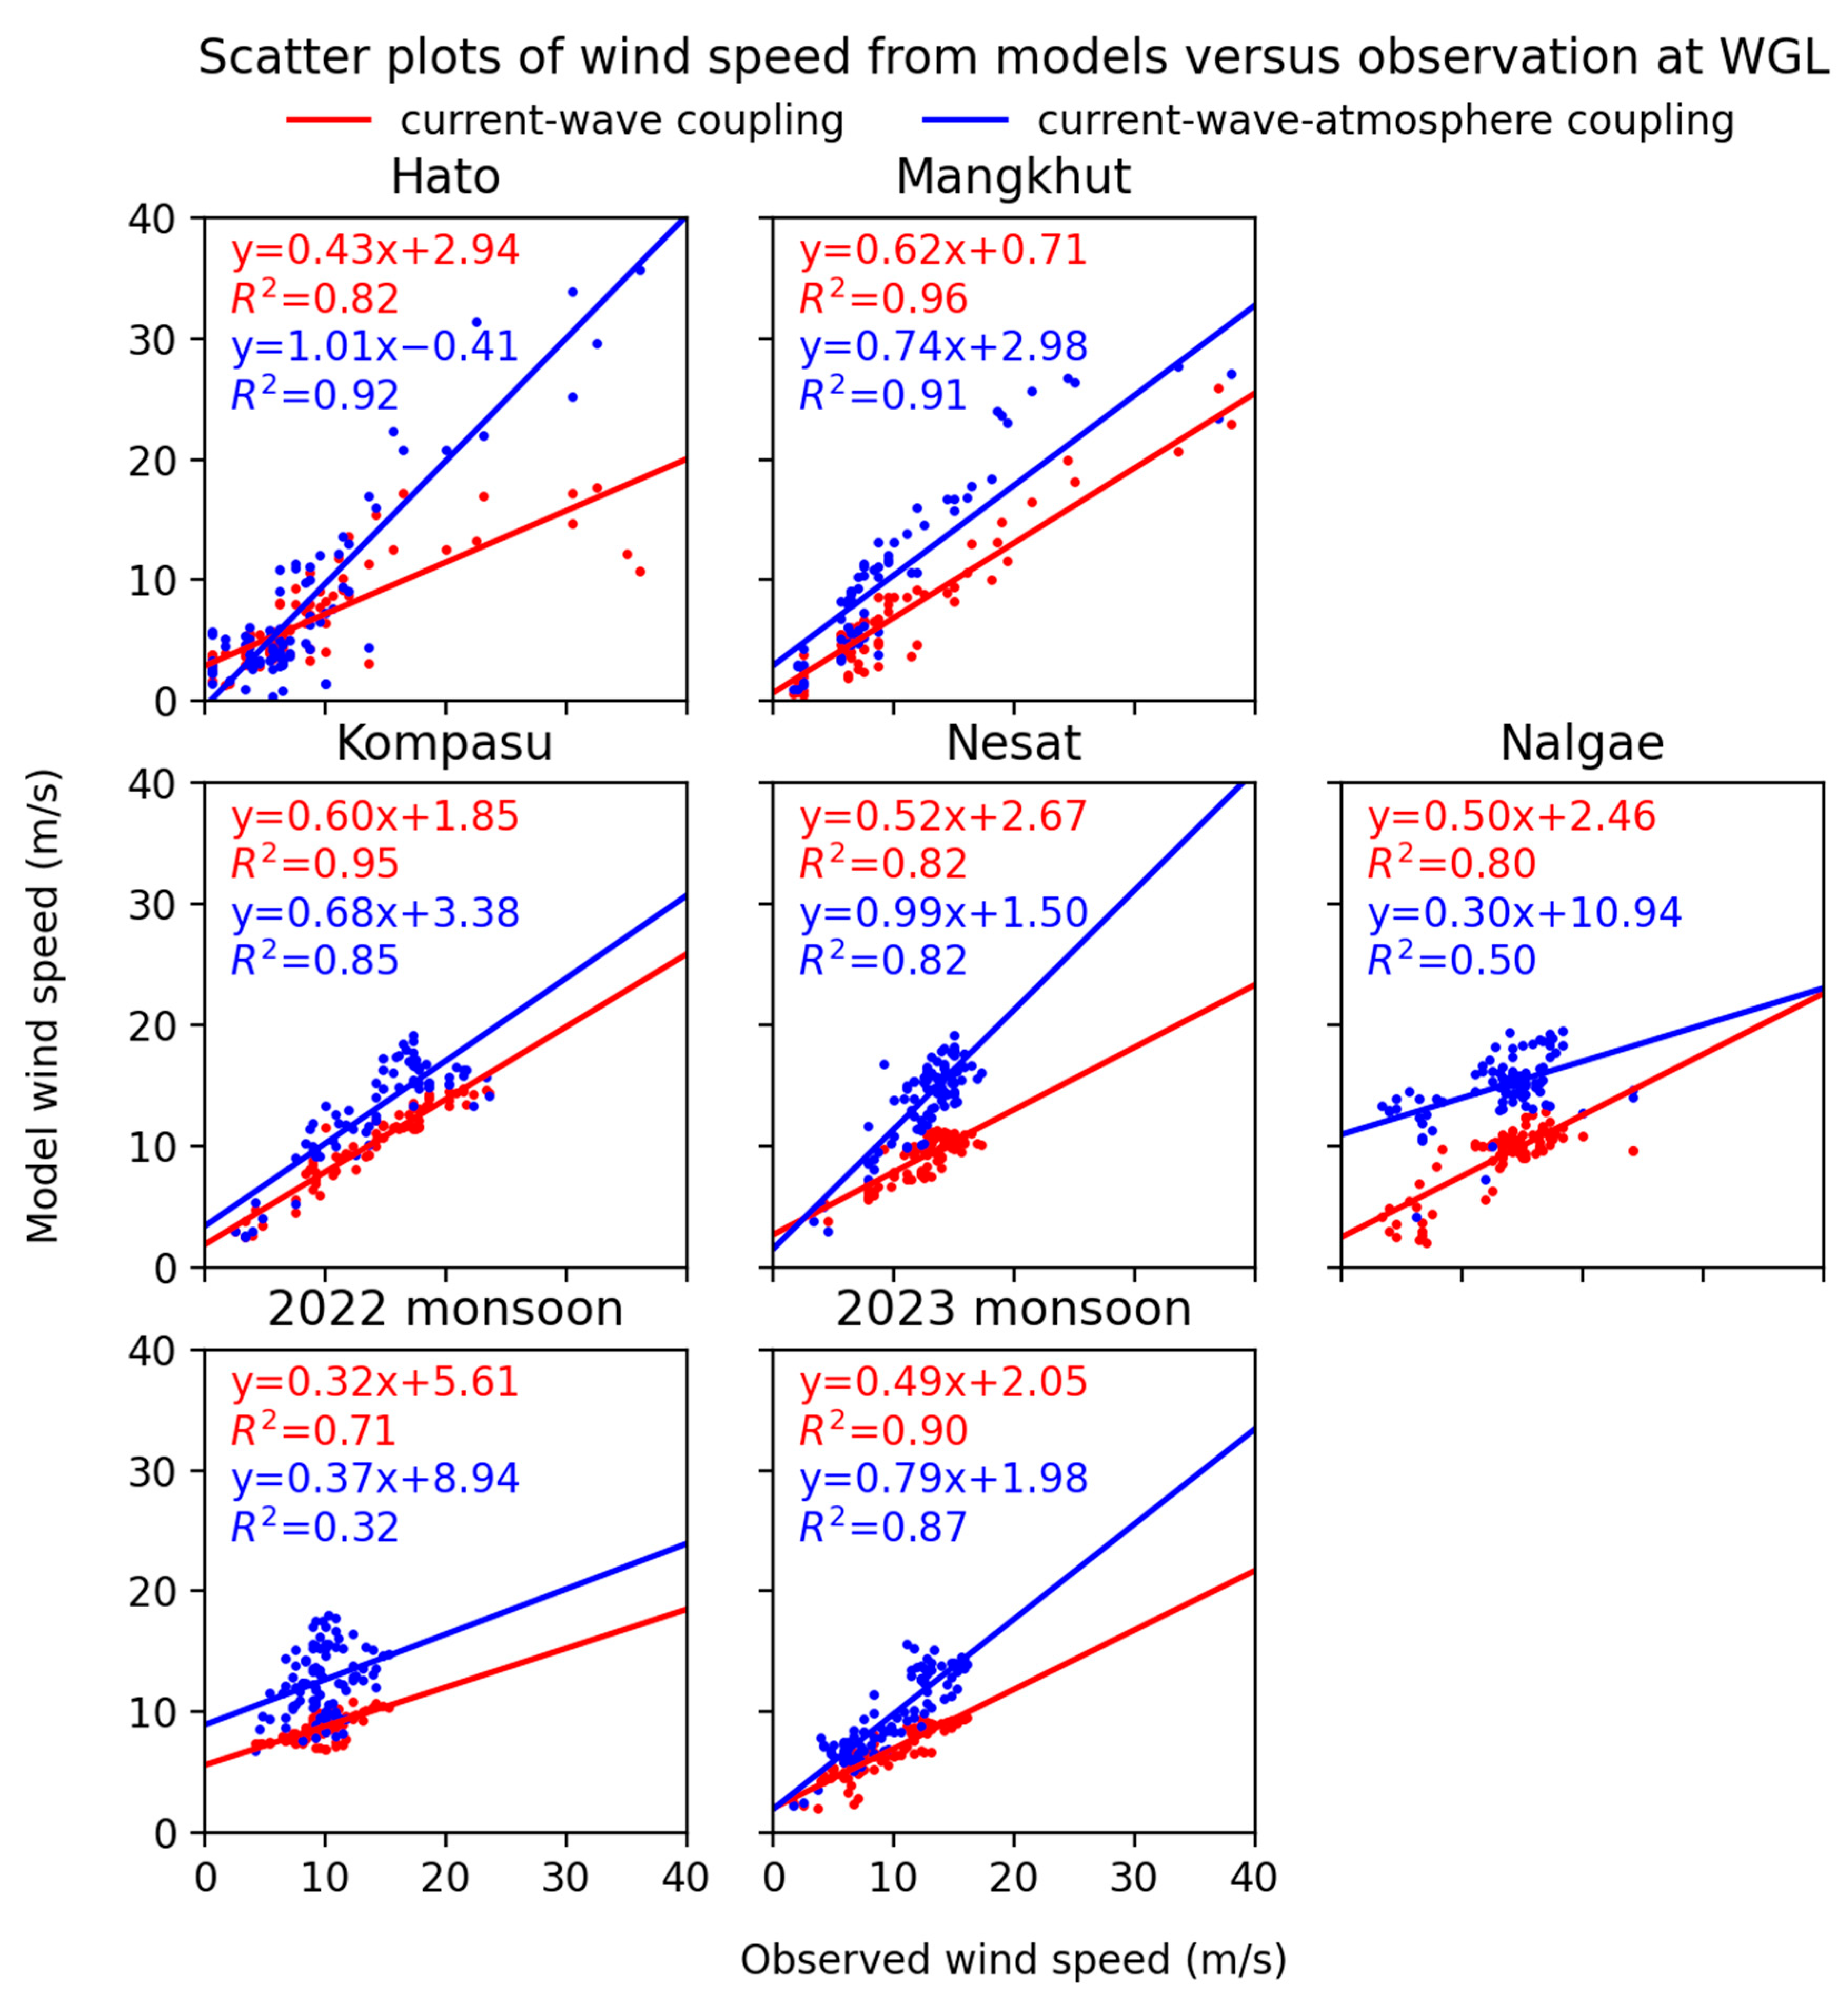
- Hato: Although the two-way coupling model simulation significantly overestimated the minimum central pressure of the TC, it described the mean sea level pressure at WGL rather well, with a minimum of 988 hPa which was closer to the observed value of 982 hPa as compared with the prediction of 971 hPa from the three-way coupling model simulation. The discrepancy between the three-way coupling model and the observation may be due to the slightly eastward-deviated track from the atmospheric model. Consistent with the low bias on TC intensity, the two-way coupling simulation also significantly underestimated the maximum observed 10 m wind speed at WGL. While the wind speed from the two-way coupling simulation has an acceptable R2 with a value of 0.82 as compared with the observation, it has a negative bias of 1.7 m/s and an RSME of 5.1 m/s. Comparatively, as listed in Table 4, the R2, bias and RSME from the three-way coupling model were 0.92, −0.3 m/s and 3.3 m/s, respectively. The maximum wind speed in the two-way coupling of 17.7 m/s was much lower than the observed value of 32.5 m/s, while that in the three-way coupling was 33.9 m/s, which just differed slightly from the observed value. The results indicated that the three-way coupling simulation outperformed the two-way coupling simulation in capturing the surface meteorological conditions at WGL;
- (ii)
- Mangkhut: The minimum mean sea level pressure at WGL in the two-way and the three-way coupling simulation were 976 hPa and 994 hPa, respectively, being 1 hPa and 19 hPa higher than the observed value of 975 hPa. The minimum observed mean sea level pressure at WGL was well captured by the two-way simulation. However, given that both two-way and three-way coupling simulations gave a high R2 on wind speed, neither two-way nor three-way coupling simulations reproduced the maximum observed 10 m wind speed of 42.5 m/s at WGL. Their maximum values were 26.6 m/s and 29.3 m/s, corresponding to an underestimation of 37.5% and 31.2%. While the three-way coupling simulation gave an overall bias of +0.2 m/s on wind speed, which was smaller than −3.5 m/s from the two-way dataset, the RMSE of 5.2 m/s for two-way and 4.0 m/s for three-way were rather large in both simulations. Nevertheless, their wind directions generally agreed with the observation;
- (iii)
- Kompasu, Nesat, Nalgae: As the TC evolution in both simulations agreed with the best track data, the ERA5 dataset generally performed better in the two-way coupling for depicting changes in mean sea level pressure. It also has a higher correlation with the observations of 10 m wind speed. However, due to persistent underestimation in wind speed by the ERA5 dataset, likely due to coarser resolution, outputs from the three-way coupling model generally outperformed in describing the 10 m wind speed at WGL. However, neither the wind field in the two-way coupling nor the three-way coupling simulation could capture the sudden increase in wind speed around forecast hour 50 for Kompasu and around forecast hour 75 for Nalgae. Nevertheless, wind directions in both two-way and three-way coupling simulations were consistent with the observation, except for the last 24 h for TC Nalgae, in which the three-way coupling simulation failed to reproduce TC landfall near Hong Kong. Hence, the change in wind direction was not well captured;
- (iv)
- Monsoon cases in February 2022: While the ERA5 dataset could provide a reasonable description of the surface meteorological conditions at weather station WGL, the three-way coupling model failed to predict the increase in mean sea level pressure and the decrease in 10 m wind speed around forecast hour 30. The wind speed in the three-way coupling simulation at WGL has a coefficient of determination R2 of 0.32, which is much lower than that of the ERA5 dataset (R2 = 0.71). Its bias of +2.9 m/s and RMSE of 4.1 m/s was also larger than that of −0.9 m/s and 1.9 m/s, respectively, from the ERA5 dataset;
- (v)
- Monsoon case in February 2023: The surface meteorological fields predicted by the three-way coupling simulation were consistent with those interpolated from the ERA5 dataset and the observation. In particular, the three-way coupling model outperformed the ERA5 dataset in producing a wind speed closer to the observation. The bias and RSME from the three-way coupling simulation were −0.1 m/s and 1.8 m/s, respectively, which were smaller than those from the ERA5 dataset, −2.9 m/s and 3.6 m/s. The wind speed at WGL from both two-way and three-way coupling simulations has a high coefficient of determination of 0.90 and 0.87, respectively, as compared with the observation.
3.3. Comparison with Sea Level at Various Tide Stations
- (i)
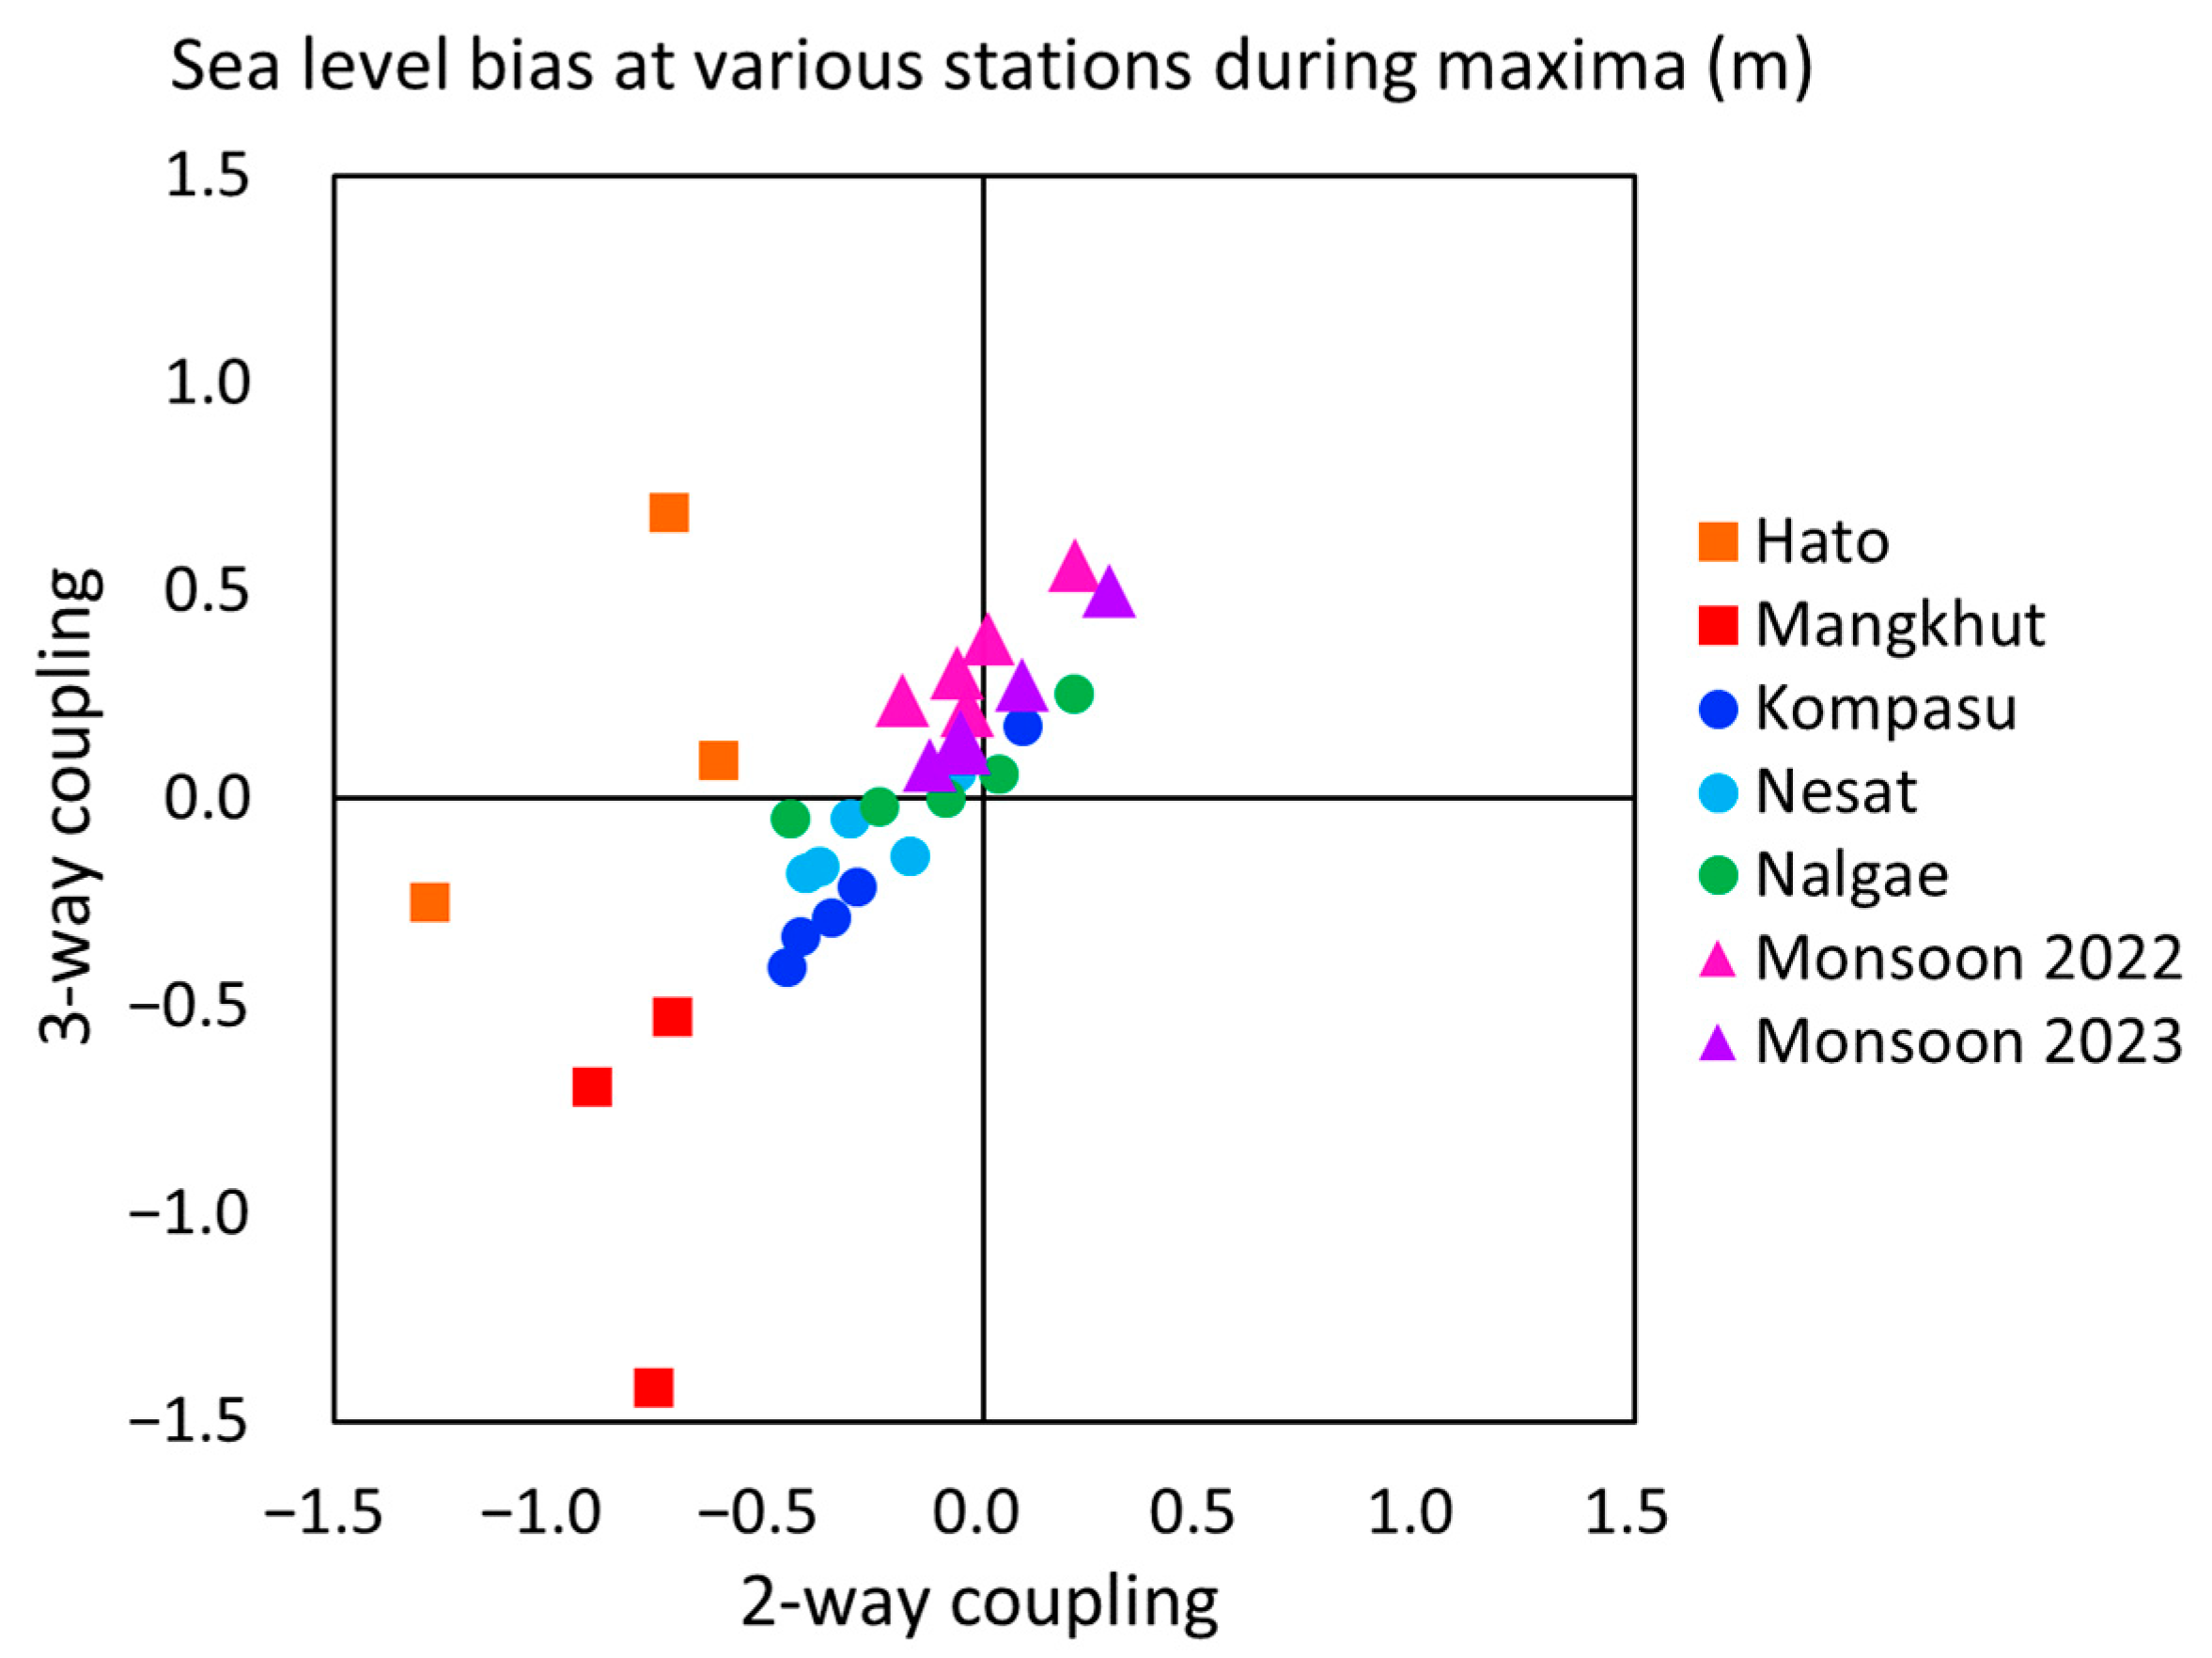
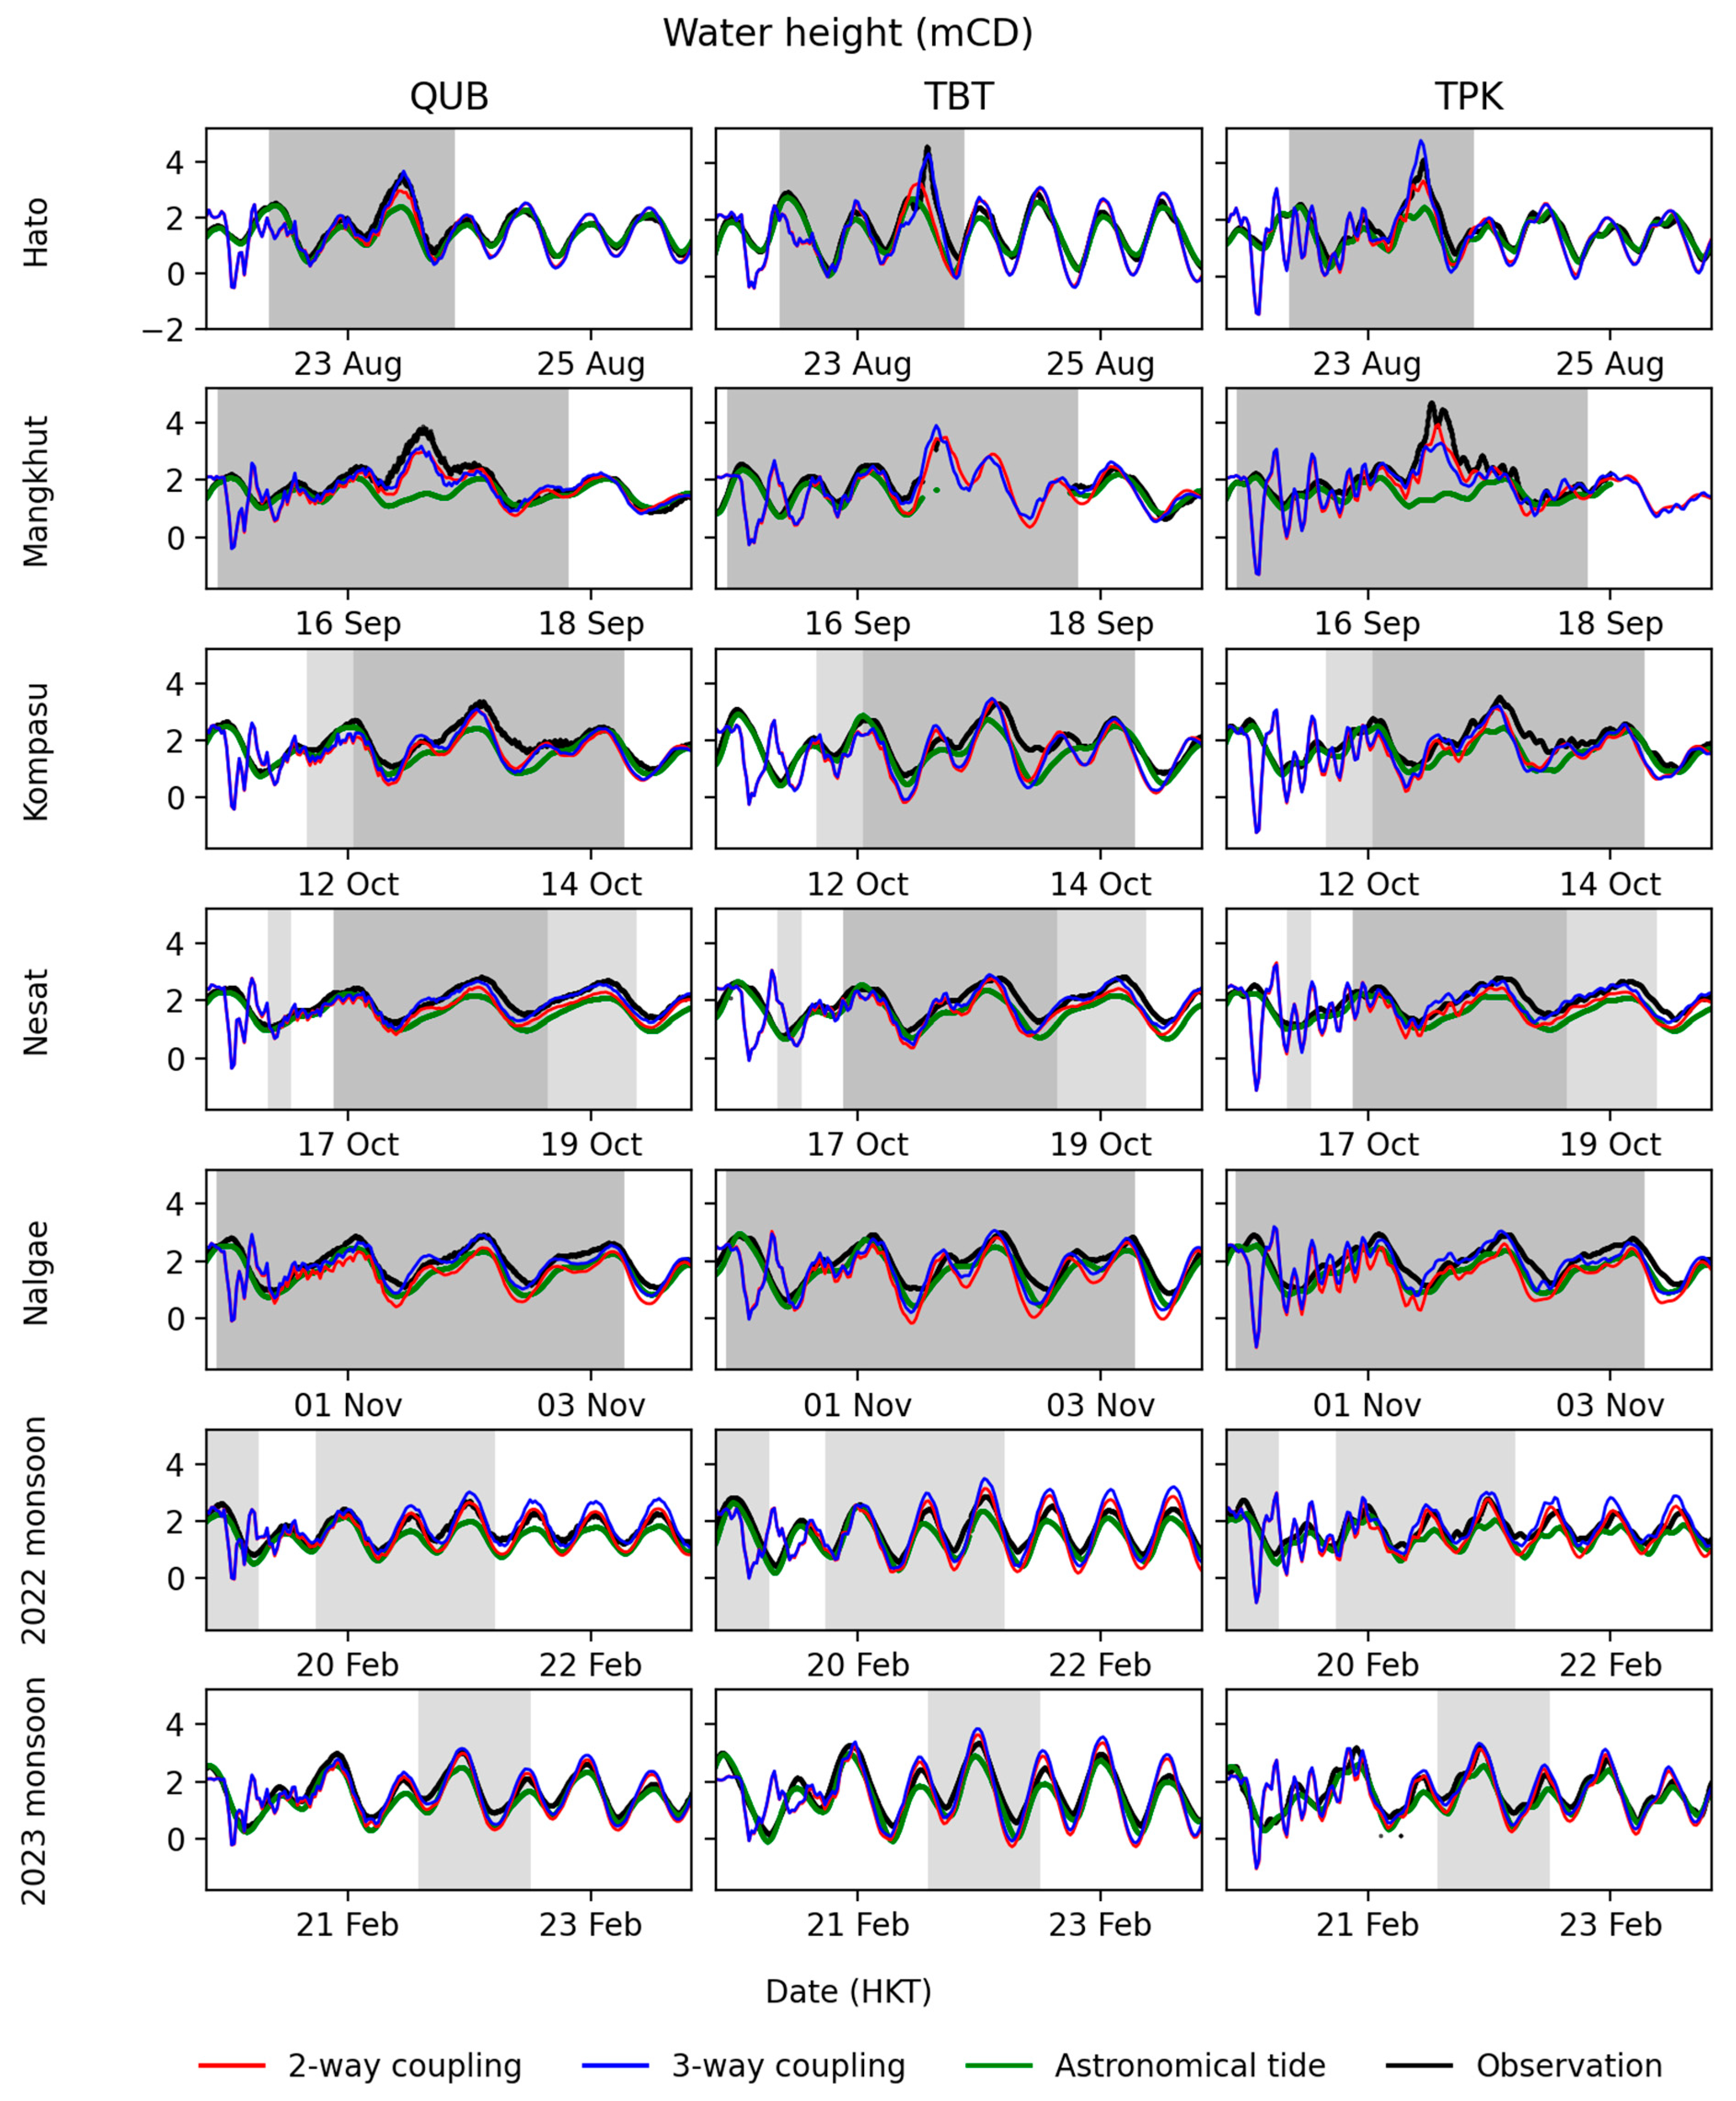
- Hato: The predicted sea levels from both runs were highly correlated with the observations at all tide stations, with R2 from the three-way coupling simulation of 0.95 higher than that from the two-way coupling simulation of 0.91. The bias and RSME were −0.21 m and 0.40 m, respectively, for the two-way coupling simulation and −0.14 m and 0.37 m, respectively, for the three-way coupling simulation, suggesting that the sea level predictions from the three-way coupling simulation were closer to the actual values. While the two-way coupling simulation could reasonably predict the occurrence of the storm surge, the peak values were significantly underestimated with a mean bias of −0.87 m, noting that the mean bias of the three-way coupling simulation was only +0.18 m. With the remarkable improvement in capturing the peak values of sea levels in the tide stations, the results indicated that coupling with an atmospheric model could enhance the ability of the modelling system to simulate extreme storm surges. A time series plot of sea level during the passage of Hato is given in Figure 9. The fluctuations in water level in the first 24 h were likely related to the model spin-up problem. There were incomplete data in the tide observations due to the malfunction of tide gauges;
- (ii)
- Mangkhut: R2, bias and RMSE for the two-way coupling simulation and the three-way coupling simulation were all comparable in magnitude. Excluding data from those tide stations with incomplete observations, the mean bias of two-way coupling and three-way coupling were −0.80 m and −0.88 m, respectively, suggesting that both simulations poorly captured the storm surge induced by Mangkhut. The underprediction of water height in the two-way coupling simulation was likely due to the underestimation of wind speed in the ERA5 dataset, and relatively weak winds were incapable of pushing enough seawater onshore. Although a higher wind speed was simulated by WRF in the three-way coupling simulation, the westward deviation of the TC track caused weaker winds over Hong Kong and, thus, weaker storm surge in Hong Kong waters. Considering non-satisfactory model performance, an additional set of model simulations was conducted using three-way coupling but replacing the ERA5 reanalysis dataset at 0.25-degree resolution with the European Centre for Medium-Range Weather Forecasts (ECMWF) model forecast at 0.125-degree resolution. Besides, another set of model experiments using the WRF model in the two-way coupling with the same resolution as in the three-way coupling was conducted. The comparison results of peak sea level forecasts are given in Table 5. The average peak sea level forecast from the two-way coupling using the WRF standalone model was about 3% higher than that from the three-way coupling using the ERA5 dataset as the initial and boundary conditions for the WRF model. However, it was about 13% lower than that from the three-way coupling using 0.125-degree resolution ECMWF model data as the initial and boundary conditions. The peak sea level forecast from three-way coupling using higher resolution ECMWF data as initial and boundary conditions for downscaling by the WRF model performed much better, especially for the TPK tide station.
- (iii)
- Kompasu, Nesat, Nalgae: As summarised in Table 4, the R2 for both two-way coupling and three-way coupling simulations for the three TCs were around 0.9 as compared with the observations. Bias and RMSE from the two-way and the three-way coupling model simulations indicated that the predicted sea levels from the three-way coupling model were generally closer to observations than those from the two-way coupling model. The results suggested that while the three-way coupling model might not be able to reproduce the evolution and track of the TCs well, a more realistic description of the surface wind conditions near Hong Kong might have compensated somewhat and thus achieved better results in sea level predictions.
- (iv)
- Monsoon cases: The time series plots of sea level for the monsoon events in February 2022 and February 2023 can be found in Figure 9. As there was an underestimation in mean sea level pressure and an overestimation in the 10 m wind speed for the event in 2022, reasonably, there was an overestimation in the monsoon-induced sea level anomaly, with a mean bias of −0.01 m and +0.34 m for two-way and three-way simulation, respectively. As for the monsoon event in 2023, the mean biases were +0.03 m and +0.22 m, respectively, indicating that both configurations could work well given reliable meteorological fields.
4. Discussion
4.1. Cases of Extreme Storm Surge
4.2. Cases of Storm Surge Under Combined Effect of TC and Northeast Monsoon
4.3. Northeast Monsoon Cases
5. Conclusions
Author Contributions
Funding
Institutional Review Board Statement
Informed Consent Statement
Data Availability Statement
Conflicts of Interest
References
- Lee, T.C.; Cheng, Y.Y. Typhoon 5–6. Hong Kong Observatory Blog on 3 April 2021. Available online: https://www.hko.gov.hk/en/blog/00000120.htm (accessed on 12 September 2024).
- Chen, J.L.; Wang, Z.Q.; Tam, C.Y.; Lau, N.C.; Lau, D.S.; Mok, H.Y. Impacts of climate change on tropical cyclones and induced storm surges in the Pearl River Delta region using pseudo-global-warming method. Sci. Rep. 2020, 10, 1965. [Google Scholar] [CrossRef]
- Stockdon, H.F.; Sallenger, A.H., Jr.; Holman, R.A.; Howd, P.A. A simple model for the spatially-variable coastal response to hurricanes. Marine Geol. 2007, 238, 1–20. [Google Scholar] [CrossRef]
- Stockdon, H.F.; Long, J.W.; Palmsten, M.L.; Westhuysen, A.V.D.; Doran, K.S.; Snell, R.J. Operational forecasts of wave-driven water levels and coastal hazards for US Gulf and Atlantic coasts. Commun. Earth Environ. 2023, 4, 169. [Google Scholar] [CrossRef]
- Birchler, J.J.; Palmsten, M.L.; Doran, K.S.; Karwandyar, S.; Pardun, J.M.; Oades, E.M.; Mulligan, R.P.; Whitehead-Zimmers, E.S. Skill assessment of a total water level and coastal change forecast during the landfall of a hurricane. Coast. Eng. 2024, 193, 104590. [Google Scholar] [CrossRef]
- Van der Meer, J.W.; Allsop, N.W.H.; Bruce, T.; De Rouck, J.; Kortenhaus, A.; Pullen, T.; Schüttrumpf, H.; Troch, P.; Zanuttigh, B.; EurOtop. Manual on Wave Overtopping of Sea Defences and Related Structures. An Overtopping Manual Largely Based on European Research, but for Worldwide Application, 2nd ed.; EurOtop: Frickenhausen, Germany, 2018; 304p, Available online: http://www.overtopping-manual.com/assets/downloads/EurOtop_II_2018_Final_version.pdf (accessed on 12 September 2024).
- Suzuki, T.; Altomare, C. Wave Interactions with Coastal Structures. J. Mar. Sci. Eng. 2022, 9, 1331. [Google Scholar] [CrossRef]
- Díaz-Carrasco, P.; Molines, J.; Gómez-Martín, M.E.; Medina, J.R. Neural Network calibration method for VARANS models to simulate wave-coastal structures interaction. Coast. Eng. 2024, 188, 104443. [Google Scholar] [CrossRef]
- Kohno, N.; Dube, S.K.; Entel, M.; Fakhruddin, S.H.M.; Greenslade, D.; Leroux, M.-D.; Rhome, J.; Thuy, N.B. Recent progress in storm surge forecasting. Trop. Cyclone Res. Rev. 2018, 7, 128–139. [Google Scholar] [CrossRef]
- Holland, G.J. An analytical model of the wind and pressure profiles in hurricanes. Mon. Weather Rev. 1980, 108, 1212–1218. [Google Scholar] [CrossRef]
- Jelesnianski, C.P.; Chen, J.; Shaffer, W.A. SLOSH: Sea, Lake, and Overland Surges from Hurricanes. In NOAA Technical Report; National Weather Service: Silver Spring, MD, USA, 1992; Volume 48, pp. 13–15. Available online: https://repository.library.noaa.gov/view/noaa/7235 (accessed on 12 September 2024).
- WMO. Guide to Storm Surge Forecasting. WMO-No.1076, 2011 Edition, 120p. Available online: https://library.wmo.int/viewer/28432/download?file=wmo_1076_en.pdf&type=pdf&navigator=1 (accessed on 12 September 2024).
- Katsafados, P.; Papadopoulos, A.; Korres, G.; Varlas, G. A fully coupled atmosphere–ocean wave modeling system for the Mediterranean Sea: Interactions and sensitivity to the resolved scales and mechanisms. Geosci. Model Dev. 2016, 9, 161–173. [Google Scholar] [CrossRef]
- Lok, C.C.F.; Chan, J.C.L.; Toumi, R. Importance of air-sea coupling in simulating tropical cyclone intensity at landfall. Adv. Atmos. Sci. 2022, 39, 1777–1786. [Google Scholar] [CrossRef]
- Sun, M.; Duan, Y.; Zhu, J.; Wu, H.; Zhang, J.; Huang, W. Simulation of Typhoon Muifa using a mesoscale coupled atmosphere-ocean model. Acta Oceanol. 2014, 33, 123–133. [Google Scholar] [CrossRef]
- Li, Z.; Tam, C.-Y.; Li, Y.; Lau, N.-C.; Chen, J.; Chan, S.T.; Lau, D.-S.D.; Huang, Y. How does air-sea wave interaction affect tropical cyclone intensity? An atmosphere-wave-ocean coupled model study based on Super Typhoon Mangkhut (2018). Earth Space Sci. 2022, 9, e2021EA002136. [Google Scholar] [CrossRef]
- Dietrich, J.C.; Muhammad, A.; Curcic, M.; Fathi, A.; Dawson, C.N.; Chen, S.S.; Luettich, R.A., Jr. Sensitivity of storm surge predictions to atmospheric forcing during Hurricane Isaac. J. Waterw. Port Coast. Ocean Eng. 2017, 144, 04017035. [Google Scholar] [CrossRef]
- Warner, J.C.; Armstrong, B.; He, R.; Zambon, J.B. Development of a Coupled Ocean-Atmosphere-Wave-Sediment Transport (COAWST) modeling system. Ocean Model. 2010, 35, 230–244. [Google Scholar] [CrossRef]
- Shchepetkin, A.F.; McWilliams, J.C. The regional oceanic modeling system (ROMS): A split-explicit, free-surface, topography-following-coordinate oceanic model. Ocean Model. 2005, 9, 347–404. [Google Scholar] [CrossRef]
- Tolman, H.L. A third-generation model for wind waves on slowly varying, unsteady, and inhomogeneous depths and currents. J. Phys. Oceanogr. 1991, 21, 782–797. [Google Scholar] [CrossRef]
- Booij, N.; Ris, R.C.; Holthuijsen, L.H. A third-generation wave model for coastal regions: 1. Model description and validation. J. Geophys. Res. Oceans 1999, 104, 7649–7666. [Google Scholar] [CrossRef]
- Skamarock, W.C.; Klemp, J.B.; Dudhia, J.; Gill, D.O.; Barker, D.M.; Duda, M.G.; Huang, X.-Y.; Wang, W.; Powers, H.G. A Description of the Advanced Research WRF Version 3; NCAR Technical Note 2008 NCAR/TN–475+STR; National Center for Atmospheric Research: Boulder, CO, USA, 2008; Available online: https://n2t.org/ark:/85065/d72n51q1 (accessed on 13 October 2024).
- Larson, J.; Jacob, R.; Ong, E. The Model Coupling Toolkit: A new Fortran90 toolkit for building Multiphysics parallel coupled models. Int. J. High Perform. Comput. App. 2005, 19, 277–292. [Google Scholar] [CrossRef]
- Amunugama, M.; Suzuyama, K.; Manawasekara, C.; Tanaka, Y.; Xia, Y. Typhoon-induced storm surge analysis with COAWST on different modelled forcing. J. Jpn. Soc. Civ. Eng. 2020, 76, I 210–I 215. [Google Scholar] [CrossRef]
- Drews, C.; Galarneau, T.J., Jr. Directional analysis of the storm surge from Hurricane Sandy 2012, with applications to Charleston, New Orleans, and the Philippines. PLoS ONE 2015, 10, e0122113. [Google Scholar] [CrossRef]
- Weatherall, P.; Tozer, B.; Arndt, J.E.; Bazhenova, E.; Bringensparr, C.; Castro, C.; Dorschel, B.; Drennon, H.; Ferrini, V.; Harper, H.; et al. The GEBCO_2021 Grid—A Continuous Terrain Model of the Global Oceans and Land; NERC EDS British Oceanographic Data Centre NOC: Liverpool, UK, 2021. [Google Scholar] [CrossRef]
- Egbert, G.D.; Svetlana, Y.E. Efficient inverse modeling of barotropic ocean tides. J. Atmos. Oceanic Technol. 2002, 19, 183–204. [Google Scholar] [CrossRef]
- de León, S.P.; Bettencourt, J.; Vledder, G.P.V.; Doohan, P.; Dias, F. Performance of WAVEWATCH-III and SWAN models in the North Sea. In Proceedings of the ASME 2018 37th International Conference on Ocean, Offshore and Arctic Engineering, Madrid, Spain, 17–22 June 2018. [Google Scholar] [CrossRef]
- Khaira, U.; Astitha, M. Exploring the real-time WRF forecast skill for four tropical storms, Isaias, Henri, Elsa and Irene, as they impacted the northeast United States. Remote Sens. 2023, 15, 3219. [Google Scholar] [CrossRef]
- Mesinger, F. Forecasting upper tropospheric turbulence within the framework of the Mellor-Yamada 2.5 closure. Res. Activ. Atmos. Oceanic Mod. 1993, 18, 4.28–4.29. [Google Scholar]
- Janjic, Z.I. The Step–Mountain Eta Coordinate Model: Further developments of the convection, viscous sublayer, and turbulence closure schemes. Mon. Weather Rev. 1994, 122, 927–945. [Google Scholar] [CrossRef]
- Taylor, P.K.; Yelland, M.J. The dependence of sea surface roughness on the height and steepness of the waves. J. Phys. Oceanogr. 2001, 31, 572–590. [Google Scholar] [CrossRef]
- Tiedtke, M. A comprehensive mass flux scheme for cumulus parametrization in large-scale models. Mon. Weather Rev. 1989, 117, 1779–1800. [Google Scholar] [CrossRef]
- Zhang, C.; Wang, Y.; Hamilton, K. Improved representation of boundary layer clouds over the Southeast Pacific in ARW-WRF using a modified Tiedtke cumulus parameterization scheme. Mon. Weather Rev. 2011, 139, 3489–3513. [Google Scholar] [CrossRef]
- Hersbach, H.; Bell, B.; Berrisford, P.; Hirahara, S.; Horányi, A.; Muñoz-Sabater, J.; Nicolas, J.; Peubey, C.; Radu, R.; Schepers, D.; et al. The ERA5 global reanalysis. Q. J. R. Meteorol. Soc. 2020, 146, 1999–2049. [Google Scholar] [CrossRef]
- Choy, C.W.; Lau, D.S.; He, Y. Super typhoons Hato and Mangkhut, part I: Analysis of maximum intensity and wind structure. Weather 2022, 77, 314–320. [Google Scholar] [CrossRef]
- Storm Surge Records in Hong Kong During the Passage of Tropical Cyclones. Available online: https://www.hko.gov.hk/en/wservice/tsheet/pms/stormsurgedb.htm?t=RANK&v=STORM_SURGE (accessed on 12 September 2024).
- Significant Storm Surge Events in Hong Kong Before 1954. Available online: https://www.hko.gov.hk/en/wservice/tsheet/pms/stormsurgedb_notes.htm (accessed on 12 September 2024).
- Thuy, N.B.; Tien, T.Q.; Wettre, C.; Hole, L.R. Monsoon-induced surge during high tides at the southeast coast of Vietnam: A numerical modeling study. Geosciences 2019, 9, 72. [Google Scholar] [CrossRef]
- Chan, P.-W.; Choy, C.-W.; Mak, B.; He, J. A rare tropical cyclone necessitating the issuance of gale or storm wind warning signal in Hong Kong in late autumn in 2022—Severe Tropical Storm Nalgae. Atmosphere 2023, 14, 170. [Google Scholar] [CrossRef]
- Biswas, M.K.; Stark, D.; Carson, L. GFDL Vortex Tracker Users’ Guide V3.9a. 2018. Available online: https://dtcenter.org/sites/default/files/community-code/gfdl/standalone_tracker_UG_v3.9a.pdf (accessed on 12 September 2024).
- Kong, W.; Lam, C.C.; Lau, D.S.; Chow, C.K.; Chong, S.N.; Chan, P.W. Model validation and applications of wave and current forecasts from the Hong Kong Observatory’s Operational Marine Forecasting System. Ocean Model. 2024, 190, 102393. [Google Scholar] [CrossRef]
- Han, Z.; Yue, C.; Liu, C.; Gu, W.; Tang, Y.; Li, Y. Evaluation on the applicability of ERA5 reanalysis dataset to tropical cyclones affecting Shanghai. Front. Earth Sci. 2022, 16, 1025–1039. [Google Scholar] [CrossRef]
- Hong, S.-Y.; Dudhia, J. Next-generation numerical weather prediction: Bridging parameterization, explicit clouds, and large eddies. Bull. Am. Meterol. Soc. 2012, 93, ES6–ES9. [Google Scholar] [CrossRef]
- Wang, R.; Qiao, F.; Liang, X.-Z.; Zhu, Y.; Zhang, H.; Li, Q.; Ding, Y. Role of convection representation across the gray zone in forecasting warm season extreme precipitation over Shanghai from two typical cases. Atmos. Res. 2021, 253, 105370. [Google Scholar] [CrossRef]
- Shepherd, T.J.; Walsh, K.J. Sensitivity of hurricane track to cumulus parameterization schemes in the WRF model for three intense tropical cyclones: Impact of convective asymmetry. Meteorol. Atmos. Phys. 2017, 129, 345–374. [Google Scholar] [CrossRef]
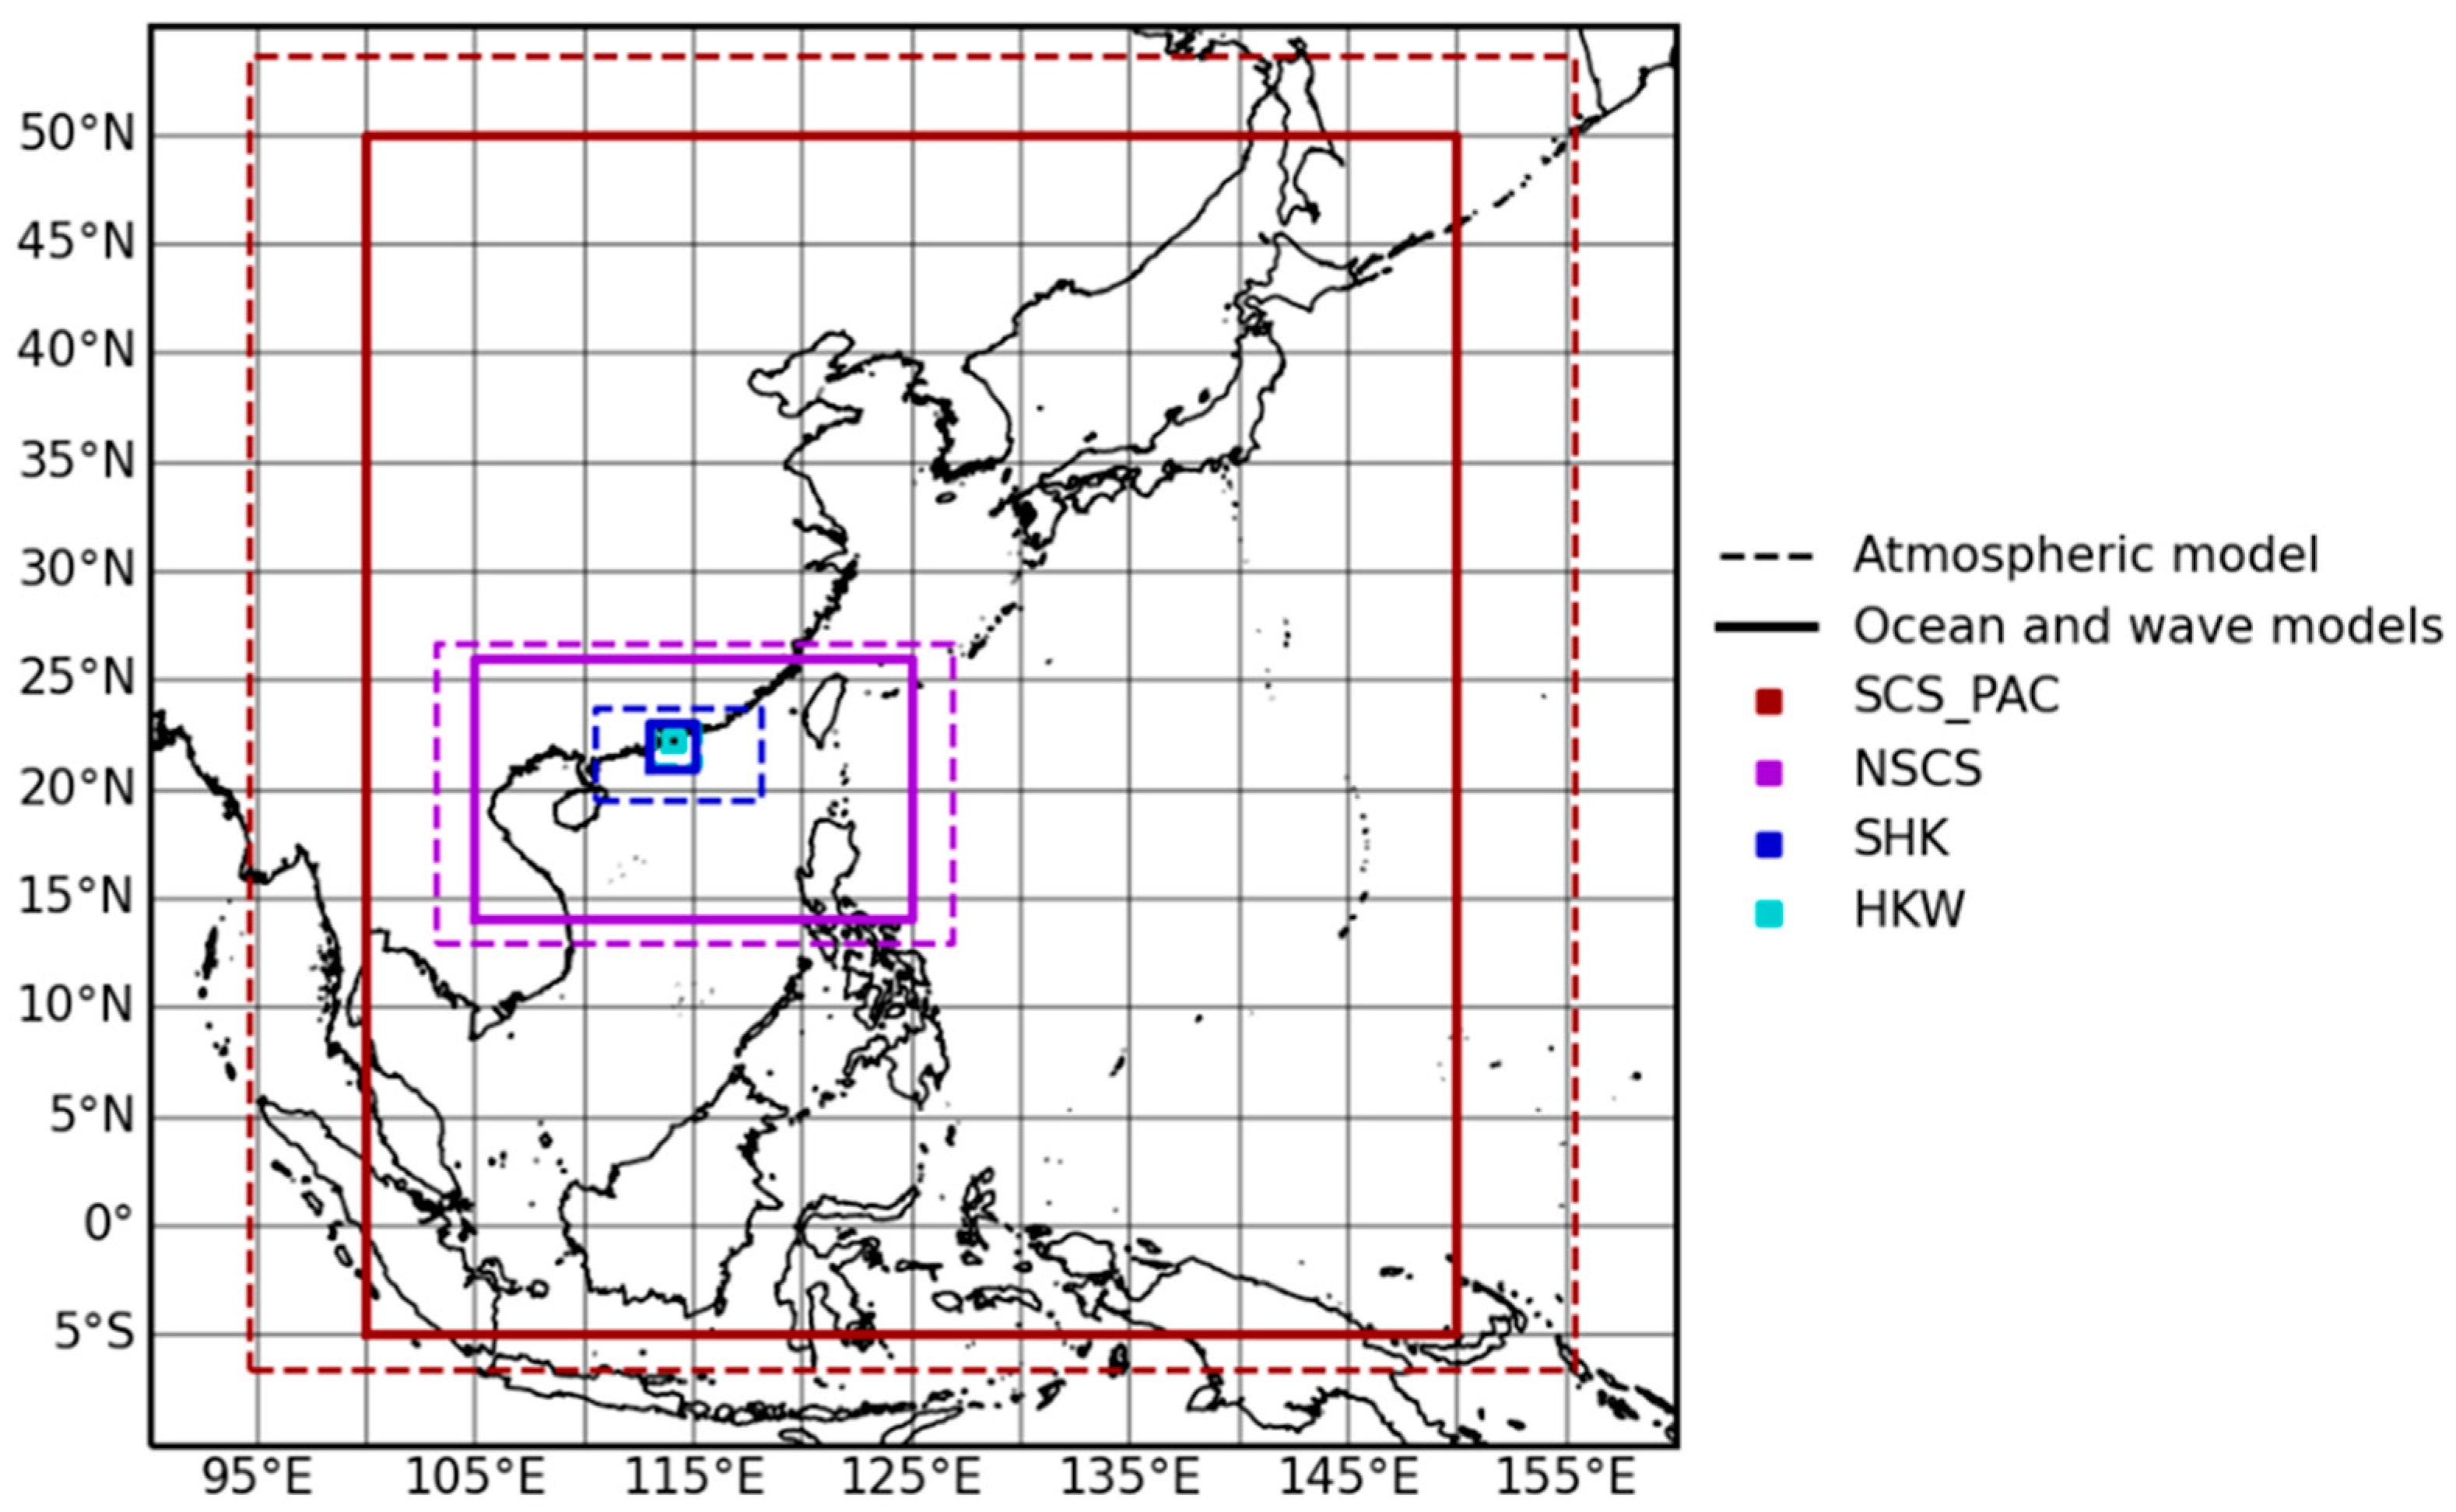


| Domain | SCS_PAC | NSCS | SHK (Nested in NSCS) | HKW (Nested in SHK) |
|---|---|---|---|---|
| Models used | ||||
| Atmospheric model | WRF | WRF | WRF | WRF |
| Ocean model | ROMS | ROMS | ROMS | ROMS |
| Wave model | WWIII | SWAN | SWAN | SWAN |
| Atmospheric model | ||||
| Latitude | 6.57° S–53.66° N | 12.98° N–26.72° N | 19.56° N–23.80° N | 21.11° N–23.08° N |
| Longitude | 94.62° E–155.38° E | 103.13° E–126.87° E | 110.47° E–118.09° E | 113.04° E–115.17° E |
| Number of grids | 216 × 250 | 250 × 155 | 241 × 145 | 202 × 202 |
| Vertical layers (sigma coordinate) | 48 | 48 | 48 | 48 |
| Horizontal Resolution (km) | 28 | 10 | 3.33 | 1.11 |
| Nesting refinement ratio | / | / | 3 | 3 |
| Ocean and wave model | ||||
| Latitude | 5° S–50° N | 14° N–26° N | 20.95° N–23.05° N | 21.82° N–22.63° N |
| Longitude | 100° E–150° E | 105° E–125° E | 112.95° E–115.05° E | 113.72° E–114.51° E |
| Number of grids | 201 × 221 | 241 × 145 | 127 × 127 | 237 × 242 |
| Vertical layers (sigma coordinate) | 30 | 30 | 30 | 30 |
| Resolution (km) | 27.75 | 9.25 | 1.85 | 0.37 |
| Nesting refinement ratio | / | / | 5 | 5 |
| Name | Intensity | Dates | Maximum Sea Level in Metres Above Chart Datum (Maximum Storm Surge Above Astronomical Tide in Metres) | ||||
|---|---|---|---|---|---|---|---|
| QUB | SPW | TBT | TMW | TPK | |||
| Cases of extreme storm surge | |||||||
| Hato | Super Typhoon | 20–24 August 2017 | 3.57 (1.18) | 3.91 * (1.54) | 4.56 (2.42) | 3.14 * (1.05) | 4.09 (2.42) |
| Mangkhut | Super Typhoon | 7–17 September 2018 | 3.88 (2.35) | 3.89 (2.34) | 4.18 * (2.58) | 4.19 * (2.77) | 4.71 (3.40) |
| Cases of the combined effect of TC and northeast monsoon | |||||||
| Kompasu | Typhoon | 8–14 October 2021 | 3.38 (1.13) | 3.38 (1.36) | 3.29 (1.27) | 3.48 (1.21) | 3.53 (1.16) |
| Nesat | Typhoon | 15–20 October 2022 | 2.84 (0.70) | 2.83 (0.71) | 2.80 (0.72) | 2.83 (0.76) | 2.81 (0.69) |
| Nalgae | Severe Tropical Storm | 26 October–3 November 2022 | 2.93 (0.65) | 2.99 (0.70) | 3.00 (0.70) | 2.95 (0.73) | 2.95 (0.69) |
| Cases of monsoon-induced sea level anomalies | |||||||
| / | / | 20–21 February 2022 | 2.72 (0.71) | 2.71 (0.66) | 2.88 (0.73) | 2.78 (0.83) | 2.80 (0.97) |
| / | / | 21 February 2023 | 3.03 (0.56) | 3.06 (0.55) | 3.34 (0.65) | 2.99 (0.58) | 3.25 (0.77) |
| TC | Minimum Central Pressure (hPa) | Maximum Sustained Wind (m/s) | ||||
|---|---|---|---|---|---|---|
| 2-Way | 3-Way | Best-Track | 2-Way | 3-Way | Best-Track | |
| Hato | 984 | 965 | 950 | 24.2 | 45.3 | 51.4 |
| Mangkhut | 955 | 946 | 900 | 32.9 | 59.7 | 69.4 |
| Kompasu | 977 | 981 | 970 | 24.7 | 33.4 | 33.4 |
| Nesat | 984 | 980 | 960 | 26.2 | 36.5 | 41.2 |
| Nalgae | 978 | 977 | 982 | 27.3 | 35.0 | 30.9 |
| Event | 10 m Wind (m/s) | Sea Level (m) | Peak Sea Level Bias (m) | |||||||||
|---|---|---|---|---|---|---|---|---|---|---|---|---|
| R2 | Bias | RSME | R2 | Bias | RSME | QUB | SPW | TBT | TMW | TPK | Mean | |
| Hato | 0.82 | −1.76 | 5.13 | 0.91 | −0.21 | 0.40 | −0.61 | / | −1.28 | / | −0.73 | −0.87 |
| 0.92 | −0.29 | 3.26 | 0.95 | −0.14 | 0.37 | +0.09 | / | −0.25 | / | +0.69 | +0.18 | |
| Mangkhut | 0.96 | −3.45 | 5.19 | 0.92 | −0.23 | 0.38 | −0.91 | −0.72 | / | / | −0.77 | −0.80 |
| 0.91 | +0.18 | 3.95 | 0.91 | −0.16 | 0.35 | −0.69 | −0.53 | / | / | −1.42 | −0.88 | |
| Kompasu | 0.95 | −3.85 | 4.47 | 0.88 | −0.38 | 0.49 | −0.36 | −0.29 | +0.09 | −0.46 | −0.42 | −0.29 |
| 0.85 | −1.13 | 2.93 | 0.85 | −0.32 | 0.47 | −0.28 | −0.21 | +0.17 | −0.40 | −0.33 | −0.21 | |
| Nesat | 0.82 | −3.47 | 3.82 | 0.92 | −0.34 | 0.38 | −0.38 | −0.31 | −0.03 | −0.41 | −0.17 | −0.26 |
| 0.82 | +1.34 | 2.28 | 0.90 | −0.12 | 0.23 | −0.16 | −0.05 | +0.11 | −0.18 | −0.14 | −0.08 | |
| Nalgae | 0.80 | −4.20 | 4.93 | 0.88 | −0.49 | 0.58 | −0.09 | −0.45 | +0.04 | −0.24 | +0.21 | −0.11 |
| 0.50 | +1.58 | 3.94 | 0.89 | −0.15 | 0.32 | +0.00 | −0.05 | +0.07 | −0.02 | +0.25 | +0.05 | |
| 2022 monsoon | 0.71 | −0.94 | 1.94 | 0.95 | −0.17 | 0.32 | −0.06 | +0.01 | +0.21 | −0.19 | −0.04 | −0.01 |
| 0.32 | +2.91 | 4.12 | 0.94 | +0.09 | 0.31 | +0.30 | +0.38 | +0.56 | +0.23 | +0.22 | +0.34 | |
| 2023 monsoon | 0.90 | −2.92 | 3.55 | 0.95 | −0.18 | 0.36 | −0.05 | +0.08 | +0.29 | −0.05 | −0.13 | +0.03 |
| 0.87 | −0.12 | 1.76 | 0.95 | −0.04 | 0.31 | +0.12 | +0.27 | +0.50 | +0.15 | +0.08 | +0.22 | |
| Tide Station | Peak Sea Levels During TC Mangkhut (mCD) | ||||
|---|---|---|---|---|---|
| 2-Way (ERA5) | 2-Way (WRF Standalone) | 3-Way (ERA5—WRF) | 3-Way (ECMWF—WRF) | Tide Gauge Observation | |
| QUB | 2.97 | 3.23 | 3.19 | 3.62 | 3.88 |
| SPW | 3.17 | 3.55 | 3.36 | 3.79 | 3.89 |
| TBT | 3.50 | 3.93 | 3.91 | 4.08 | 3.38 * |
| TMW | 3.28 | 3.28 | 3.17 | 4.04 | 4.19 * |
| TPK | 3.94 | 3.44 | 3.29 | 4.47 | 4.71 |
Disclaimer/Publisher’s Note: The statements, opinions and data contained in all publications are solely those of the individual author(s) and contributor(s) and not of MDPI and/or the editor(s). MDPI and/or the editor(s) disclaim responsibility for any injury to people or property resulting from any ideas, methods, instructions or products referred to in the content. |
© 2024 by the authors. Licensee MDPI, Basel, Switzerland. This article is an open access article distributed under the terms and conditions of the Creative Commons Attribution (CC BY) license (https://creativecommons.org/licenses/by/4.0/).
Share and Cite
Leung, N.-C.; Chow, C.-K.; Lau, D.-S.; Lam, C.-C.; Chan, P.-W. WRF-ROMS-SWAN Coupled Model Simulation Study: Effect of Atmosphere–Ocean Coupling on Sea Level Predictions Under Tropical Cyclone and Northeast Monsoon Conditions in Hong Kong. Atmosphere 2024, 15, 1242. https://doi.org/10.3390/atmos15101242
Leung N-C, Chow C-K, Lau D-S, Lam C-C, Chan P-W. WRF-ROMS-SWAN Coupled Model Simulation Study: Effect of Atmosphere–Ocean Coupling on Sea Level Predictions Under Tropical Cyclone and Northeast Monsoon Conditions in Hong Kong. Atmosphere. 2024; 15(10):1242. https://doi.org/10.3390/atmos15101242
Chicago/Turabian StyleLeung, Ngo-Ching, Chi-Kin Chow, Dick-Shum Lau, Ching-Chi Lam, and Pak-Wai Chan. 2024. "WRF-ROMS-SWAN Coupled Model Simulation Study: Effect of Atmosphere–Ocean Coupling on Sea Level Predictions Under Tropical Cyclone and Northeast Monsoon Conditions in Hong Kong" Atmosphere 15, no. 10: 1242. https://doi.org/10.3390/atmos15101242
APA StyleLeung, N.-C., Chow, C.-K., Lau, D.-S., Lam, C.-C., & Chan, P.-W. (2024). WRF-ROMS-SWAN Coupled Model Simulation Study: Effect of Atmosphere–Ocean Coupling on Sea Level Predictions Under Tropical Cyclone and Northeast Monsoon Conditions in Hong Kong. Atmosphere, 15(10), 1242. https://doi.org/10.3390/atmos15101242


