The year 2023 in Greece started with a mild winter and spring. Later on, several heat waves occurred, with very high air temperatures accompanied by extreme forest fires in many parts of the country. At the end of the summer, extreme precipitation events produced rain amounts which have been unknown before in Greece. The editorial wants to attract attention to the question if the summer of 2023 was just only a crazy summer or if it should be considered to be the new normal.
Greece has a Mediterranean climate, featuring mild and wet winters in the southern lowlands and islands, while the central and northern mountainous regions experience cold winters with significant snowfall. Summers are typically hot and dry throughout the country. The average temperature during summer (April to September) is around 24 °C in Athens and southern Greece, with cooler temperatures in the north. Generally, temperatures are higher in the southern part of the country. Rainfall is rare from June to August, with mostly sunny and dry days, except for occasional thunderstorms.
Table 1 provides the climatological normals (1991–2020) for the average seasonal mean, minimum, and maximum air temperatures, and precipitation in Greece based on historical data from the Climatic Research Unit (CRU) at the University of East Anglia, at a 0.5° × 0.5° (50 km × −50 km) resolution. Seasonal breezes, traveling 30–40 km inland penetration distances [
1,
2] in mountainous or complex coastlines against 80–100 km in flat with onshore prevailing winds [
3], often bring relief from the hot, dry weather. The mean annual temperature for the period 1991–2000 is higher compared to that of the period 1961–1990.
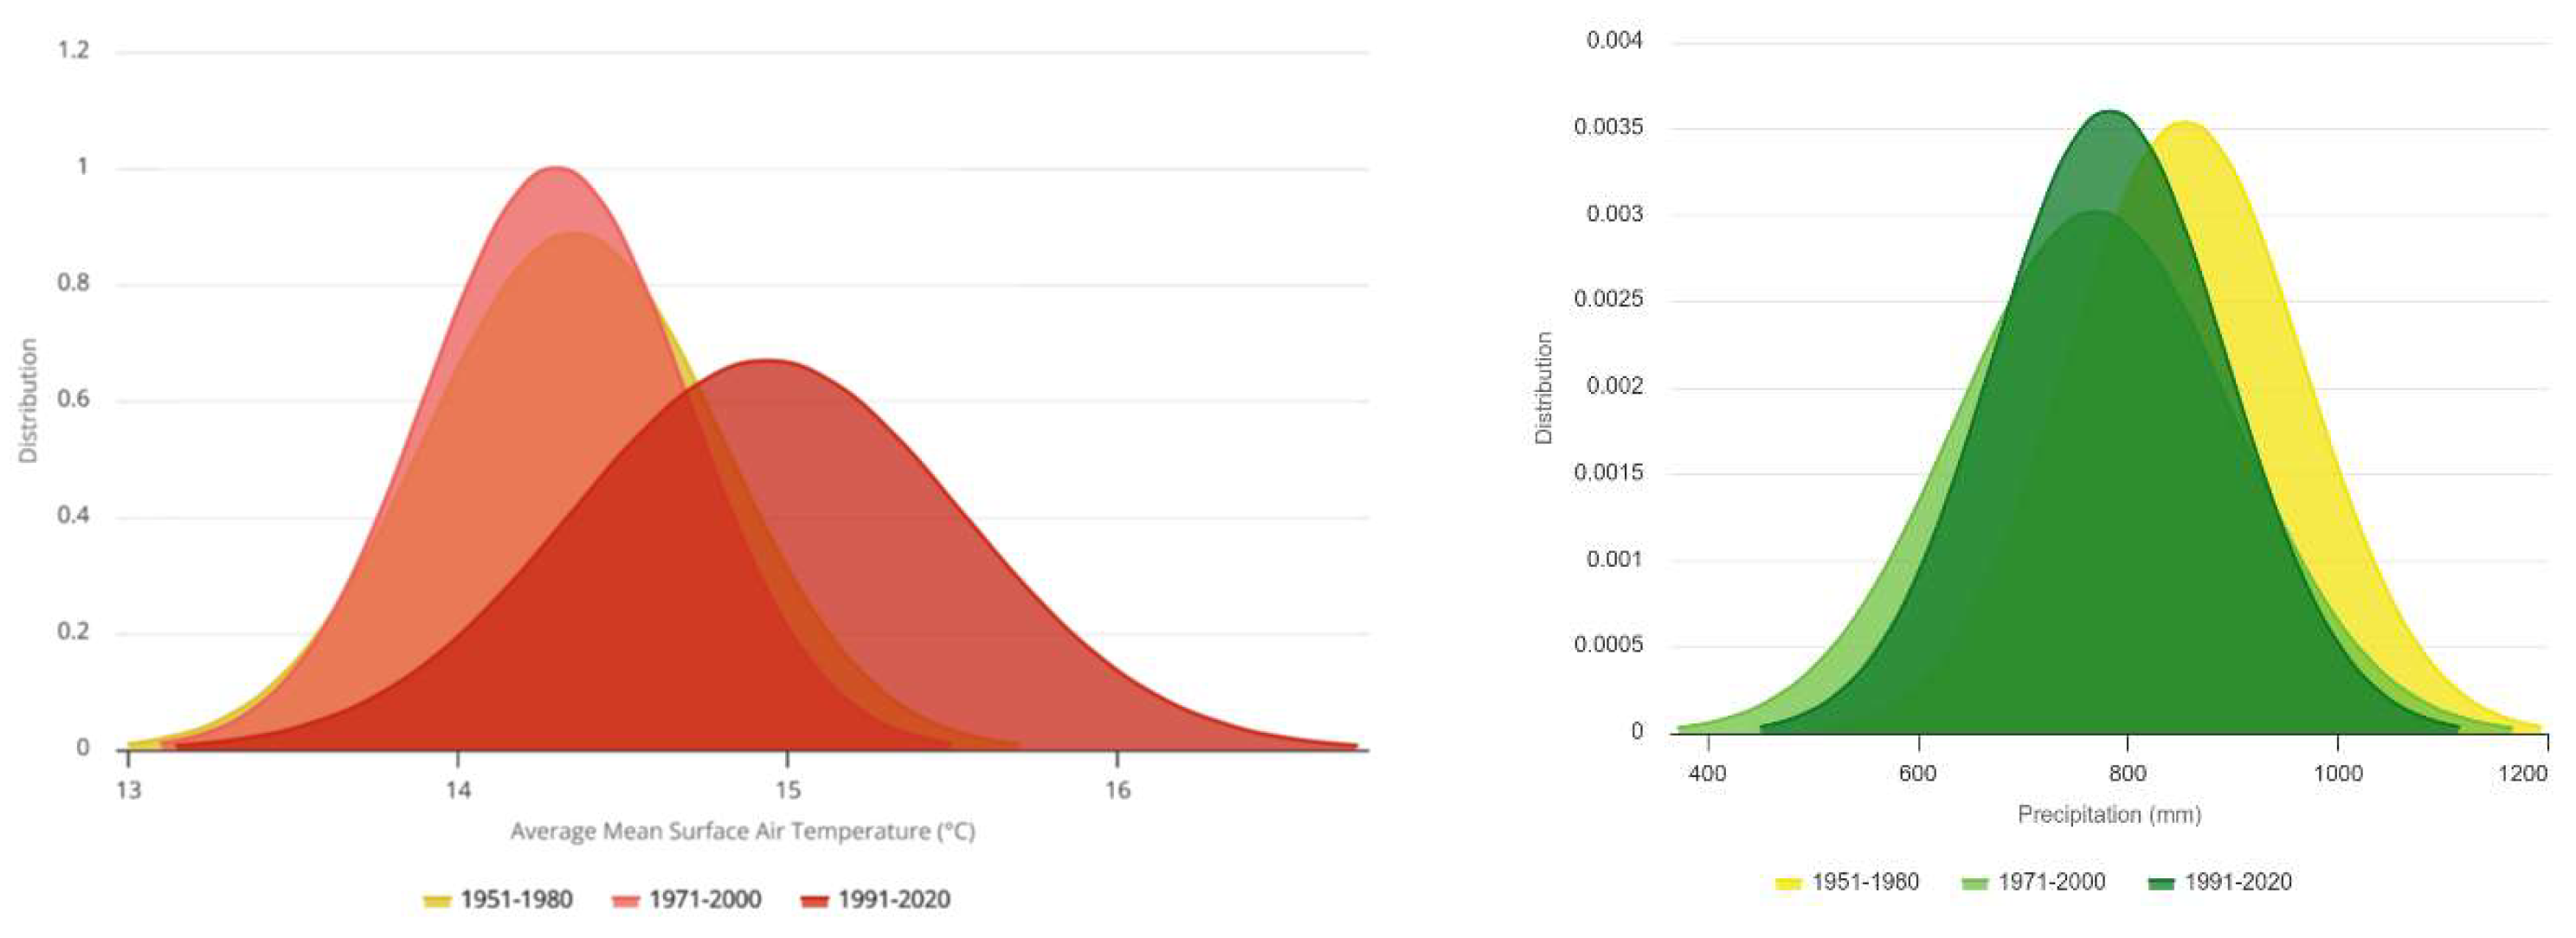
Typical summer conditions feature hot and dry weather from late May to September. To visualize the potential changes in climate patterns and their variability, we can compare successive climatology periods by analyzing the shifts in both the mean and the width of the distribution. Each bell-shaped curve represents a 30-year climatology interval, identifying trends, such as increasing average temperatures and the frequency of extreme temperature events. Concerning Greece, a shift towards hotter conditions, against an opposite shift to drier conditions, appears in the recent period 1991–2020 (
Figure 1).
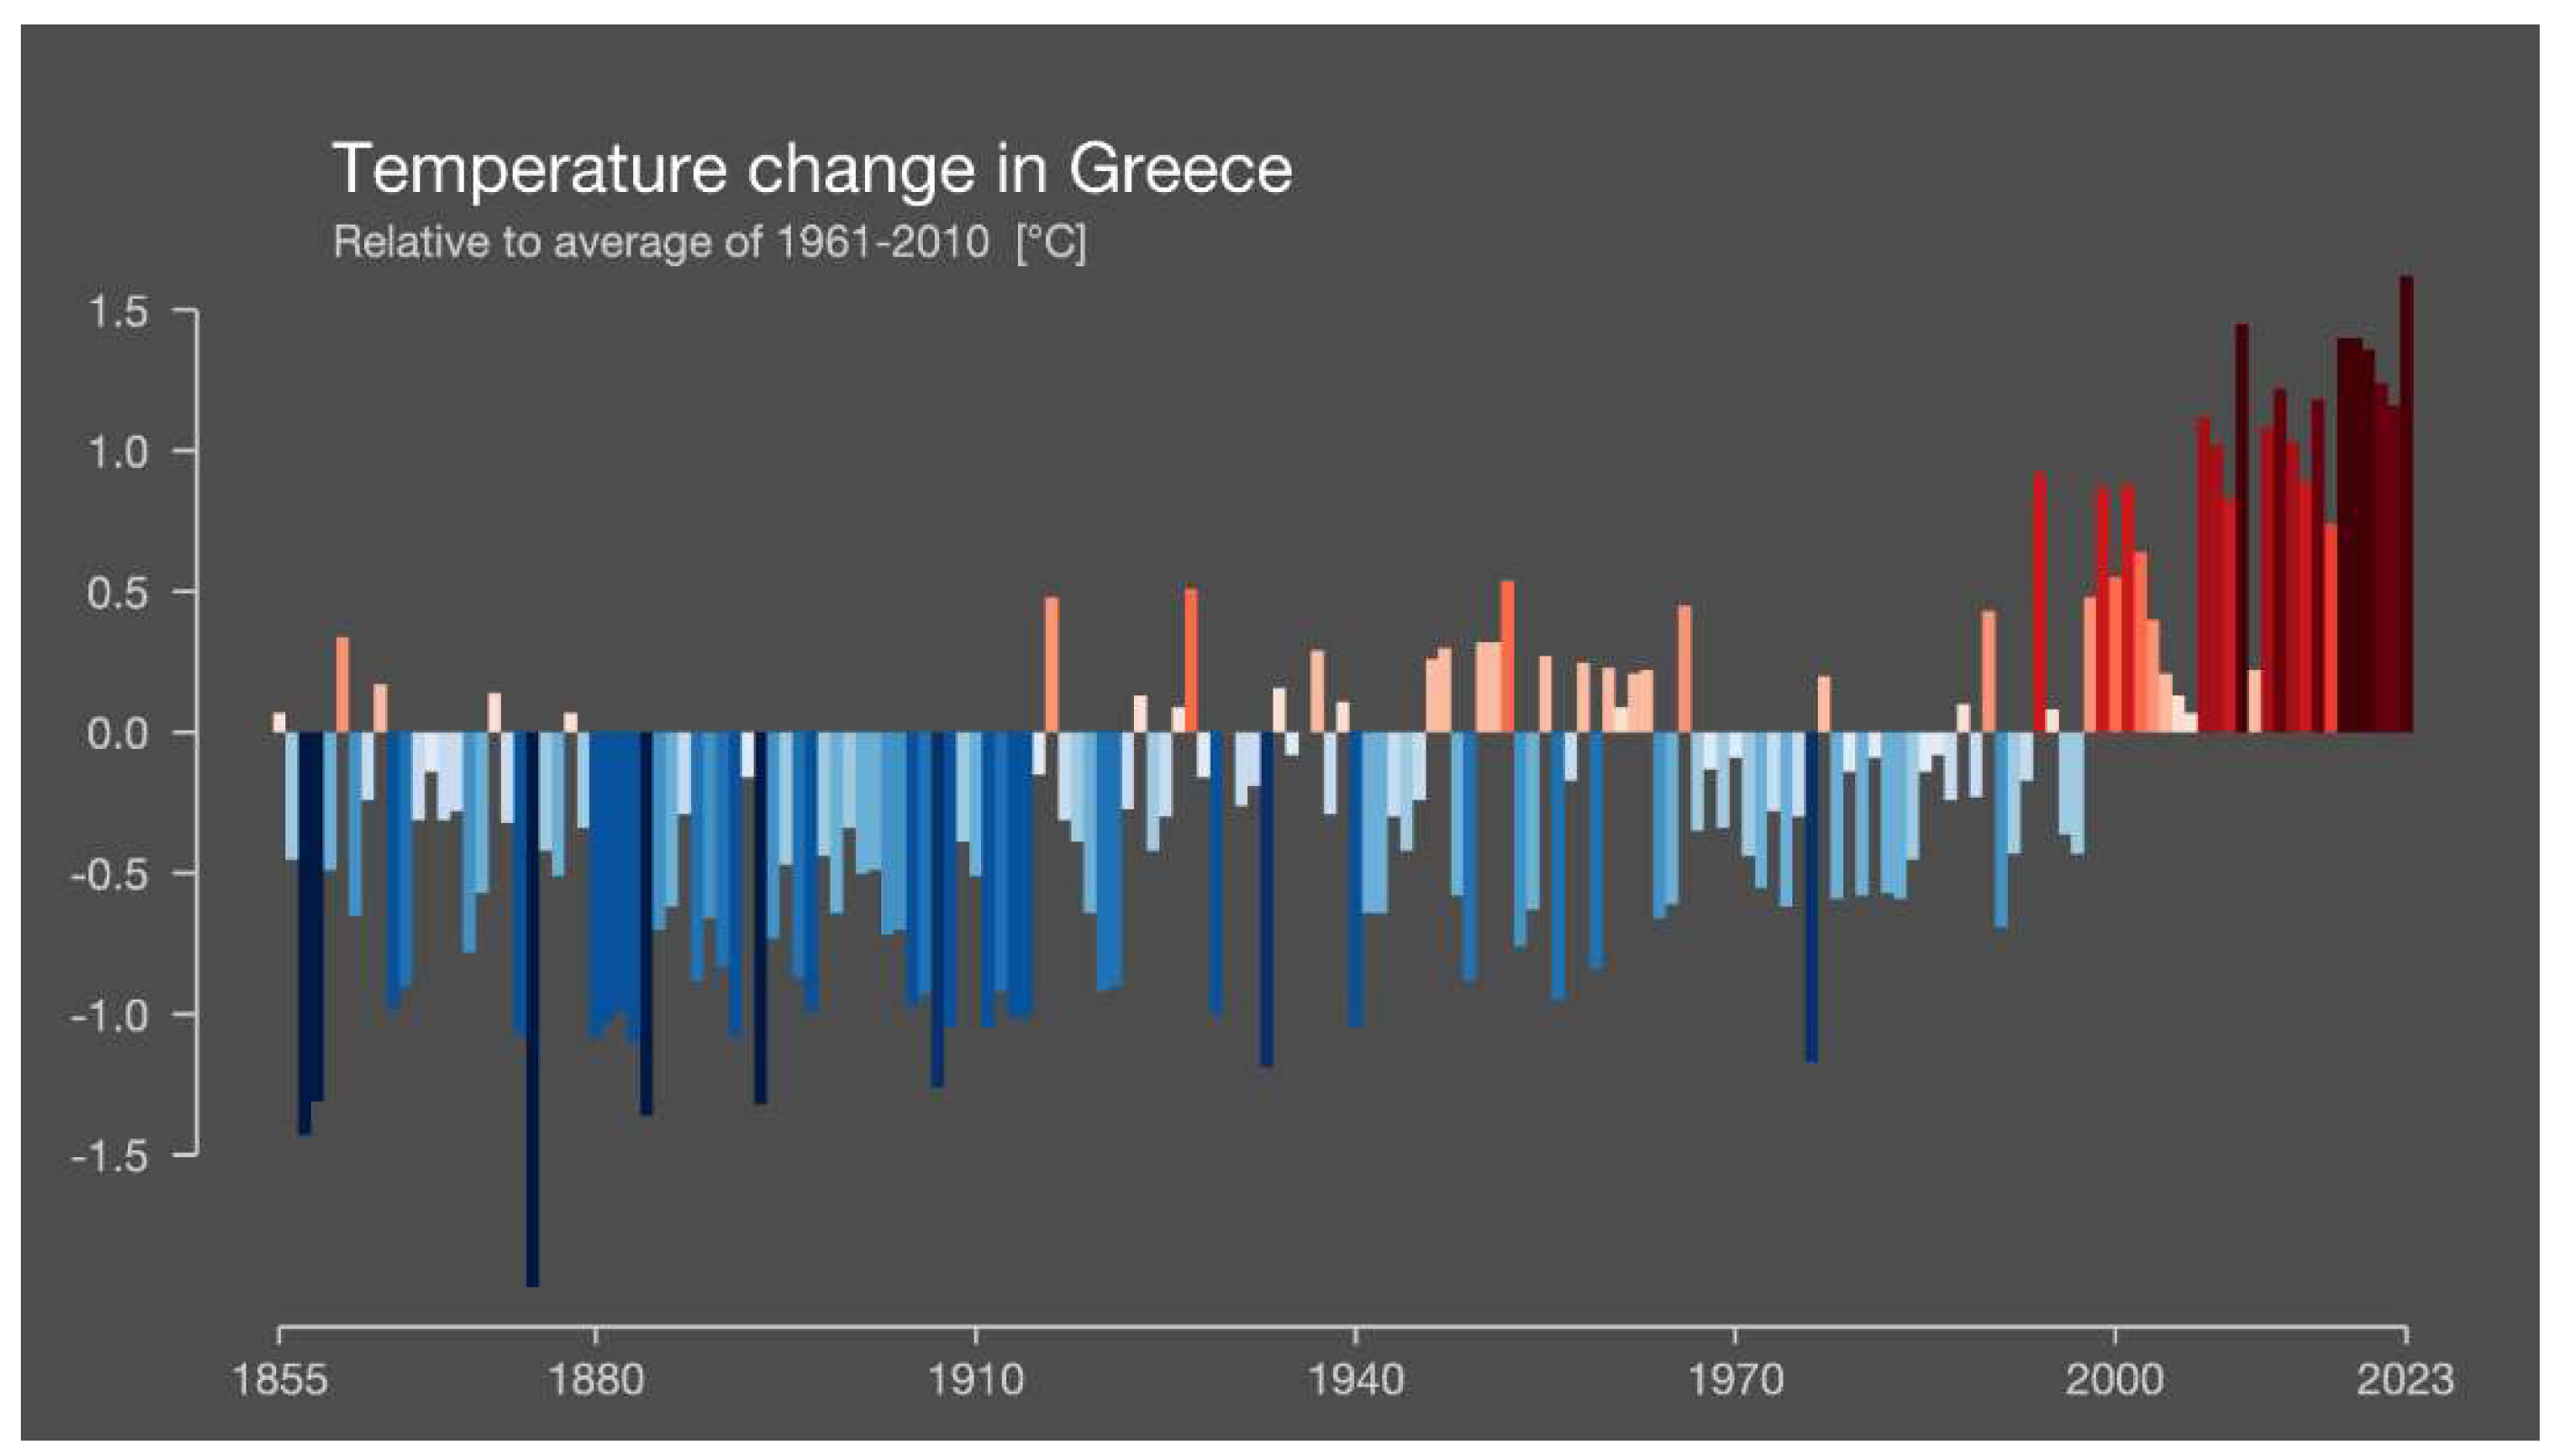
Air temperature change in Greece since 1855 has shown a significant upward trend, consistent with the global climate change patterns [
4]. Historical data indicate a gradual increase in average temperatures, particularly accelerating in the latter half of the 20th century (
Figure 2). This rise in temperature is attributed to a combination of natural variability and anthropogenic factors, such as increased greenhouse gas emissions. Greece has experienced more frequent and intense heatwaves, particularly in urban areas like Athens, exacerbated by the urban heat island effect [
5,
6,
7,
8,
9,
10,
11]. Seasonal variations have also shifted, with warmer winters and hotter, drier summers impacting agriculture, water resources, and biodiversity [
12].
Greece has experienced increasingly hotter conditions since 2007, relative to the average of 1961–2010 within the period 1855–2023. The annual air temperature anomaly reached 1.5 °C in 2023, hitting the threshold deemed safe by the Intergovernmental Panel on Climate Change (IPCC). This milestone underscores the urgency of achieving climate neutrality by the middle of the 21st century to mitigate further climate impacts. This goal is also included in the Paris Agreement on Climate, which was signed by 195 countries, including the EU. Heat waves and droughts are an issue and have increased in the perception of the Greek population since the heat wave of 1987, when about 4000 people died [
13]. Apart from the unprecedented heat wave of 1987, several heat waves with diverse effects have taken place since the middle of the 20th century (August 1958, July 1973, June and July 2007, and June–July 2017) and many studies have been carried out to quantify the effects of extreme weather phenomena on human health implications [
14,
15,
16,
17].
The issue of heat waves and their implications is not the only one which has been discussed in recent decades. Forest fires are also an emerging issue. During the end of the 1990s, climate change implications have been on the agenda in Greece. Climate change simulation results brought up several issues and discussions have been started about desertification, with the related effects on agriculture and also implications on tourism, which is a strong part of the economy. Conversely, informal development processes have resulted in major shifts in land use, with poor communication and minimal engagement of the local population in addressing the associated negative impacts, including climate change. The discussion about weather extremes and phenomena including climate change conditions and scenarios, was and is more emotional than pragmatic and mostly focusses on “who is responsible for reparation” and not what and how actions are to be taken. Abnormal or common records in the future climate of Greece have been documented in the analysis of the regional climate model simulations of extreme air temperature in Greece by Nastos and Kapsomenakis [
18].
The economic crisis in Greece has led to a “break” in the discussion about climate change. Several extreme situations, such as extreme rain, heat waves, and fires, have not been set appropriately on the governmental agenda and have not been appropriately discussed between authorities, the scientific community, and the general public. The issues were on the agenda of the governments and population, but something lies in “stand-by mode”. Less attention has been paid to the frequency of extremes and the expected implications of climate change. Also, temporary attention has been paid (mostly in media in order to apply and use terms like climate crisis) but only for extremes with high damage to infrastructures and the loss of human life.
Usually, after a mild winter and spring, the weather situation keeps being unstable at the beginning of a typical Greek summer as expected. Several heat waves occurred, and air temperature reached 45 °C, which is not extraordinary for the region, but such events tend to be more frequent and persistent in the future [
18]. As an exception, the year 2023 began with an unusually warm winter, with temperatures significantly above average. In Athens, January temperatures often reached 18 °C, much higher than the typical 7 °C to 13 °C. Ski resorts in regions like Mount Parnassus and Mount Pelion suffered from a severe lack of snowfall, impacting winter tourism and local economies. The warm winter also disrupted agricultural cycles, with crops like olive trees budding early and fruit trees experiencing reduced yields due to insufficient cold weather. Additionally, the lack of winter precipitation reduced mountain snowpacks, exacerbating drought conditions. After three consecutive years of La Niña, which typically brings cooler and drier conditions, El Niño returned in the spring of 2023, leading to significant global weather changes (
https://earthobservatory.nasa.gov/, accessed on 25 July 2024).
The summer of 2023 was marked by record-breaking heatwaves. In July, temperatures soared above 45 °C in several regions, including Athens and Thessaloniki. These extreme temperatures were not isolated events but persisted for extended periods, straining the country’s power grid as demand for air conditioning skyrocketed. The heat also exacerbated drought conditions, particularly in agricultural areas like Thessaly and Crete, where water shortages severely impacted crop yields. Olive and grape harvests, crucial to Greece’s economy, saw significant reductions, leading to financial losses for farmers and higher prices for consumers [
19,
20].
Rising temperatures played a significant role in causing droughts in order to develop the conditions for wildfires by the end of August 2023. One of the most devastating fires occurred in the Evros region, near the border with Turkey, where thousands of hectares of forest land were destroyed (
Figure 3) with the Evros fire being the largest recorded in Europe since 2000. The wildfire in the Dadia National Park, a biodiversity hotspot, resulted in the loss of critical habitats for numerous species. In addition, the fires forced the evacuation of several villages and caused significant damage to homes and infrastructure. The Greek government declared a state of emergency and called for international assistance to combat the blazes, highlighting the scale of the disaster.
August 2023 was the hottest August ever recorded, second only to July 2023 in terms of monthly global heat. The global mean surface air temperature reached 16.82 °C, exceeding the 1991–2020 August average by 0.71 °C and surpassing the previous record from August 2016 by 0.31 °C. This made the month approximately 1.5 °C hotter than the pre-industrial baseline from 1850 to 1900.
Much of Europe experienced temperatures well above the 1991–2020 climatological averages, with southern Europe enduring extreme heat. Countries from Portugal through France to Italy were particularly affected by heatwaves. These heatwaves extended to the other regions of the Northern Hemisphere, including the southern U.S. and Japan. Meanwhile, El Niño conditions continued to strengthen in the equatorial eastern Pacific, contributing to elevated marine air temperatures in several other areas worldwide. (
https://climate.copernicus.eu/surface-air-temperature-august-2023, accessed on 25 July 2024).
After the heat waves and the forest fires, which ended in August 2023, a new situation occurred in central continental Greece, which are usually normal for one or two years.
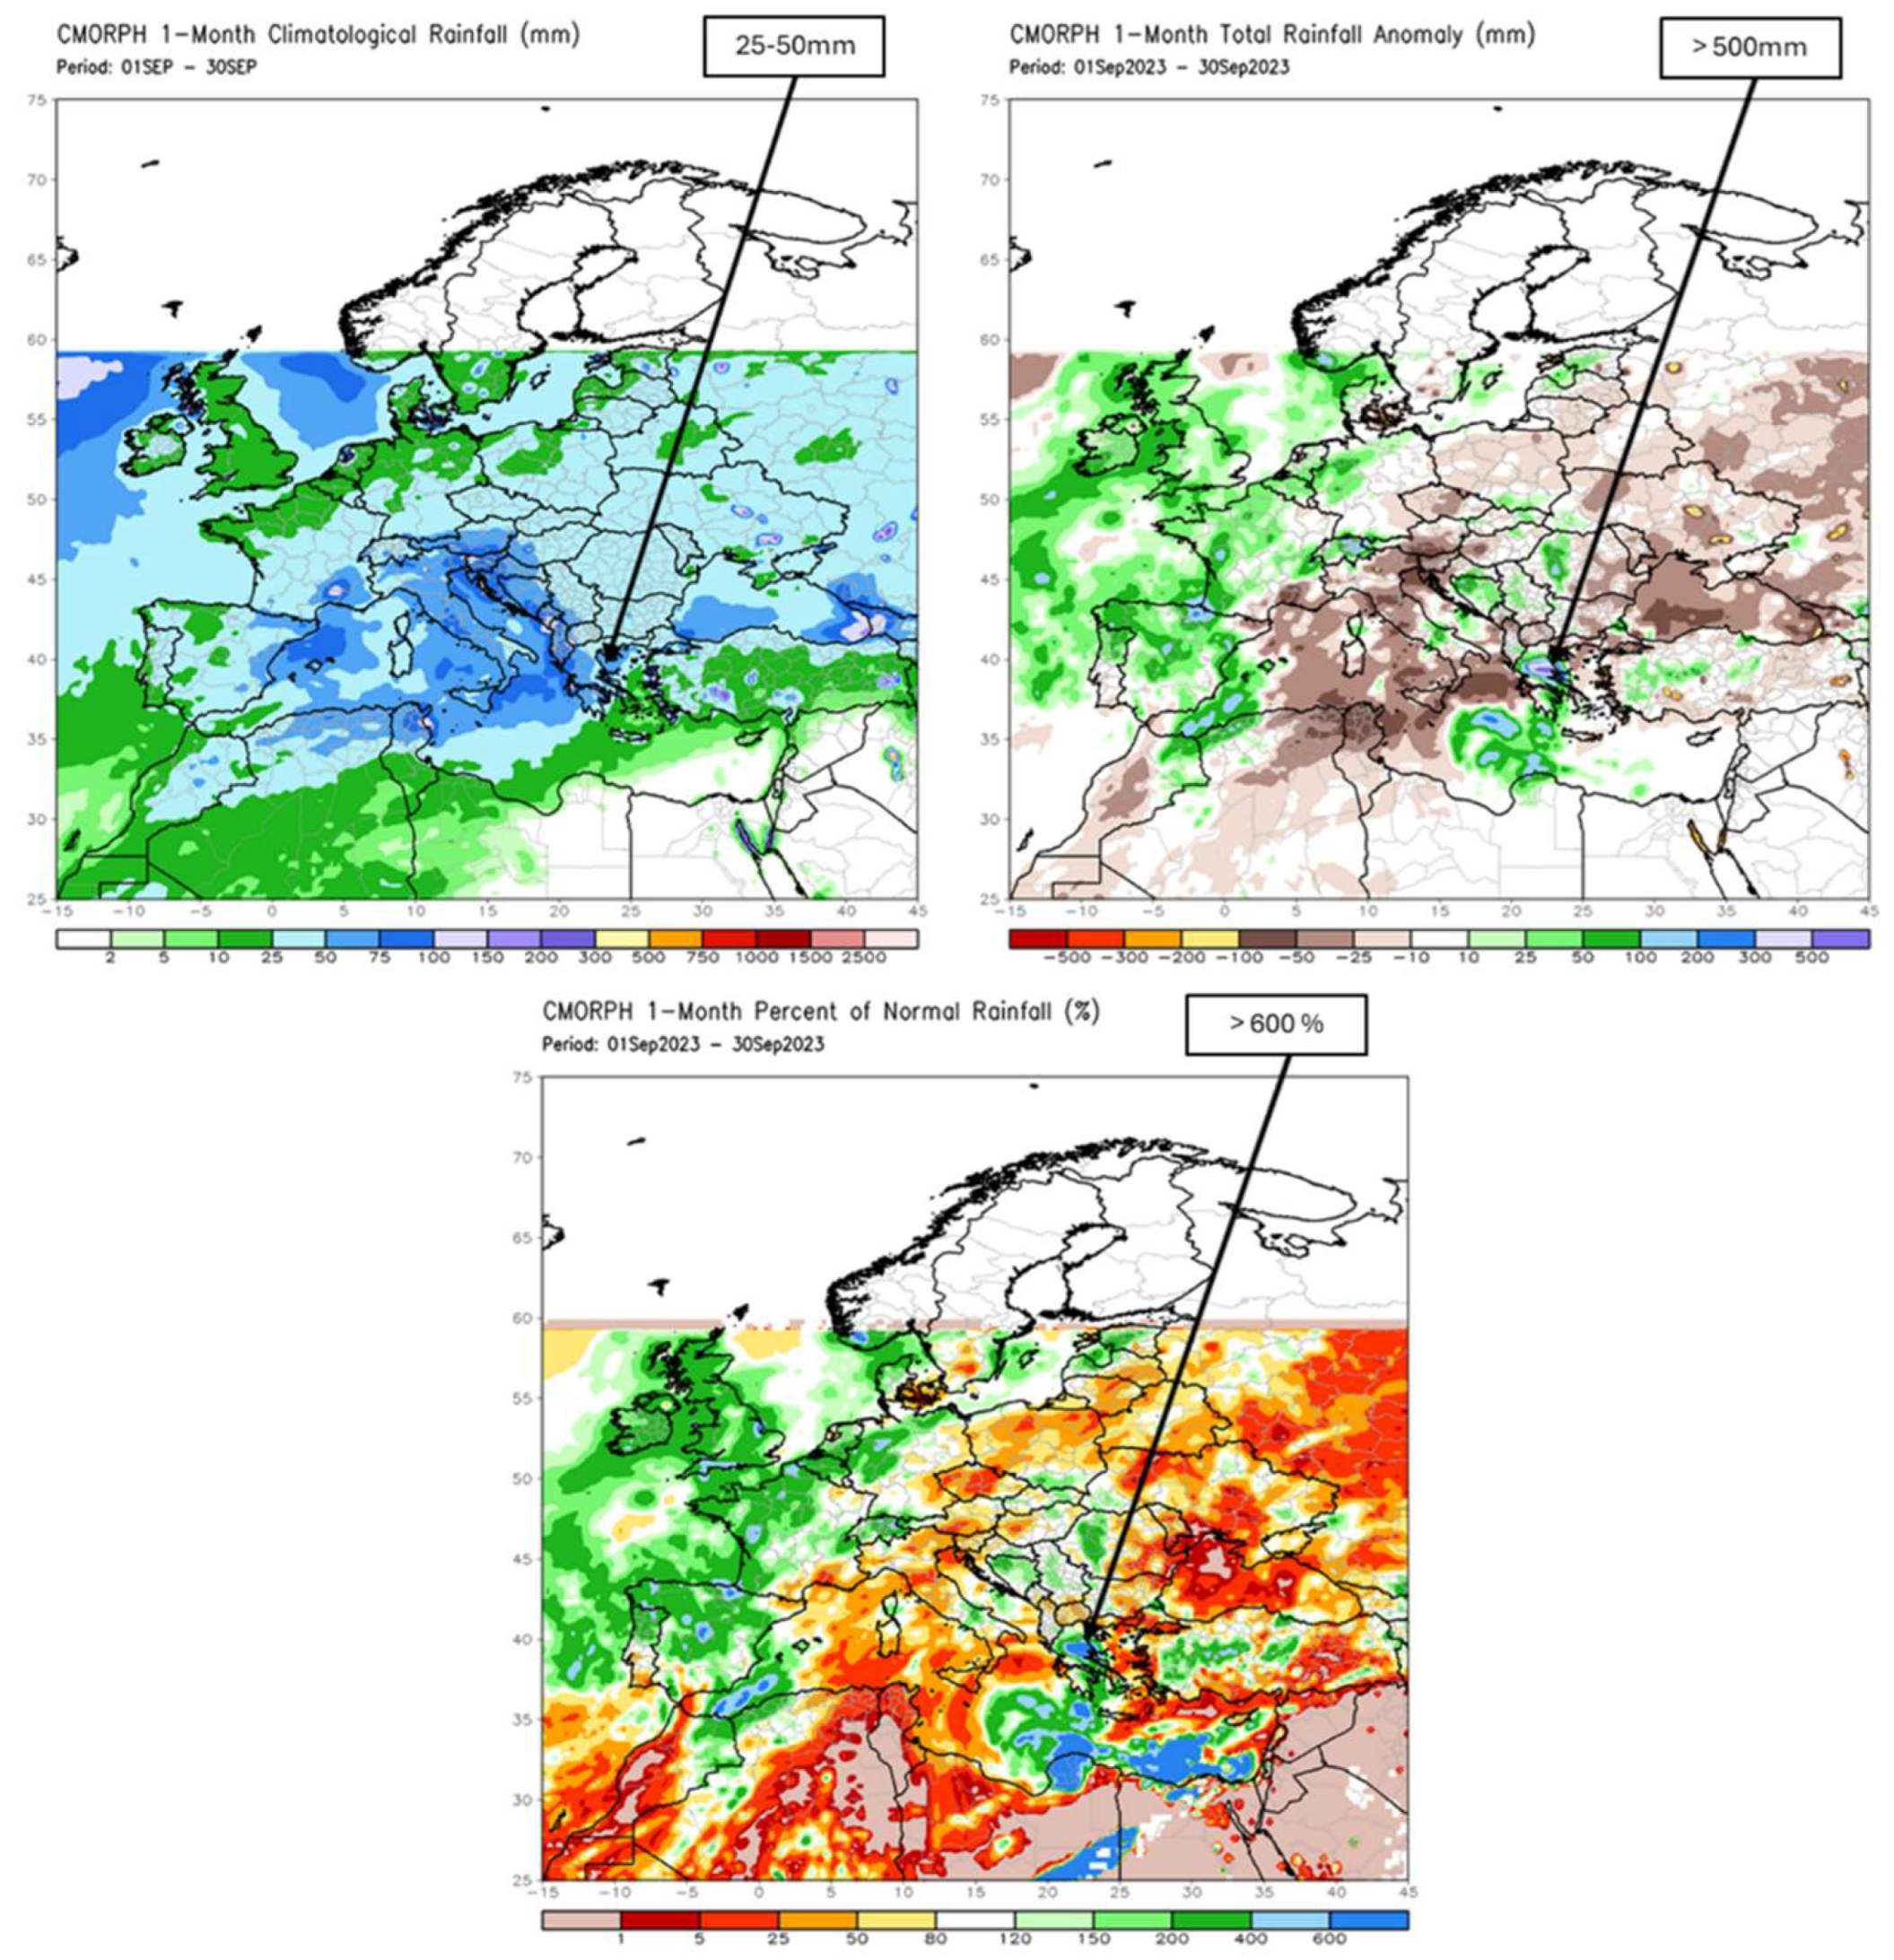
Figure 4 illustrates the rainfall normal for September, the rainfall anomaly (relative to 1980–2010), and the percent of normal rainfall (%) for September 2023, over Europe. Focusing on Thessaly, central Greece, the rainfall anomaly exceeded 500 mm, resulting in more than 600% of the normal precipitation based on the Satellite Precipitation—CMORPH Climate Data Record (CDR), which consists of satellite precipitation estimates that have been bias-corrected and reprocessed using the Climate Prediction Center (CPC) Morphing Technique (MORPH) to form a global, high-resolution precipitation analysis (
Figure 4).
The highest frequency of cyclonic tracks passing through the Eastern Mediterranean occurs from December to April, with a noticeable decline during the warmer months and a subsequent rise in October. January records the peak number of cyclonic tracks in the target area, accounting for 11.2% of the yearly total, followed by March at 10.3%. The lowest number of tracks is observed in July, making up 5.3% [
21]. Besides, medicanes (Mediterranean hurricanes) are rare tropical-like cyclones that develop over the Mediterranean Sea. These storms typically occur in the autumn and early winter months, from September to January, when sea surface temperatures are warm enough to fuel their development. However, medicanes can occasionally form in other months under the right atmospheric conditions. The frequency of their occurrence is lower compared to tropical cyclones, but they tend to intensify during periods of warm water temperatures and strong upper-level winds, especially in the transition seasons between summer and winter [
22].
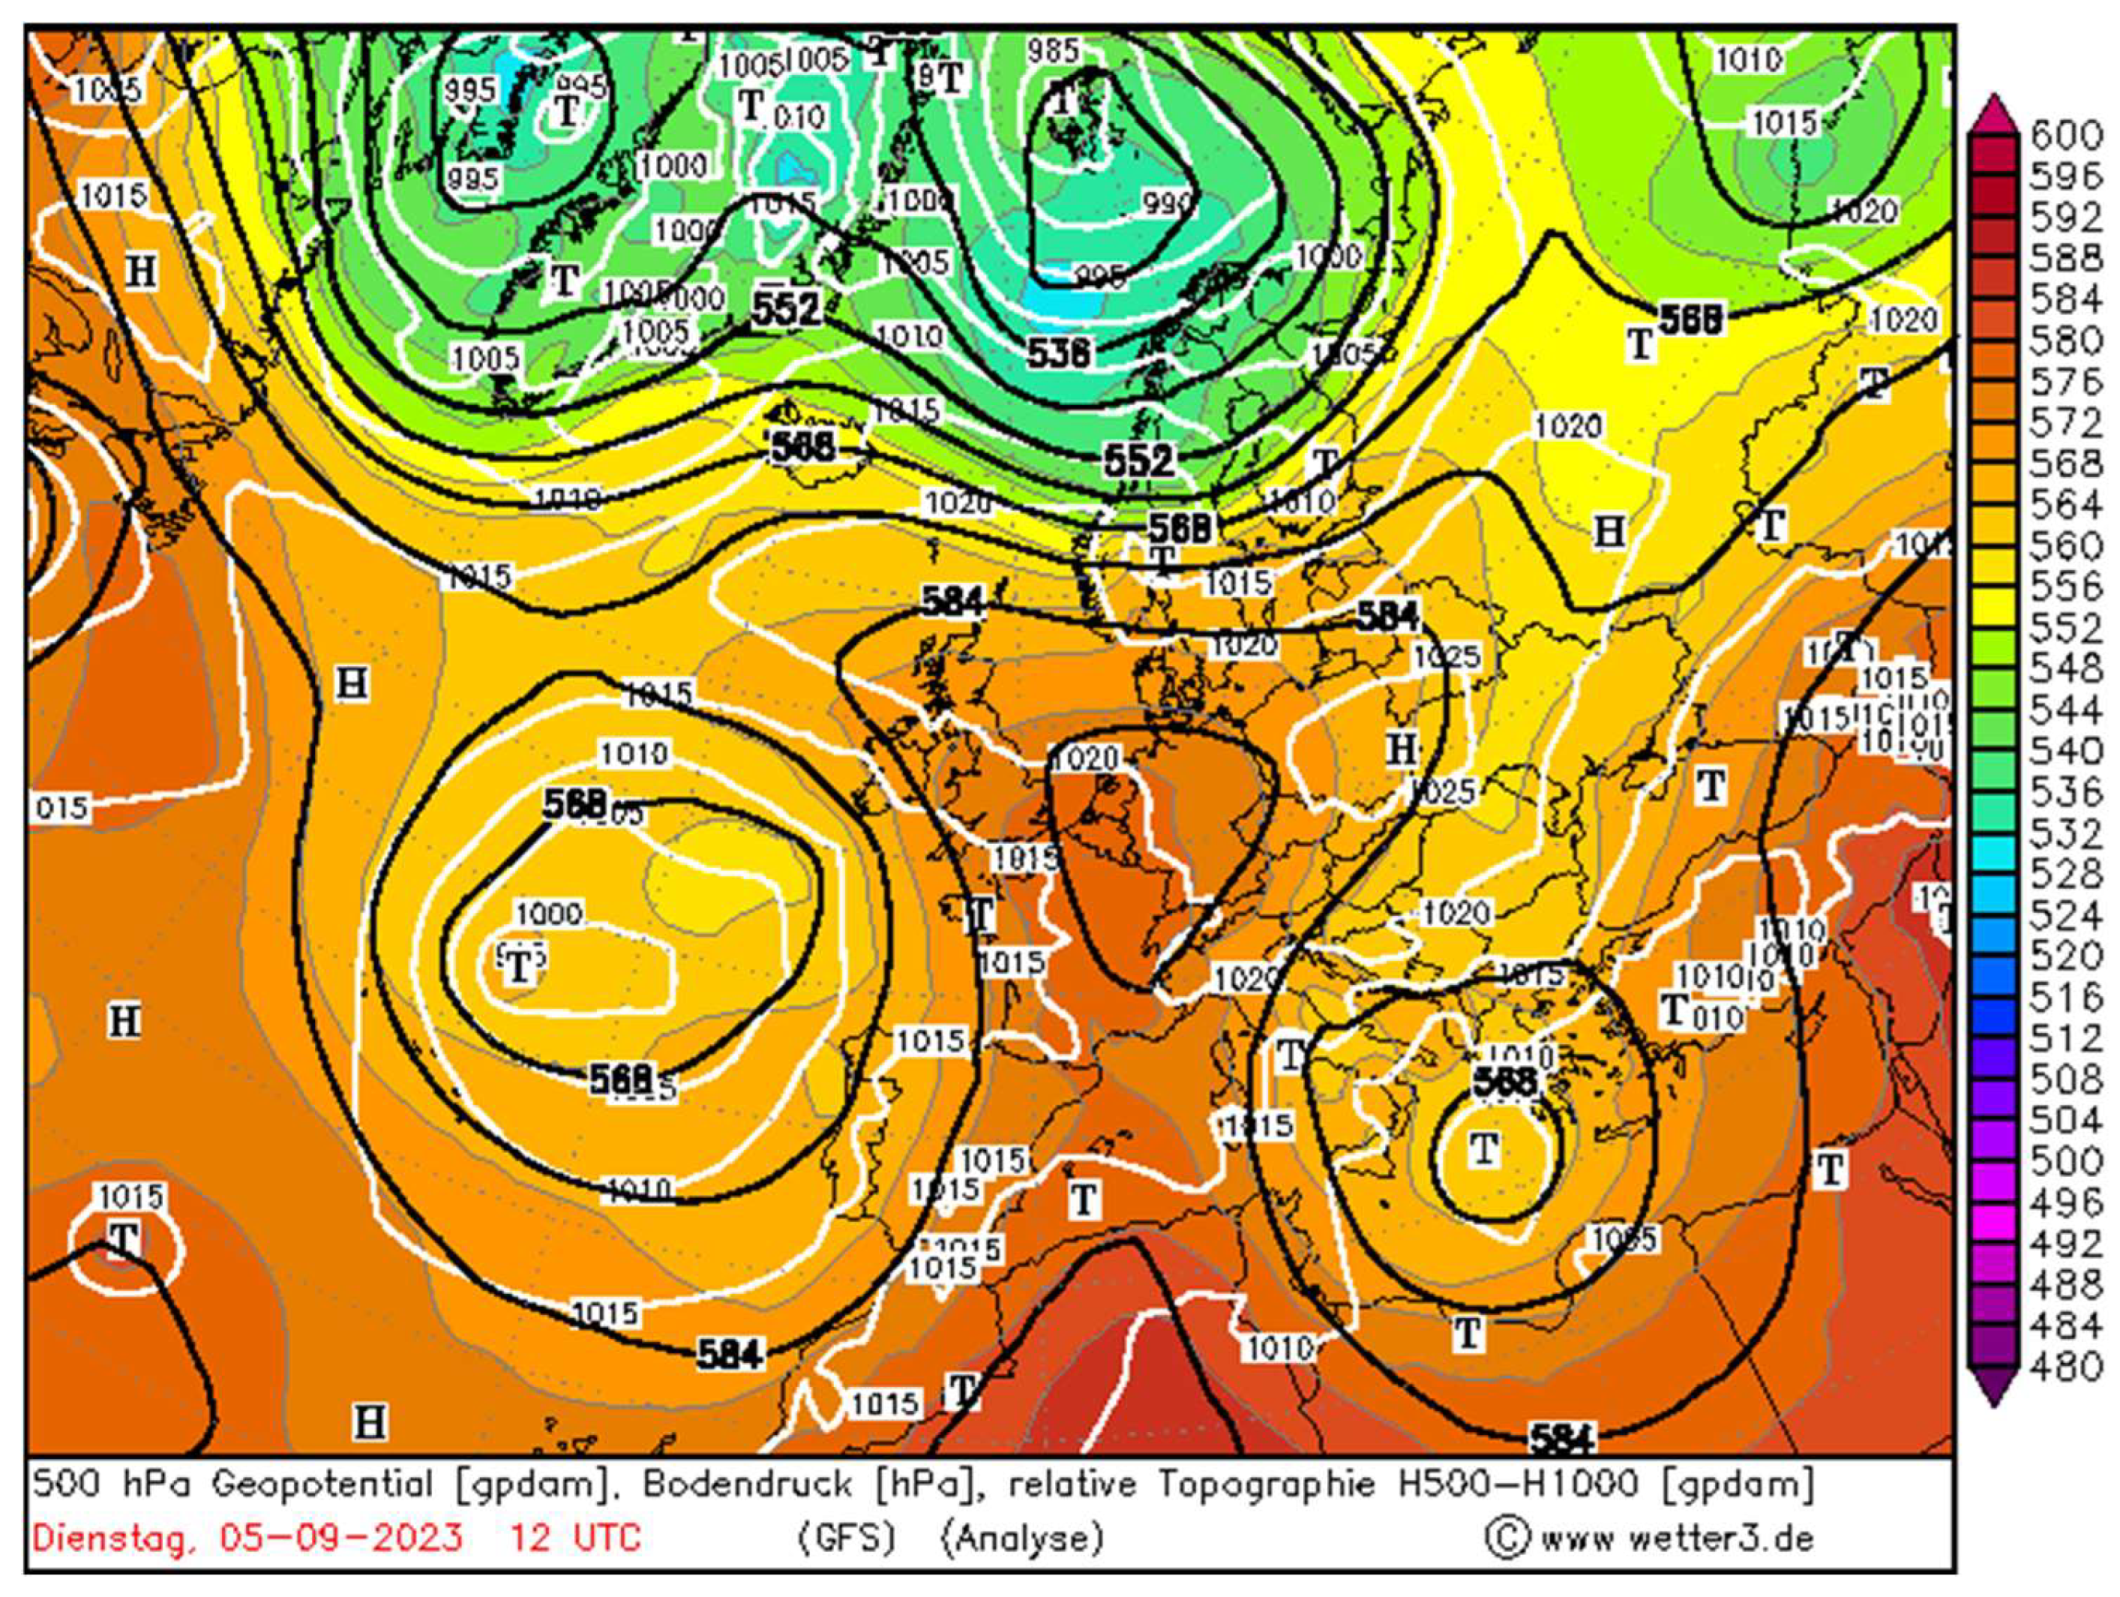
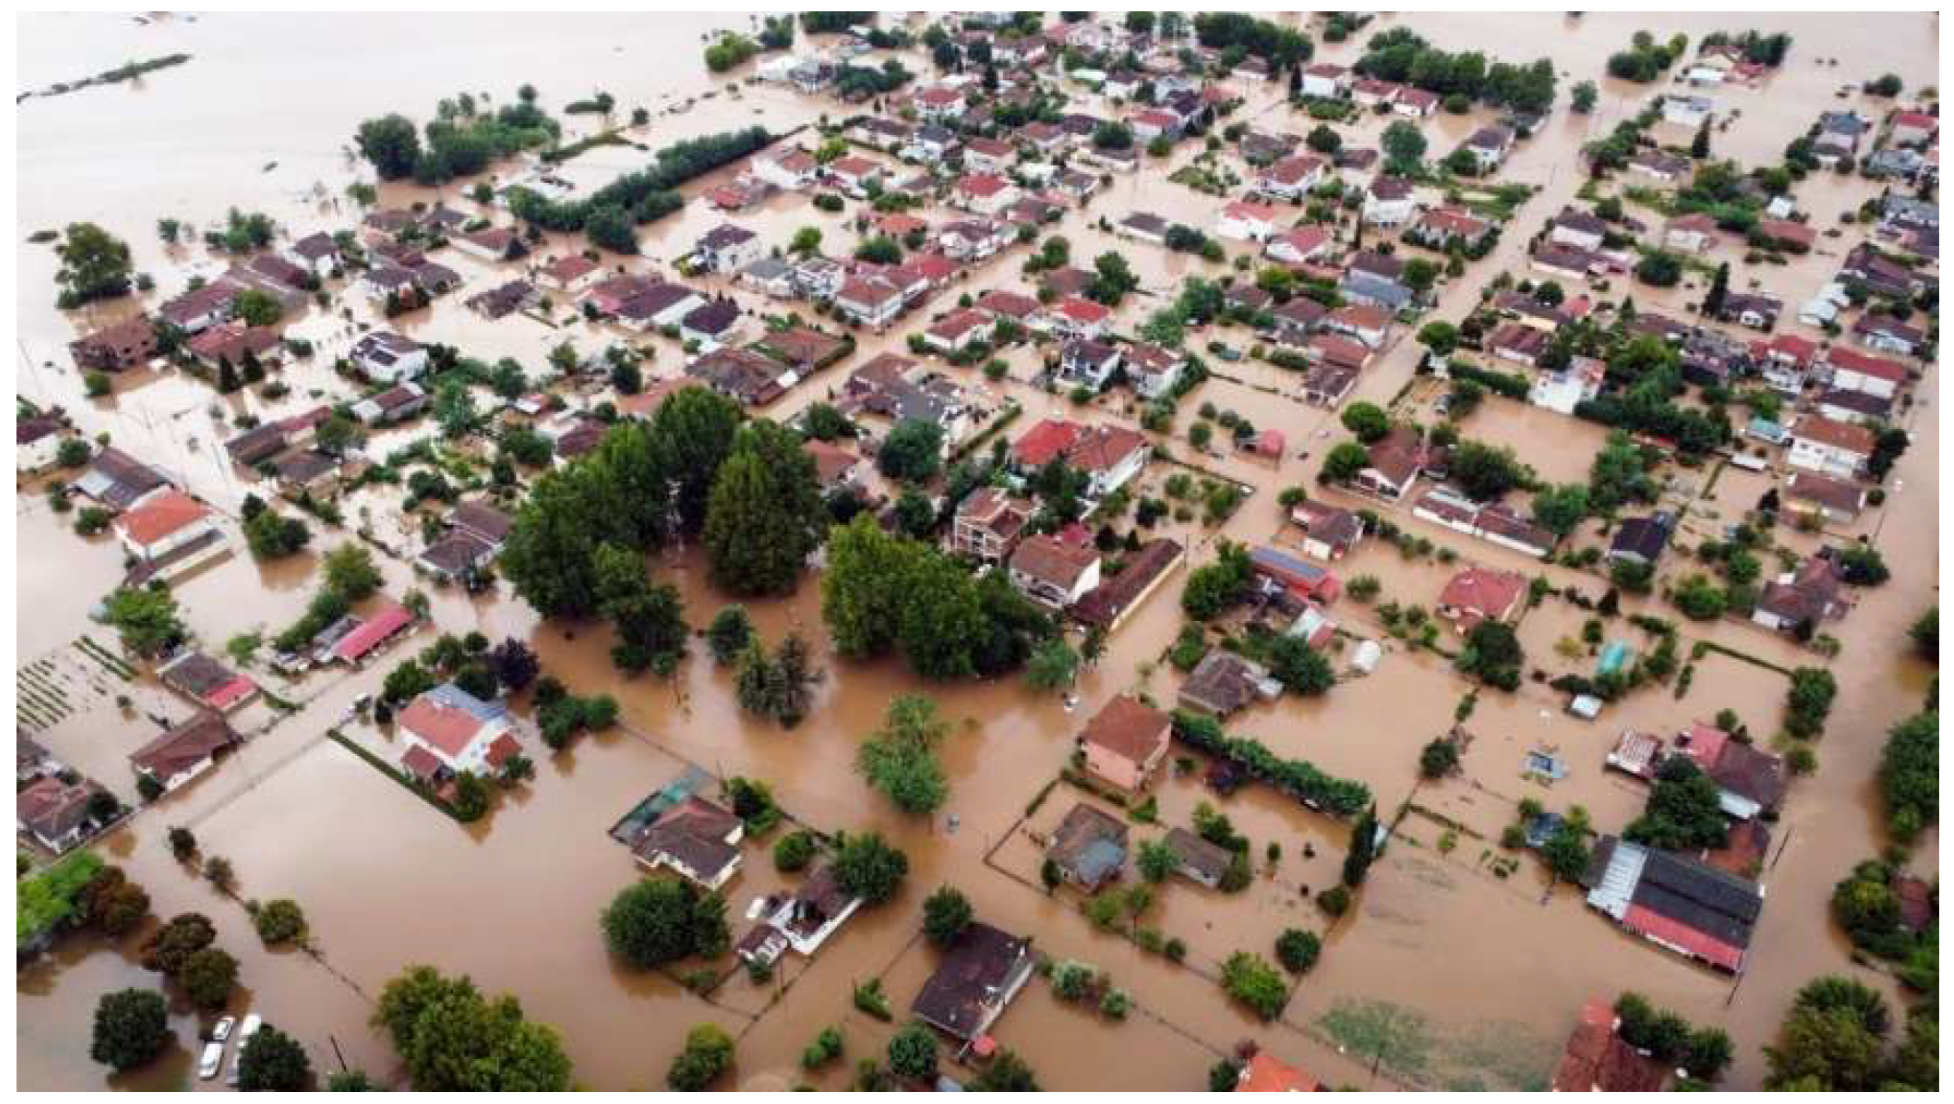
Storm Daniel formed as a low-pressure system over the Ionian Sea and Greece in early September due to a well-established omega-blocking circulation over central Europe (
Figure 5) and had a profound impact on Thessaly, Greece, leaving a trail of devastation in its way. Thessaly, known for its rich agricultural land and historical significance, found itself at the mercy of relentless winds, torrential rains, and widespread flooding brought about by this powerful storm causing rivers and streams to overflow, inundating vast areas of agricultural land, residential neighborhoods, and critical infrastructure. The flooding led to significant property damage, with homes and businesses submerged under water (
Figure 6).
Fields of wheat, corn, and cotton were destroyed, impacting the livelihood of thousands of farmers and threatening food security in the region. The storm caused severe damage to roads, bridges, and other essential infrastructure. Several towns and villages were cut off as transportation networks were rendered impassable, hampering rescue and relief operations. The heavy rains and flooding disrupted power lines and water supply systems, leaving many communities without electricity and clean drinking water for extended periods. The loss of these essential services has added to the hardships faced by the affected population. Tragically, the Daniel storm resulted in the loss of lives and numerous injuries. Emergency services were stretched to their limits as they responded to calls for help and carried out rescue operations in challenging conditions. The economic repercussions of the storm are significant. The destruction of crops, infrastructure, and property has led to substantial financial losses. The cost of rebuilding and recovery is expected to place a heavy burden on both the local and national economies. The storm also caused environmental damage, including soil erosion, the contamination of water bodies with debris and pollutants, and the loss of wildlife habitats. These environmental impacts have long-term consequences for the region’s ecosystem. The Daniel storm has underscored the vulnerability of Thessaly to extreme weather events and highlighted the need for comprehensive disaster preparedness and resilient infrastructure to mitigate the impacts of future storms.
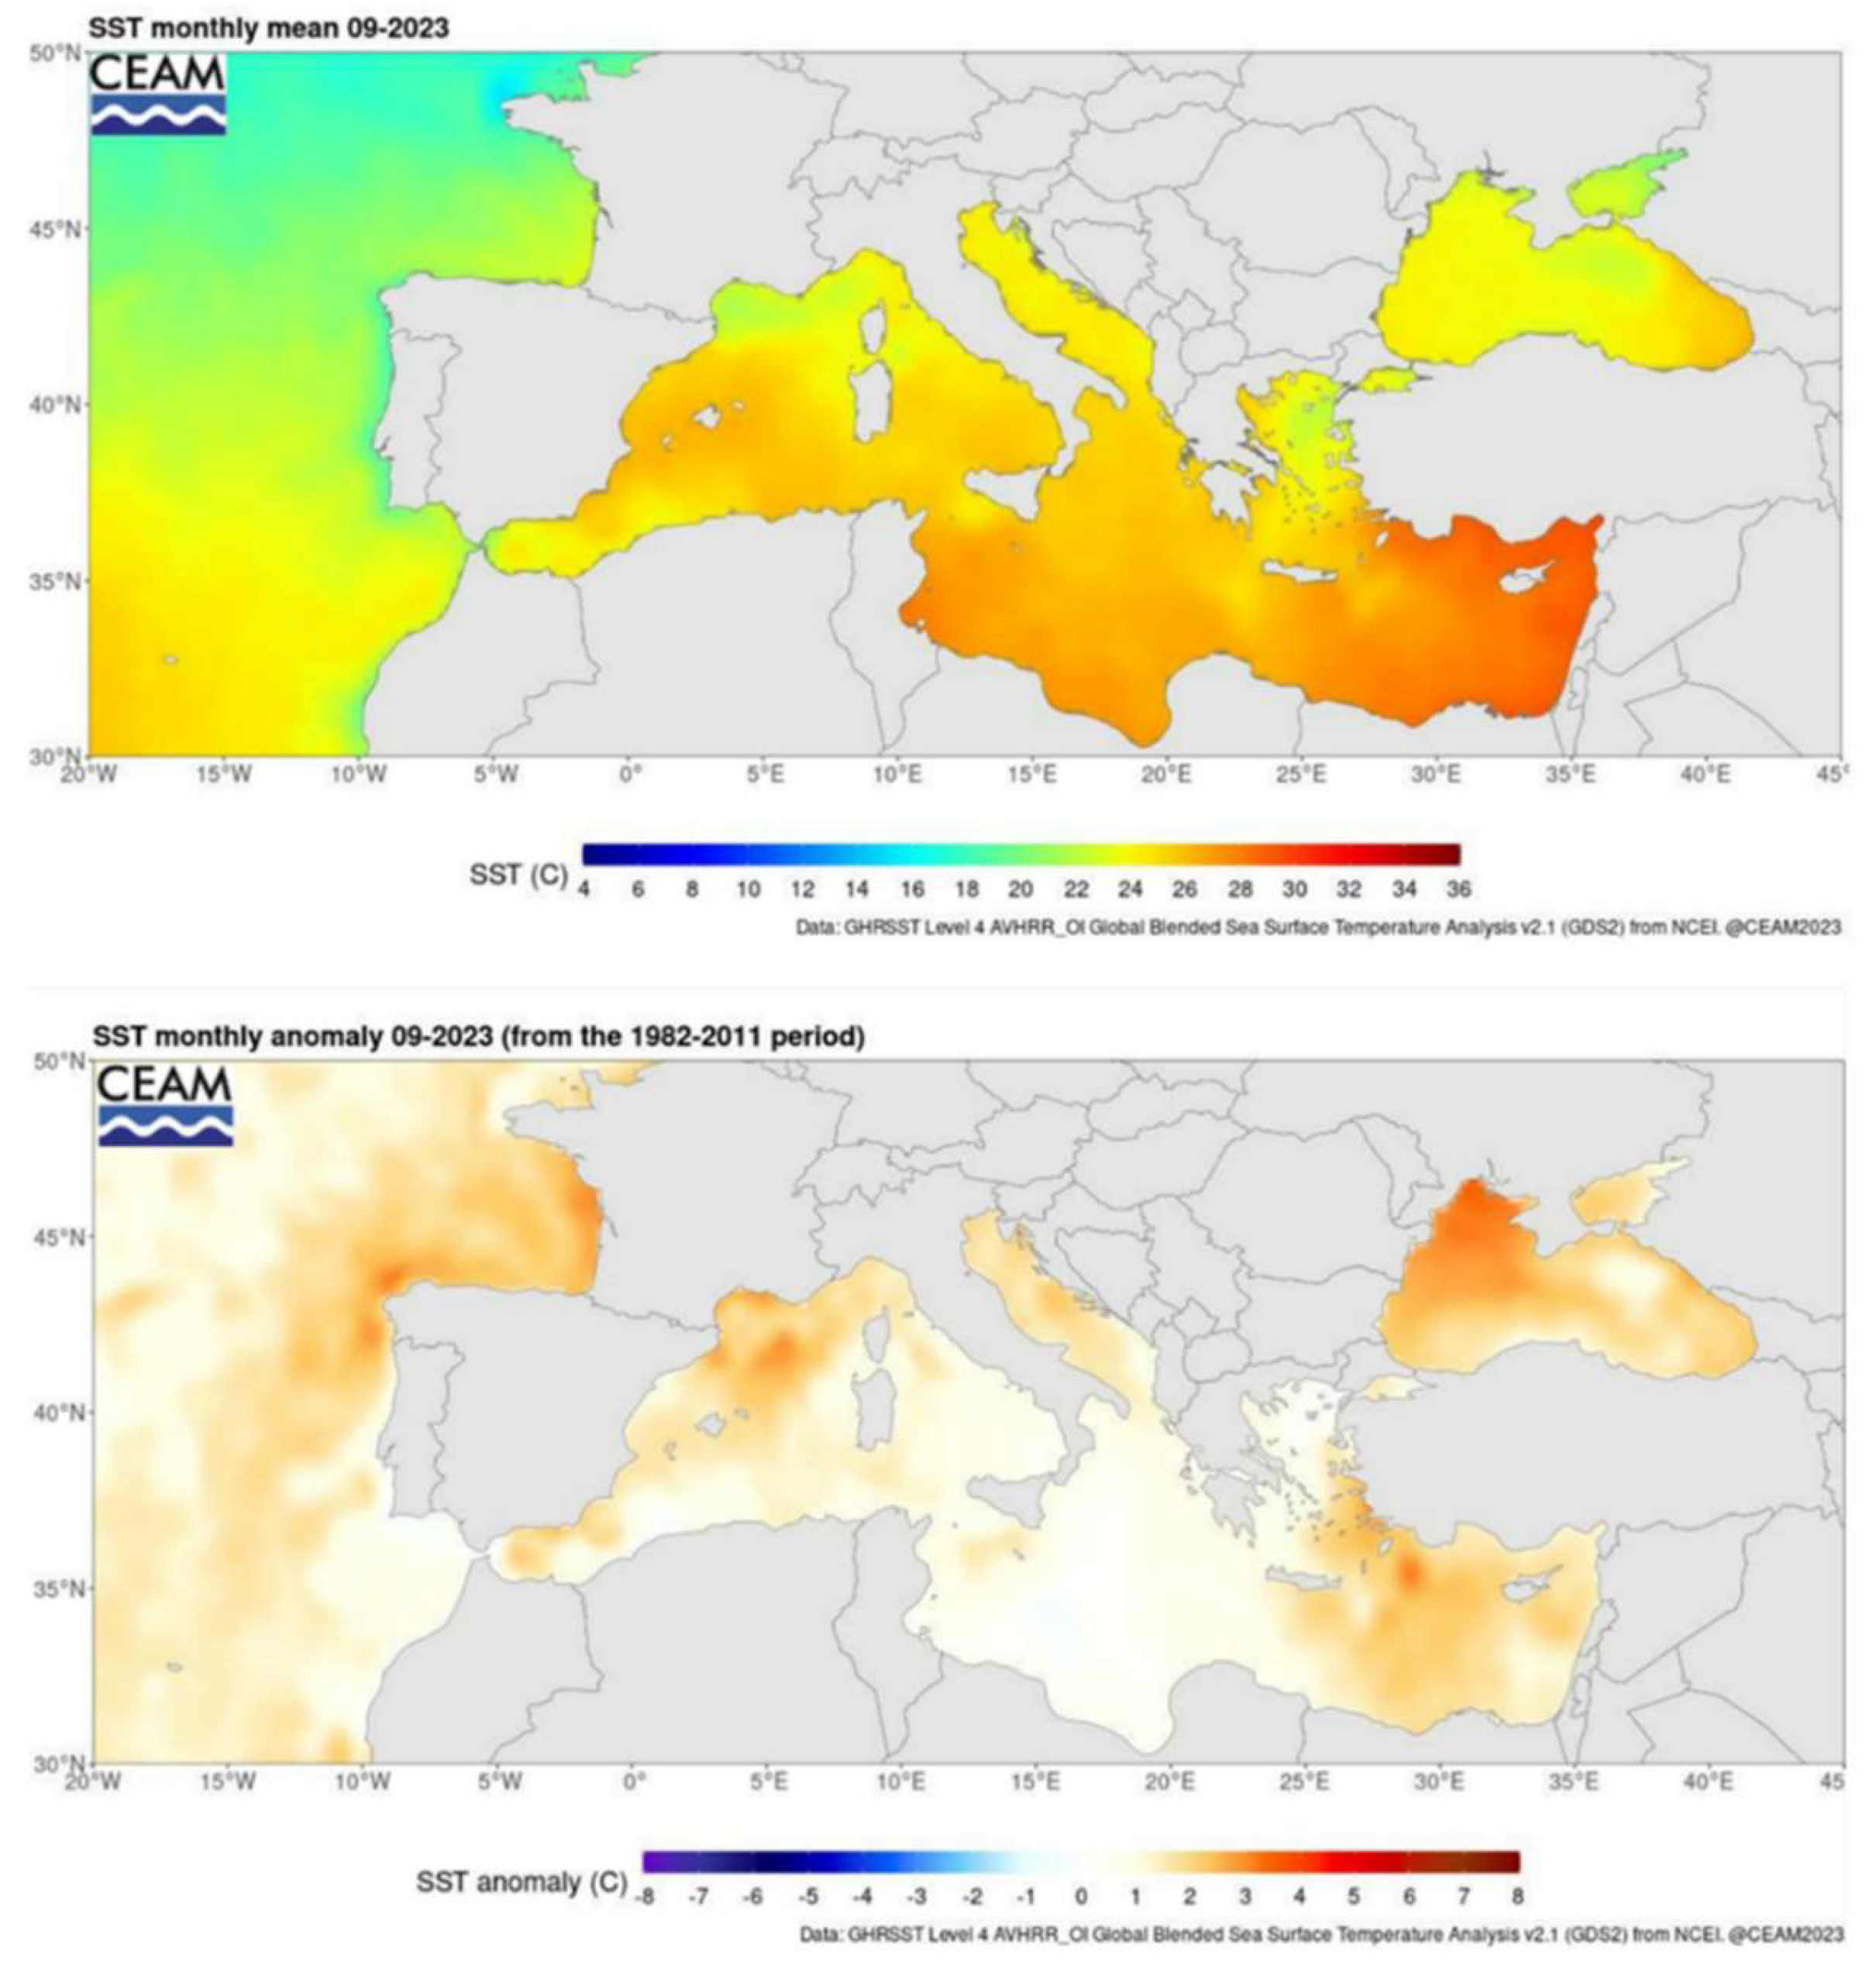
Storm Daniel leaving the Thessaly region, driven by the well-established omega-blocking circulation over central Europe, intensified into a medicane (or tropical-like cyclone) due to the unusually warm sea surface temperatures, which exceeded 27.5 °C near the Libyan coast (
Figure 7). The extreme rainfall and high winds associated with the storm led to the destruction of infrastructure and severe flooding in eastern Libya. The storm resulted in the collapse of two dams, which unleashed a torrent of water and mud, devastating large parts of the city and causing significant loss of life and displacement. Reports indicate that the city of Derna experienced a wave of mud and water approximately 7 m high, which swept away entire neighborhoods, resulting in thousands of deaths and displacing over 30,000 people.
SST monthly analysis for September 2023 shows a spatial distribution similar to summer months and a mean value of 25.9 °C. The highest values recorded were found in the Eastern Mediterranean, between Turkey, Cyprus, and Egypt, while the lower ones were observed in the Aegean Sea and the Gulf of Lion. The highest positive anomalies were located in the Eastern Mediterranean but also in the relatively colder area of the Gulf of Lion (
Figure 7). Significant positive anomalies were also recorded in coastal southern Spain and the Adriatic Sea. The monthly mean SST anomaly in September was the fourth in the historical series (1982–2023) for this month, but in the case of seasonally adjusted SST, it was the highest in history.
This event highlights the increasing frequency and intensity of extreme weather phenomena in the Mediterranean region driven by climate change and rising sea surface temperatures (
Figure 8). As the planet continues to warm, such devastating storms are expected to become more common, posing significant risks to coastal and island communities in the Mediterranean.
Concluding what we did or did not learn with respect to the abnormally extreme year 2023 in Greece, the public discussion was not only more on new records in temperature and precipitation, and less on actions to be taken, including appropriate information, but also less focused on preparation measures, which had to be started earlier during the year. For the Greek population, climate change and crisis are still “this is all Greek to me”.
During dry conditions and extreme heat, forest fires usually take place in Greece, and the cause of the fires is 95% human-induced. It is not necessary to mention that experiencing heat and at the same time forest fires is a cocktail of parameters and factors caused not only because of high temperatures, low humidity, and wind conditions, but air pollutants are also a part of the cocktail. The forest fires changed the landscape, destroyed national parks, and reduced the biodiversity but also had effects on the morbidity and mortality of the population and mental health.
Given the awful recent experience of the summer of 2023 and considering the still existing knowledge about the development of actions, such as the Heat Health Action Plans [
23], the following suggestion can be helpful in the era of climate change for future actions:
Better and appropriate communication (especially for the public);
Development of early warning systems;
Education of specific economic sectors;
Public spots about climate change and relevant extreme phenomena in order to raise sensitivity to climate change and actions;
Explanation of actions to be taken (in easy and understandable examples) and how to implement them;
Inclusion and education of media and multipliers;
Participation of the public and local authorities;
Establishment of round tables focusing on sectors and priorities.
The presented examples show that the situation that happened in 2023 can take place again and the appropriate preparation and education of the responsible authorities, the public, and also all the relevant economic sectors can affect its outcomes significantly.
