Article

Resonant Forcing by Solar Declination of Rossby Waves at the Tropopause and Implications in Extreme Precipitation Events and Heat Waves—Part 2: Case Studies, Projections in the Context of Climate Change

by
Jean-Louis Pinault
Independent Researcher, 96, Rue du Port David, 45370 Dry, France
Atmosphere 2024, 15(10), 1226; https://doi.org/10.3390/atmos15101226
Submission received: 28 August 2024 / Revised: 4 October 2024 / Accepted: 12 October 2024 / Published: 14 October 2024

Abstract

:
Based on the properties of Rossby waves at the tropopause resonantly forced by solar declination in harmonic modes, which was the subject of a first article, case studies of heatwaves and extreme precipitation events are presented. They clearly demonstrate that extreme events only form under specific patterns of the amplitude of the speed of modulated airflows of Rossby waves at the tropopause, in particular period ranges. This remains true even if extreme events appear as compound events where chaos and timing are crucial. Extreme events are favored when modulated cold and warm airflows result in a dual cyclone-anticyclone system, i.e., the association of two joint vortices of opposite signs. They reverse over a period of the dominant harmonic mode in spatial and temporal coherence with the modulated airflow speed pattern. This key role could result from a transfer of humid/dry air between the two vortices during the inversion of the dual system. Finally, focusing on the two period ranges 17.1–34.2 and 8.56–17.1 days corresponding to 1/16- and 1/32-year period harmonic modes, projections of the amplitude of wind speed at 250 mb, geopotential height at 500 mb, ground air temperature, and precipitation rate are performed by extrapolating their amplitude observed from January 1979 to March 2024. Projected amplitudes are regionalized on a global scale for warmest and coldest half-years, referring to extratropical latitudes. Causal relationships are established between the projected amplitudes of modulated airflow speed and those of ground air temperature and precipitation rate, whether they increase or decrease. The increase in the amplitude of modulated airflow speed of polar vortices induces their latitudinal extension. This produces a tightening of Rossby waves embedded in the polar and subtropical jet streams. In the context of climate change, this has the effect of increasing the efficiency of the resonant forcing of Rossby waves from the solar declination, the optimum of which is located at mid-latitudes. Hence the increased or decreased vulnerability to heatwaves or extreme precipitation events of some regions. Europe and western Asia are particularly affected, which is due to increased activity of the Arctic polar vortex between longitudes 20° W and 40° E. This is likely a consequence of melting ice and changing albedo, which appears to amplify the amplitude of variation in the period range 17.1–34.2 days of poleward circulation at the tropopause of the Arctic polar cell.

1. Introduction

1.1. Heatwaves

According to the United States Environmental Protection Agency (EPA), heatwaves are characterized by the increase in frequency, duration, length of the season, that is the number of days between the first heatwave of the year and the last, and the intensity [1]. The impact of climate change on heatwaves is clear, with many attribution studies [2,3,4,5,6,7,8,9,10] demonstrating that climate change has increased the probability of heatwaves occurring and that their frequency, intensity, and duration have risen. From [11], rapid warming in the Arctic could influence mid-latitude circulation by reducing the poleward temperature gradient, which might have contributed to more persistent heatwaves in recent summers. From [12], midlatitude persistent longitudinal planetary-scale high-amplitude waves may favor a strong magnification of that response through quasi-resonance.
However, the impact of climate change on the climate system is still the subject of scientific debate, with competing hypotheses emerging from observations, modeling, and uncertainties about the involvement of physical processes [13,14,15]. There are multiple physical links between circulation in the upper atmosphere and extreme weather conditions at the surface [16]. A comprehensive fundamental theory of the growth and propagation of Rossby waves at relevant spatial and temporal scales is lacking. The socio-economic impact of heatwaves is attracting growing research interest to better anticipate their occurrence as well as their frequency.
Across the United States, their frequency has increased steadily, from an average of two heatwaves per year during the 1960s to six per year during the 2010s and 2020s. Heatwaves are anticipated to become more frequent and intense [17]. Increases in heatwave intensity are generally 0.5–1.5 °C above a given global warming threshold. They are higher over the Mediterranean and Central Asian regions. Between warming thresholds of 1.5 °C and 2.5 °C, the return intervals of intense heatwaves reduce by 2–3 fold [18]. Compound drought and heatwave events have garnered increased attention due to their significant impacts on agriculture, energy, water resources, and ecosystems. East Africa, North Australia, East North America, Central Asia, Central Europe, and Southeastern South America show the greatest increase in frequency through the late 21st century [19]. Europe as a heatwave hotspot, showing increasing trends three to four times faster than the rest of the northern mid-latitudes over the past 42 years, which is linked to the increase in the frequency and persistence of double jet stream states over Eurasia [20].
The remote role of negative potential vorticity arising from divergent outflow on Rossby wave packet propagation coincided with the 11–21 June 2017 European heatwave [21]. The quasi-resonance amplification of planetary waves leading to heat extremes is closely related to double jets, accompanied by the enhancement of atmospheric blocking and the weakening of planetary waves escaping into the stratosphere [22]. After the late 1990s, the North Atlantic dipole sea surface temperature (SST) anomalies favored the propagation of the Central Pacific (CP)-type SST-excited Rossby wave train in spring extreme heat events over mid-high latitude Eurasia [23].

1.2. Extreme Precipitation Events

A recent increase in the number of Extreme Precipitation Events (EPEs), especially over the past two decades, has been observed and documented in many regions of the globe. Among them are the northeastern United States [24,25,26,27,28], where EPEs are mainly associated with fronts, extratropical cyclones, and tropical cyclones [29,30]. Studies have noted a recent increase in both frequency and intensity, with the higher frequency of warm-season EPEs being most important [31]. According to the authors, they are associated with a wavier (more meandering) jet stream, which likely facilitates the development of more frequent fronts through the advection of cool northern air into the American Midwest.
There have been several studies on the formation mechanisms of the wintertime EPEs over the Tibetan Plateau from a synoptic perspective. Three crucial conditions for the development of the wintertime EPEs over East China were identified: the presence of powerful updrafts, an abundant moisture supply, and a rapid drop in temperature [32,33,34,35,36,37]. It was pointed out that the most critical circulation features necessary for the occurrence of the wintertime EPEs over East China is a Rossby wave train that originates from the North Atlantic Ocean and propagates eastward due to the wave-guiding effects of the subtropical westerly jet. The Rossby wave train induces cyclonic anomalies and enhances convective activity over East China [32]. A coupling between a Rossby wave train along the subtropical jet stream and central Siberian blocking plays a leading role in triggering extreme snowfall events over East China [33].
Synoptic-scale transient recurrent Rossby wave trains [38,39] affect persistent wet spells over Europe, increasing wet spell duration in western Europe and western Russia during summer and over eastern Europe and the Mediterranean in winter (e.g., [40]). Recurrent, persistent patterns that favor the occurrence of wintertime extremes have been demonstrated in the Atlantic [41]. Moreover, in recurrent weather situations, stationary blocking anticyclones can also lead to temporal clustering of heavy precipitation [42,43] on the Alpine south-side and in areas around the Northern Hemisphere [44]. Our confidence in future projections of extreme events connected to Rossby waves remains relatively low because of the lack of fundamental theories for the growth and propagation of Rossby waves on the spatial and temporal scales relevant to extreme events [16].
Over the past three decades, the Arctic has warmed faster than the lower latitudes, known as Arctic amplification [45,46,47]. Arctic amplification has been hypothesized to modify atmospheric circulation patterns and influence midlatitude extreme weather [48,49,50]. Over the midlatitudes of North America and the North Atlantic, there are links between Arctic amplification and a weaker and wavier jet stream, facilitating more persistent extreme weather [51,52].

1.3. Organization of the Item

Several studies show the increase in the frequency and amplitude of extreme climatic events, whether heatwaves or precipitation. If this evolution has been linked to climate change, the causal relationships between the different phenomena are the subject of debate. Following a first article devoted to the role played by Rossby waves resonantly forced by solar declination at the tropopause [53], the objective of this item is to clarify, based on case studies, the mechanisms at play. Because extreme events present themselves as compound events where chaos and timing are crucial, the case studies cover a wide variety of events that are among the best documented due to their disastrous effect. This selection aims to specify the conditions favorable to the triggering of “explosive” phenomena leading to extreme events. It is carried out independently of the cascade of phenomena involved. For each event, these are described in a very summary manner, referring the reader to relevant articles. New avenues are opening up to highlight different causal links to the tropopause, allowing projections over one or two decades based on extrapolations of what is observed.
The paper is organized as follows: The methodological approach is developed in Section 2. Case studies are exposed in Section 3. In Section 4, the discussion focuses on both the modulated airflow (MA) patterns observed at the tropopause during the formation of heatwaves, or EPEs, and their link with climate change from maps of increasing or decreasing vulnerability.

2. Materials and Methods

2.1. Data

NCEP/DOE Reanalysis II data are provided by the National Oceanic and Atmospheric Administration (NOAA) PSL, Boulder, CO, USA, from their website at https://psl.noaa.gov. Daily gridded data from 1979 to now [54] are available at: https://www.psl.noaa.gov/data/gridded/data.ncep.reanalysis2.html accessed on 1 September 2024.
They include wind velocity as a function of atmospheric pressure (17 levels), 2.5-degree latitude × 2.5-degree longitude, the air temperature at 2 m 1.875-degree latitude × 1.875-degree longitude, the precipitation rate 0.5-degree latitude × 0.5-degree longitude, and the geopotential height as a function of atmospheric pressure (17 levels), 2.5-degree latitude × 2.5-degree longitude.

2.2. The Approach According to Different Case Studies

The first part of this article focuses on different case studies of heatwaves and EPEs that are relatively well documented with the aim of extracting their common characteristics as well as those that differentiate them. The methodological approach was developed in the previous article on the theory of Rossby waves at the tropopause [53] from two case studies borrowed from both an EPE that occurred in Japan (July 2012) and a heat wave that occurred in Europe (July–August 2015). This approach consists of representing the amplitude and phase, expressed in relation to a daily reference date, of the extreme event(s) [55]. This reference date, i.e., a particular day of the year, is close to the period of occurrence of the extreme event, which generally lasts several days. The amplitude and phase refer to the three variables mentioned in the method, namely the wind speed anomalies at 250 mb, the height of the geopotential at 500 mb, and the ground air temperature (or the precipitation rate). They are expressed for a range of periods characteristic of a harmonic mode of resonantly forced Rossby waves.
This methodological approach applies to both EPEs and heatwaves. This ambivalence results from the properties of the MAs resulting in standing Rossby waves embedded in jet streams. Indeed, similar to the fundamental wave, the MAs associated with the different harmonics of Rossby waves are warm or cold depending on their direction of propagation, which alternates over a period. This reflects the seasonal and intraseasonal variations in the ascending and descending motions of the air columns at the meeting of the polar, Ferrel, and Hadley cells. The meteorological impact of the MAs is due to the fact that they are warmest when a maximum speed is reached while they are coldest half a period later, leading to the formation of powerful cyclones or anticyclones in mid-latitudes. The mean periods of the main harmonics are 1/16, 1/32, and 1/64 years.
As the case study in the previous article clearly shows, the amplitude of variation in the speed of the MAs for certain harmonic modes is determining in the formation of heatwaves and EPEs. This observation result will be confirmed and clarified within the various case studies presented in this article.
But before continuing, let us recall the approach set out in the first article, which consists, for each case study, in highlighting the driving role in the initiation of extreme meteorological phenomena of polar and subtropical MA resulting from Rossby waves at the tropopause. These Rossby waves develop at the interface between the polar jet and the ascending air column at the meeting of the polar and Ferrel cell circulation or between the subtropical jet and the descending air column at the meeting of the Ferrel and Hadley cell circulation.
Although extreme events appear as compound events where chaos and timing are crucial, they result from very specific MA patterns that make the extreme weather event possible. Different interactions are then necessary for the surface turbulent fluxes generated by synoptic scale eddies to occur. They typically require SST anomalies in the surrounding ocean and, possibly, coupling between extratropical and equatorial atmospheric waves. Although surface turbulent fluxes involve high-frequency atmospheric disturbances, the period ranges of MA anomalies are mainly 17.1–34.2 days and 8.56–17.1 days. These determine the duration of blocking.
These precepts are applied to the case study of the floods that occurred in Victoria, Australia, in January 2011. High intensity rainfall between 12–14 January 2011 caused major flooding across much of the western and central parts of the Australian state of Victoria. A deepening trough of low pressure over south-eastern Australia has been fueled by tropical monsoon moisture across the state as well as northern Tasmania, southern New South Wales, and eastern parts of South Australia [56].
In the period range 8.56 to 17.1 days, the spatial and temporal coherence of the maps of MA velocities (Figure 1a,b) and geopotential height (Figure 1c,d) highlights a giant low-pressure system ahead of the reference date above the circumpolar ocean (phase in blue) and two extratropical cyclones late compared to the reference date, southwest and southeast of Australia centered on latitude 50° S (phases in red). The first system results from the polar MA centered on latitude 55° S (phase in blue) and the subtropical MA in its part subject to a phase inversion at the antinode south and southeastern of Australia (phase in light and dark blue) so that both MAs are warm on the reference date close to the date of occurrence of the EPE. The second system results from the subtropical MA, where it is in phase with the EPE (phase in red) on both sides of the out-of-phase segment, at longitudes west of 120° E and east of 170° E.
The exceptional character of the precipitation over southeastern Australia (phase in red in Figure 1e,f) is attributable to the dual cyclone-anticyclone system over the circumpolar ocean east of longitude 140° E. During its evolution, this dual system, which results from the phase inversion of the subtropical MA at longitude 170° E, favors southeasterly moisture-laden winds over the circumpolar ocean as well as an extended SST anomaly in phase with the EPE at the southeast of Australia [53].

2.3. Evolution of the Frequency of Heatwaves and EPEs on a Global Scale

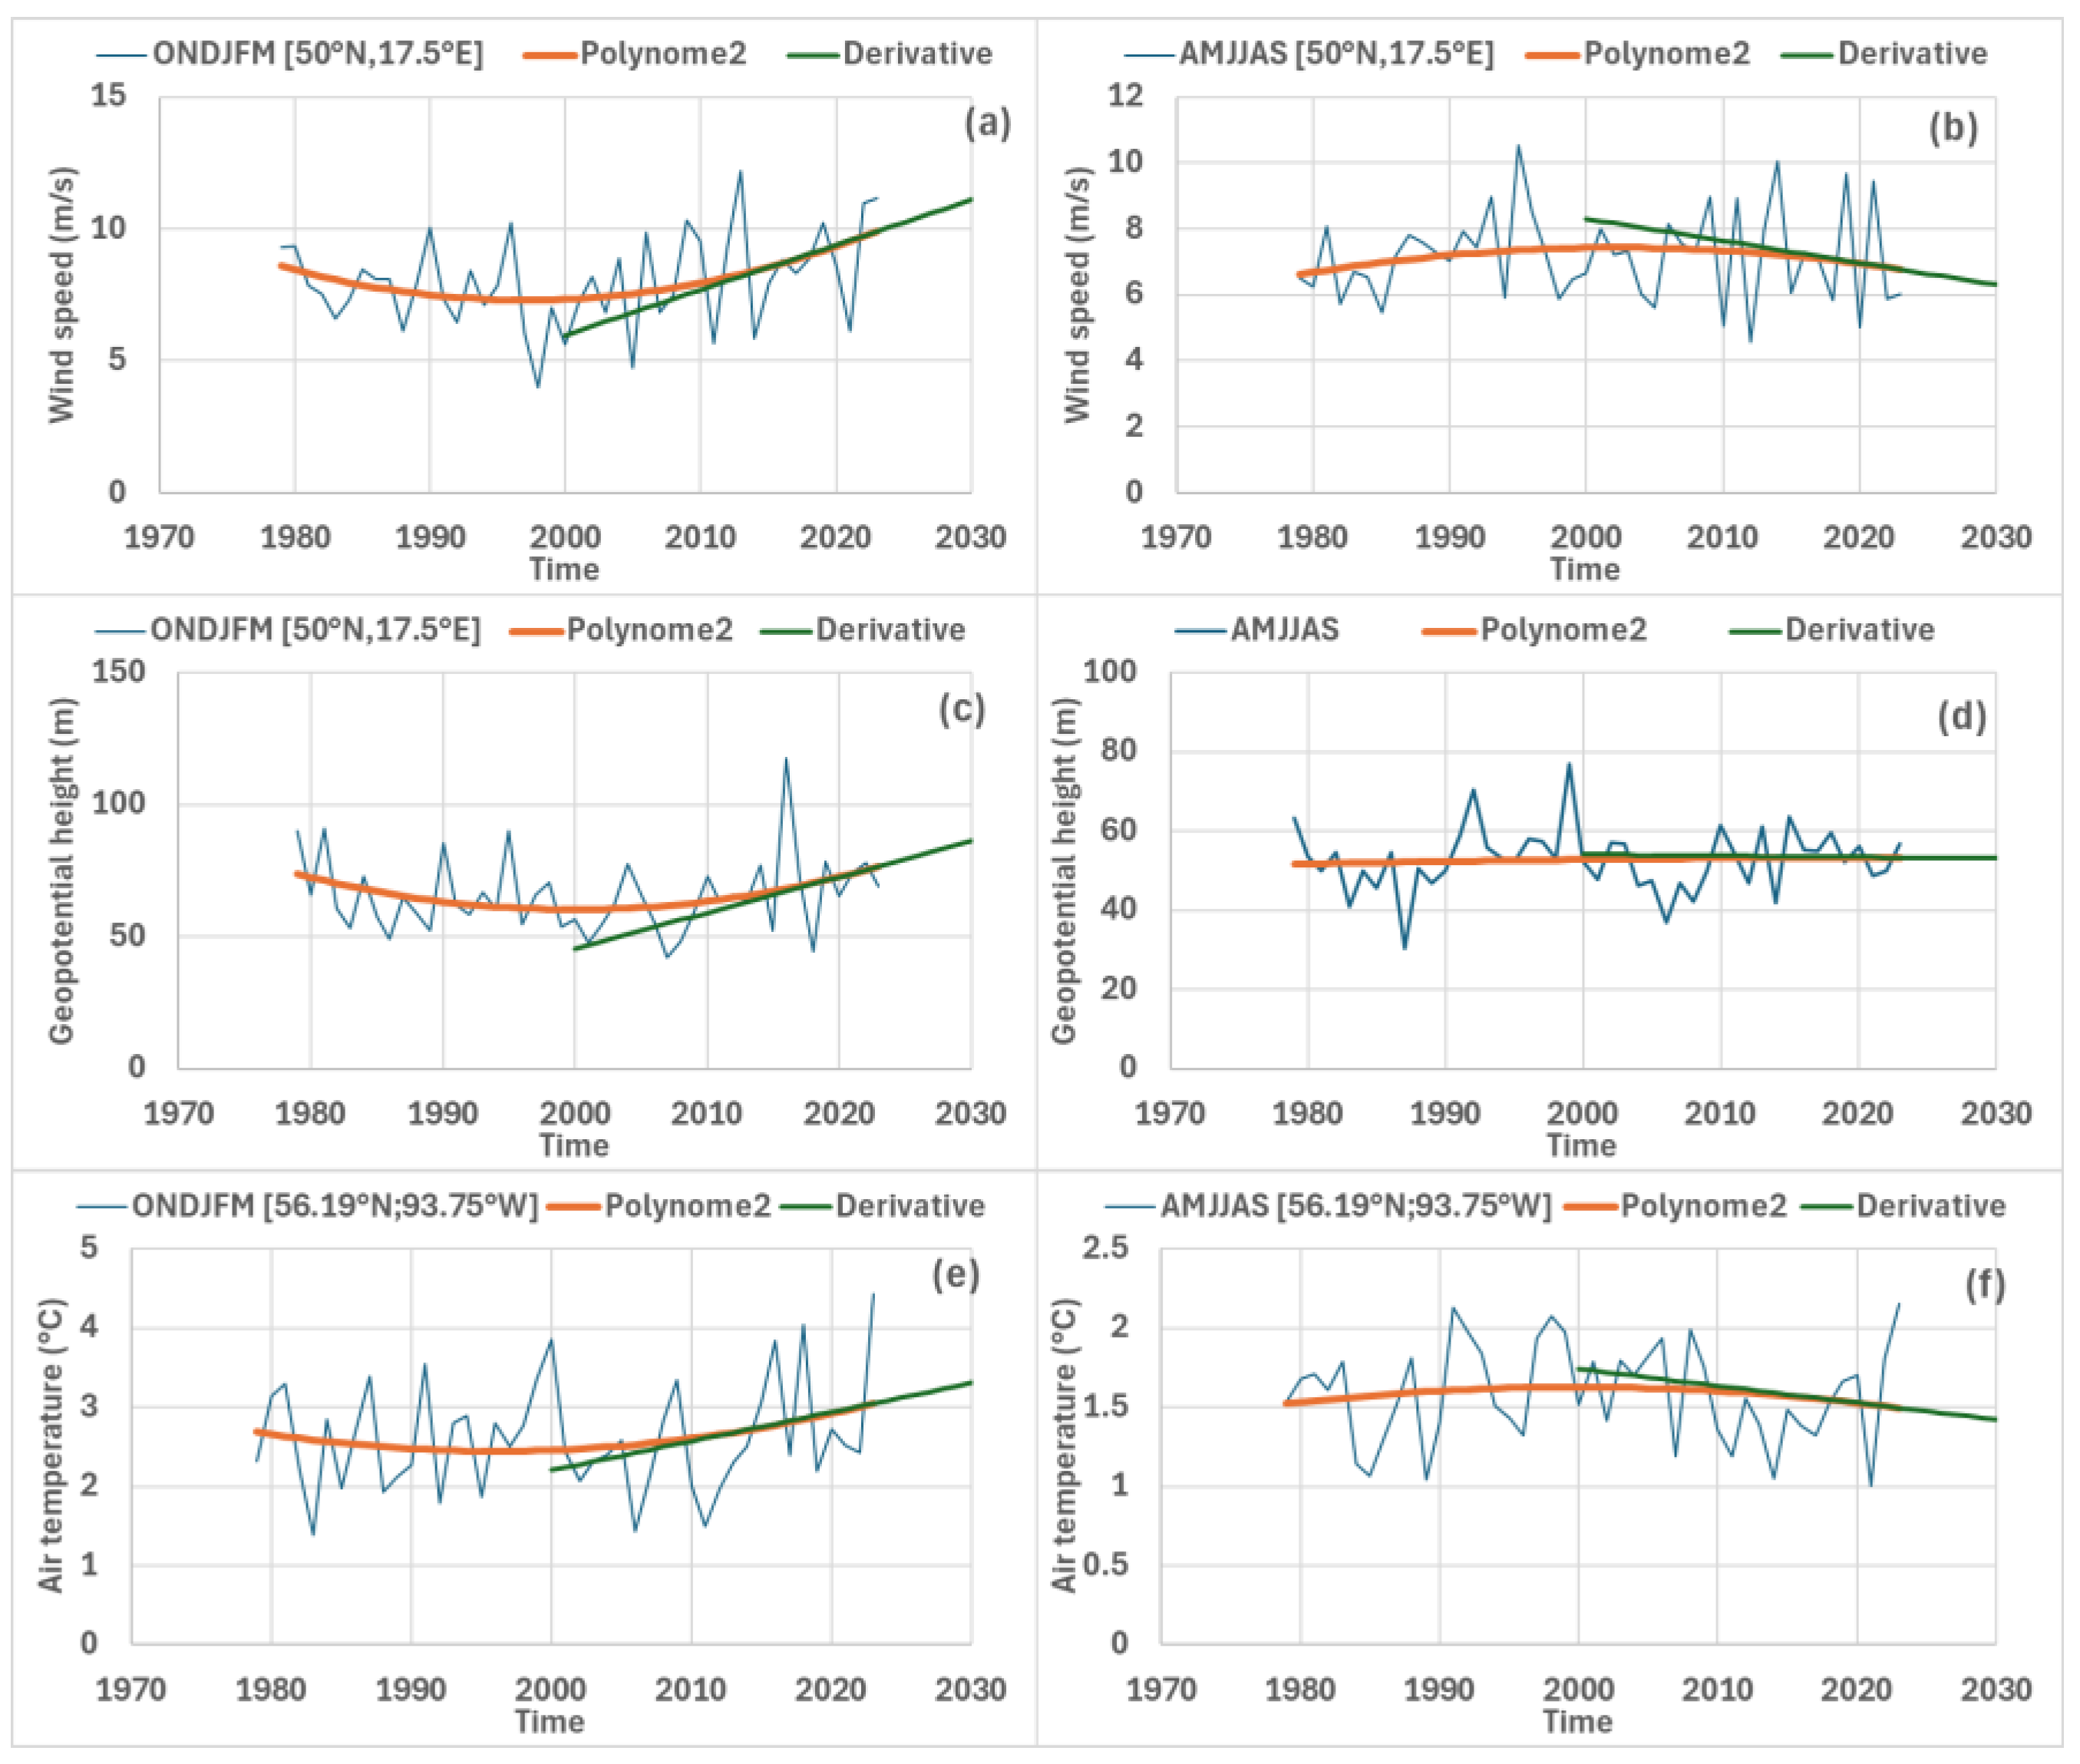
The second part of this article aims to determine the projected evolution of the vulnerability of different regions of the globe to heat waves and EPEs as well as their probable cause. Based on regionalized daily wind speed at 250 mb since 1979, the amplitude of MA speed variation in characteristic period ranges is the square root of the power spectrum of the wind speed at the tropopause in these period ranges [57]. In order to estimate the trend of the projected wind speed variation amplitude, the latter is averaged over the warmest or coldest half-years, referring to extratropical latitudes. Amplitudes are fitted by a second-degree polynomial and extrapolated beyond 2024 from the first derivative of the polynomial calculated in March 2024 (Figure 2a,b).
The same approach allows estimating the trend of the projected amplitude of the variation in geopotential height (Figure 2c,d) as well as the variation in ground air temperature (Figure 2e,f) or in precipitation rate.

3. Results

3.1. Heatwaves

3.1.1. Heatwave in China (August 2022)

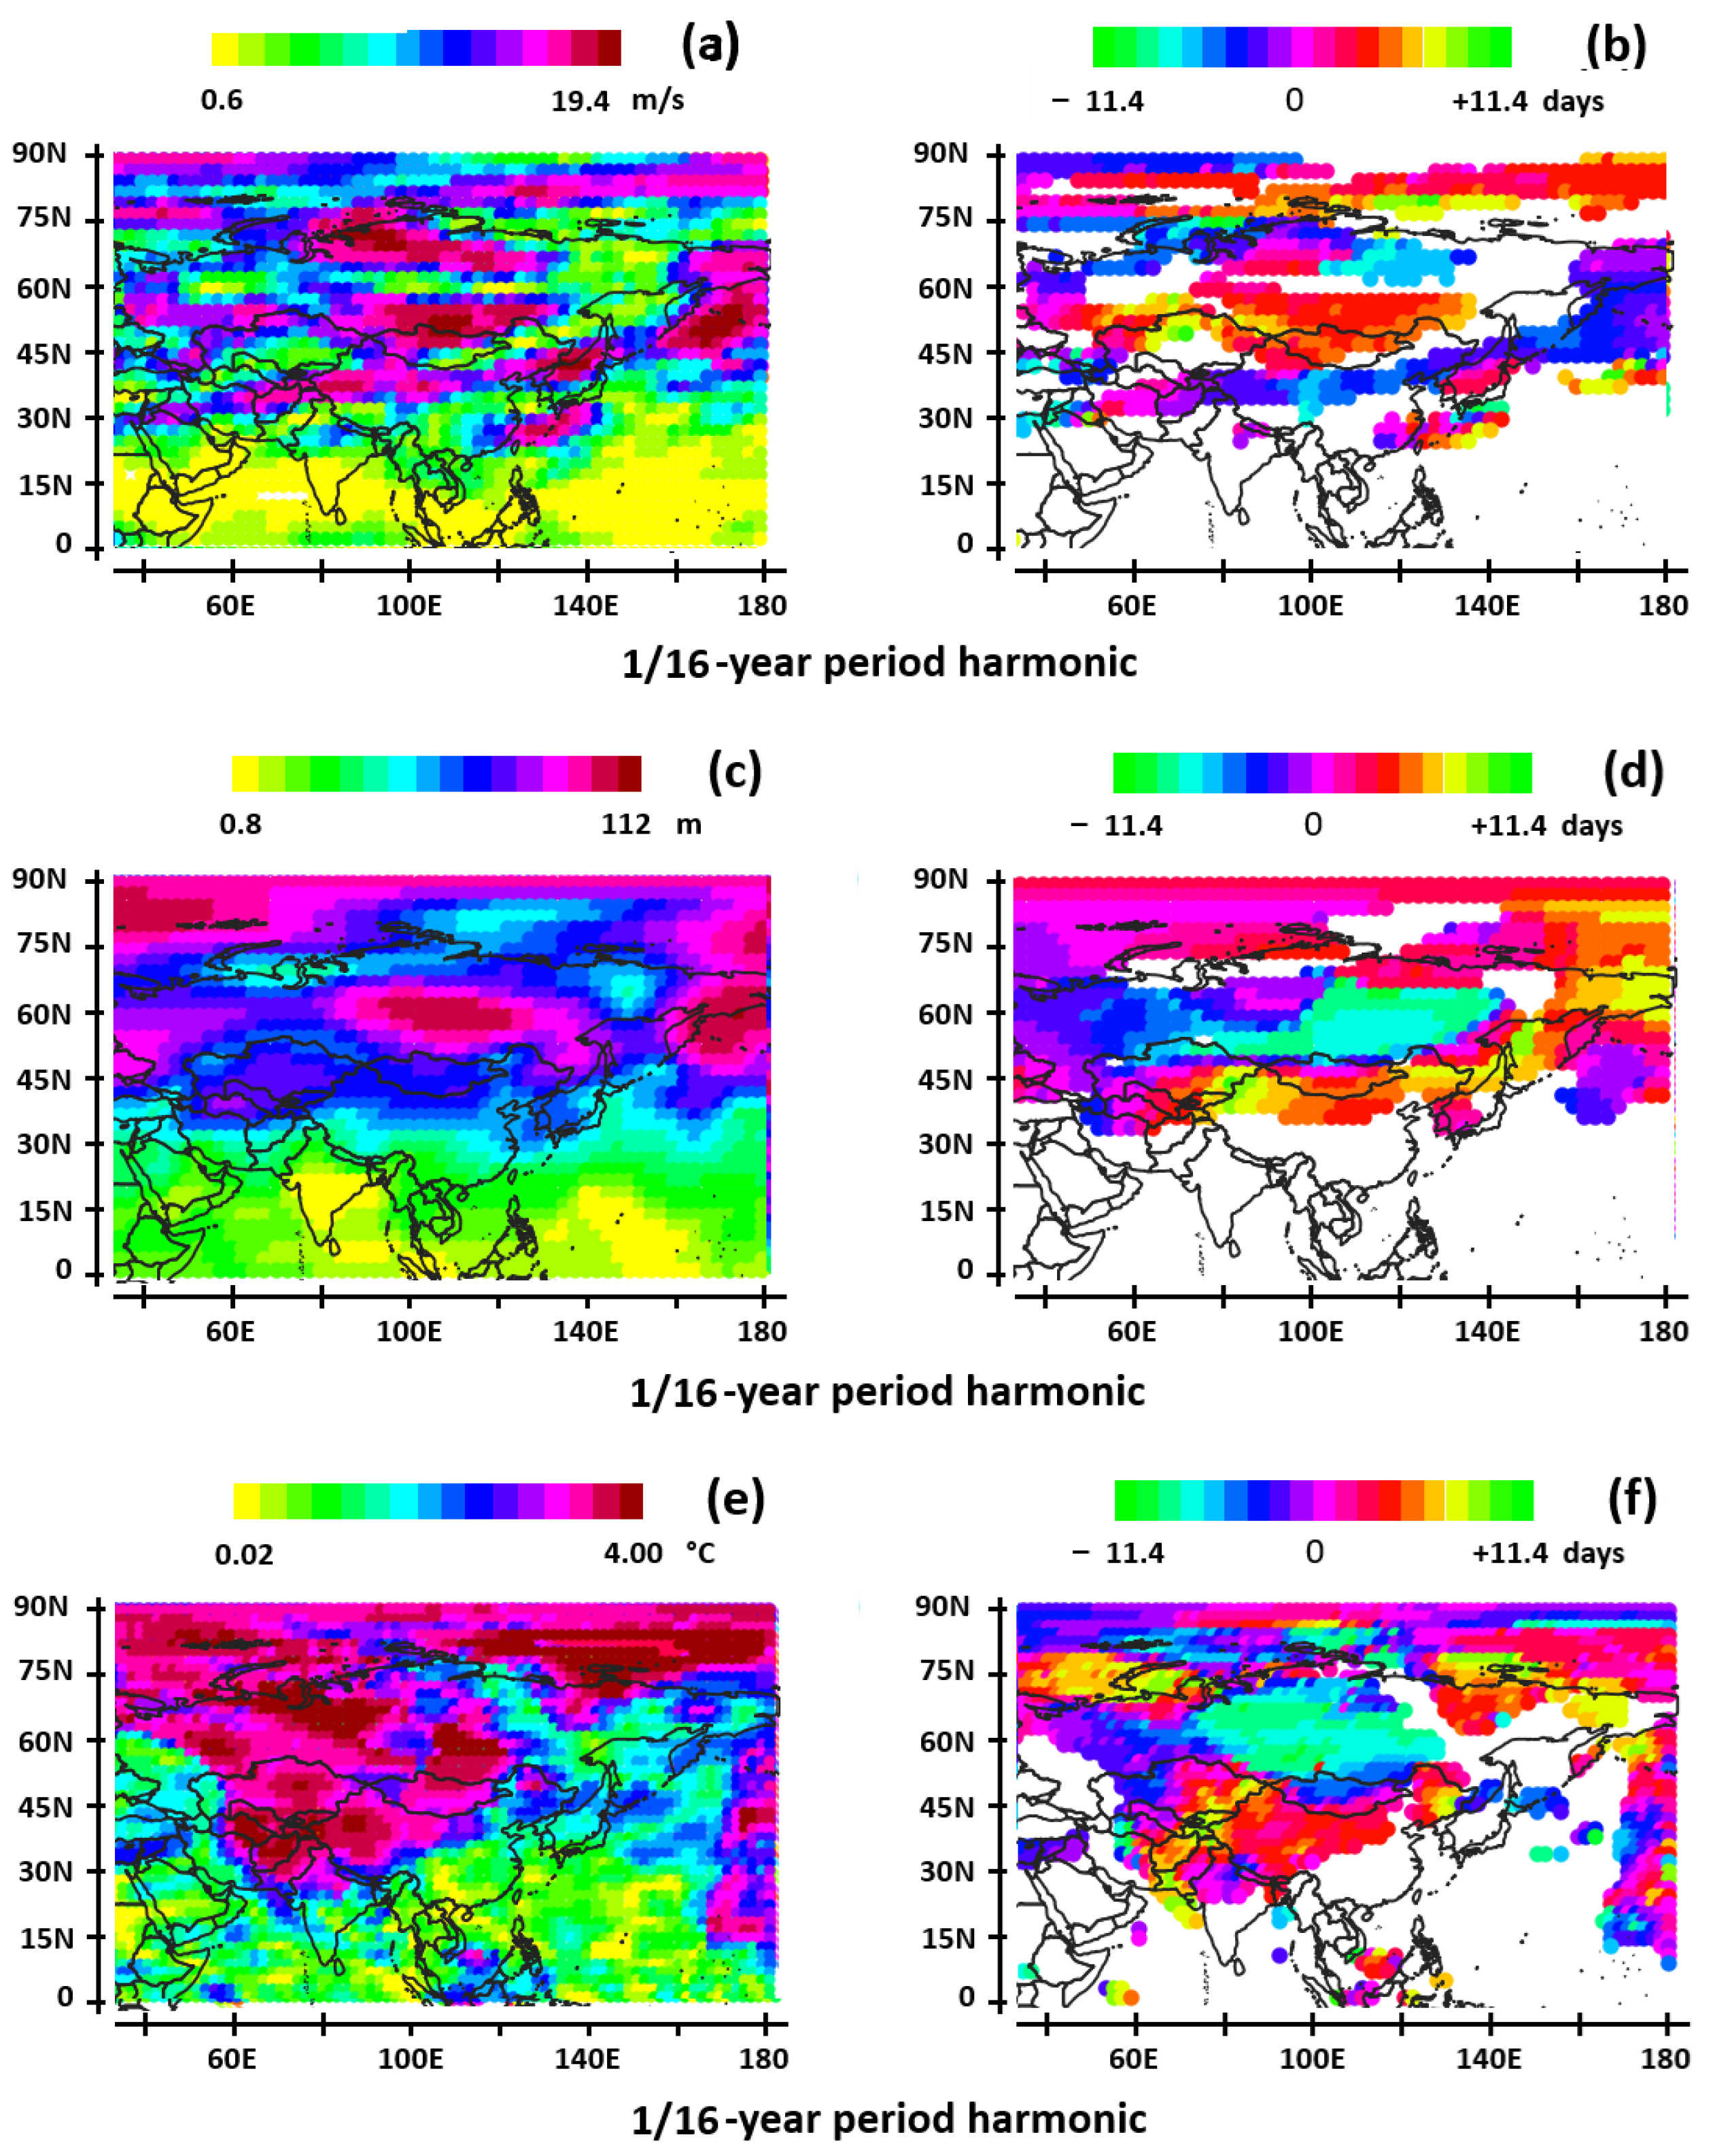
Extremely high temperatures in China in August 2022, which mainly affected the Tibetan Plateau and the Yangtze River basin, are the strongest since 1979 [58]. In the period range of 17.1 to 34.2 days, the spatial and temporal coherence at mid-latitudes of the maps of MA velocities (Figure 3a,b), geopotential height (Figure 3c,d), and temperature anomalies above the ground (Figure 3e,f) show spatial and temporal coherences between the three variables. The MA 6 days after the reference date (Figure 3a,b) is the subtropical MA (phase in orange between latitudes 35° N and 70° N), where a phase reversal occurs at the antinodes (phase segment in light blue). It is centered on latitude 70° N and longitude 120° E. These MAs are respectively in phase with the extratropical cyclone, which follows half a period later the anticyclone to the south of Russia between latitudes 50° N and 60° N (phase in light blue), and the anticyclone located on the Tibetan plateau and northern China between latitudes 35° N and 50° N (phase in orange).
In this way both the cyclone and the anticyclone reach their maximum intensity concomitantly a few days after the reference date, forming a north-south dual cyclone-anticyclone system (Figure 3c,d). The cyclone’s counterpart of the phase-inverted subtropical MA (phase in light blue) extends westward while sliding southward. The anticyclone (phase in red) is limited to the southernmost part of the subtropical MA.
Similar to the subtropical MAs, this dual system formed by two vortices of opposite sign was the opposite of this one half a period earlier. Consequently, the climate system formed by the subtropical MAs and the dual cyclone-anticyclone system is quasi-resonant for the 1/16-year period harmonic mode. This dual system produces two successive heat domes separated by half a period (Figure 3e,f). The first (phase in light blue) is a replica of the anticyclone of the first dual system, which stretches over central Russia in the northeastern part of the South Asian high. The second (phase in red) is a replica of the anticyclone of the following dual system, which stretches over western China, mainly affecting the Tibetan Plateau and the Yangtze River basin.
Note that the MA ahead of the reference date (phase in dark blue in Figure 3a,b) extending eastwards from 30° N to 40° E while sliding towards the north is probably attributable to the intertropical convergence zone (ITCZ) shifted towards the north at the tropopause. This MA is not involved in the formation of the heatwave. However, it pushes the subtropical MA to the north. It is therefore the same for the resulting dual cyclone-anticyclone system and the heat domes. The northward translation of this entire dynamic system could be at the origin of the exceptional nature of the heatwave.

3.1.2. Heatwave in Europe (July–August 2015)

Two heatwaves hit Europe in recent decades, in July–August 2003 and July–August 2015 [59]. The first struck all of Europe, and more particularly the eastern part of France and the western part of Germany, as well as North Africa. The second spared northern Europe but hit mid-latitude Europe as far as western Asia, concentrating mainly on central Europe.
It is the second heatwave that was studied in [53]. The dynamic system formed at mid-latitudes at the tropopause and in the troposphere resonates in the harmonic mode with a period of 1/16 year. A dual cyclone-anticyclone system forms along two conjoined arcs, the first over northern Europe attributable to the polar MA, the other over southern and central Europe attributable to the subtropical MA, in opposite phases. Concomitantly, this dual system produces two successive heat domes spaced half a period apart, slightly shifted towards the south.
In this case study also a MA attributable to the ITCZ is highlighted, strongly shifted towards the north at longitudes 40° W–0°. It pushes the subtropical and polar MAs towards the north without, however, contributing directly to the formation of heat domes.

3.1.3. Heatwave in Europe and Indo-Pakistan (June 2019)

From mid-May to mid-June 2019, the republics of India and Pakistan had a severe heatwave. It was one of the hottest and longest heatwaves in the subcontinent since the two countries began recording weather reports [60]. This June is also the hottest one on record over Central Europe in terms of the number of extremely hot days [61].
Regarding the 1/16-year period harmonic mode, the polar (phase in dark blue between longitudes 130° W and 180°) and subtropical (phase mostly in red) MAs undergo a strong twist at the tropopause, taking a northwest-southeast direction (Figure S1a,b). The northernmost branch of the subtropical MA is subject to a phase reversal at the antinode centered on latitude 70° N (phase in light and dark blue between 60° E and 90° E). The southernmost branch of the subtropical MA is subject to a phase reversal at the antinode west of 60° E (phase in dark blue).
A dual north-south cyclone-anticyclone system forms in spatial and temporal coherence with the subtropical MAs between 40° E and 90° E (Figure S1c,d). The northernmost vortex (phase in blue) centered on latitude 60° N results from the segment of the subtropical MA centered on latitude 70° N whose phase is reversed. The southernmost vortex (phase in red) results from the subtropical MA centered on latitude 50° N, warmest after the reference date (phase in red).
Two heat domes form half a period apart in spatial and temporal coherence with the dual system (Figure S1e,f). In addition to the surface turbulent fluxes generated by the anticyclones, which concentrate the heat in particular locations, warm air is advected from the Sahel and Mediterranean region [61]. Compared to the pattern of MAs over China in August 2022, this time the heatwave is formed further west, which means that the impacted countries are now Central Europe and Indo-Pakistan.

3.1.4. Heatwave in Japan (June–July 2022)

On 1 July 2022, temperatures peaked at 40.2 °C in Isesaki, Gunma Prefecture. It was the hottest heatwave in Japanese history since records began in 1875. The most affected regions are the North of Japan and the Kamchatka Peninsula [62].
Regarding the 1/16-year period harmonic mode, the heatwave probably results from the wind speed anomaly (phase in red) centered on Japan 30° N (Figure S2a,b). Curiously, this MA pattern gives rise neither to a significant geopotential height anomaly (Figure S2c,d) nor to a synoptic heat dome (Figure S2e,f). Japan is on the edge of the heat dome in phase with the warm subtropical MA (phase in red in Figure S2e,f), which is fading away over the Sea of Japan and the northeast of Japan. Therefore, it can be inferred by default that the extreme temperatures result from local conditions, i.e., turbulent surface flows probably favored by the subtropical warm MA over Japan and the particular situation of Japan surrounded by water whose temperature is lower than that of the interior.

3.1.5. Heatwaves in North America

  • Heatwave in the middle plains of Canada and the USA (July 1980)
The 1980 heatwave in Canada and the United States was a period of intense heat and drought that wreaked havoc across much of the Midwestern United States and the Southern Plains throughout the summer of 1980 [63].
Regarding the 1/16-year period harmonic mode, three MAs are clearly visible, in alternating phase opposition: the polar MA around latitude 75° N (phase in dark blue), the subtropical MA between latitudes 45° N and 60° N (phase in red tending towards yellow and green towards the east), and finally the MA above the ITCZ shifted to the north, around latitude 35° N (phase in blue), extending towards the east beyond longitude 60° W (Figure S3a,b).
A dual cyclone-anticyclone system forms over Canada, centered on latitude 60° N, in temporal coherence with the polar and subtropical MAs (Figure S3c,d). The vortex in phase with the polar MA slides slightly southward while stretching in a northeast-southwest direction, pushing westward the vortex in phase with the subtropical MA. This dual system produces two successive heat domes spaced half a period apart, in spatial and temporal coherence with it (Figure S3e,f). A first heatwave formed 3 days before the reference date, 11 July 1980, impacting the central part of Canada and the west of the United States. A second follows around 22 July 1980, mainly impacting the western central part of Canada.
The northward translation of the polar and subtropical MAs and, consequently, of the entire dynamic system is probably at the origin of the exceptional nature of the heatwaves. This northward movement is probably attributable to the northward displaced MA above the ITCZ, which is latitudinally extended over the Atlantic.
  • Heatwave in Western North America (March 2012)
In March 2012, one of the greatest heatwaves occurring in early spring was observed in many regions of North America. Very warm air pushed northward west of the Great Lakes region and subsequently spread eastward [64].
Regarding the 1/32-year period harmonic mode, the heatwave probably results from the wind speed anomaly (phase in red) over the Pacific, centered 30° N (Figure S4a,b). Similar to what we observed in Japan in summer 2022, this MA pattern gives rise neither to a significant geopotential height anomaly (Figure S4c,d) nor to a synoptic heat dome (Figure S4e,f). Impacted areas, which probably result from surface turbulent fluxes, straddle the Pacific and the southwestern coastal region of North and Central America. In both cases, the heatwave seems to result both from a warm MA at the tropopause and from the proximity of the ocean, giving rise to two exceptional events due to their rarity for Japan and due to the date of occurrence for North America.

3.1.6. Heatwave in Australia

  • Heatwave in Australia (January 2009)
South-eastern Australia was affected by one of the most extreme heatwaves in its history in late January and early February 2009. The heatwave extended from 27 January to 8 February, with its most acute phases from 28 to 30 January and on 7 February [65].
Regarding the 1/64-year period harmonic mode, the MAs at the tropopause as a whole have undergone a rotation in altitude so that they are oriented northwest—southeast (Figure S5a,b). Two dual cyclone-anticyclone systems form above the circumpolar ocean in spatial and temporal coherence with the MA pattern (Figure S5c,d). The heatwave that impacts southwestern Australia results from the anticyclone late compared to the reference date (phase in red in Figure S5e,f). It was probably fed by warm, dry air coming from the two anticyclones (phase in blue) centered respectively on latitudes 100° E and 160° E at the beginning of the reversal process of the dual systems, 1–2 days before the reference date. The sequence of phenomena is very rapid because of the short period of the harmonic mode.
  • Heatwave in Australia (February 2017)
The hottest summer on record in 2017 was reached in New South Wales, in southeastern Australia. Temperature records in central and eastern Australia have been broken, leading the Australian Bureau of Meteorology to issue a special climate statement on the exceptional heat [66,67].
Regarding the 1/32-year period harmonic mode, the MA over the polar vortex (phase in light blue centered on latitude 75° S) extends to 160° E, causing it to push both the polar (phase in red centered on latitude 60° S) and subtropical (phase in blue centered on latitude 40° S) MAs northward (Figure S6a,b). A very extended north-south dual cyclone-anticyclone system forms south of Australia in spatial and temporal coherence with the MA over the polar vortex and the polar MA but shifted to the north (Figure S6c,d).
Like in the previous case study, the heatwave that impacts southwestern Australia results from the anticyclone late compared to the reference date (phase in red in Figure S6e,f). It was probably fed by dry air coming from the anticyclone over Antarctica (phase in light blue) at the beginning of the reversal process of the dual systems, 4 days before the reference date.

3.1.7. Heatwave in South Africa (January 1993)

The closest temperature recorded since 3 November 1918 (the temperature reached 50 °C in the Eastern Cape) is 48.8 °C at Vioolsdrif near the border with Namibia on 2 January 1993 [68].
Regarding the 1/16-year period harmonic mode, the heatwave is located straddling the Indian Ocean and the extreme south-east of the African continent and Madagascar. Here again, the heatwave seems to result both from a warm MA at the tropopause and from the proximity of the ocean, giving rise to an exceptional event occurring at low latitude around 25° S (Figure S7e,f). The heatwave starts on the African continent, nearly in spatial and temporal coherence with the MA centered on the latitude 20° S (phase in blue in Figure S7a,b), before migrating eastwards outside of any anticyclonic system in phase with the event (Figure S7c,d).

3.2. EPEs Occurring in Boreal/Austral Summer

3.2.1. Floods in Asia

Concerning EPEs that occurred in the Far East during the summers of 2012 and 2021, they have a high return period, which is difficult to assess due to the scarcity of such events leading to abnormally high precipitation amounts in a short time interval, typically more than 150 to 200 mm in one day or less [69]. Such events may cause many casualties, especially when runoff water is concentrated due to the terrain because the infrastructure is generally unsuitable. These remarks apply to all EPEs.
  • Flood in Japan (July 2012)
During 11–14 July 2012, deadly floods and landslides triggered by a series of unprecedented heavy rains hit Kyushu, Japan [70]. This EPE that occurred in South Korea and the south of Japan was documented in the previous paper [53]. The exceptional character of the precipitation is attributable to a dual cyclone-anticyclone system, favoring northerly moisture-laden winds from the Pacific towards Japan.
  • Floods in China (July 2021).
The rare extreme flooding event in Henan Province, China, during July 2021 was attributable to persistent heavy rainfall boosted by an enhanced moist southeasterly flow and substantial moisture convergence [71].
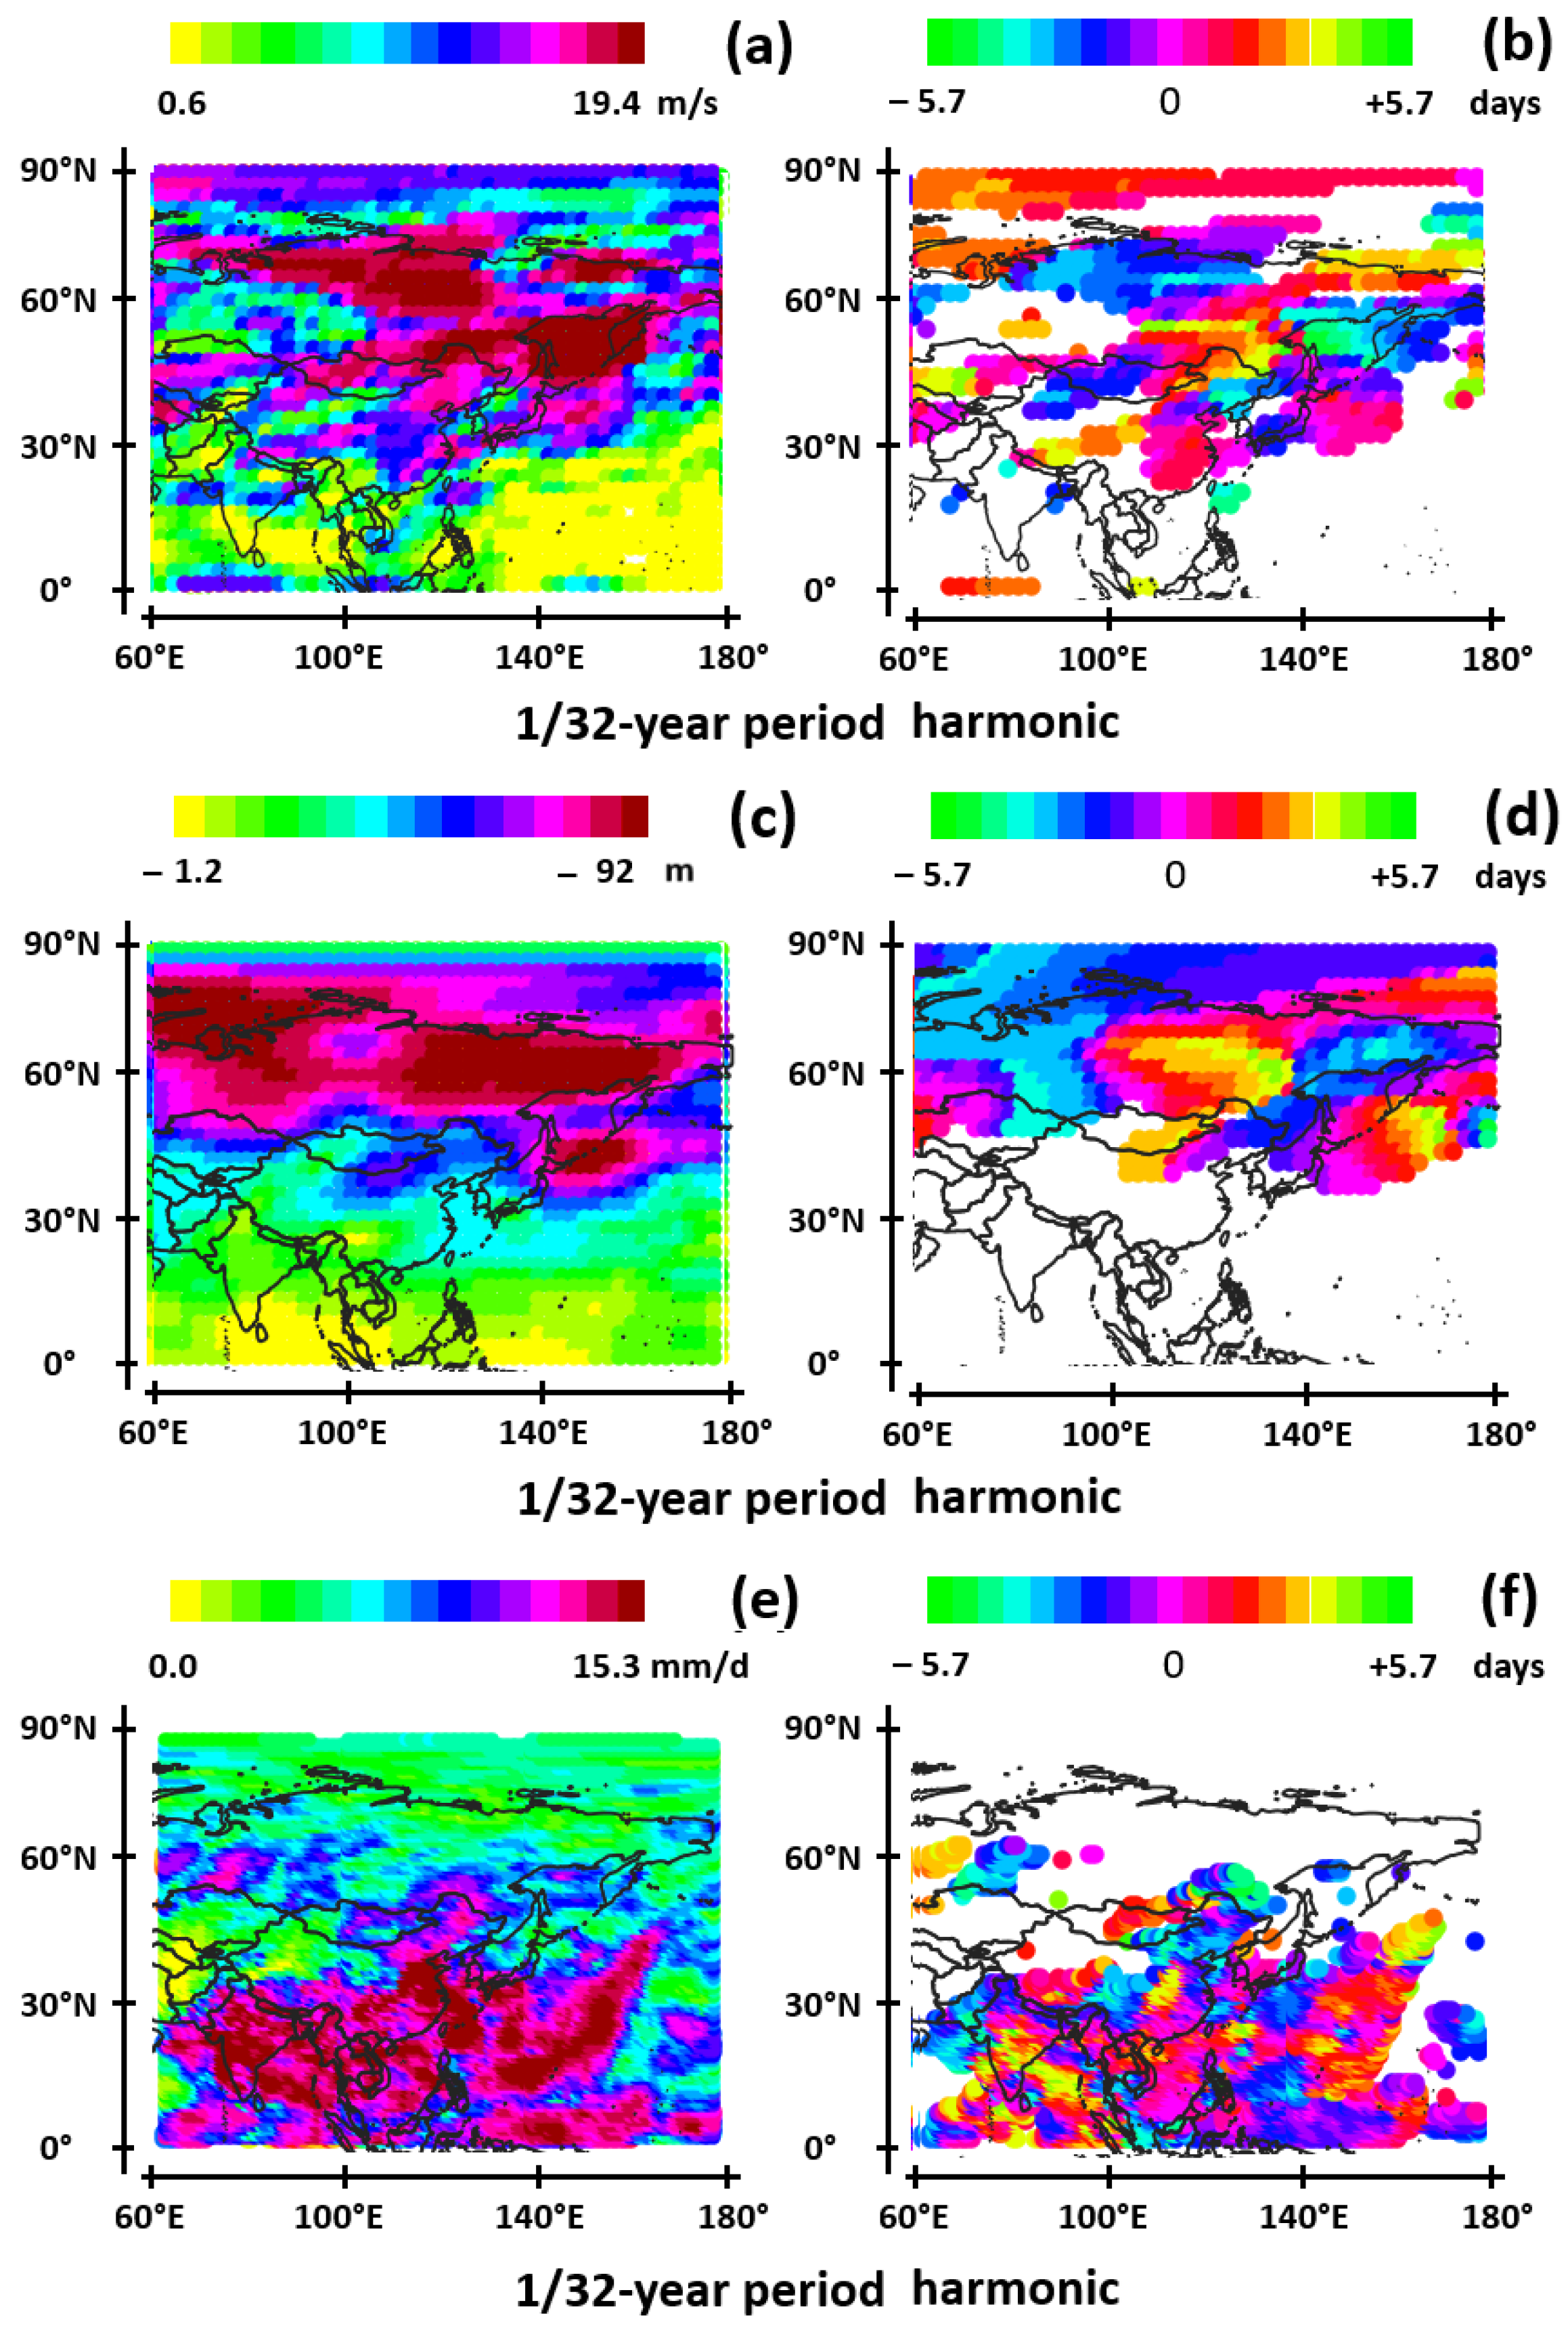
In the period range 8.56 to 17.1 days, the spatial and temporal coherence of the maps of MA velocities (Figure 4a,b) and geopotential height (Figure 4c,d) reveals an extratropical cyclone northeast of the Tiberian Plateau and above the northwestern Pacific (phases in orange and yellow in both cases). Both low-pressure systems result from the subtropical MAs between latitudes 25° N and 60° N, whose phases are mostly in red (Figure 4a,b). High-pressure systems (phase in blue) result at mid-latitudes from the phase inversion at the antinodes experienced by the subtropical MA (phase segments in blue) between 40° N and 60° N.
The exceptional character of the precipitation over China and the western Pacific is attributable to the two dual cyclone-anticyclone systems. They are made up of the two subtropical cyclones and the intercalated phase-shifted by half a period high-pressure system between latitudes 35° N and 75° N. Consequently, both northeasterly moisture-laden winds from the Pacific to China and southwesterly winds from the Tibetan plateau are favored. The coexistence of very fragmented phases of precipitations in the eastern part of China confirms multiple influences from the Pacific (Figure 4e,f).
Two episodes of rain are discernible. A first episode over the Tibetan plateau ahead of the reference date (phase in blue) is attributable to the southwestward movement of the low-pressure system over eastern Russia. A second episode over southeastern Asia and east of China over the Pacific behind the reference date (phase in red) is attributable to the southward movement of the three low-pressure systems at mid-latitudes (Figure 4c,d).
This case study highlights quasi-resonance of the 1/32-year period harmonic mode. The dual systems enter into quasi-resonance under the effect of the forcing of the MAs. The optimum harmonic mode determined from the observation of the MA velocities therefore also concerns the geopotential height and the precipitation rate. Consequently, the climate system involving MAs, vortices, and precipitation rate can be considered as quasi-resonant as a whole.

3.2.2. Flood in Europe (May–June 2016)

The EPEs that occurred in Western and Northern Europe are the subject of particular attention because they occurred in regions known to be non-floodable, with, as the main witness, the castle of Chambord, which was flooded for the first time since its construction under the reign of François I in 1519. There is no doubt that these newly appearing summer floods at high latitudes are linked to global warming. The heavy rains began on 26 May when a large cutoff low spurred the development of several slow-moving low-pressure disturbances. Fueled by warm and humid air from the south, this caused clusters of heavy thunderstorms (mesoscale convective system) in Germany and very heavy large-scale rainfall combined with showers on an almost-stationary convergence zone over France [72].
In the period range 8.56 to 17.1 days, the spatial and temporal coherence of the maps of MA velocities (Figure S8a,b) and geopotential height (Figure S8c,d) reveals an extratropical cyclone over Europe (phase in red-orange) flanked by two high-pressure systems centered on latitude 45° N (phases in blue). The extratropical cyclone results from the subtropical MAs between latitudes 25° N and 60° N, whose phases are mostly in red (Figure S8a,b). High-pressure systems result at mid-latitudes from the phase inversion at the antinodes experienced by the subtropical MA (phase segments in blue). The westernmost anticyclone moves eastward in the direction of Europe during its formation.
The exceptional character of the precipitation over Europe is first attributable to the dual cyclone-anticyclone system between longitudes 10° W and 50° E (Figure S8e,f), which favors cold northwesterly moisture-laden wind from the North Atlantic. Thunderstorms form where it meets warm and humid air from the south of Europe. On the other hand, the exceptional precipitation height lies in the size of the extratropical cyclone resulting from the latitudinal extension of the subtropical MA, which favors the feeding of the cyclone by the warm semi-enclosed seas, including the Mediterranean Sea, as well as by the Atlantic Ocean at the latitude of western Europe.
Two successive EPEs occur. The first episode (phase in blue in Figure S8e,f) impacts Western Europe. It is attributable to the westernmost vortex of the dual cyclone-anticyclone system. The second episode mainly impacts central Europe (phase in red). It is attributable to the easternmost vortex of the dual cyclone-anticyclone system.

3.2.3. Floods in North America

  • Flood in Alberta, Canada (June 2005)
In June 2005, a family of four consecutive major rainstorms passed over southern Alberta, Canada. A synoptic analysis shows that short wave troughs and cold lows at the 500 mb level were the major steering systems. Another common feature was a well-defined moisture tongue at 700 mb and 850 mb. The moisture was absorbed by a lower-level jet. The surface maps indicated that a quasi-stationary inverted trough or trowal (Trough of Warm Air Aloft) occurred [73].
In the period range 17.1 to 34.2 days, the spatial and temporal coherence of the maps of MA velocities (Figure S9a,b) and geopotential height (Figure S9c,d) highlights an extratropical cyclone above the Pacific centered on latitude 50° N (phase in red) and a vast high-pressure system above Canada (phase in blue). The extratropical cyclone results from the subtropical MA above the Pacific centered on latitude 40° N (phase in red). The anticyclone is initiated by the polar MA between latitudes 40° N and 60° N, whose phase (in blue) is uniform.
The exceptional character of the precipitation over central North America (phase in red) is attributable to the dual cyclone-anticyclone system (Figure S9e,f). It favors southeasterly moisture-laden winds from the Pacific to central North America as well as a vast SST anomaly resulting from the extratropical cyclone above the Pacific, which promotes convective processes both in the subsurface water of the ocean and in the troposphere, concomitantly with the EPE [69].
  • Flood in Louisiana, USA (August 2005)
In the early morning of 29 August 2005, Hurricane Katrina made landfall near Buras, Louisiana, as a Category 4 hurricane. With wind speeds of about 233 km per hour, a storm surge of 8.5 m, and heavy rains, Katrina pounded the U.S. Gulf Coast states of Alabama, Louisiana, and Mississippi with life-threatening flooding and destruction [74].
In the period range 8.56 to 17.1 days, the spatial and temporal coherence of the maps of MA velocities (Figure 5a,b) and geopotential height (Figure 5c,d) highlights an extratropical cyclone above the Atlantic centered on latitude 50° N (phase in red), a vast high-pressure system above central-western North America (phase in blue), and a low-pressure system above western Canada (phase in red-yellow-green). The three high- and low-pressure systems are in temporal and spatial coherence with the polar MA (phase in blue) and subtropical MA (phase in red to the east, red-yellow-green to the west).
Following the vast cold drop above the Atlantic (phase in red) that lasts 6 days (half the period of the harmonic) along the subtropical MA centered on latitude 40° N, the extratropical cyclone stretches from the northwestern Atlantic to southeastern North America, precipitation maps show (phase in red in Figure 5e,f). This low-pressure system merges with the subtropical cyclone forming over the Gulf of Mexico (phase in blue), reinforcing its supply by moisture-laden northeasterly winds over the Atlantic. This wind is attributable to the dual cyclone-anticyclone system between longitudes 40° W and 90° W (Figure 5c,d). Sea-air interactions and positive feedback occur in the Gulf of Mexico and off the east coast of the USA [53]. In fact, the subtropical cyclone forms off the coast of Florida before arcing over the Gulf of Mexico., then making landfall in Louisiana.
As shown in Figure 5a,b, this event is exceptional due to the abundance of precipitation when the cyclone landed; this event is also exceptional due to the polar and subtropical MA pattern that gave rise to this event. The pattern visible in Figure 6a,b where the polar MA (phases in blue) and subtropical MA (phases in red) alternate obliquely in the northeast-southwest direction in fact concerns the entire northern hemisphere north of latitude 40° N (Figure 6). Four pairs of polar and subtropical MAs are visible, which shows that the circulation of polar, Ferrel, and Hadley cells twists as a whole at the tropopause.

3.2.4. Flood in Mozambique (February 2007)

Tropical Cyclone Favio ripped through an already flooded Mozambique with rain and winds nearing 200 km/h, exacerbating flooding of the Zambeze river valley [75].
In the period range of 8.56 to 17.1 days, the spatial and temporal coherence of the maps of MA velocities (Figure S10a,b) and geopotential height (Figure S10c,d) highlights a giant extratropical cyclone above the circumpolar ocean (phase in red) interspersed with a high-pressure system south of the African continent (phase in blue).
The exceptional character of the precipitation over southeastern Africa and Madagascar (phase in red in Figure S10e,f) is attributable to the dual cyclone-anticyclone system over the circumpolar ocean east of longitude 20° E. This dual system favors southerly moisture-laden winds over the circumpolar ocean as well as an extended SST anomaly in phase with the EPE at the south of Africa [53].
The exceptional extension of the low-pressure system reflects the latitudinal extension of the cold subtropical MAs (phase in red and yellow between latitudes 60° S and 40° S). It is subject to phase inversion at the antinode along the branch centered on latitude 30° S (phase segment in blue) at the origin of the dual cyclone-anticyclone system.

3.2.5. Flood in Victoria, Australia (January 2011)

This case study was presented in the method section.

3.3. EPEs Occurring in Boreal/Austral Winter

3.3.1. Flood in Kentucky, USA (February 2004)

The dynamical structure of extreme floods in the U.S. Midwest is associated with a similar pattern of sustained advection of low-level moisture and warm air from the tropical Atlantic Ocean and the Gulf of Mexico. The typical flow conditions are governed by an anomalous semi-stationary ridge, situated east of the U.S. East Coast, that steers the moisture and converges it into the Ohio River valley [76].
In the period range 8.56 to 17.1 days, the spatial and temporal coherence of the maps of MA velocities (Figure S11a,b) and geopotential height (Figure S11c,d) highlights a dual cyclone-anticyclone system east of the eastern coasts of North America centered on latitude 40° N. It is made up of an extratropical cyclone to the west (phase in red) and an anticyclone to the east (phase in blue), both resulting from the phase inversion at the antinode 30° W longitude of the subtropical MA centered on the latitude 40° N (phases of the same color). A high-pressure system is highlighted over Canada (phase in blue) centered on latitude 50° N, resulting from the polar MA (phase in blue).
The exceptional character of the precipitation over southeastern North America (phase in red in Figure S11e,f) is attributable to the dual cyclone-anticyclone system over the Atlantic Ocean. It favors warm, moisture-laden southwesterly winds from the tropical Atlantic Ocean and the Gulf of Mexico, which promotes air-sea interactions off the southeast coasts of North America to pour down torrential rains in the eastern states of the United States.

3.3.2. Flood in Argentina (August 2015)

On 4 August 2015, intense storms and flooding were monitored in the central and north-eastern parts of Argentina. The intense rainfall and storms continued the following day in the province of Buenos Aires. The rainfall caused river levels to rise [77].
In the period range 8.56 to 17.1 days, the spatial and temporal coherence of the maps of MA velocities (Figure S12a,b) and geopotential height (Figure S12c,d) highlights a dual cyclone-anticyclone system over the Atlantic Ocean off the southeastern coast of South America. Located between latitudes 70° S and 40° S, it is made up of an extratropical cyclone and an anticyclonic system extending diagonally oriented southwest northeast. The low-pressure system is the furthest north (phase in blue), and the high-pressure system is the furthest south (phase in red).
This dual cyclone-anticyclone system results from the polar MA centered on latitude 50° S (phase in blue), warm when it is phase-shifted by half a period, and the cold MA above the polar vortex centered on latitude 70° S (phase in red). Note that the subtropical MA (phase mostly in red) is not involved in the formation of the dual cyclone-anticyclone system, although it is subject to phase inversion at the antinode. As shown in Figure S12e,f, intense precipitation occurs in two stages in the northeastern part of Argentina, first to the north, then to the south (phase partly in red, partly in blue). The exceptional character of the precipitation is attributable to the dual cyclone-anticyclone system that favors moisture-laden southwesterlies over the Atlantic.

3.3.3. A Mediterranean Episode (November 2013)

On 18 November 2013, the north-eastern part of Sardinia was impacted by extreme flash flooding associated with the extratropical cyclone Cleopatra in the western Mediterranean Basin. The cyclone developed slow-moving embedded thunderstorm complexes as cold air flowing from the north entered the Mediterranean and interacted with warm, moist air to the east [78].
In the period range 8.56 to 17.1 days, the spatial and temporal coherence of the maps of MA velocities (Figure S13a,b) and geopotential height (Figure S13c,d) highlights two low-pressure systems over western (phase in red and yellow) and eastern Europe (phase in red). The Mediterranean EPEs, which can reach a rare amplitude, are generally generated by a latitudinally extended cold drop between latitudes 35° N and 50° N. Here, it results from the cold subtropical MA (phase in red) above Europe and the Atlantic off the French western coast (Figure S13a,b).
The MA pattern is recurrent, and the extratropical cyclones form over the western Mediterranean in late autumn, while air masses are all the more easily destabilized as the temperature difference between the warm semi-enclosed seas and the cold drop is higher. In addition to the Atlantic Ocean and the Western, Central and Eastern Mediterranean Seas, the Black Sea, the Baltic Sea, and the North Sea can contribute to fueling the vast depression, which is evidenced by the SST anomalies when they are in phase with the EPE [79].
The exceptional character of the precipitation over southeastern Europe (phase in red in Figure S13e,f) is attributable to the latitudinally extended cold drop. Here, the Persian Gulf regions are also affected due to the MA that connects the subtropical MA to the ITCZ without changing the phase and extends the cold drop to the Gulf countries (Figure S13a,b).

4. Discussion

4.1. The Various MA Patterns Capable of Producing a Heatwave

The case studies clearly demonstrate that heatwaves only form under specific patterns of the MAs at the tropopause. Two well-characterized circumstances can lead to heatwaves. This may be due to the formation of a quasi-resonant dual cyclone-anticyclone system, as evidenced in six case studies. In this case, the dual system inverts during the period of the dominant harmonic mode in spatial and temporal coherence with the MA pattern. Of the two vortices in phase opposition forming the dual system, it is always the later anticyclone that induces the exceptional character of the heatwave. The close link between the MA pattern and the dual system means that the two vortices are intertwined, their rapprochement favoring the transfer of dry air at the beginning of the inversion process. The transfer of dry air occurs from the descending air column of the earliest anticyclone to the rising air column of the cyclonic system undergoing transformation. This would have the property of reinforcing the anticyclonic character of the later vortex.
The formation of such dual systems requires the joint presence of MAs in phase opposition. This coincidence occurs quite frequently, either when the phase reverses at the antinodes of the subtropical MA, or when two MAs in the opposite phase are jointly involved. In this case, it is generally the polar and subtropical MAs that are involved, but it can be the conjunction of the MA above the polar vortex and the polar MA as happened during the heatwave in Australia in February 2017.
Another process leading to the formation of heatwaves is highlighted in three case studies (Japan, June–July 2022, North America, March 2012, and South Africa, January 1993): Surface turbulent fluxes occur in response to the emergence of a warm MA above the impacted region when it is located near an ocean. These two processes produce different effects without forming a geopotential height anomaly or a heat dome. The first induces two successive heatwaves, the second being more intense than the first while impacting large areas. The second process produces more localized extreme events that seem accidental due to their location or date of occurrence.
High-pressure systems can, in certain cases, produce a heat dome, but although the conditions necessary for their development seem well understood, they are not sufficient. In particular, as in the case of extreme precipitation events (EPEs), the formation of heat domes necessarily involves positive feedback phenomena that amplify the thermal anomaly of the air at the surface. At mid-latitudes, the positive feedback involved in the genesis of EPEs results mainly from water vapor issuing from the low-altitude convergence of air and air-sea interactions, accompanied by a phase transition of the water vapor into droplets and, eventually, precipitation with release of latent heat. Positive feedback is more difficult to identify in the case of heat domes, in particular when dual cyclone-anticyclone systems are involved. It appears to result from the low water vapor content in the descending air of the anticyclone, which is issuing from the convergence of warm, dry air aloft, eventually accompanied by a phase transition of droplets into water vapor at low altitude. This promotes clear skies and better penetration of short-wavelength radiation into the atmosphere.

4.2. The Various MA Patterns Capable of Producing an EPE

The variability of the direction and the latitude of MAs makes it difficult to attempt precise predictions, even if limited to simple trends, of the evolution of the intensity and frequency of the EPEs. These cautious assertions result from the observation of MA velocities in characteristic period ranges, highlighting unsuspected phenomena such as a transient reorganization of polar, Ferrel, and Hadley cells at high altitudes. This is what was observed on 29 August 2005 in the period range of 8.56 to 17.1 days when the polar and subtropical MA velocities exhibited pairs of bands arranged diagonally throughout the northern hemisphere. This pattern, according to four pairs of main bands, led to the formation of a cold drop off the southeastern coast of North America followed by an EPE of rare intensity, Hurricane Katrina.
Apart from this very exceptional pattern of the polar, Ferrel, and Hadley cell circulation in the tropopause in summer, other more frequent circumstances can lead to high-amplitude EPEs. In the majority of cases, the exceptional event occurs concomitantly with the formation of a dual cyclone-anticyclone system above an ocean, which favors moisture-laden winds. Extreme precipitation can occur when cold moisture-laden winds meet warm air masses or when warm moisture-laden winds meet cold air masses. In spatial and temporal coherence with the pattern of MA velocities, the dual cyclone-anticyclone system most often results from a phase inversion at the antinode of the subtropical MA, more rarely from the conjugation of the polar and subtropical MAs, or from the polar MA and the MA above the polar vortex. Except for the Mediterranean event, all EPEs seem subordinate to the formation of a dual cyclone-anticyclone system. This key role could result from a transfer of humid air between the two vortices during the inversion of the dual system. The enrichment of water vapor in the forming cyclone to the detriment of the former cyclone would have the power to reinforce the EPE.
Regarding the Mediterranean extratropical cyclone, it occurs at the end of autumn, as in the majority of cases, when the semi-closed Mediterranean Sea is warm. It results from the cold drop extended on both zonal and latitudinal scales that is the cold subtropical MA over western and central Europe. These conditions of formation are specific to all Mediterranean episodes, which is the reason why they are often considered tropical-like cyclones. They form over the warm Mediterranean Sea, generally off the coast of France or Spain, in favor of a cold drop over southern Europe. It is from the analysis of the phenomenon that the term cold drop (“gota fria” in Spanish) was born.
The chain of cause-and-effect relationships shows that the 1/32-year period harmonic is often dominant. This means that the duration of blocking is 5.7 days, i.e., half the period of the harmonic (the duration is double in the case of Alberta). However, these necessary conditions are not sufficient to produce an EPE. Air masses are all the more easily destabilized, with increased baroclinic instability energy, when the temperature difference between the Earth’s surface and the cold drop is higher. The evolution of low-pressure systems and extratropical cyclones is closely controlled by latent heat released during the cyclogenesis; they most often occur in conjunction with the evolution of the sea surface temperature anomalies of the open waters involved. There is a causal link from the cold drop to the storm dynamics. The cold drop imposes the precise date of the triggering of cyclogenesis as well as the duration of the blocking, which depends on the harmonic mode, while favoring the coalescence of low-pressure systems to initiate a large-scale extratropical cyclone. The cold drop favors any upward movement of humid air due to diabatic heating feedback. In this way, an extremely strong local ascent motion leading to an EPE may occur, which essentially reflects mesoscale disturbances of the low atmosphere.

4.3. Projected Amplitude of Variation of the Wind Speed at the Tropopause, the Geopotential Height, the Ground Air Temperature, and the Precipitation Rate

The application of the methodological approach presented in Section 2.3 to the entire globe reveals the projected amplitude of variation of the wind speed at 250 mb, the geopotential height at 500 mb, and the ground air temperature. The aim of this regionalized approach is to provide quantitative information on the future evolution of the climate focused on extreme events on a scale of one to two decades.
Compared to previous work on the future of the climate in the context of climate change, the present study expresses the three variables in harmonic modes, which allows (1) to separate the phenomena according to the duration of blockage—(2) to express the amplitude of variation of the three variables as a function of time within a characteristic period range, therefore to make forecasts by extrapolating observations from January 1979 to March 2024 fitted with a low-degree polynomial. This method allows reducing both random and systematic errors when values are extrapolated beyond the last observation.
The phenomena are also separated by whether they occur in the colder or warmer months. This necessity arises from the seasonality of MAs at the tropopause. For each period, the three variables therefore give rise to two figures. Those following refer to the period range of 17.1–34.2 days. Figures S15–S19 refer to the period range of 8.56–17.1 days. In order to facilitate the comparison of the amplitudes from one figure to another, the same scale is used for each of the variables. Classes are divided into quantiles (parts of equal extent) so that the amplitudes remain constant in the class represented in yellow. The amplitude of variation increases all the more as the color of the class approaches brown. In this case, the amplitude experienced a minimum. Contrarily, the amplitude of variation decreases all the more as the color of the class approaches green. In this case, the amplitude experienced a maximum.

4.3.1. Projected Amplitude of the Variations in Wind Speed at 250 mb

  • The coldest half-year referring to extratropical latitudes
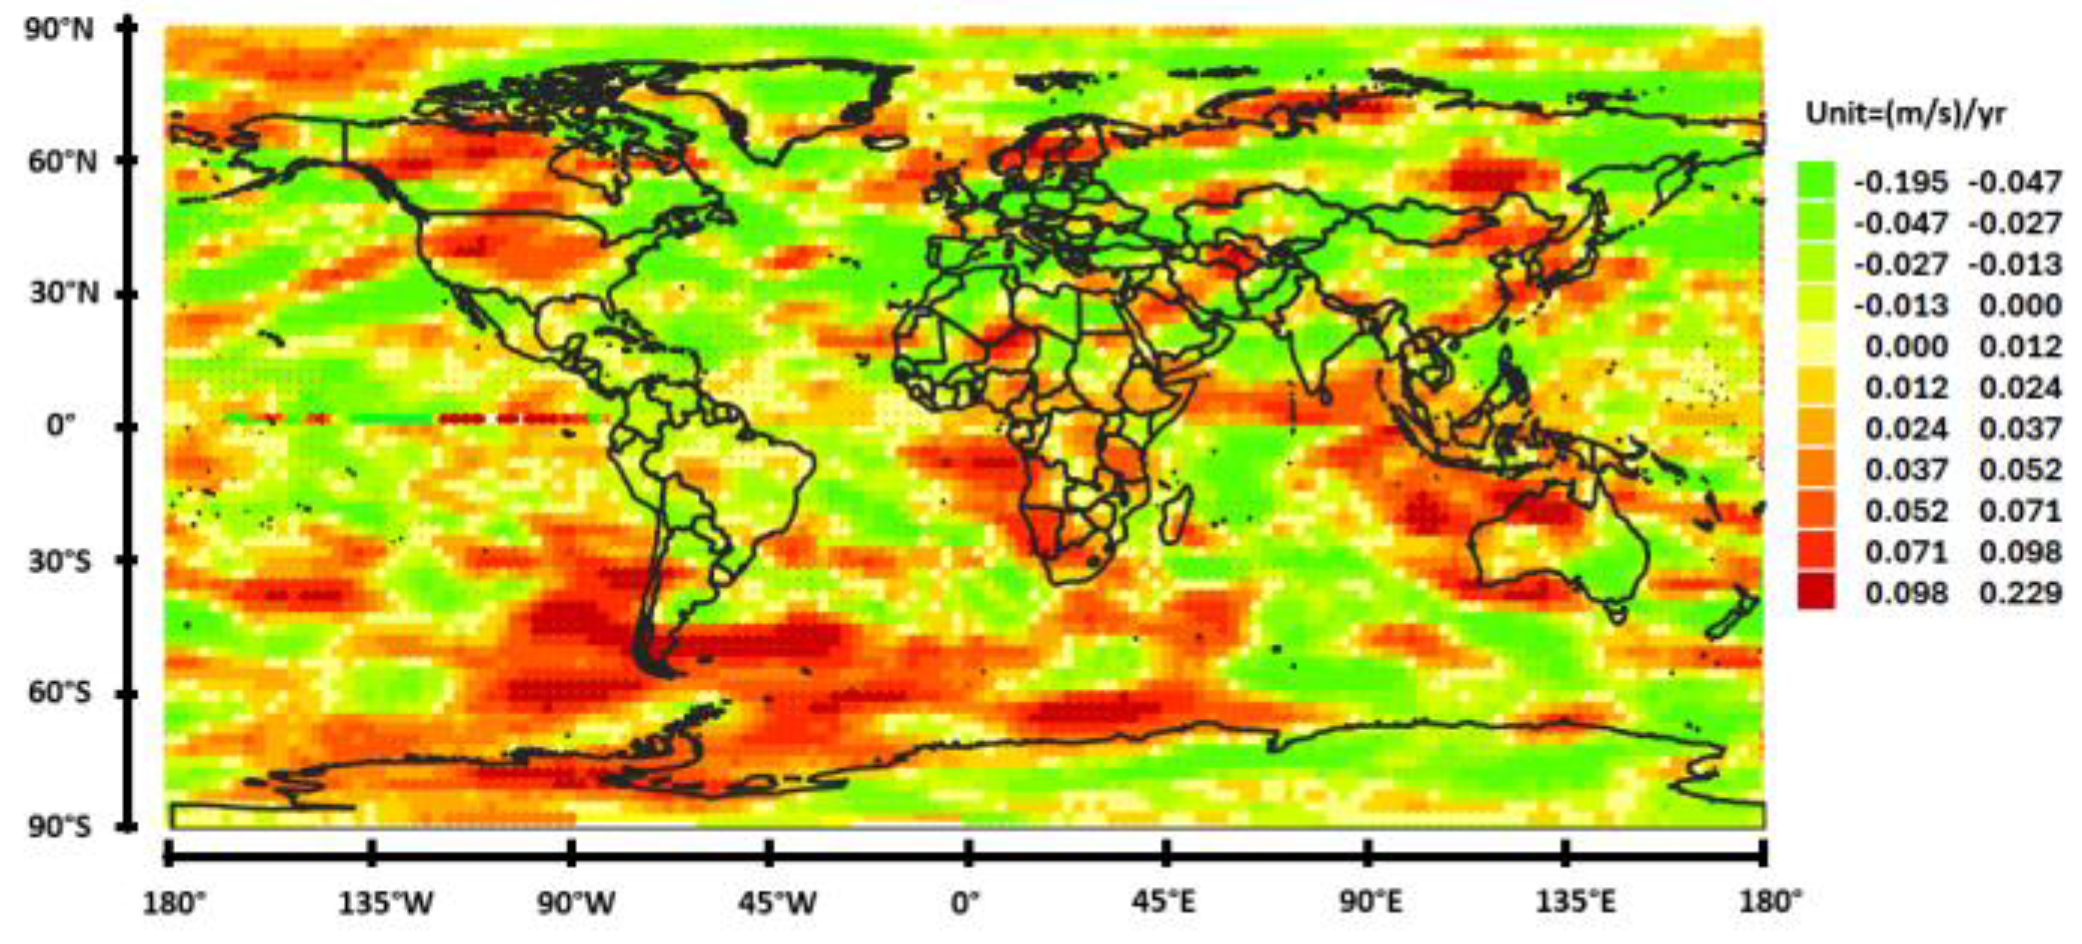
In the northern hemisphere, four extratropical regions are subject to an increase in the amplitude of MA speed in the period range 17.1–34.2 days (Figure 7). These are (1) Far East Asia and the Northwest Pacific, (2) Central North Asia, (3) Europe and the North Atlantic, and (4) Western North America and the Arctic. At lower latitudes, they are Southeast Asia, West Asia, and East Africa. In the Southern Hemisphere, the main regions are the north-facing arc of the Indian Ocean, southern South America, southern South Atlantic, and West Antarctica. The continent most impacted is Europe, with an increase in the amplitude of MA speed variation greater than 0.1 (m/s)/yr.
In the period range 8.56–17.1 days, the most impacted regions are the Arctic, Europe, central and eastern Canada, central North and South Pacific, Southeast Asia, southern South Atlantic, and West Antarctica (Figure S14). The amplitudes of MA speed variation are lower than what is observed in the period range of 17.1–34.2 days, suggesting that the dominant harmonic has a period of 1/16 year.
  • The warmest half-year referring to extratropical latitudes
While the affected regions are similar in the period range 8.56–17.1 days (Figure S15), whether in the hottest or coldest months, they differ significantly in the period range 17.1–34.2 days (Figure 8). During the warmer months, the northern hemisphere is little affected, with the exception of North America and Southeast Asia. On the other hand, the anomalies observed in the southern hemisphere are more extensive. They concern Southeast Asia and the eastern Indian Ocean, the southern Atlantic Ocean, as well as the extreme southeast of the Pacific Ocean.

4.3.2. Projected Amplitude of the Variations in the Geopotential Height at 500 mb

  • The coldest half-year referring to extratropical latitudes
At extratropical latitudes, the anomalies observed regarding the amplitude of the MA speed variations in the period range 17.1–34.2 days are broken down into much more extensive anomalies regarding the amplitude of the geopotential height variations (Figure 9). Apart from a few islets that are spared, the entire northern hemisphere is subject to an increase in the amplitude of the geopotential height variation, which means an increase in the intensity of cyclonic and anticyclonic systems. Here again, Europe is very impacted. In the southern hemisphere, an anomaly extends from the southeast Pacific Ocean to the southwest Indian Ocean, continuously involving the southern Atlantic Ocean with a few islets.
As for the period range of 8.56–17.1 days, far fewer regions are affected, only Europe and the Arctic in the northern hemisphere. In the southern hemisphere, Antarctica is little impacted (Figure S16).
  • The warmest half-year referring to extratropical latitudes
As for the period range 17.1–34.2 days, here again, the southern hemisphere is more impacted than the northern hemisphere, the regions subject to an increase in the amplitude of the geopotential height variation forming a band with a few islets south of 20° S (Figure 10). Regarding the period range 8.56–17.1 days, the impacted regions are sparser and of lower amplitude than in the previous period range (Figure S17).

4.3.3. Projected Amplitude of the Variations in Ground Air Temperature

  • The coldest half-year referring to extratropical latitudes
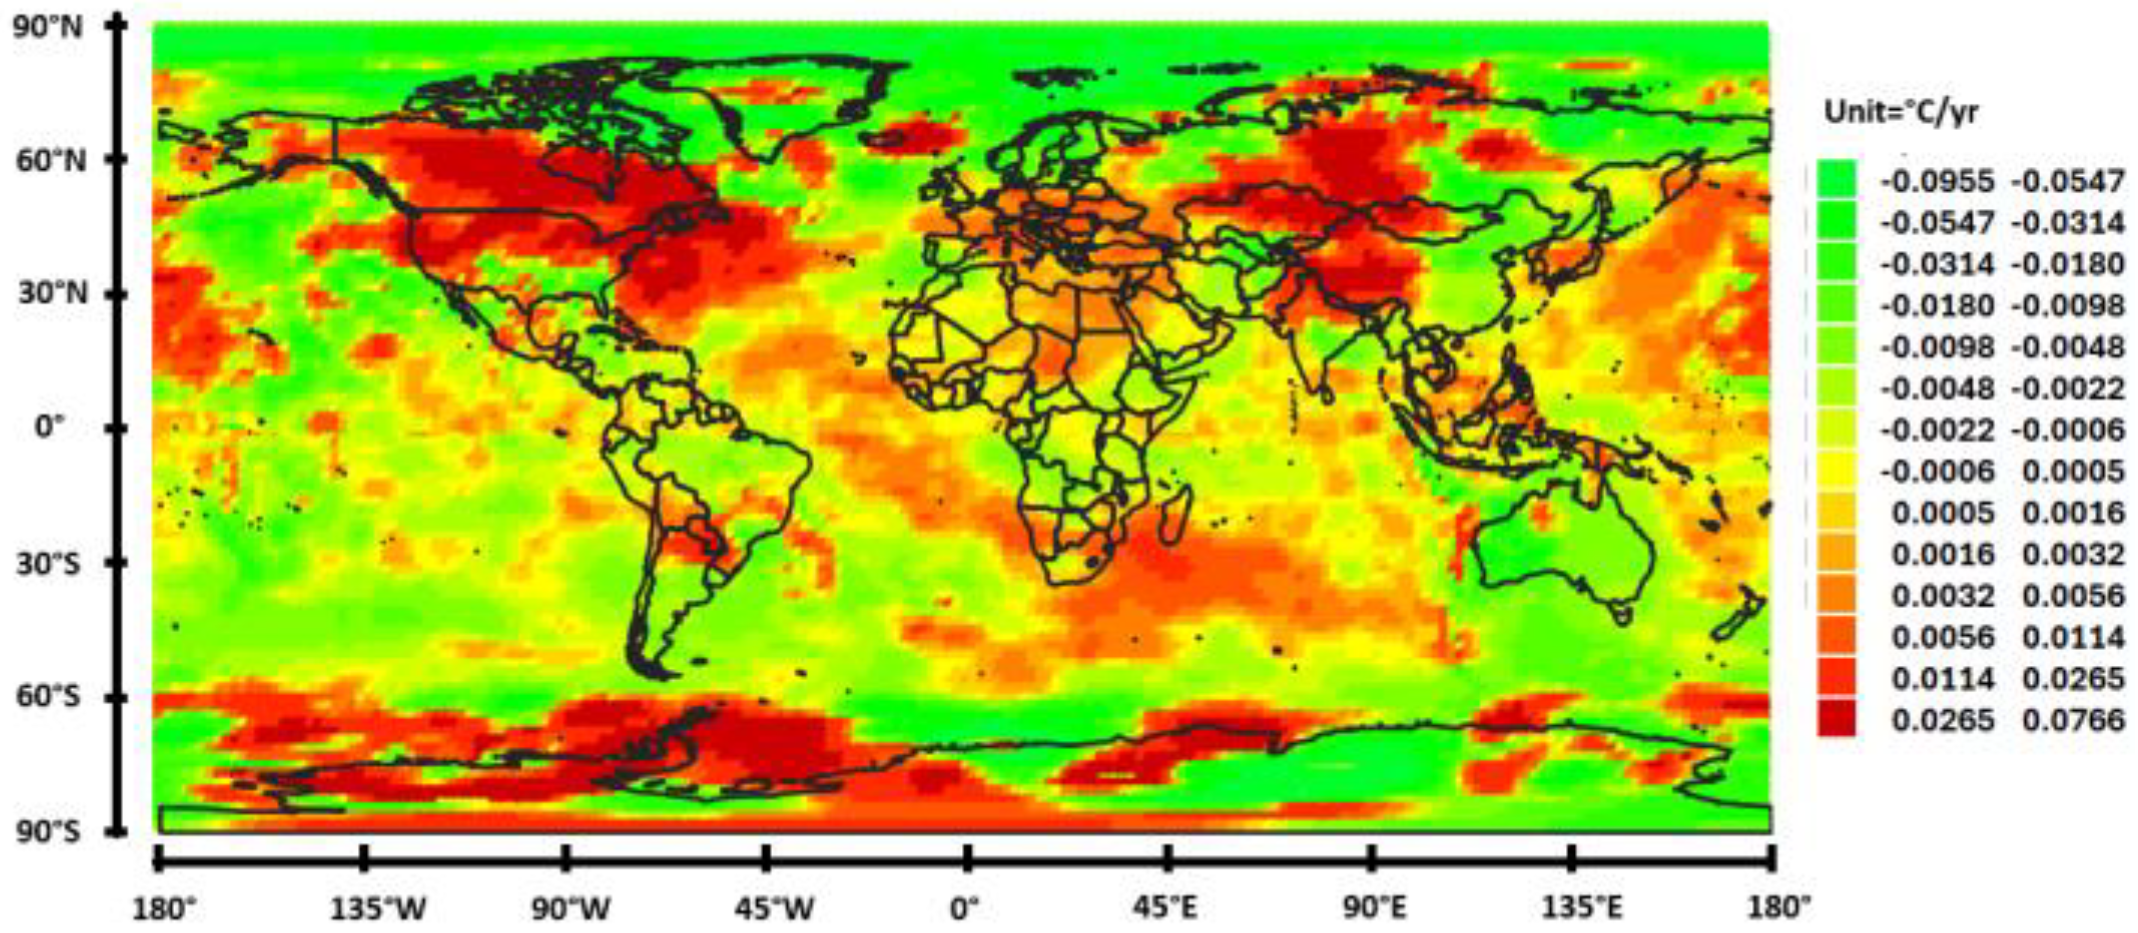
As anticipated, the regions subject to a strong increase in the amplitude of ground air temperature in the period range 17.1–34.2 days show spatial coherence with those subject to an increase in the amplitude of the geopotential height variation (Figure 11). However, the rendering of the amplitude of geopotential height variation into the amplitude of ground-air temperature variation is strongly distorted. This is because the variation in air temperature above the oceans under the effect of anticyclonic systems is moderated by evaporation with the departure of latent heat. This is the reason why the continents are mainly impacted by heat domes. In the northern hemisphere, they are (1) Canada and the north and west of the United States as well as the western North Atlantic at a rate higher than 0.02 °C/yr, (2) Central Europe at a rate of 0.003 °C/yr, and (3) Central Asia at a rate higher than 0.02 °C/yr. Europe is the least impacted of these three regions, although subject to strong growth in the amplitude of geopotential height variation, probably owing to the influence of the Atlantic Ocean. The Arctic, Greenland, northern Europe, southeast of the United States, as well as East Asia are spared with a strong reduction in ground air temperature variations in the period range considered.
In the southern hemisphere, west Antarctica is particularly impacted at a rate higher than 0.02 °C/yr, as is south America around 30° S. The amplitude of the ground air temperature variation decreases drastically in Australia at a rate less than −0.05 °C/yr, as in eastern Antarctica between longitudes 50° E and 170° W, with the exception of a few islets.
In the period range 8.56–17.1 days, the main impacted regions are the far eastern North America, Africa in the northern hemisphere, northern China, Australia, at a rate between 0.002 and 0.006 °C/yr, and above all, a large part of Antarctica at a rate that may exceed 0.03 °C/yr (Figure S18).
  • The warmest half-year referring to extratropical latitudes
Limiting the observations to the most impacted regions in the period range 17.1–34.2 days, these are the ridge running across North America from north to south, Alaska, the Tibetan plateau as well as western China, the Arctic between longitudes 90° E and 160° E, the westernmost half of Australia, at a rate between 0.002 and 0.006 °C/yr, and, importantly, Antarctica at a rate that may exceed 0.03 °C/yr (Figure 12).
In the period range 8.56–17.1 days, the most affected regions are Greenland, central South America, and eastern Antarctica, overlapping with the region impacted in the period range 17.1–34.2 days (Figure S19).

4.3.4. Projected Amplitude of the Variations in Precipitation Rate

  • The coldest half-year referring to extratropical latitudes
As the Figure 13, Figure 14, and Figures S20–S23 show, the projected amplitude of variations in precipitation rate is practically independent of the period range. This over a range of periods extending from 34.2 to 2.2 days. Unlike ground-air temperature variations, which reflect a “passive” response of the atmosphere to MA speed variations, variations in precipitation rate reflect an “active” response attributed to the release of latent heat during the vapor-liquid or liquid-solid phase transition of water. In fact, several low-pressure systems producing precipitation can merge to form a mesoscale convective system, which could have the effect of extending the duration of the precipitation episode. Conversely, very active convective systems can occur locally, of short duration.
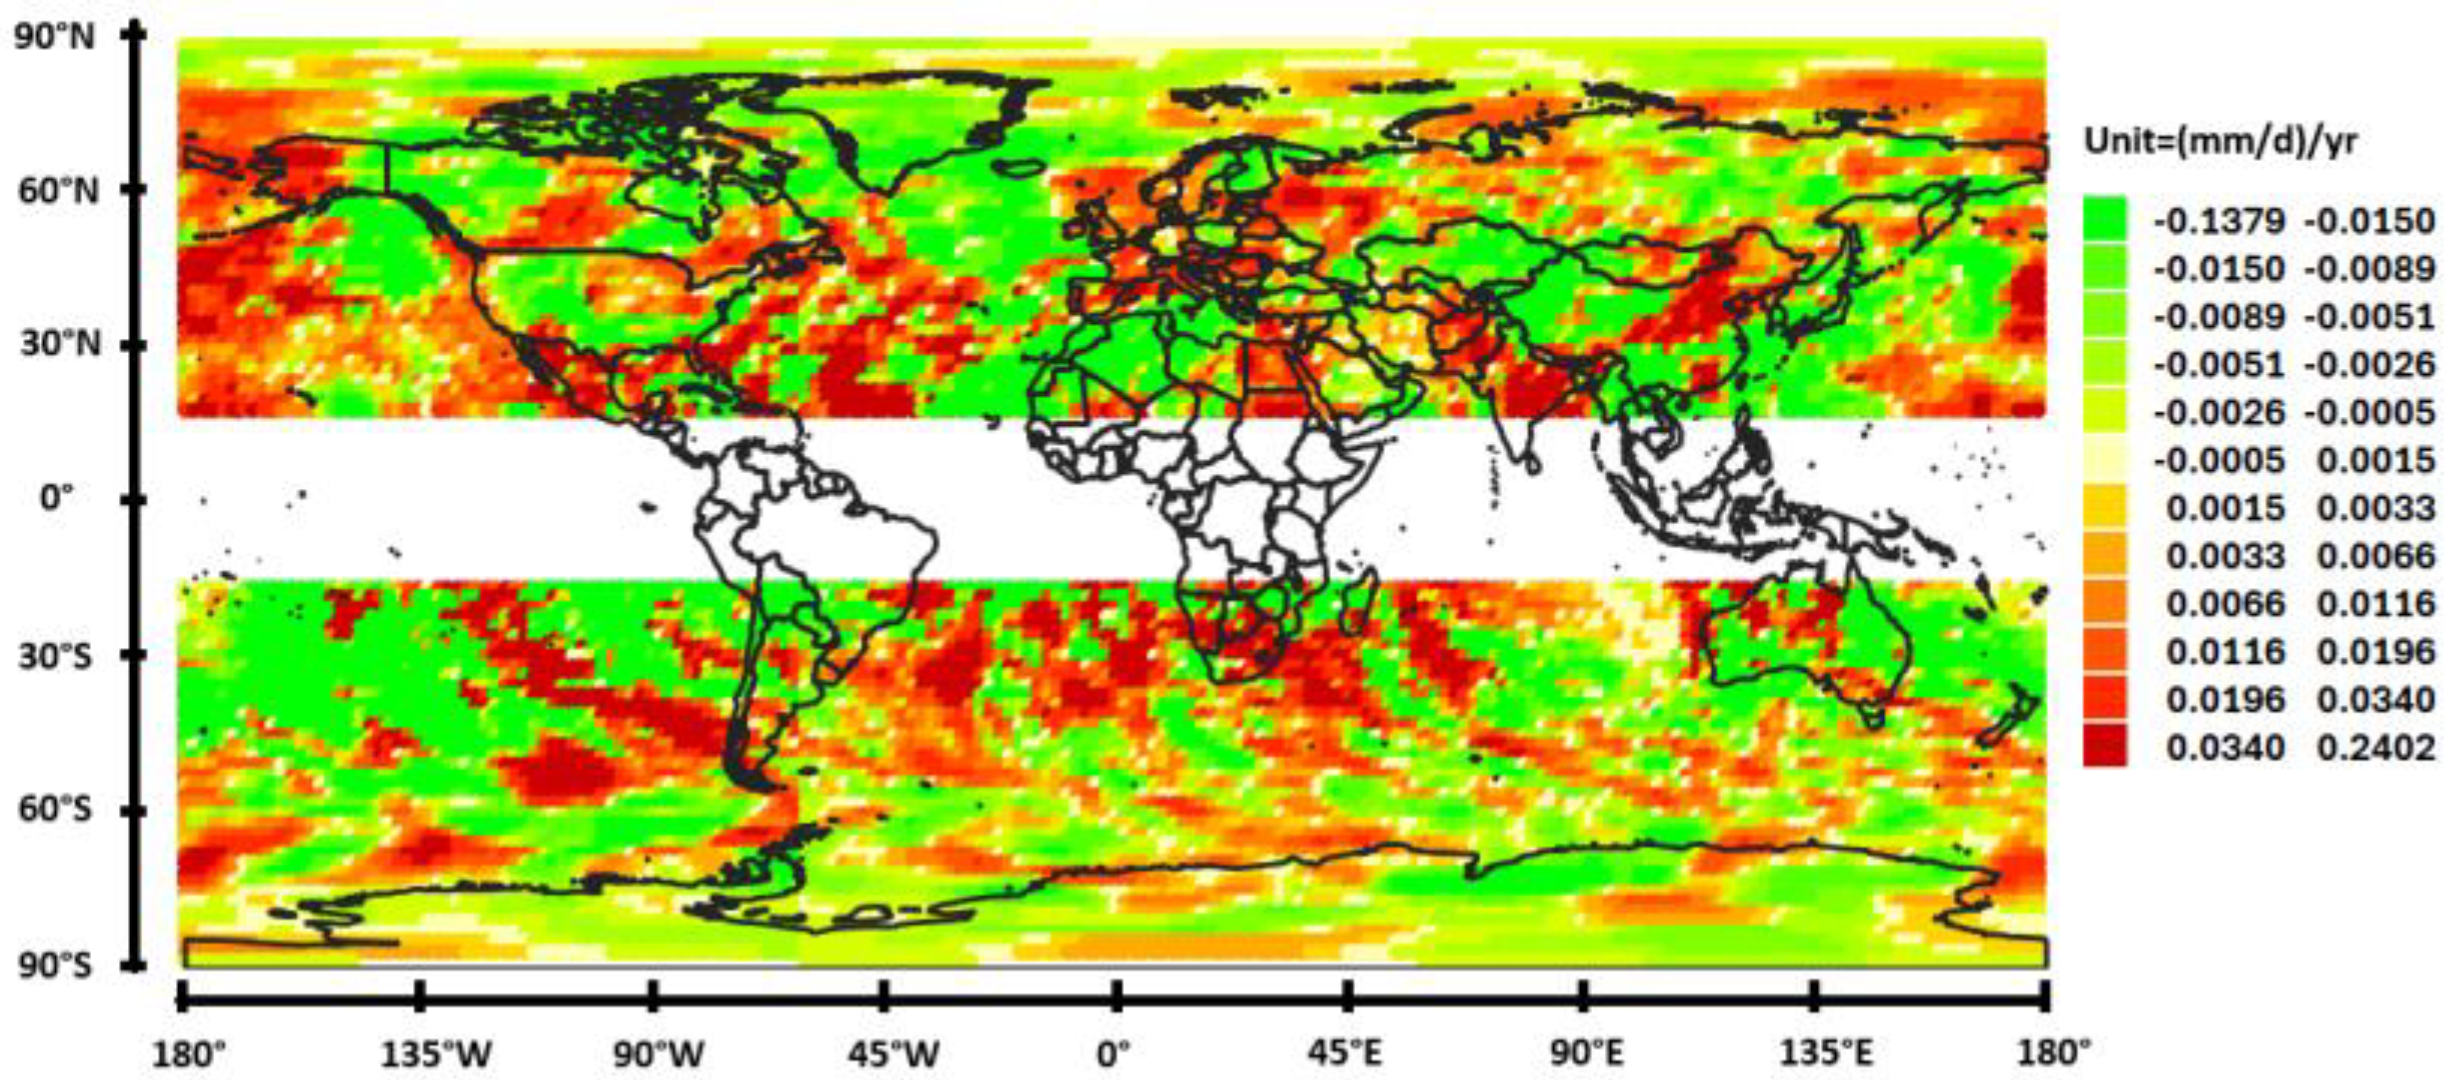
As anticipated, regions subject to a growing amplitude of the variations in the precipitation rate are preferentially located where the amplitude of the variations in MA speed increases, whether it is in the period range of 17.1–34.2 days (Figure 7 and Figure 8) or 8.56–17.1 days (Figures S15 and S16). Indeed, air masses are all the more easily destabilized as the temperature difference between the low atmosphere and the cold drop is higher. At mid and high latitudes, the most affected continental regions in the Northern Hemisphere are northern Central Asia, Europe, central North America, and Alaska. In the Southern Hemisphere, these are southern South America, southern Africa, and Western Australia. They are mainly subject to cold drops in the period range of 17.1 to 34.2 days. The western and eastern China, Western Australia, Turkey, Syria, Iraq, Iran, western Kazakhstan, Pakistan, India, and Antarctica are mainly subject to cold drops in the period range of 8.56 to 17.1 days. The amplitude of precipitation variation may reach a rate of 0.2 (mm/d)/yr in the most impacted regions.
Conversely, large regions will see a decrease in the amplitude of precipitation variations, which may reach −0.1 (mm/d)/yr. This concerns western North America, North Africa, Eastern Russia, Western China, Central South America, and Eastern Australia.
  • The warmest half-year referring to extratropical latitudes
The map of the projected amplitude of precipitation rate variations looks like what is observed during the coldest half-year, with however North America more impacted and western Asia less impacted (Figure 14).

4.4. Increase in the Amplitude of Ground Air Temperature Variation in Certain Period Ranges and Climate Change

4.4.1. Coldest Half-Year Referring to Extratropical Latitudes

The increase in the amplitude of ground air temperature variation observed in period ranges 17.1–34.2 days and 8.56–17.1 days in certain regions makes conditions increasingly favorable for the formation of heatwaves. This evolution, which is mainly linked to the increase in anticyclonic activity that can lead to the formation of heat domes, results from the strengthening of tropospheric polar vortices. Indeed, as shown in Figure 7, which refers to the period range 17.1–34.2 days, there is continuity between the increased activity of the polar vortex to the east of Greenland, between longitudes 30° W and 30° E and latitudes 60° N and 85° N, and the increase in MA activity over Europe. This causal relationship also exists between the increased activity of the Arctic polar vortex between longitudes 170° E and 70° W and that of the polar and subtropical MAs above the north-south ridge crossing North America. The same phenomenon occurs in the Southern Hemisphere, involving increased polar vortex activity over West Antarctica between longitudes 80° W and 20° W and latitudes 75° S and 85° S, and the circumpolar ocean south of South America as well as the southernmost half of South America.
This can be explained by the fact that the increase in activity of the polar vortices pushes the polar and subtropical MAs equatorward, which favors the formation of heat domes, even more so when a phase inversion occurs in the subtropical MA, as we have seen through the case studies. The effects they induce on low- and high-pressure systems behave quasi-resonantly for the dominant harmonic mode, leading to the formation of dual cyclone-anticyclone systems.

4.4.2. Warmest Half-Year Referring to Extratropical Latitudes

As shown in Figure 8, the same causal relationship also exists between the increased activity of the Arctic polar vortex and that of the polar and subtropical MAs above North America, as well as between the increased activity of the West Antarctica polar vortex and that of the polar and subtropical MAs above the circumpolar ocean and South America. As for Africa in the southern hemisphere and Southeast Asia, the increase in the amplitude of MA speed variation is located above the ITCZ in summer between latitudes 0° and 30° S.

4.4.3. The Link with Climate Change

The increase in the amplitude of Rossby waves at the interface of polar vortices as well as the ITCZ, accompanied by their latitudinal extension, produces a tightening of Rossby waves embedded in the polar and subtropical jet streams. This has the effect of increasing the efficiency of the resonant forcing of Rossby waves from the solar declination, the optimum of which is located at mid-latitudes. Indeed, the Fourier spectrum of the wind speed at 250 mb reveals a peak at 11.2 years attributable to the solar cycle in the region [5° W, 10° E] × [50° N, 60° N], thus highlighting the hypersensitivity of Rossby waves to resonant forcing under the effect of very small variations in solar irradiance [53]. The strengthening of the amplitude of Rossby waves at mid-latitudes is visible in the northern hemisphere; they appear to form four nodes around the earth, over the central Pacific, central Asia, Europe, and North America (Figure 7). They give rise to an increase in the amplitude of ground-air temperature variation and, thus, the vulnerability of these regions to the formation of heatwaves during the coldest half-year (Figure 11).

4.5. Increase in the Amplitude of Precipitation Rate Variation and Climate Change

The increase in the amplitude of precipitation rate variation observed in all period ranges in certain regions makes conditions increasingly favorable for the formation of EPEs. This evolution, which is linked to the increase in the formation of cold drops, here again results from the strengthening of tropospheric polar vortices. Particularly impacted are Europe and western Asia, with a drastic increase in the amplitude of precipitation variations within a wide range of periods. This is attributable to increased activity of the Arctic polar vortex between longitudes 20° W and 40° E, extending southward to latitude 60° N (Figure 7). This is likely a result of the melting of the Arctic ice sheet, which is itself subject to the weakening of the geostrophic component of the Gulf Stream, as reflected by the fundamental 64-year oceanic Rossby wave. The rapidity of the phenomenon is attributed to a feedback loop of the melting of the Arctic ice sheet on the temperature of the Atlantic Ocean at mid-latitudes [80]. Melting ice, which causes an albedo change, appears to amplify the variations in the period range of 17.1 to 34.2 days of the poleward circulation at the tropopause of the Arctic polar cell.

5. Conclusions

In a nutshell, the main results obtained are as follows:
  • The case studies clearly demonstrate that heatwaves only form under specific patterns of the MAs at the tropopause. This may result in the formation of a quasi-resonant dual cyclone-anticyclone system when a phase inversion of the MAs occurs, as evidenced in six case studies. Another process highlighted in three case studies involves surface turbulent fluxes in response to the emergence of a warm MA above the impacted region when it is located near an ocean.
  • Apart from a very exceptional transient reorganization of polar, Ferrel, and Hadley cells at high altitudes that anticipated Hurricane Katrina, the exceptional EPEs mainly occur, again, concomitantly with the formation of a dual cyclone-anticyclone system above an ocean, which favors moisture-laden winds. Regarding the tropical-like Mediterranean cyclones, they generally occur at the end of autumn when the semi-closed Mediterranean Sea is warm. They result from the cold subtropical MA over western and central Europe, which is why this pattern is called a “cold drop”.
  • The amplitudes of variation, projected over the next two decades, of the wind speed at the tropopause, the geopotential height, the air temperature at ground level, or the precipitation rate highlight a great disparity between the different regions of the globe. They show a more or less significant increase or decrease in the intervals of periods 17.1–34.2 days and 8.56–17.1 days. A strong increase/decrease indicates that the amplitude of variation has reached a minimum/maximum during the observation period (01/1979–03/2024).
  • Whether heat waves or extreme precipitation, the increase in their amplitude and frequency in impacted regions is attributed to the latitudinal extension of polar vortices, a consequence of the change in the Earth’s albedo at high latitudes. This has the effect of strengthening tropospheric polar vortices, increasing the efficiency of the resonant forcing of Rossby waves from solar declination.

Supplementary Materials

The following supporting information can be downloaded at: https://www.mdpi.com/article/10.3390/atmos15101226/s1. Figure S1: Wind velocity at 250 mb (a,b), geopotential height at 500 mb, and air temperature 2 m above the ground, on 1 June 2019: (a,c,e) amplitude and (b,d,f) phase. The wind speed phase (b) indicates when the modulated airflows are warmest. Figure S2: Wind velocity at 250 mb (a,b), geopotential height at 500 mb, and air temperature 2 m above the ground, on 1 July 2022: (a,c,e) amplitude and (b,d,f) phase. The wind speed phase (b) indicates when the modulated airflows are warmest. Figure S3: Wind velocity at 250 mb (a,b), geopotential height at 500 mb, and air temperature 2 m above the ground, on 14 July 1980: (a,c,e) amplitude and (b,d,f) phase. The wind speed phase (b) indicates when the modulated airflows are warmest. Figure S4: Wind velocity at 250 mb (a,b), geopotential height at 500 mb, and air temperature 2 m above the ground, on 12 March 2012: (a,c,e) amplitude and (b,d,f) phase. The wind speed phase (b) indicates when the modulated airflows are warmest. Figure S5: Wind velocity at 250 mb (a,b), geopotential height at 500 mb, and air temperature 2 m above the ground, on 20 January 2009: (a,c,e) amplitude and (b,d,f) phase. The wind speed phase (b) indicates when the modulated airflows are warmest. Figure S6: Wind velocity at 250 mb (a,b), geopotential height at 500 mb, and air temperature 2 m above the ground, on 11 February 2017: (a,c,e) amplitude and (b,d,f) phase. The wind speed phase (b) indicates when the modulated airflows are warmest. Figure S7: Wind velocity at 250 mb (a,b), geopotential height at 500 mb, and air temperature 2 m above the ground, on 2 January 1993: (a,c,e) amplitude and (b,d,f) phase. The wind speed phase (b) indicates when the modulated airflows are warmest. Figure S8: Wind velocity at 250 mb (a,b), geopotential height at 500 mb (c,d), and precipitation rate (e,f), on 1 June 2016: (a,c,e) amplitude and (b,d,f) phase. The wind speed phase (b) indicates when the modulated airflows are coldest. Figure S9: Wind velocity at 250 mb (a,b), geopotential height at 500 mb (c,d), and precipitation rate (e,f), on 6 June 2005: (a,c,e) amplitude and (b,d,f) phase. The wind speed phase (b) indicates when the modulated airflows are coldest. Figure S10: Wind velocity at 250 mb (a,b), geopotential height at 500 mb (c,d), and precipitation rate (e,f), on 22 February 2007: (a,c,e) amplitude and (b,d,f) phase. The wind speed phase (b) indicates when the modulated airflows are coldest. Figure S11: Wind velocity at 250 mb (a,b), geopotential height at 500 mb (c,d), and precipitation rate (e,f), on 6 February 2004: (a,c,e) amplitude and (b,d,f) phase. The wind speed phase (b) indicates when the modulated airflows are coldest. Figure S12: Wind velocity at 250 mb (a,b), geopotential height at 500 mb (c,d), and precipitation rate (e,f), on 12 August 2015: (a,c,e) amplitude and (b,d,f) phase. The wind speed phase (b) indicates when the modulated airflows are coldest. Figure S13: Wind velocity at 250 mb (a,b), geopotential height at 500 mb (c,d), and precipitation rate (e,f), on 18 November 2013: (a,c,e) amplitude and (b,d,f) phase. The wind speed phase (b) indicates when the modulated airflows are coldest. Figure S14: Projected amplitude in the period range 8.56 to 17.1 days of the variations in wind speed at 250 mb averaged over the coldest half-year (referring to extratropical latitudes). Figure S15: Projected amplitude in the period range 8.56 to 17.1 days of the variations in wind speed at 250 mb averaged over the warmest half-year (referring to extratropical latitudes). Figure S16: Projected amplitude in the period range 8.56 to 17.1 days of the variations in geopotential height at 500 mb averaged over the coldest half-year (referring to extratropical latitudes). Figure S17: Projected amplitude in the period range 8.56 to 17.1 days of the variations in geopotential height at 500 mb averaged over the warmest half-year (referring to extratropical latitudes). Figure S18: Projected amplitude in the period range 8.56 to 17.1 days of the variations in ground air temperature averaged over the coldest half-year (referring to extratropical latitudes). Figure S19: Projected amplitude in the period range 8.56 to 17.1 days of the variations in ground air temperature averaged over the warmest half-year (referring to extratropical latitudes). Figure S20: Projected amplitude in the period range 8.56 to 17.1 days of the variations in extratropical precipitation rate averaged over the coldest half-year. Figure S21: Projected amplitude in the period range 8.56 to 17.1 days of the variations in extratropical precipitation rate averaged over the warmest half-year. Figure S22: Projected amplitude in the period range 2.2 to 4.28 days of the variations in extratropical precipitation rate averaged over the coldest half-year. Figure S23: Projected amplitude in the period range 2.2 to 4.28 days of the variations in extratropical precipitation rate averaged over the warmest half-year.

Funding

This research received no external funding.

Institutional Review Board Statement

Not applicable.

Informed Consent Statement

Not applicable.

Data Availability Statement

Data are contained within the article and Supplementary Materials.

Conflicts of Interest

The author declares no conflicts of interest.

References

  1. United States Environmental Protection Agency (EPA). Climate Change Indicators: Heatwaves. Available online: https://www.epa.gov/climate-indicators/climate-change-indicators-heat-waves (accessed on 24 January 2024).
  2. Christidis, N.; Stott, P.A. Change in the Odds of Warm Years and Seasons Due to Anthropogenic Influence on the Climate. J. Clim. 2014, 27, 2607–2621. [Google Scholar] [CrossRef]
  3. Christidis, N.; Jones, G.S.; Stott, P.A. Dramatically increasing chance of extremely hot summers since the 2003 European heatwave. Nat. Clim. Change 2015, 5, 46. [Google Scholar] [CrossRef]
  4. Kam, J.; Knutson, T.R.; Zeng, F.; Wittenberg, A.T. Multimodel Assessment of Anthropogenic Influence on Record Global and Regional Warmth During 2015. Bull. Am. Meteorol. Soc. 2016, 97, S4–S8. [Google Scholar] [CrossRef]
  5. Horton, R.M.; Mankin, J.S.; Lesk, C.; Coffel, E.; Raymond, C. A Review of Recent Advances in Research on Extreme Heat Events. Curr. Clim. Change Rep. 2016, 2, 242–259. [Google Scholar] [CrossRef]
  6. Imada, Y.; Shiogama, H.; Takahashi, C.; Watanabe, M.; Mori, M.; Kamae, Y.; Shuhei, M. Climate Change Increased the Likelihood of the 2016 Heat Extremes in Asia. Bull. Am. Meteorol. Soc. 2018, 99, S97–S101. [Google Scholar] [CrossRef]
  7. Vogel, M.M.; Zscheischler, J.; Wartenburger, R.; Dee, D.; Seneviratne, S.I. Concurrent 2018 Hot Extremes Across Northern Hemisphere Due to Human-Induced Climate Change. Earth’s Future 2019, 7, 692–703. [Google Scholar] [CrossRef] [PubMed]
  8. Ciavarella, A.; Cotterill, D.; Stott, P.; Kew, S.; Philip, S.; Oldenborgh, G.J.V.; Skålevåg, A.; Lorenz, P.; Robin, Y.; Otto, F.; et al. Prolonged Siberian heat of 2020 almost impossible without human influence. Clim. Change 2021, 166, 9. [Google Scholar] [CrossRef] [PubMed]
  9. Yiou, P.; Cattiaux, J.; Faranda, D.; Kadygrov, N.; Jézéquel, A.; Naveau, P.; Ribes, A.; Robin, Y.; Thao, S.; van Oldenborgh, G.J.; et al. Analyses of the Northern European Summer Heatwave of 2018. Bull. Am. Meteorol. Soc. 2020, 101, S35–S40. [Google Scholar] [CrossRef]
  10. Vautard, R.; van Aalst, M.; Boucher, O.; Drouin, A.; Haustein, K.; Kreienkamp, F.; van Oldenborgh, G.J.; Otto, F.E.L.; Ribes, A.; Robin, Y.; et al. Human contribution to the record-breaking June and July 2019 heatwaves in Western Europe. Environ. Res. Lett. 2020, 15, 094077. [Google Scholar] [CrossRef]
  11. Coumou, D.; Lehmann, J.; Beckmann, J. The weakening summer circulation in the Northern Hemisphere mid-latitudes. Science 2015, 348, 324–327. [Google Scholar] [CrossRef]
  12. Petoukhov, V.; Rahmstorf, S.; Petri, S.; Schellnhuber, H.J. Quasi-resonant amplification of planetary waves and recent Northern Hemisphere weather extremes. Proc. Natl. Acad. Sci. USA 2013, 110, 5336–5341. [Google Scholar] [CrossRef] [PubMed]
  13. Screen, J.A.; Blackport, R. Is sea-ice-driven Eurasian cooling too weak in models? Nat. Clim. Change 2019, 9, 934–936. [Google Scholar] [CrossRef]
  14. Blackport, R.; Screen, J.A. Weakened evidence for mid-latitude impacts of Arctic warming. Nat. Clim. Change 2020, 10, 1065–1066. [Google Scholar] [CrossRef]
  15. Blackport, R.; Screen, J.A. Insignificant effect of Arctic amplification on the amplitude of midlatitude atmospheric waves. Sci. Adv. 2020, 6, eaay2880. [Google Scholar] [CrossRef]
  16. White, R.H.; Kornhuber, K.; Martius, O.; Wirth, V. From Atmospheric Waves to Heatwaves: A Waveguide Perspective for Understanding and Predicting Concurrent, Persistent, and Extreme Extratropical Weather. Bull. Am. Meteorol. Soc. 2022, 103, E923–E935. [Google Scholar] [CrossRef]
  17. USGCRP (U.S. Global Change Research Program). Climate Science Special Report: Fourth National Climate Assessment, Volume I; Wuebbles, D.J., Fahey, D.W., Hibbard, K.A., Dokken, D.J., Stewart, B.C., Maycock, T.K., Eds.; U.S. Global Change Research Program: Washington, DC, USA, 2017. [Google Scholar] [CrossRef]
  18. Perkins-Kirkpatrick, S.E.; Gibson, P.B. Changes in regional heatwave characteristics as a function of increasing global temperature. Sci. Rep. 2017, 7, 12256. [Google Scholar] [CrossRef]
  19. Tripathy, K.P.; Mukherjee, S.; Mishra, A.K.; Mann, M.E.; Williams, A.P. Climate change will accelerate the high-end risk of compound drought and heatwave events. Proc. Natl. Acad. Sci. USA 2023, 120, e2219825120. [Google Scholar] [CrossRef] [PubMed]
  20. Rousi, E.; Kornhuber, K.; Beobide-Arsuaga, G.; Luo, F.; Coumou, D. Accelerated western European heatwave trends linked to more-persistent double jets over Eurasia. Nat. Commun. 2022, 13, 3851. [Google Scholar] [CrossRef]
  21. Lojko, A.; Payne, A.; Jablonowski, C. The Remote Role of North-American Mesoscale Convective Systems on the Forecast of a Rossby Wave Packet: A Multi-Model Ensemble Case-Study. J. Geophys. Res. Atmos. 2022, 127, 24. [Google Scholar] [CrossRef]
  22. He, Y.; Zhu, X.; Sheng, Z.; He, M. Resonant Waves Play an Important Role in the Increasing Heatwaves in Northern Hemisphere Mid-Latitudes Under Global Warming. Geophys. Res. Lett. 2023, 50, 14. [Google Scholar] [CrossRef]
  23. Liu, S.; Sun, J. Enhanced Influence of Tropical Pacific Sea Surface Temperature Anomalies on Spring Extreme Heat Events over Mid-High Latitude Eurasia. J. Geophys. Res. Atmos. 2023, 128, 12. [Google Scholar] [CrossRef]
  24. Huang, H.; Winter, J.M.; Osterberg, E.C. Mechanisms of abrupt extreme precipitation change over the northeastern United States. J. Geophys. Res. Atmos. 2018, 123, 7179–7192. [Google Scholar] [CrossRef]
  25. Frei, A.; Kunkel, K.E.; Matonse, A. The seasonal nature of extreme hydrological events in the northeastern United States. J. Hydrometeorol. 2015, 16, 2065–2085. [Google Scholar] [CrossRef]
  26. Huang, H.; Winter, J.M.; Osterberg, E.C.; Horton, R.M.; Beckage, B. Total and extreme precipitation changes over the northeastern United States. J. Hydrometeorol. 2017, 18, 1783–1798. [Google Scholar] [CrossRef]
  27. Kunkel, K.E.; Karl, T.R.; Brooks, H.; Kossin, J.; Lawrimore, J.H.; Arndt, D.; Bosart, L.; Changnon, D.; Cutter, S.L.; Doesken, N.; et al. Monitoring and understanding trends in extreme storms: State of knowledge. Bull. Am. Meteorol. Soc. 2013, 94, 499–514. [Google Scholar] [CrossRef]
  28. Walsh, J.; Wuebbles, D.; Hayhoe, K.; Kossin, J.; Kunkel, K.; Stephens, G.; Thorne, P.; Vose, R.; Wehner, M.; Willis, J.; et al. Chapter 2: Our Changing Climate. In Climate Change Impacts in the United States: The Third National Climate Assessment; Melillo, J.M., Richmond, T.C., Yohe, G.W., Eds.; U.S. Global Change Research Program: Washington, DC, USA, 2014; pp. 19–67. [Google Scholar] [CrossRef]
  29. Agel, L.; Barlow, M.; Qian, J.-H.; Colby, F.; Douglas, E.; Eichler, T. Climatology of daily precipitation and EPEs in the northeast United States. J. Hydrometeorol. 2015, 16, 2537–2557. [Google Scholar] [CrossRef]
  30. Kunkel, K.E.; Easterling, D.R.; Kristovich, D.A.R.; Gleason, B.; Stoecker, L.; Smith, R. Meteorological causes of the secular variations in observed EPEs for the conterminous United States. J. Hydrometeorol. 2012, 13, 1131–1141. [Google Scholar] [CrossRef]
  31. Hoerling, M.; Eischeid, J.; Perlwitz, J.; Quan, X.-W.; Wolter, K.; Cheng, L. Characterizing recent trends in U.S. heavy precipitation. J. Clim. 2016, 29, 2313–2332. [Google Scholar] [CrossRef]
  32. Huang, W.; Qiu, T.; Yang, Z.; Lin, D.; Wright, J.S.; Wang, B.; He, X. On the formation mechanism for wintertime EPEs over the southeastern Tibetan Plateau. J. Geophys. Res. Atmos. 2018, 123, 12692–12714. [Google Scholar] [CrossRef]
  33. Yang, Z.; Huang, W.; He, X.; Wang, Y.; Qiu, T.; Wright, J.S.; Wang, B. Synoptic conditions and moisture sources for extreme snowfall events over East China. J. Geophys. Res. Atmos. 2019, 124, 601–623. [Google Scholar] [CrossRef]
  34. Huang, W.; Yang, Z.; He, X.; Lin, D.; Wang, B.; Wright, J.S.; Chen, R.; Ma, W.; Li, F. A possible mechanism for the occurrence of wintertime EPEs over south China. Clim. Dyn. 2018, 52, 2367–2384. [Google Scholar] [CrossRef]
  35. Zong, H.; Bueh, C.; Ji, L. Wintertime EPE over southern China and its typical circulation features. Chin. Sci. Bull. 2014, 59, 1036–1044. [Google Scholar] [CrossRef]
  36. Lou, M.; Li, C.; Hao, S.; Liu, J. Variations of winter precipitation over southeastern China in association with the North Atlantic Oscillation. J. Meteorol. Res. 2017, 31, 476. [Google Scholar] [CrossRef]
  37. Ding, F.; Li, C. Subtropical westerly jet waveguide and winter persistent heavy rainfall in south China. J. Geophys. Res. Atmos. 2017, 122, 7385–7400. [Google Scholar] [CrossRef]
  38. Barton, Y.; Rivoire, P.; Koh, J.; Ali, M.S.; Kopp, J.; Martius, O. On the temporal clustering of European EPEs and its relationship to persistent and transient large-scale atmospheric drivers. Weather Clim. Extrem. 2022, 38, 100518. [Google Scholar] [CrossRef]
  39. Röthlisberger, M.; Frossard, L.; Bosart, L.F.; Keyser, D.; Martius, O. Recurrent synoptic-scale Rossby wave patterns and their effect on the persistence of cold and hot spells. J. Clim. 2019, 32, 3207–3226. [Google Scholar] [CrossRef]
  40. Ali, S.M.; Martius, O.; Röthlisberger, M. Recurrent rossby wave packets modulate the persistence of dry and wet spells across the globe. Geophys. Res. Lett. 2021, 48, e2020GL091452. [Google Scholar] [CrossRef]
  41. Kornhuber, K.; Messori, G. Recent Increase in a Recurrent Pan-Atlantic Wave Pattern Driving Concurrent Wintertime Extremes. Bull. Am. Meteorol. Soc. 2023, 104, E1694–E1708. [Google Scholar] [CrossRef]
  42. Barton, Y.; Giannakaki, P.; Von Waldow, H.; Chevalier, C.; Pfahl, S.; Martius, O. Clustering of regional-scale EPEs in southern Switzerland. Mon. Weather Rev. 2016, 144, 347–369. [Google Scholar] [CrossRef]
  43. Lenggenhager, S.; Martius, O. Atmospheric blocks modulate the odds of heavy precipitation events in Europe. Clim. Dyn. 2019, 53, 4155–4171. [Google Scholar] [CrossRef]
  44. Tuel, A.; Martius, O. Subseasonal temporal clustering of extreme precipitation in the northern hemisphere: Regionalization and physical drivers. J. Clim. 2022, 35, 3537–3555. [Google Scholar] [CrossRef]
  45. Hansen, J.; Ruedy, R.; Sato, M.; Lo, K. Global surface temperature change. Rev. Geophys. 2010, 48, RG4004. [Google Scholar] [CrossRef]
  46. Orsi, A.J.; Kawamura, K.; Masson-Delmotte, V.; Fettweis, X.; Box, J.E.; Dahl-Jensen, D.; Clow, G.D.; Landais, A.; Severinghaus, J.P. The recent warming trend in North Greenland. Geophys. Res. Lett. 2017, 44, 6235–6243. [Google Scholar] [CrossRef]
  47. Screen, J.A.; Simmonds, I. The central role of diminishing sea ice in recent Arctic temperature amplification. Nature 2010, 464, 1334–1337. [Google Scholar] [CrossRef]
  48. Barnes, E.A.; Screen, J.A. The impact of Arctic warming on the midlatitude jet-stream: Can it? Has it? Will it? Wiley Interdiscip. Rev. Clim. Change 2015, 6, 277–286. [Google Scholar] [CrossRef]
  49. Cohen, J.; Screen, J.A.; Furtado, J.C.; Barlow, M.; Whittleston, D.; Francis, J.; Dethloff, K.; Entekhabi, D.; Overland, J.; Jones, J. Recent Arctic amplification and extreme mid-latitude weather. Nat. Geosci. 2014, 7, 627–637. [Google Scholar] [CrossRef]
  50. Cohen, J.; Pfeiffer, K.; Francis, J.A. Warm Arctic episodes linked with increased frequency of extreme winter weather in the United States. Nat. Commun. 2018, 9, 869. [Google Scholar] [CrossRef]
  51. Francis, J.A.; Vavrus, S.J. Evidence linking Arctic amplification to extreme weather in mid-latitudes. Geophys. Res. Lett. 2012, 39, L06801. [Google Scholar] [CrossRef]
  52. Francis, J.A.; Vavrus, S.J. Evidence for a wavier jet stream in response to rapid Arctic warming. Environ. Res. Lett. 2015, 10, 14005. [Google Scholar] [CrossRef]
  53. Pinault, J.-L. Resonant Forcing by Solar Declination of Rossby Waves at the Tropopause and Implications in Extreme Events, Precipitation, and Heat Waves—Part 1: Theory. Atmosphere 2024, 15, 608. [Google Scholar] [CrossRef]
  54. Kanamitsu, M.; Ebisuzaki, W.; Woollen, J.; Yang, S.K.; Hnilo, J.J.; Fiorino, M.; Potter, G.L. NCEP-DOE AMIP-II Reanalysis (R-2). Bull. Am. Meteorol. Soc. 2002, 83, 1631–1644. [Google Scholar] [CrossRef]
  55. Pinault, J.-L. Morlet Cross-Wavelet Analysis of Climatic State Variables Expressed as a Function of Latitude, Longitude, and Time: New Light on Extreme Events. Math. Comput. Appl. 2022, 27, 50. [Google Scholar] [CrossRef]
  56. Tropical Cyclone Yasi, Queensland, Australia. 2011. Available online: https://knowledge.aidr.org.au/resources/cyclone-cyclone-yasi-queensland-2011/ (accessed on 13 October 2024).
  57. Torrence, C.; Compo, G. A Practical Guide to Wavelet Analysis; American Meteorological Society: Boston, MA, USA, 1998. [Google Scholar]
  58. Zhou, B.; Hu, S.; Peng, J.; Li, D.; Ma, L.; Zheng, Z.; Feng, G. The extreme heatwave in China in August 2022 related to extreme northward movement of the eastern center of SAH. Atmos. Res. 2023, 293, 106918. [Google Scholar] [CrossRef]
  59. Muthers, S.; Gudrun Laschewski, G.; Matzarakis, A. The Summers 2003 and 2015 in South-West Germany: Heatwaves and Heat-Related Mortality in the Context of Climate Change. Atmosphere 2017, 8, 224. [Google Scholar] [CrossRef]
  60. Chauhan, C. India Staring at Longest Heatwave in 3 Decades. MSN. 12 June 2019. Available online: https://www.hindustantimes.com/india-news/india-staring-at-longest-heatwave-in-3-decades/story-zM1sSWQ3p63smxTErFVClJ.html (accessed on 24 December 2023).
  61. Xu, P.; Wang, L.; Liu, Y.; Chen, W.; Huang, P. The record-breaking heatwave of June 2019 in Central Europe. Atmos. Sci. Lett. 2020, 21, e964. [Google Scholar] [CrossRef]
  62. Woodcock, J. Weather Tracker: Japan Swelters as ‘Heat Dome’ Pushes Up Temperatures. The Guardian. 27 June 2022. Available online: https://www.theguardian.com/weather/2022/jun/27/japan-heatwave-heat-dome-record-temperatures#:~:text=There%20were%20scorching%20conditions%20across,39.8C%20set%20in%202011 (accessed on 24 December 2023).
  63. Ross, T.; Lott, N. A Climatology of 1980–2003 Extreme Weather and Climate Events; Technical Report 2003-01; National Climatic Data Center, National Oceanic and Atmospheric Administration (NOAA). Available online: https://www.google.fr/url?sa=t&rct=j&q=&esrc=s&source=web&cd=&ved=2ahUKEwi2kbGmnI2JAxXWBfsDHUR4AhsQFnoECBYQAQ&url=https%3A%2F%2Frepository.library.noaa.gov%2Fview%2Fnoaa%2F13831%2Fnoaa_13831_DS1.pdf&usg=AOvVaw0b9XoZsvo9RwKsbZ-j5RWM&opi=89978449 (accessed on 13 October 2024).
  64. Earth System Research Laboratory, National Oceanic and Atmospheric Administration (NOAA). Meteorological March Madness. 2 April 2012. Available online: https://psl.noaa.gov/csi/events/2012/marchheatwave/anticipation.html (accessed on 1 October 2024).
  65. Australian Disaster Resilience, South Australia & Victoria, January 2009. Available online: https://knowledge.aidr.org.au/resources/health-heatwave-south-eastern-australia-2009/ (accessed on 24 December 2023).
  66. World Weather Attribution. Extreme Heat in Southeast Australia, February 2017. Available online: https://www.worldweatherattribution.org/extreme-heat-australia-february-2017/ (accessed on 24 December 2023).
  67. Climate Council. 2017: Another Record-Breaking Year for Heat and Extreme Event. Available online: https://www.climatecouncil.org.au/uploads/8e9c2b91ce3c3ebb7d97e403a6fdf38e.pdf (accessed on 24 December 2023).
  68. The Outlier. Extreme Temperatures in South Africa. Available online: https://www.theoutlier.co.za/news/2023-07-25/83662-/extreme-temperatures-in-south-africa (accessed on 24 December 2023).
  69. Pinault, J.-L. Extreme Heavy Rainfall Events at Mid-Latitudes as the Outcome of a Slow Quasi-Resonant Ocean—Atmosphere Interaction: 10 Case Studies. J. Mar. Sci. Eng. 2023, 11, 359. [Google Scholar] [CrossRef]
  70. Duan, W.; He, B.; Takara, K.; Luo, P.; Nover, D.; Yamashiki, Y.; Huang, W. Anomalous atmospheric events leading to Kyushu’s flash floods, July 11–14, 2012. Nat. Hazards 2014, 73, 1255–1267. [Google Scholar] [CrossRef]
  71. Hsu, P.-C.; Xie, J.; Lee, J.-Y.; Zhu, Z.; Li, Y.; Chen, B.; Zhang, S. Multiscale interactions driving the devastating floods in Henan Province, China during July 2021. Weather Clim. Extrem. 2023, 39, 100541. [Google Scholar] [CrossRef]
  72. Rainstorms in France and Germany, May 2016. Available online: https://www.worldweatherattribution.org/european-rainstorms-may-2016/ (accessed on 24 December 2023).
  73. Ou, A.; Reuter, G. Meteorological Analysis of the Storms that Caused Severe Flooding in Alberta during June 2005. In Proceedings of the AGU Fall Meeting, San Francisco, CA, USA, 11–15 December 2006. [Google Scholar]
  74. Rykhus, R. Satellite Imagery Maps Hurricane Katrina Induced Flooding and Oil Slicks. Eos 2005, 86, 381–382. [Google Scholar] [CrossRef]
  75. WHO. Mozambique Cyclone and Floods Report #2–22 February 2007. Available online: https://reliefweb.int/report/mozambique/mozambique-cyclone-and-floods-report-2-22-feb-2007 (accessed on 24 December 2023).
  76. Nakamura, J.; Lall, U.; Kushnir, Y.; Robertson, A.W.; Seager, R. Dynamical Structure of Extreme Floods in the U.S. Midwest and the United Kingdom. J. Hydrometeorol. 2013, 14, 485–504. [Google Scholar] [CrossRef]
  77. Argentina: Floods-Aug 2015. Available online: https://reliefweb.int/disaster/fl-2015-000110-arg (accessed on 24 December 2023).
  78. Borga, M.; Marchi, L.; Nikolopoulos, E.I.; Marra, F.; Crema, S.; Niedda, M.; Pirastru, M.; Amponsah, W. The flash-flood of November 2013 in NE Sardinia (Italy): Post-event documentation and hydrological modeling. In Proceedings of the 8th International HyMeX Workshop, Valetta, Malta, 15–18 September 2014. [Google Scholar]
  79. Pinault, J.-L. Western Mediterranean Precipitation Extremes, the Result of Quasi-Resonant Sea–Atmosphere Feedbacks. Remote Sens. 2023, 15, 2711. [Google Scholar] [CrossRef]
  80. Pinault, J.-L. Weakening of the Geostrophic Component of the Gulf Stream: A Positive Feedback Loop on the Melting of the Arctic Ice Sheet. J. Mar. Sci. Eng. 2023, 11, 1689. [Google Scholar] [CrossRef]
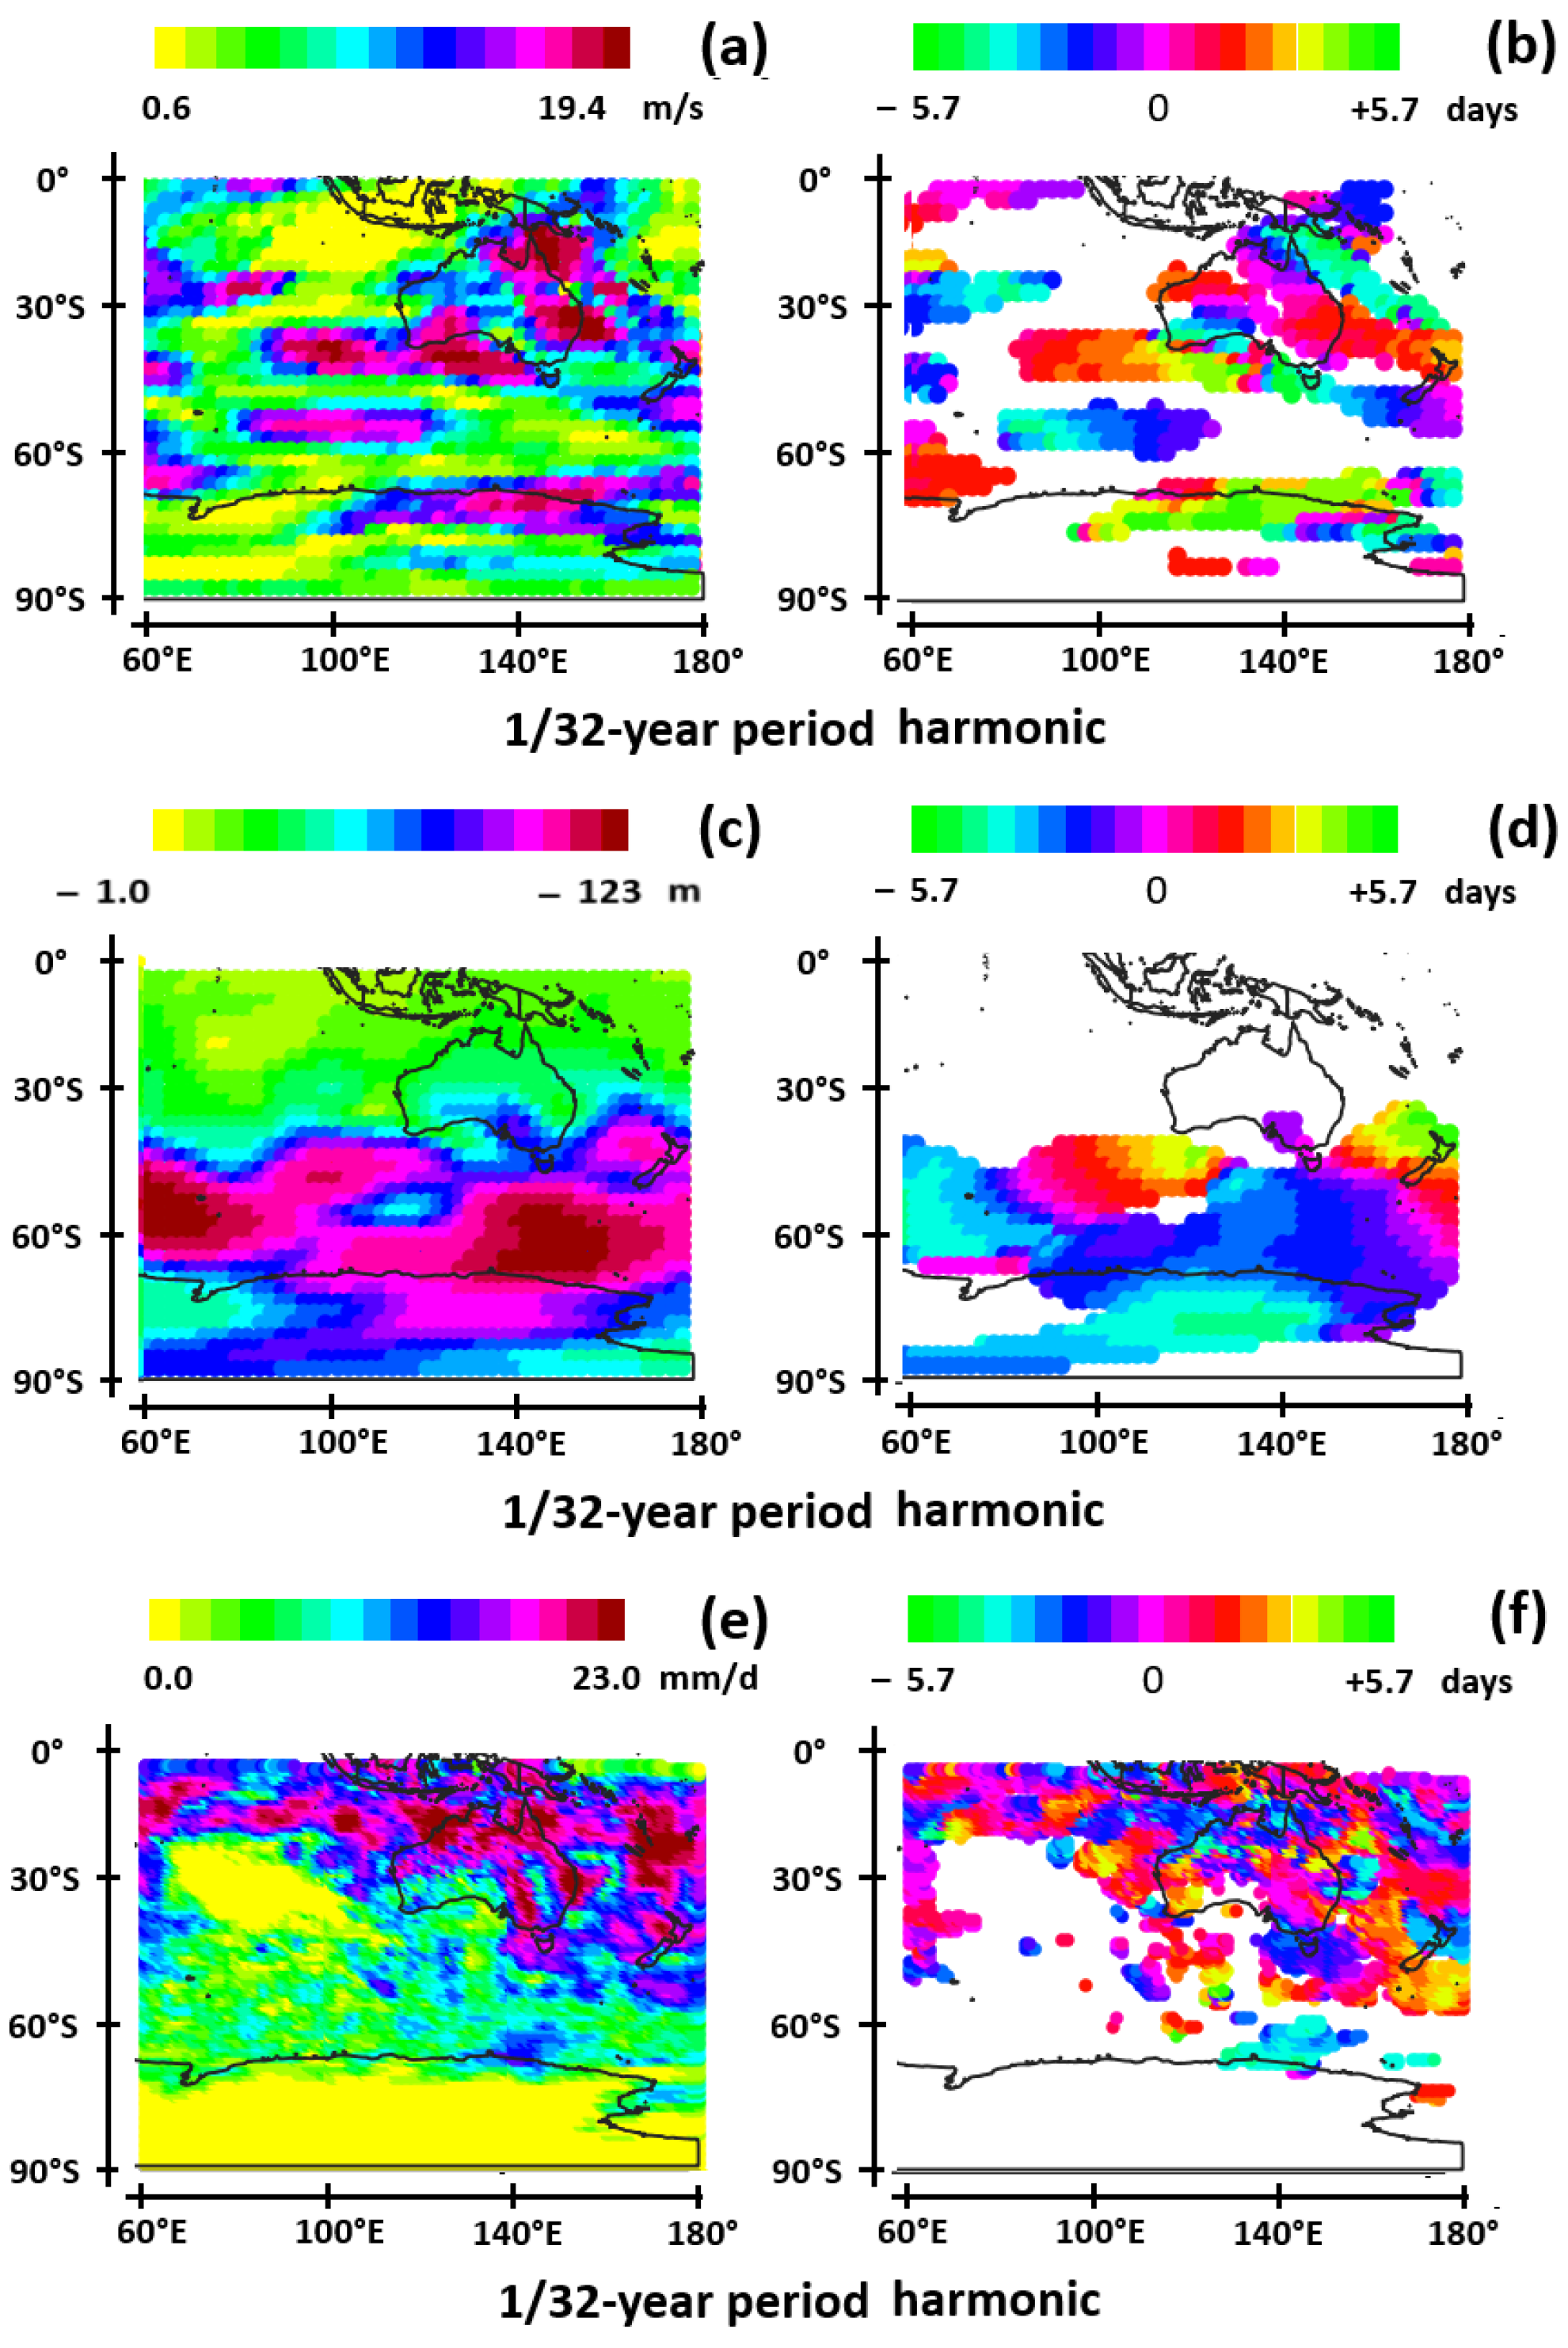
Figure 1. Wind velocity at 250 mb (a,b), geopotential height at 500 mb (c,d), and precipitation rate (e,f), on 13 January 2011: (a,c,e) amplitude and (b,d,f) phase. The wind speed phase (b) indicates when the modulated airflows are coldest. The scale of amplitudes of geopotential height variation is referring to negative anomalies.
Atmosphere 15 01226 g001
Figure 2. Amplitude of variation of wind speed at 250 mb (a,b), geopotential height at 500 mb (c,d), and ground air temperature (e,f) in the period range 17.1–34.2 days (harmonic 1/16 year). The coordinates of each mesh considered are indicated in each of the figures. Values are averaged from October to March, that is over the coldest/warmest half-year in the northern/southern hemisphere (a,c,e) and from April to September, that is over the warmest/coldest half-year in the northern/southern hemisphere (b,d,f). The second-degree polynomial and the projected trend are represented.
Atmosphere 15 01226 g002
Figure 3. Wind velocity at 250 mb (a,b), geopotential height at 500 mb, and air temperature 2 m above the ground on 25 August 2022 in the period range 17.1 to 34.2 days: (a,c,e) amplitude and (b,d,f) phase. The wind speed phase (b) indicates when the modulated airflows are warmest. The scale of amplitudes of geopotential height variation is referring to positive anomalies.
Atmosphere 15 01226 g003
Figure 4. Wind velocity at 250 mb (a,b), geopotential height at 500 mb (c,d), and precipitation rate (e,f), on 17 July 2021: (a,c,e) amplitude and (b,d,f) phase. The wind speed phase (b) indicates when the modulated airflows are coldest. The scale of amplitudes of geopotential height is referring to negative anomalies.
Atmosphere 15 01226 g004
Figure 5. Wind velocity at 250 mb (a,b), geopotential height at 500 mb (c,d), and precipitation rate (e,f), on 29 August 2005: (a,c,e) amplitude and (b,d,f) phase. The wind speed phase (b) indicates when the modulated airflows are coldest.
Atmosphere 15 01226 g005
Figure 6. Wind velocity at 250 mb in the Northern Hemisphere on 29 August 2005 in the period range 8.56 to 17.1 days. Amplitude (m/s) in (a), and phase in (b). The wind speed phase (b) indicates when the modulated airflows are coldest.
Atmosphere 15 01226 g006
Figure 7. Projected amplitude in the period range 17.1 to 34.2 days of the variations in wind speed at 250 mb averaged over the coldest half-year (referring to extratropical latitudes).
Atmosphere 15 01226 g007
Figure 8. Projected amplitude in the period range 17.1 to 34.2 days of the variations in wind speed at 250 mb averaged over the warmest half-year (referring to extratropical latitudes).
Atmosphere 15 01226 g008
Figure 9. Projected amplitude in the period range 17.1 to 34.2 days of the variations in geopotential height at 500 mb averaged over the coldest half-year (referring to extratropical latitudes).
Atmosphere 15 01226 g009
Figure 10. Projected amplitude in the period range 17.1 to 34.2 days of the variations in geopotential height at 500 mb averaged over the warmest half-year (referring to extratropical latitudes).
Atmosphere 15 01226 g010
Figure 11. Projected amplitude in the period range 17.1 to 34.2 days of the variations in ground air temperature averaged over the coldest half-year (referring to extratropical latitudes).
Atmosphere 15 01226 g011
Figure 12. Projected amplitude in the period range 17.1 to 34.2 days of the variations in ground air temperature averaged over the warmest half-year (referring to extratropical latitudes).
Atmosphere 15 01226 g012
Figure 13. Projected amplitude in the period range 17.1 to 34.2 days of the variations in extratropical precipitation rate averaged over the coldest half-year.
Atmosphere 15 01226 g013
Figure 14. Projected amplitude in the period range 17.1 to 34.2 days of the variations in extratropical precipitation rate averaged over the warmest half-year.
Atmosphere 15 01226 g014
Disclaimer/Publisher’s Note: The statements, opinions and data contained in all publications are solely those of the individual author(s) and contributor(s) and not of MDPI and/or the editor(s). MDPI and/or the editor(s) disclaim responsibility for any injury to people or property resulting from any ideas, methods, instructions or products referred to in the content.