Abstract
This study presents a comprehensive analysis of the temporal variations in the area and evapotranspiration (ET) of five key lakes on the Qinghai–Tibet Plateau: Qinghai Lake, Hara Lake, Eling Lake, Gyaring Lake, and Ulan Ula Lake. Utilizing remote sensing data from Landsat satellites over the period from 1986 to 2022, we examined the dynamic changes and identified significant correlations and lag effects between lake area and regional ET. Distinct temporal patterns and sudden changes in lake areas and ET were observed, with Qinghai Lake showing an upward trend in the summer area and a mutation in 2020, while ET exhibited a mutation in 2021. Cyclic characteristics were observed, with significant correlations noted during specific periods, indicating a strong positive phase relationship between lake area and ET. This research contributes to the sustainable development and ecological protection efforts in this ecologically fragile region.
1. Introduction
Lakes, as the second most extensive type of continental water body following glaciers, play a pivotal role in the sustenance and advancement of human societies. Encompassing an area of approximately 2.7 million km2, lakes constitute roughly 1.8% of the Earth’s terrestrial expanse. The dynamic nature of lakes, characterized by their periodic expansion and contraction, is not merely a natural phenomenon but a significant factor in the alteration of the underlying surface environment [1].
The Qinghai–Tibet Plateau hosts the largest, highest, and most numerous highland lakes globally, making it one of the densest lake regions in the world. These lakes account for more than 50% of the country’s total lake area [2]. The changes in the area and number of lakes on the Qinghai–Tibet Plateau are greatly influenced by precipitation and glacier meltwater. However, due to the plateau’s arid climate and intense evaporation, most lake basins quickly evaporate after rainfall. Thus, the relationship between lake area and evapotranspiration (ET) is more pronounced on the Qinghai–Tibet Plateau.
The impact of climate change on water resources is a globally concerning issue. Climate change alters precipitation patterns, including changes in the amount and distribution of rainfall. Climate warming accelerates the melting of glaciers and mountain snow while also increasing water evaporation rates, leading to seasonal changes in river flow in some regions and accelerating the loss of water resources. In addition, climate change indirectly affects water quality by influencing water temperature, pollutant concentrations, and water flow. Therefore, the impact of climate change on water resources is multi-dimensional, involving changes in both water quantity and quality as well as spatial and temporal distribution. The specific impacts in different regions depend on local climatic conditions, geographical characteristics, and socioeconomic factors, requiring adaptive and management measures tailored to each region.
In recent years, both national and local governments have strengthened the planning and management of resources to promote sustainable development, easing the development and utilization of lake resources to some extent. The rapid and high-precision extraction of water body information through satellite remote sensing images has become an essential research method in water resource surveys and macro-monitoring, urban green space surveys, and wetland protection [3]. In recent years, studies have used remote sensing data to study regional changes in lakes and achieved significant progress [4]. The lakes on the Qinghai–Tibet Plateau have also been specifically studied. For instance, Zhang et al. [5] constructed a remote sensing monitoring model for the storage capacity of lakes in Qinghai Province using GF-1/6 WFV water area and ICESat-2 altimetry water level data to monitor the spatio-temporal changes in lake storage capacity in Qinghai Province via remote sensing. Hao et al. [6] analyzed the spatio-temporal changes in lake areas on the Qinghai–Tibet Plateau from 1970 to 2021 and their correlation with climate factors based on remote sensing data of lakes on the Qinghai–Tibet Plateau. Zhao et al. [7] introduced a lake water identification model utilizing U-Net and ViTenc-UNet. This model was specifically applied to typical lakes on the Qinghai–Tibet Plateau to overcome the limitations of convolutional neural networks (CNN) in capturing long-range continuous spatial relationships between pixels. Tian et al. [8] proposed an automated method for extracting lake shorelines from Chinese GF-2 images to monitor the response of thermokarst lakes on the Qinghai–Tibet Plateau to rapid climate change and human activities. Li et al. [9] utilized various water body extraction algorithms on the Global Earth Engine (GEE) platform to quantitatively assess the results of water body and lake area extraction on the Qinghai–Tibet Plateau. Their study explored the effectiveness of Landsat 9 images in relation to extraction accuracy and algorithms, revealing a strong consistency between Landsat 9 and Landsat 8 data, which can be used together for more efficient identification of plateau water bodies.
In processed remote sensing images, the reflectance values of different ground objects and surfaces present different spectral curves. Using the significant difference in the surface reflectance values of water bodies compared to other ground objects, water bodies can be separated from other ground information. Currently, significant achievements have been made in lake water information extraction based on remote sensing technology, with widely adopted methods including single-band threshold, multi-band operation [10], and mixed pixel decomposition [11].
Satellite remote sensing technology, with its large area, long period, and real-time characteristics, has shown significant advantages in surface resource monitoring. Currently, much research uses various remote sensing data sources to study lake area changes in different regions. Ding et al. [12,13,14] and Wu et al. [15,16] used MODIS data to propose a water spectral recognition method based on MODIS data for the spectral reflectance characteristics of water bodies, providing a faster and simpler method for lake water quality monitoring [17,18]. Ma et al. [19,20,21] examined the trends in area changes of the Ruoqiang Lake group in Xinjiang from 1970 to 2006 using early remote sensing data and CBERS data. Their analysis revealed a significant expansion in lake area since 2002, which may be linked to factors such as glacier melt, increased precipitation, and ecological water diversion. Li et al. [22,23,24] studied the characteristics of Dongting Lake water bodies in 2005 using the Normalized Difference Water Index (NDVI) and established typical ground object spectral characteristic analysis methods, showing that Dongting Lake water bodies were smaller in winter and spring and larger in summer and autumn. Bian et al. [25,26] found that Selin Co has been expanding outward at an annual rate of 20% by analyzing the area changes in Selin Co from 1999 to 2008. El-Asmar et al. [27,28,29] conducted dynamic monitoring of multiple water body areas in the Nile Delta using NDWI and Modified Normalized Difference Water Index (MNDWI), revealing that human activities are the primary drivers of lake shrinkage [30,31]. Wang et al. [32] studied three typical inland lakes in the arid region of Central Asia using Landsat satellite remote sensing data and the ratio method with the water body index model, analyzing the 30-year change trend and finding that nearly half of the lakes in the arid region had undergone severe degradation, with the most severe shrinkage occurring in the terminal lakes of the arid region. Meng et al. [33] used Landsat remote sensing images to study the continuous reduction in the area of Daihai Lake from 1990 to 2020, which was especially significant in the first 10 years. Besser et al. [34] evaluated the sensitivity of land degradation processes in southwestern Tunisia using the BCWQI, OWQI, and WAWQI water quality indices and through the MEDALUS and IMDPA multi-criteria models. AI-Hussein et al. [35] used the WMS and HEC-HMS hydrological software to calculate the hydrograph of the Khazir River’s drainage basin in order to estimate flood volume and flow rates. They also used the SCS Unit Hydrograph to evaluate and calculate rainfall depth, verifying the strong correlation between HEC-HMS and HEC-RAS in assessing flood risks and reliably predicting future floods in the study area.
Numerous studies indicate that the primary factors influencing lake area are both human activities and natural processes, with the latter primarily involving precipitation and ET [4]. Studies on major lakes such as Hui River [36], Aksai Chin Lake [37], Inner Mongolia Plateau Lakes [38], Bosten Lake [39], and Da Sugan Lake [40] in Gansu Province, among others, indicate that the lakes on the Qinghai–Tibet Plateau generally follow this pattern, where increased precipitation leads to lake area expansion and increased water volume [41], and reduced evaporation is also a reason for lake area expansion [42].
ET is a key component of the water cycle, representing the movement of water from surfaces containing water molecules and serving as a significant mechanism of water loss in lakes. Various factors, both intrinsic and extrinsic [43], influence lake ET. Intrinsic factors include a large lake surface area [44], shallow water depth, clear water quality, and dark water color, all of which accelerate evaporation. Extrinsic factors encompass intense solar radiation [45], high temperatures [46], low humidity [47], low air pressure, high wind speeds, and minimal precipitation [48], each contributing to increased evaporation rates compared to their opposites.
The Qinghai–Tibet Plateau, often referred to as the “Roof of the World,” is an ecologically sensitive region that hosts a multitude of freshwater lakes, among which Qinghai Lake, Hara Lake, Eling Lake, Gyaring Lake, and Ulan Ula Lake are of paramount importance. These lakes not only serve as critical water resources, but also play a significant role in regional climate regulation and biodiversity conservation. Given their ecological significance, monitoring their area and understanding their relationship with regional ET is essential for effective environmental management and policy making. This study, therefore, aims to bridge the knowledge gap by providing a detailed analysis of the spatio-temporal dynamics of these lakes’ areas and their correlation with ET, leveraging extensive remote sensing data. The insights gained from this research will be instrumental in formulating sustainable strategies for the conservation and management of these vital ecosystems, setting the stage for a comprehensive understanding of the complex interactions between lake hydrodynamics and regional climate patterns.
2. Data and Methods
2.1. Study Area
Qinghai Province, situated in western China and in the northeastern part of the Qinghai–Tibet Plateau, is characterized by long hours of sunshine, intense radiation, and significant diurnal temperature variations. Spanning 105 km by 63 km with an elevation of 3196 m, the saline lake covers 4572.69 km2, averages 21 m in depth, and holds approximately 105 billion m3 of water [49].
Hara Lake is the second largest lake in Qinghai Province, also known as the Black Sea. It is located between the Shule Nanshan and Harko Mountains. Hara Lake covers an area of 637 km2 and has a surface elevation of 4078 m. Hara Lake is a saline lake with a northwest–southeast elliptical shape, with a long axis of 34.2 km and a short axis of 23 km. The lake has an average depth of 27.14 m, a maximum depth of 65 m, and holds a water volume of 16.1 billion cubic meters [50].
Gyaring Lake, a large freshwater lake in the upper reaches of the Yellow River, is situated within a structural depression in the western part of Maduo County on the Qinghai Plateau, to the west of Eling Lake. The lake is situated at an elevation of 4294 m above sea level, extending 35 km from east to west and 21.6 km from north to south. It covers an area of 541.8 km2, with an average depth of 8.9 m. The water volume is 4.6 billion m3 [51].
Eling Lake is elongated from north to south and narrow from east to west, covering a surface area of 610.7 square kilometers. The average depth of Eling Lake is 17.6 m, with a maximum depth of over 30.7 m and a water volume of 10.76 billion m3 [52].
Ulan Ula Lake is located in the northern part of Tangula Town, Golmud City, Qinghai Province. It is composed of three lakes (North Lake, West Lake, and East Lake) arranged in a circular pattern. The lake generally extends in a west-northwest direction, with North Lake being long and narrow and East Lake and West Lake having similar areas. The total area is approximately 612 km2, with an elevation ranging from 4900 to 5300 m. The lake extends 46.4 km in length and 11.73 km in width, with an average depth of 6.9 m and a water level of 4854 m [53].
The detailed information of the five key lakes over Qinghai Province is shown in Figure 1, and their latitude and longitude ranges are listed in Table 1.
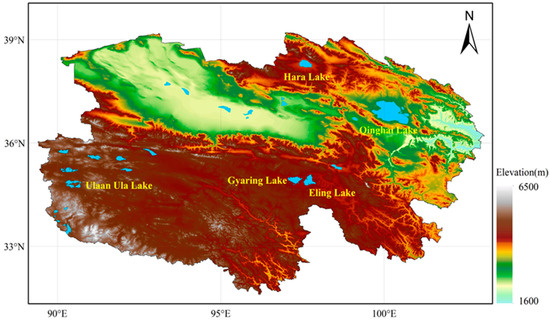
Figure 1.
Key lake regions in Qinghai Province.

Table 1.
Geographical scope of key lakes in Qinghai Province.
2.2. Data and Methodology
Evapotranspiration monitoring data plays a crucial role in understanding the water cycle, optimizing resource management, and responding to climate change, especially in the context of increasing climate variability and water scarcity. Ground-based measurements provide precise, localized evapotranspiration data, while satellite remote sensing offers large-scale evapotranspiration data, helping to cover remote or inaccessible areas. By combining the two types of data, a more comprehensive evapotranspiration distribution map can be created to support regional hydrological models.
2.2.1. The Data of Remote Sensing Image
The remote sensing data for the lake used in this study were collected from the Landsat TM 4-5, Landsat 7 ETM+ SLC-off, and Landsat 8-9 OLI/TIRS C2 L2 satellites. Spanning the period from 1986 to 2022, the dataset includes imagery and associated data for several key lakes in Qinghai Province: Qinghai Lake, Hara Lake, Eling Lake, Gyaring Lake, and Ulan-Ula Lake. Due to the seasonal freezing and thawing cycles of these lakes, where ice typically persists from November to April with partial thawing in spring, our analysis focused on cloud-free images with less than 15% cloud cover captured in July each year, maintaining a spatial resolution of 30 m.
2.2.2. Lake Area Data for Evaluation
The evaluated data used for verification originate from the Comprehensive Survey and Monitoring Institute of Natural Resources of Qinghai Province. These data were obtained through visual interpretation conducted by experts leveraging their knowledge, experience, and pertinent information. It acts as the reference for validating the accuracy of lake boundaries automatically extracted from remote sensing data.
2.2.3. Reanalysis ET
The ET data used in this study were sourced from the fifth-generation European Centre for Medium-Range Weather Forecasts (ECMWF) reanalysis dataset, ERA5-Land reanalysis dataset (ERA5-Land). This dataset provides detailed records of land surface variables and their characteristics over several decades, offering higher spatial resolution compared to its predecessor, ERA5. ERA5-Land combines model outputs with global observational data to produce a consistent and reliable dataset, featuring detailed records dating back to 1950 with a temporal resolution of 1 h. ERA5-Land has a spatial resolution of 9 km on a reduced Gaussian grid (TCo1279), and the resolution has been resampled to a regular latitude–longitude grid with a resolution of 0.1° × 0.1° for accessibility within the Copernicus Climate Data Store (CDS). This study primarily utilizes monthly average total ET data derived from ERA5-Land for analysis and interpretation.
2.3. Main Methods of Research
2.3.1. Mann–Kendall (M–K) Method
For a time series x with n independent samples, an ordered sequence is constructed:
where is the number of elements larger than all preceding elements. The statistical variable is defined as:
where = 0, , and are the mean and variance of the cumulative sum :
Reversing the time series , , …, , yields , where = − (k = n, n − 1, …, 1), = 0. Analyzing the plotted UF and UB curves, a value of UF or UB greater than 0 indicates an upward trend, while a value less than 0 indicates a downward trend [54,55,56,57,58]. If these values exceed the critical line, the trend is considered significant [59,60,61]. When the UF and UB curves intersect between the critical lines, the intersection point corresponds to the time when the mutation began.
2.3.2. Wavelet Coherence Analysis Method
Mapping the spatiotemporal patterns of soil moisture within heterogeneous landscapes is crucial for resource management and understanding hydrological processes. Liu et al. [62], through wavelet analysis experiments, provided new insights into soil moisture dynamics under different plant functional types, validating the feasibility of using WT, WTC, and XWT to assess dynamic differences. In this study, wavelet transform (WT), wavelet coherence (WTC), and cross wavelet transform (XWT) were employed to analyze the characteristics of key lake surface areas and total ET in Qinghai Province, focusing on aspects like periodicity. We used a MATLAB toolbox to implement the relevant programs (http://grinsted.github.io/wavelet-coherence/, accessed on 12 January 2023).
Wavelet analysis is an effective tool for examining the correlation structure between two ecological signals over time, and is especially well-suited for non-stationary systems. WTC finds regions of common variation between two time series in the time-frequency space [63,64,65]. It divides the overall correlation between two variables into correlations at different scales and positions while revealing the specific relationships between the variables at those scales and positions. XWT detects areas of consistent periodic intensity within a time series in the time-frequency space [66,67,68].
The formula for wavelet transform is:
Here, represents the signal to be analyzed, with t as the time-domain variable, serving as the input for the wavelet transform. The result of the wavelet transform is , where and represent the scale factor and translation, respectively.
In wavelet transform diagrams, common terms such as ‘cone’, ‘arrow’, and ‘lag’ have specific meanings, particularly in the field of time-frequency analysis. The following is an explanation of these terms:
In wavelet transform, ‘cone’ usually refers to the cone of influence (COI), which indicates the region where boundary effects may influence the results. In practical time series analysis, due to the limited length of the signal, when analyzing the boundaries of the time series, the wavelet’s support extends beyond the data range, which introduces boundary effects. The COI helps to identify the area where these boundary effects occur, allowing us to distinguish between reliable results and those that may be affected.
‘Arrow’ in wavelet transform diagrams is usually used to represent directional information, especially in vectorized wavelet transforms (such as complex wavelet transforms). Arrows indicate the phase angle, which can represent phase or directional information. For example, in meteorological or oceanographic studies, arrows can be used to show the direction of wave phase, energy flow, or wind field direction.
‘Lag’ generally refers to time delay. In wavelet analysis, ‘lag’ is used to indicate the time shift or delay relationship between different signals or different parts of the same signal. Wavelet transform provides not only frequency information, but also time information, so by observing the lag, we can reveal the relative time shifts of different frequency components in the signal. For example, in multivariate time series analysis, lag can be used to detect time–lag relationships between different variables.
The application of these concepts in wavelet analysis helps us better understand the characteristics and interrelationships of signals in the time and frequency domains.
2.3.3. Lake Surface Area Extraction Method
This study applied NDWI and MNDWI to delineate the water surfaces of major lakes in Qinghai Province from 1986 to 2022. NDWI extracts water body information from remote sensing images by normalizing the difference between the Green and NIR bands. The principle is that water bodies have high reflectance, while other substances have lower reflectance, thus highlighting water body information. The formula is:
MNDWI is similar to NDWI, while it replaces the NIR band with the SWIR band. The formula is:
It is worth noting that in certain years, the remote sensing images processed with NDWI and MNDWI may include tributaries or connections with surrounding small water bodies [69]. Therefore, this study will trim the processed image results using the measured images and derive the final results.
3. Results and Discussion
3.1. Evaluation of Observation Data and Satellite Data
This paper employs deviation, RMSE, and relative deviation to assess the accuracy of lake surface area results obtained from remote sensing data using NDWI and MNDWI against measured values from monitoring stations. As shown in Table 2, the average deviation, RMSE, and relative deviation of the Qinghai Lake area calculated and extracted using NDWI compared to the measured values are −1.78 km2, 3.37 km2, and 0.04%, respectively. In comparison, the average deviation, RMSE, and relative deviation for the area calculated and extracted using MNDWI are 2.36 km2, 3.26 km2, and 0.05%. Therefore, both the NDWI and MNDWI methods can accurately reflect the true lake surface area.

Table 2.
Deviation values, RMSE, and relative deviation values of the five major lakes in Qinghai Province.
3.2. Temporal Variation Characteristics of Lake Area and ET
Using the M–K analysis method, we analyzed the temporal evolution and abrupt changes in the summer lake area and regional ET of key lakes in Qinghai Province.
3.2.1. Qinghai Lake
The temporal evolution trend of the lake area indicates that, during the summers of 1986–1989, the area of Qinghai Lake exhibited a fluctuating downward trend, reaching a peak in 1990 with an area of 4402.42 square kilometers, followed by a fluctuating decline to the lowest value in 2004, and eventually fluctuating upwards to 2022.
In Figure 2b, the UF statistic was negative from 1986 to 1990, positive from 1991 to 1994, negative again from 1995 to 2016, and positive from 2017 to 2022. The UF statistic exceeded the critical value area between 1998 and 2012 and after 2021, suggesting that the summer area of Qinghai Lake did not show a significant downward trend between 1995–1997 and 2013–2016, but exhibited a significant downward trend between 1998 and 2012. Additionally, the summer area of Qinghai Lake did not show a significant upward trend between 2017 and 2020, but showed a significant upward trend between 2021 and 2022. The intersection of the UF and UB statistical lines in 2020 signifies a mutation in the summer area of Qinghai Lake that year.
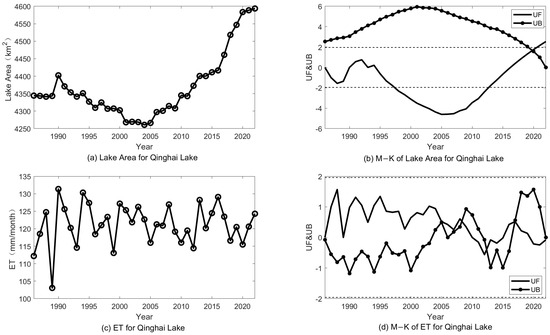
Figure 2.
The trends in summer variation for Qinghai Lake area (a) and Qinghai Lake ET (c), and the M–K mutation analysis results for the summer area (b) and ET (d) of Qinghai Lake.
The temporal trend of lake evaporation shows that, from 1986 to 2009, Qinghai Lake’s summer evaporation increased with fluctuations, but from 2010 to 2022, it displayed a fluctuating decrease. In Figure 2d, the UF statistic was positive from 1986 to 2009, negative from 2010 to 2015, briefly positive in 2016–2017, and then negative until 2022. Throughout the study period, the UF remained within the critical value area, indicating no significant trend in the summer evaporation of Qinghai Lake. The intersections of the UF and UB statistical lines occurred in 2005–2008, 2012, and 2017, indicating mutations in the summer evaporation of Qinghai Lake during these years.
3.2.2. Hara Lake
The temporal evolution trend of the lake area indicates that Hara Lake exhibited a characteristic pattern of slow decline followed by a rapid increase during the summer months, with a minimum value occurring around the year 2001.
In Figure 3b, the UF statistic was negative from 1987 to 1992, positive from 1993 to 1995, negative again from 1996 to 2005, and positive from then until 2022. The UF statistic exceeded the upper critical value from 2010 to 2022, indicating a significant increase in the summer area of Hara Lake during this period. The intersection of the UF and UB statistical lines in 2014, occurring outside the critical line, suggests a potential mutation in Hara Lake’s area that year.
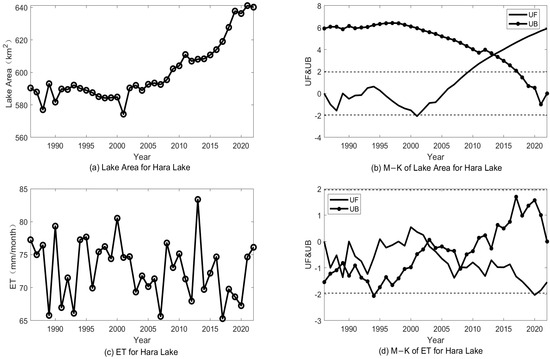
Figure 3.
The trends in summer variation for Hara Lake area (a) and Hara Lake ET (c), and the M–K mutation analysis results for the summer area (b) and ET (d) of Hara Lake.
The trend in lake evaporation reveals that from 1986 to 2022, Hara Lake’s summer evaporation exhibited a fluctuating decline. In Figure 3d, the UF statistic was overall negative during the period from 1986 to 2022, with a brief positive value from 2000 to 2002, indicating an overall declining trend in evaporation, although not significantly so. The intersections of the UF and UB statistical lines occurred in 1988–1989, 2002–2003, and 2018 within the critical area, indicating mutations in the summer evaporation of Hara Lake during these years.
3.2.3. Eling Lake
Figure 4 presents the summer variation trend of the Eling Lake area from 1986 to 2022 (Figure 4a) along with the M–K mutation analysis results (Figure 4b), as well as the summer variation trend of lake evaporation (Figure 4c) and its M–K mutation analysis results (Figure 4d). The overall trend in the lake area over time exhibits a pattern of increase, followed by a decrease, and then another increase. In Figure 4b, the UF statistic was positive from 1986 to 1997, negative from 1998 to 2002, and has been positive since 2002. After 2005, the UF statistic surpassed the upper critical line, suggesting that the variation in Eling Lake’s summer area was not significant before 2005, but it has demonstrated a marked upward trend since then. The intersection of the UF and UB statistical lines occurred in 2001 within the critical lines, suggesting a mutation in the summer area of Eling Lake that year, characterized by an initial decrease followed by an increase.
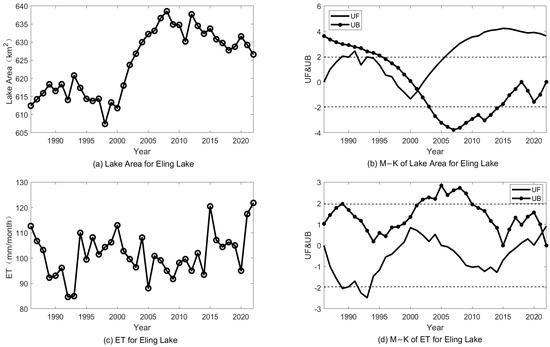
Figure 4.
The trends in summer variation for Eling Lake area (a) and Eling Lake ET (c), and the M–K mutation analysis results for the summer area (b) and ET (d) of Eling Lake.
The temporal evolution trend of lake evaporation shows an overall pattern of decrease, increase, decrease, and then another increase. In Figure 4d, the UF statistic was negative from 1986 to 1998, positive from 1999 to 2005, negative from 2006 to 2017, and positive again from 2018 to 2022. The UF statistic exceeded the lower critical value in 1989 and between 1992 and 1993, indicating significant downward trends in the summer evaporation of Eling Lake during these periods. The intersection of the UF and UB statistical lines occurred in 2021 within the critical lines, indicating a mutation in the summer evaporation of Eling Lake that year.
3.2.4. Gyaring Lake
Figure 5 presents the summer variation trend of the Gyaring Lake area from 1986 to 2022 (Figure 5a) along with the M–K mutation analysis results (Figure 5b), as well as the summer variation trend of lake evaporation (Figure 5c) and its M–K mutation analysis results (Figure 5d). The temporal evolution trend of the lake area indicates that Gyaring Lake’s summer area has exhibited an overall pattern of fluctuating increase, followed by a fluctuating decrease, and then another fluctuating increase, with a rapid rise in the lake area occurring in 1989.
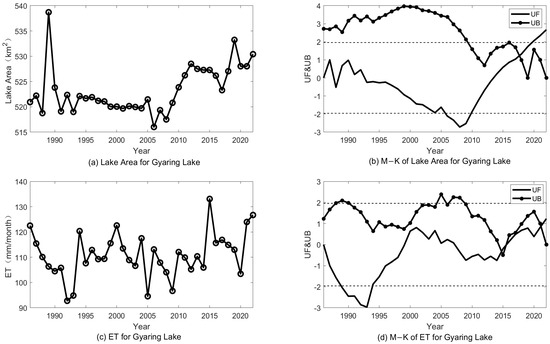
Figure 5.
The trends in summer variation for Gyaring Lake area (a) and Gyaring Lake ET (c), and the M–K mutation analysis results for the summer area (b) and ET (d) of Gyaring Lake.
In Figure 5b, the UF statistic was positive from 1989 to 1992, negative from 1993 to 2013, and positive from then until 2022. The UF statistic exceeded the lower boundary line from 2006 to 2009 and the upper boundary line after 2020, suggesting that Gyaring Lake’s summer area showed a significant downward trend between 2006 and 2009 and a significant increase after 2020. The intersection of the UF and UB statistical lines occurred in 2018 within the critical lines, indicating a mutation in the summer area of Gyaring Lake that year.
Overall, evaporation has shown a pattern of decrease, increase, decrease, and then another increase. In Figure 5d, the UF statistic was negative from 1986 to 1999, turned positive from 2000 to 2007, was negative again from 2008 to 2015, and has remained positive up to 2022. The UF statistic exceeded the lower critical value line from 1989 to 1993, indicating that the summer evaporation of Gyaring Lake did not show a significant downward trend between 1986–1988 and 1994–1999, but exhibited a significant downward trend between 1989 and 1993. The intersections of the UF and UB statistical lines occurred in 2014–2016 and 2021 within the critical lines, indicating mutations in the summer evaporation of Gyaring Lake during these years.
3.2.5. Ulan Ula Lake
Figure 6 displays the summer variation trend of the Ulan Ula Lake area from 1986 to 2022 (Figure 6a) along with the M–K mutation analysis results (Figure 6b), as well as the summer variation trend of lake evaporation (Figure 6c) and its M–K mutation analysis results (Figure 6d). The overall trend of the Ulan Ula Lake area during the summer season shows a pattern of fluctuating decline followed by a fluctuating rise. In Figure 6b, the UF statistic was negative from 1986 to 2002 and positive from 2003 to 2022. The UF statistic exceeded the lower boundary line during 1996–1998 and the upper boundary line after 2007, indicating a significant downward trend in the summer area of Ulan Ula Lake during 1996–1998 and an upward trend after 2007. The intersection of the UF and UB statistical lines outside the critical line in 2009–2010 indicates a potential mutation in the summer area of Ulan Ula Lake during those years.
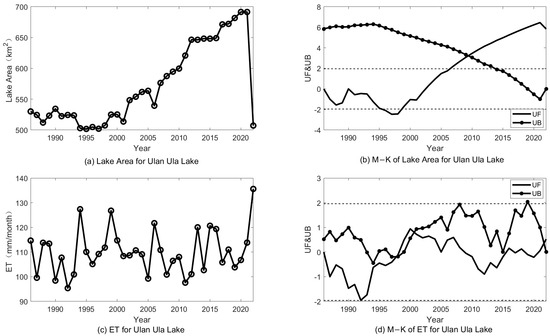
Figure 6.
The trends in summer variation for Ulan Ula Lake area (a) and Ulan Ula Lake ET (c), and the M–K mutation analysis results for the summer area (b) and ET (d) of Ulan Ula Lake.
The summer evaporation of Ulan Ula Lake exhibits an overall trend of decrease, increase, decrease, and then another increase. In Figure 6d, the UF statistic was negative from 1986 to 1998, fluctuated between negative and positive from 1999 to 2008, and was negative from 2009 to 2020, followed by a positive trend until 2022. The UF statistic remained within the critical value area throughout the period from 1986 to 2022, indicating no significant trend in the summer evaporation of Ulan Ula Lake. The intersections of the UF and UB statistical lines occurred in 1998 and 2000–2001 within the critical lines, indicating mutations in the summer evaporation of Ulan Ula Lake during these years.
3.3. The Response Relationship between Lake Surface Area and Regional ET in Key Lakes of Qinghai Province
3.3.1. Qinghai Lake
Figure 7 shows that from 1986 to 2022, Qinghai Lake’s area did not display significant periodic characteristics. However, from 2013 to 2022, the lake’s area exhibited weak periodicity with a cycle of 4–8 years. ET showed significant periodic characteristics with 2–4-year cycles from 1990 to 1999 and from 2004 to 2011, but displayed no clear periodicity during other periods. The cross-wavelet transform results demonstrate a significant positive phase correlation between lake surface area and ET over a 4–8-year period. The incomplete horizontal right arrows between lake surface area and ET, primarily observed from 2015 to 2022, suggest a significant lag effect during this period. Additionally, the wavelet coherence transform results indicate that the primary resonance period between lake surface area and ET was approximately 4–8 years between 1986–1995 and 2020–2022. From 1992 to 2022, the main resonance period between Qinghai Lake area and ET was about 10–12 years, with coherence greater than 0.8 during the main resonance periods, indicating a significant positive correlation. Notably, there were also some high coherence peaks on the 0–2-year timescale.
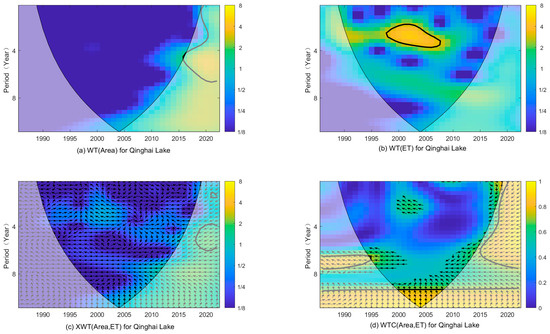
Figure 7.
Wavelet power spectra for Qinghai Lake area (a) and regional ET (b), cross-wavelet transform between lake area and regional ET (c), and wavelet coherence between lake area and regional ET (d) during the summer from 1986 to 2022. The direction of the arrows in (c) corresponds to the phase delay’s position on the unit circle. For example, a vertical arrow may indicate a phase delay of π/2 (90 degrees) or a quarter-cycle lag. The corresponding time delay depends on the duration of the cycle. Arrows in (d) indicate the phase relationship between signals, where the direction of the arrows can indicate whether one signal is leading or lagging another signal. Arrows indicate the same in figures below.
Figure 8 shows that, from 1986 to 2022, Qinghai Lake’s area did not display significant periodic characteristics. However, from 2020 to 2022, the lake area exhibited weak periodic features with a cycle ranging from 0 to 20 months. ET displayed significant periodic patterns throughout 1986 to 2022, with a period of 8 to 16 months, and no significant periodic features were observed during other time segments.
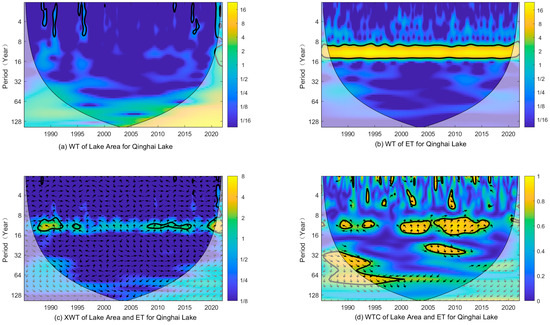
Figure 8.
Monthly wavelet power spectra of Qinghai Lake area (a) and regional ET (b) from 1986 to 2022, along with the cross-wavelet transform (c) and wavelet coherence transform (d) between lake area and regional ET.
The cross-wavelet transform results show a strong positive phase correlation of lake area with ET over an 8-to-16-month interval. Additionally, incomplete horizontal right arrows observed for the lake area and ET were mainly present from 1987 to 1992, 2007 to 2016, and 2018 to 2022, indicating a significant delay effect between these variables during those times. Furthermore, the wavelet coherence transform results indicate that, between 1988 and 1992 and from 1993 to 1995, the primary resonant period between the lake area and ET was approximately 9 to 12 months. From 1999 to 2016, the primary resonant period between Qinghai Lake area and ET was approximately 8 to 16 months, with coherence values exceeding 0.8 during these periods, indicating a strong positive correlation. Additionally, there are notable high-coherence peaks at timescales of 0–7 months and 20–40 months.
3.3.2. Hara Lake
Figure 9 shows that, from 1986 to 2022, Hara Lake’s area did not display notable periodic characteristics. From 1986 to 1993, the area of Hara Lake showed weak periodic characteristics within a period of 0–3 years. From 1986 to 2022, regional ET in Hara Lake did not exhibit significant periodic characteristics, with notable periodic characteristics observed only from 2004 to 2005, with a period of 0–1 years. The cross-wavelet transform results reveal a strong positive phase link between lake surface area and ET over a 2–5-year interval. Additionally, the incomplete horizontal right arrows between lake surface area and ET are most prevalent from 2018 to 2022, indicating a substantial delay between these variables during this period. Furthermore, the wavelet coherence transform results show that from 1986 to 2015, the predominant resonance interval between the lake’s surface area and ET was approximately 5–12 years. From 2016 to 2022, the main resonance period between Hara Lake area and ET was about 8–10 years, with coherence greater than 0.8 during the main resonance periods, indicating a significant positive correlation. Notably, there were also some high coherence peaks on the 0–6-year timescale.
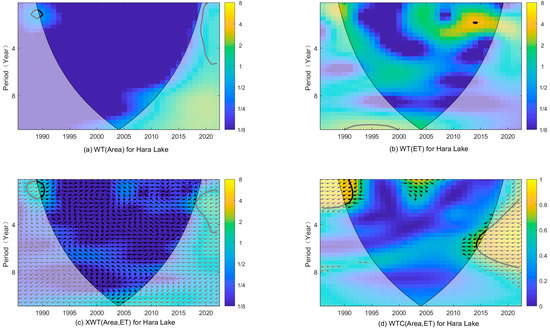
Figure 9.
Wavelet power spectra for Hara Lake area (a) and regional ET (b), cross-wavelet transform between lake area and regional ET (c), and wavelet coherence between lake area and regional ET (d) during the summer from 1986 to 2022.
Figure 10 indicates that, during 1986–1987 and 2002–2004, Hara Lake area exhibited distinct periodic characteristics with periods of 0–8 months, 0–6 months, and 8–12 months, respectively. Throughout 1986–2022, the regional ET of Hara Lake demonstrated significant periodic features with a period of 8–16 months.
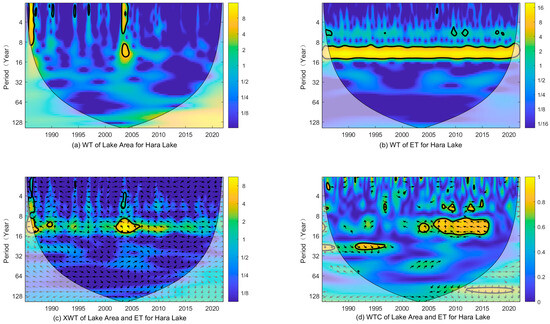
Figure 10.
Monthly wavelet power spectra of Hara Lake area (a) and regional ET (b) from 1986 to 2022, along with the cross-wavelet transform (c) and wavelet coherence transform (d) between lake area and regional ET.
The cross-wavelet transform results reveal a notable positive phase association between the lake’s area and ET over a 4–16-month timescale. Additionally, incomplete horizontal right arrows between the lake area and ET are primarily observed between 1986–1988 and 2001–2007, suggesting a pronounced lag effect between the lake area and ET during these periods.
Furthermore, the wavelet coherence transform results indicate that, between 1992 and 1995, the primary resonant period between the lake area and ET was approximately 20–30 months. From 1999 to 2007, the main resonant period between Hara Lake’s area and ET was about 32–48 months, and between 2005 and 2016, it was about 8–16 months. High coherence values, greater than 0.8, during the principal resonant periods reflect a significant positive correlation. Notably, there were also some high coherence peaks on a 4–16-month timescale.
In summary, the area of Hara Lake and ET showed significant correlations during the periods of 1986–1988 and 2001–2007, with a discernible lag effect. These findings contribute to a deeper understanding of the complex interactions between lake area and ET, emphasizing the importance of considering time lags and periodicity in hydrological studies and water resource management in the region.
3.3.3. Eling Lake
Figure 11 indicates that, from 1986 to 2022, Eling Lake’s area lacked significant periodic patterns. From 1986 to 1989, Eling Lake’s area exhibited mild periodic patterns with a cycle of 0–1 years, and from 1997 to 1999, it showed weak periodic features with a cycle of 2–3 years. ET exhibited notable periodic patterns from 2015 to 2022, with cycles ranging from 1 to 4 years, but showed no clear periodicity at other times. The cross-wavelet transform results indicate a substantial positive phase link between the lake’s surface area and ET over a 0–4-year timescale. Additionally, the partial horizontal right arrows for lake surface area and ET were predominantly observed during 1991–1995 and 2015–2019, indicating a significant delay effect between these variables during these intervals. Furthermore, the wavelet coherence transform results show that, from 2019 to 2022, the main resonance period between lake surface area and ET was about 6–8 years. From 1986 to 2021, the dominant resonance interval between Eling Lake’s area and ET was about 8–12 years, with coherence values greater than 0.8 during these periods, indicating a strong positive correlation.
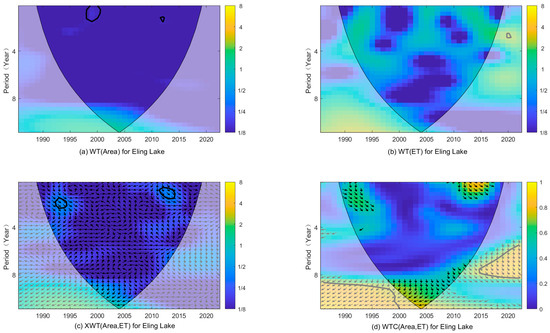
Figure 11.
Wavelet power spectra for Eling Lake area (a) and regional ET (b), cross-wavelet transform between lake area and regional ET (c), and wavelet coherence between lake area and regional ET (d) during the summer from 1986 to 2022.
3.3.4. Gyaring Lake
Figure 12 indicates that, between 1986 and 2022, Gyaring Lake’s area lacked significant periodic patterns. However, during 1986–1993, the area exhibited minor periodicity, with a cycle ranging from 0 to 5 years. ET did not display significant periodic characteristics from 1986 to 2022, showing only weak periodic characteristics from 2019 to 2021, with a period of 2–3 years. The cross-wavelet transform results reveal a notable positive phase connection between lake surface area and ET over a 1–3-year timescale. Additionally, the partial horizontal right arrows between lake surface area and ET were primarily observed between 1988 and 1993 and from 2018 to 2022, suggesting a notable delay effect between these variables during these times. Furthermore, the wavelet coherence transform results reveal that, from 2010 to 2022, the dominant resonance interval between lake surface area and ET was approximately 0–5 years, with coherence exceeding 0.8 during these intervals, reflecting a strong positive correlation.
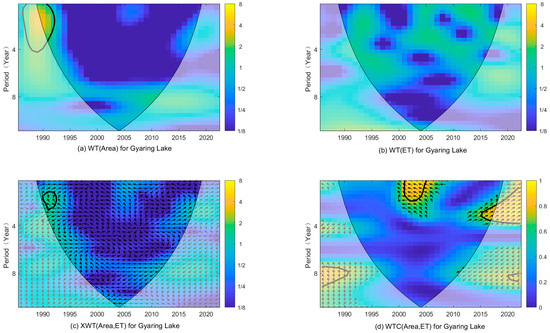
Figure 12.
Wavelet power spectra for Gyaring Lake area (a) and regional ET (b), cross-wavelet transform between lake area and regional ET (c), and wavelet coherence between lake area and regional ET (d) during the summer from 1986 to 2022.
3.3.5. Ulan Ula Lake
Figure 13 indicates that, from 1986 to 2022, Ulan Ula Lake’s area did not display significant periodic patterns. However, from 2015 to 2022, it showed weak periodic features, with cycles ranging from 0 to 10 years. ET demonstrated notable periodic patterns from 2009 to 2014, with a cycle of 2–3 years, but lacked clear periodicity at other times. The cross-wavelet transform results reveal a notable positive phase connection between lake surface area and ET over a 0–8-year timescale. Additionally, partial horizontal right arrows between lake surface area and ET were mainly observed from 2016 to 2022, suggesting a considerable delay effect during this period. Furthermore, the wavelet coherence transform results indicate that, from 2013 to 2022, the primary resonance interval between lake surface area and ET was about 2–8 years, with coherence values exceeding 0.8 during these periods, reflecting a strong positive correlation.
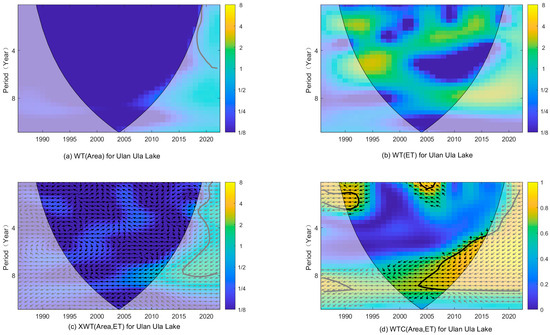
Figure 13.
Wavelet power spectra for Ulan Ula Lake area (a) and regional ET (b), cross-wavelet transform between lake area and regional ET (c), and wavelet coherence between lake area and regional ET (d) during the summer from 1986 to 2022.
4. Discussion and Conclusions
This study contributes to the critical understanding of the ecological dynamics on the Qinghai–Tibet Plateau, focusing on the area variations and ET relationships of five key lakes—Qinghai Lake, Hara Lake, Eling Lake, Gyaring Lake, and Ulan Ula Lake. Utilizing remote sensing data from Landsat satellites spanning 1986 to 2022, we provide a comprehensive analysis of the temporal and spatial changes in lake area and ET, which is essential for ecological conservation and sustainable development strategies.
In previous studies, the use of NDWI to extract the lake area of Qinghai Lake yielded good results [70], confirming the feasibility of using NDWI for lake extraction. In this paper, we further employed MNDWI to extract the lake area using the correlation coefficient between site observation data and satellite remote sensing data, validating the value of MNDWI in lake area extraction.
The analysis reveals distinct temporal patterns and sudden changes in lake areas and ET. Qinghai Lake, for instance, showed an upward trend in summer area with a significant mutation in 2020, mirrored by a corresponding ET change in 2021. Similar trends were observed in Hara and Eling Lakes, with mutations in 2014 and 2001, respectively. Notably, ET in these lakes showed significant changes in 2015 and 2021, potentially linked to climatic anomalies such as excessive rainfall. Gyaring Lake and Ulan Ula Lake also exhibited complex area trends with mutations in 2018 and 2013, respectively, suggesting a sensitivity to climatic variations and a need for further investigation.
The study identifies cyclic characteristics in the area and ET of the lakes, with significant correlations and lag effects. Qinghai Lake displayed weak cyclical patterns in terms of area from 2020 to 2022, contrasting with ET’s pronounced cyclic nature from 1986 to 2022. Hara Lake showed clear cyclic patterns in area and ET, indicating a strong positive phase relationship on a 4–16-year timescale. Eling Lake, Gyaring Lake, and Ulan Ula Lake also demonstrated significant cyclic traits, with key correlations observed during specific periods, highlighting the interconnectedness of lake area and ET.
The reliance on annual data, due to the extensive time span and challenges in obtaining continuous monthly data, presents limitations in terms of capturing the full spectrum of interannual variability. The study acknowledges these gaps and suggests that future research should incorporate monthly data to provide a more detailed and objective representation of the relationship between lake area and ET. Monthly data offer a more nuanced perspective on their interannual variability and contribute to the development of more effective ecological management and conservation strategies on the Qinghai–Tibet Plateau. The continued monitoring and analysis of these lakes will be essential in the face of ongoing climatic changes and anthropogenic impacts, ensuring the ecological integrity of this critical region.
Moreover, our research focuses on the process of evapotranspiration, which includes both the evaporation of surface water and the transpiration of vegetation. However, many studies have pointed out the contribution of land surface evaporation to global ET. Zhan et al. [71] believe that inter-annual changes in surface water area can lead to increased terrestrial evapotranspiration. They point out that improving the understanding of water area dynamics and its coupling with the atmosphere is crucial for reducing uncertainties in future global water budget estimates. Nichols et al. [72] considered groundwater evapotranspiration data and developed equations for estimating mean daily seasonal and annual groundwater evapotranspiration. They provided detailed estimates of summer, winter, and annual groundwater evapotranspiration for areas with different ranges of phreatophyte plant cover, refining the magnitude and distribution of groundwater evapotranspiration at a regional scale. Therefore, to ensure the rigor of the experiment, we will consider distinguishing and comparing surface water evaporation, land surface evaporation, and vegetation transpiration to obtain more meaningful research results.
Author Contributions
Conceptualization, S.M. and X.W. (Xinghuan Wu); methodology, Z.T.; software, Y.X.; validation, S.M., Z.T. and X.W. (Xinghuan Wu); formal analysis, Z.T.; investigation, X.W. (Xiaotian Wu); resources, S.M.; data curation, C.L.; writing—original draft preparation, Z.T.; writing—review and editing, Z.T.; visualization, C.L. All authors have read and agreed to the published version of the manuscript.
Funding
This research was funded by [the National Natural Science Foundation of China] grant number [42075114, 41705101], [Priority Academic Program Development of Jiangsu Higher Education Institutions] grant number [140119001], [General Project of Modern Agriculture from the Primary R&D Program of Xuzhou] grant number [KC21132]. And The APC was funded by [the National Science Foundation of China], and Fundamental Research Funds for the Central Universities under Grant 2021ZDPY0202.
Institutional Review Board Statement
Not applicable.
Informed Consent Statement
Not applicable.
Data Availability Statement
ERA5-Land data were downloaded from the ECMWF website (https://cds.climate.copernicus.eu/datasets/reanalysis-era5-land-monthly-means?tab=download, accessed on 10 October 2023), Landsat TM 4-5, Landsat 7 ETM+ SLC-off, and Landsat 8-9 OLI/TIRS C2 L2 were downloaded from the website of https://www.gscloud.cn/home (accessed on 10 October 2023) and https://earthexplorer.usgs.gov/ (accessed on 10 October 2023).
Conflicts of Interest
The authors declare no conflict of interest.
References
- Chen, J.; Gao, J.; Wang, Y.; Jin, L. Remote Sensing Measurement of Lake Changes on the Qinghai-Tibet Plateau. J. Mt. Sci. 2023, 41, 798. (In Chinese) [Google Scholar]
- Yu, H.; Wang, T. Application Research on Estimating Water Storage of Plateau Lakes Using Remote Sensing. Xinjiang Geol. 2024, 42, 170–173. (In Chinese) [Google Scholar]
- Miao, Q.; Liu, C.; Tan, X.; Liu, Z.; Gao, Y. Eutrophication assessment of nansi lake, China through remote sensing technology. In Proceedings of the 2009 ETP International Conference on Future Computer and Communication, Wuhan, China, 6–7 June 2009. [Google Scholar]
- Yan, L.; Zheng, M. Influence of climate change on saline lakes of the Tibet Plateau, 1973–2010. Geomorphology 2015, 246, 68–78. [Google Scholar] [CrossRef]
- Zhang, H.; Cao, Y.; Zhao, H. Temporal and Spatial Variation Dataset of Water Storage in Major Lakes of Qinghai Province (2018–2022). China Sci. Data (Chin. Engl. Online Ed.) 2024, 9, 319–332. (In Chinese) [Google Scholar]
- Hao, J.; Li, J.; Lian, Z.; Ni, M.; Zhang, Y.; Zhao, W.; Xin, R. Analysis of Area Change Patterns and Influencing Factors of Lakes on the Qinghai-Tibet Plateau. Hydrology 2024, 44, 112–118. (In Chinese) [Google Scholar]
- Zhao, X.; Wang, H.; Liu, L.; Zhang, Y.; Liu, J.; Qu, T.; Tian, H.; Lu, Y. A Method for Extracting Lake Water Using ViTenc-UNet: Taking Typical Lakes on the Qinghai-Tibet Plateau as Examples. Remote Sens. 2023, 15, 4047. [Google Scholar] [CrossRef]
- Tian, B.; Li, Z.; Zhang, M.; Huang, L.; Qiu, Y.; Li, Z.; Tang, P. Mapping thermokarst lakes on the Qinghai–Tibet Plateau using nonlocal active contours in Chinese GaoFen-2 multispectral imagery. IEEE J. Sel. Top. Appl. Earth Obs. Remote Sens. 2017, 10, 1687–1700. [Google Scholar] [CrossRef]
- Li, X.; Zhang, D.; Jiang, C.; Zhao, Y.; Li, H.; Lu, D.; Qin, K.; Chen, D.; Liu, Y.; Sun, Y.; et al. Comparison of lake area extraction algorithms in Qinghai Tibet plateau leveraging google earth engine and landsat-9 data. Remote Sens. 2022, 14, 4612. [Google Scholar] [CrossRef]
- Sha, T.; Yao, X.; Wang, Y.; Tian, Z. A Quick Detection of Lake Area Changes and Hazard Assessment in the Qinghai–Tibet Plateau Based on GEE: A Case Study of Tuosu Lake. Front. Earth Sci. 2022, 10, 934033. [Google Scholar] [CrossRef]
- Wan, W.; Xiao, P.; Feng, X.; Li, H.; Ma, R.; Duan, H.; Zhao, L. Monitoring lake changes of Qinghai-Tibetan Plateau over the past 30 years using satellite remote sensing data. Chin. Sci. Bull. 2014, 59, 1021–1035. [Google Scholar] [CrossRef]
- Ding, L.; Qin, Z.; Mao, K. Research on the Window Algorithm Based on MODIS Image Data and Its Parameter Determination. Remote Sens. Technol. Appl. 2005, 2, 284–289. (In Chinese) [Google Scholar]
- Ding, L.; Wu, H.; Wang, C.; Qin, Z.; Zhang, Q. Rapid Identification and Mapping of Lake Water Body Information from MODIS Images. Mar. Surv. 2006, 6, 31–34. (In Chinese) [Google Scholar]
- Ding, L.; Wu, H.; Wang, C.; Qin, Z.; Zhang, Q. Study on Water Body Extraction from MODIS Remote Sensing Images Based on Spectral Relationship. Surv. Spat. Geogr. Inf. 2006, 6, 25–27. (In Chinese) [Google Scholar]
- Wu, S.; Zhang, Q. Research on Water Body Extraction Methods and Models Based on MODIS Remote Sensing Data. Comput. Digit. Eng. 2005, 7, 1–4. (In Chinese) [Google Scholar]
- McCullough, I.M.; Loftin, C.S.; Sader, S.A. High-frequency remote monitoring of large lakes with MODIS 500 m imagery. Remote Sens. Environ. 2012, 124, 234–241. [Google Scholar] [CrossRef]
- Hu, C.; Lee, Z.; Ma, R.; Yu, K.; Li, D.; Shang, S. Moderate resolution imaging spectroradiometer (MODIS) observations of cyanobacteria blooms in Taihu Lake, China. J. Geophys. Res. Ocean. 2010, 115. [Google Scholar] [CrossRef]
- Liu, C.; Shi, J.; Liu, X.; Shi, Z.; Zhu, J. Subpixel mapping of surface water in the Tibetan Plateau with MODIS data. Remote Sens. 2020, 12, 1154. [Google Scholar] [CrossRef]
- Wang, X.; Gao, F.; Ma, M. Overview of Global Civil Land Imaging Satellites. Remote Sens. Technol. Appl. 2006, 6, 607–611. (In Chinese) [Google Scholar]
- Ma, M.; Wang, X.; Veroustraete, F.; Dong, L. Change in area of Ebinur Lake during the 1998–2005 period. Int. J. Remote Sens. 2007, 28, 5523–5533. [Google Scholar] [CrossRef]
- Ma, M.; Song, Y.; Wang, X. Remote Sensing Dynamic Monitoring of the Ruoqiang Lake Group in Xinjiang from 1973 to 2006. J. Glaciol. Geocryol. 2008, 2, 189–195. (In Chinese) [Google Scholar]
- Li, J.; Li, J.; Huang, S.; Zuo, C. Application of Terra/MODIS Time Series Data in Dynamic Monitoring of Lake Water Area: A Case Study of Dongting Lake Area. J. Nat. Resour. 2009, 24, 923–933. (In Chinese) [Google Scholar]
- Huang, S.; Li, J.; Xu, M. Water surface variations monitoring and flood hazard analysis in Dongting Lake area using long-term Terra/MODIS data time series. Nat. Hazards 2012, 62, 93–100. [Google Scholar] [CrossRef]
- Cao, M.; Mao, K.; Shen, X.; Xu, T.; Yan, Y.; Yuan, Z. Monitoring the spatial and temporal variations in the water surface and floating algal bloom areas in Dongting Lake using a long-term MODIS image time series. Remote Sens. 2020, 12, 3622. [Google Scholar] [CrossRef]
- Bian, D.; Bian, B.; La, B.; Wang, C.; Chen, T. Response of Surface Changes of Selinco Lake in Tibet to Climate Change from 1975 to 2008. Acta Geogr. Sin. 2010, 65, 313–319. (In Chinese) [Google Scholar]
- Du, J.; Bian, D.; Bao, J.; La, B.; Lu, H. Variation Characteristics of Evaporation from Evaporation Pans and Its Influencing Factors in the Northern Tibetan Plateau. Adv. Water Sci. 2008, 19, 786–791. (In Chinese) [Google Scholar]
- El-Asmar, H.M.; Hereher, M.E. Change detection of the coastal zone east of the Nile Delta using remote sensing. Environ. Earth Sci. 2011, 62, 769–777. [Google Scholar] [CrossRef]
- Elnmer, A.; Khadr, M.; Kanae, S.; Tawfik, A. Mapping daily and seasonally ET using remote sensing techniques over the Nile delta. Agric. Water Manag. 2019, 213, 682–692. [Google Scholar] [CrossRef]
- Youssef, Y.M.; Gemail, K.S.; Atia, H.M.; Mahdy, M. Insight into land cover dynamics and water challenges under anthropogenic and climatic changes in the eastern Nile Delta: Inference from remote sensing and GIS data. Sci. Total Environ. 2024, 913, 169690. [Google Scholar] [CrossRef] [PubMed]
- Elagouz, M.H.; Abou-Shleel, S.M.; Belal, A.A. Detection of land use/cover change in Egyptian Nile Delta using remote sensing. Egypt. J. Remote Sens. Space Sci. 2020, 23, 57–62. [Google Scholar] [CrossRef]
- Badreldin, N.; Hatab, A.A.; Lagerkvist, C. Spatiotemporal dynamics of urbanization and cropland in the Nile Delta of Egypt using machine learning and satellite big data: Implications for sustainable development. Environ. Monit. Assess. 2019, 191, 1–23. [Google Scholar] [CrossRef]
- Wang, Y.; Jing, C.; Bai, J.; Li, L.; Chen, X. Characteristics of Water and Carbon Fluxes during the Growing Season in Three Typical Ecosystems of the Arid Central Asia. Chin. J. Plant Ecol. 2014, 38, 795–808. (In Chinese) [Google Scholar]
- Meng, Q.; Gao, Z.; Wu, H.; Gen, J.; Fan, C.; Liu, J. Remote Sensing Monitoring and Driving Force Analysis of Lake Area Changes in Daihai over the Past 30 Years. Anhui Agric. Bull. 2021, 27, 106–108+124. (In Chinese) [Google Scholar]
- Besser, H.; Hamed, Y. Environmental impacts of land management on the sustainability of natural resources in Oriental Erg Tunisia, North Africa. Environ. Dev. Sustain. 2021, 23, 11677–11705. [Google Scholar] [CrossRef]
- Al-Hussein, A.A.M.; Khan, S.; Ncibi, K.; Hamdi, N.; Hamed, Y. Flood analysis using HEC-RAS and HEC-HMS: A case study of Khazir River (Middle East—Northern Iraq). Water 2022, 14, 3779. [Google Scholar] [CrossRef]
- Li, Y.; Chen, Y.; Feng, C.; Pang, L.; Pan, X. Analysis of Lake Area Change Patterns and Causes in the Huihe Nature Reserve from 1975 to 2010. J. Hebei Norm. Univ. (Nat. Sci. Ed.) 2015, 39, 173–179. (In Chinese) [Google Scholar]
- Chen, Q.; Wang, S.; Xiang, C.; Liu, H. Analysis of Lake Area Change and Its Climate Response of Aksai Chin Lake Based on GEE. J. Suzhou Univ. Sci. Technol. (Nat. Sci. Ed.) 2023, 40, 43–50. (In Chinese) [Google Scholar]
- Gao, Y.; A, L.; Tan, N.; Ao, R. Analysis of Lake Changes and Influencing Factors on the Mongolian Plateau from 2000 to 2020. Arid. Zone Geogr. 2023, 46, 191–200. (In Chinese) [Google Scholar]
- Dai, X.; Yang, X.; Wang, M.; Gao, Y.; Liu, S.; Zhang, J. The dynamic change of bosten lake area in response to climate in the past 30 years. Water 2019, 12, 4. [Google Scholar] [CrossRef]
- Cheng, Y.; Wang, J.; Yu, T.; Li, L. Analysis of Area Changes and Influencing Factors of Major Lakes in Gansu Province over the Past 30 Years. Plateau Meteorol. 2023, 42, 150–162. (In Chinese) [Google Scholar]
- Fu, J.; Wang, W.; Liu, B.; Lu, Y.; Xing, W.; Cao, M.; Zhu, S.; Guan, T.; Wei, J.; Chen, Z. Seasonal divergence of ET sensitivity to vegetation changes—A proportionality-hypothesis-based analytical solution. J. Hydrol. 2023, 617, 129055. [Google Scholar] [CrossRef]
- Policelli, F.; Hubbard, A.; Jung, H.C.; Zaitchik, B.; Ichoku, C. A predictive model for Lake Chad total surface water area using remotely sensed and modeled hydrological and meteorological param and multivariate regression analysis. J. Hydrol. 2019, 268, 1071–1080. [Google Scholar] [CrossRef]
- Zhao, G.; Li, Y.; Zhou, L.; Gao, H. Evaporative water loss of 1.42 million global lakes. Nat. Commun. 2022, 13, 3686. [Google Scholar] [CrossRef] [PubMed]
- Guo, Y.; Zhang, Y.; Ma, N.; Xu, J.; Zhang, T. Long-term changes in evaporation over Siling Co Lake on the Tibetan Plateau and its impact on recent rapid lake expansion. Atmos. Res. 2019, 216, 141–150. [Google Scholar] [CrossRef]
- Liu, X.; Yu, J.; Wang, P.; Zhang, Y.; Du, C. Lake evaporation in a hyper-arid environment, northwest of China—Measurement and estimation. Water 2016, 8, 527. [Google Scholar] [CrossRef]
- Rong, Y.; Su, H.; Zhang, R.; Duan, Z. Effects of climate variability on evaporation in Dongping Lake, China, during 2003–2010. Adv. Meteorol. 2013, 2013, 789290. [Google Scholar] [CrossRef]
- Hu, Z.; Tan, D.; Wen, X.; Chen, B.; Shen, D. Investigation of dynamic lake changes in Zhuonai Lake–Salt Lake Basin, Hoh Xil, using remote sensing images in response to climate change (1989–2018). J. Water Clim. Chang. 2021, 12, 2199–2216. [Google Scholar] [CrossRef]
- Zhao, G.; Gao, H.; Cai, X. Estimating lake temperature profile and evaporation losses by leveraging MODIS LST data. Remote Sens. Environ. 2020, 251, 112104. [Google Scholar] [CrossRef]
- Wang, W.; Zhao, X.; Zhou, H. Patterns and Causes of Changes in Surface Area and Water Level of Qinghai Lake over the Past Decade. Qinghai Sci. Technol. 2022, 29, 59–62. (In Chinese) [Google Scholar]
- Wang, R.; Liu, B.; Huang, B. Dynamic Changes in the Area of Hara Lake from 1986 to 2019 and Analysis of Its Causes. People’s Pearl River 2021, 42, 20–25+33. (In Chinese) [Google Scholar]
- Qu, Z.; Luo, M.; Zhao, Y.; Yang, S.; Han, L. Spatiotemporal Dynamics of Area and Shoreline Morphology of Large Natural Lakes in the Yellow River Basin. J. Appl. Ecol. 2023, 34, 1102–1108. (In Chinese) [Google Scholar]
- Cao, W.; Li, W.; Fu, S.; Zhao, L.; Wei, D. Characteristics of Water Environment in Regions of Gyaring and Eling Lakes near Waterhead of Yellow River. J. Earth Sci. 2001, 12, 137–141. [Google Scholar]
- Yan, Q.; Liao, J.; Shen, G. Remote Sensing Analysis and Hydrological Model Simulation of Ulan Ula Lake Changes over the Past 40 Years. Land Resour. Remote Sens. 2014, 26, 152–157. (In Chinese) [Google Scholar]
- Muñoz Sabater, J. ERA5-Land monthly averaged data from 1981 to present. Copernic. Clim. Chang. Serv. (C3S) Clim. Data Store (CDS) 2019, 10. [Google Scholar] [CrossRef]
- Foroumandi, E.; Nourani, V.; Sharghi, E. Climate change or regional human impacts? Remote sensing tools, artificial neural networks, and wavelet approaches aim to solve the problem. Hydrol. Res. 2021, 52, 176–195. [Google Scholar] [CrossRef]
- Zhao, W.; Xiong, D.; Wen, F.; Wang, X. Lake area monitoring based on land surface temperature in the Tibetan Plateau from 2000 to 2018. Environ. Res. Lett. 2020, 15, 084033. [Google Scholar] [CrossRef]
- Seka, A.M.; Zhang, J.; Ayele, G.T.; Demeke, Y.G.; Han, J.; Prodhan, F.A. Spatio-temporal analysis of water storage variation and temporal correlations in the East Africa lake basins. J. Hydrol. Reg. Stud. 2022, 41, 101094. [Google Scholar] [CrossRef]
- Tayyab, M.; Zhou, J.; Zeng, X.; Ahmed, I.; Adnan, R. Application of statistical nonparametric tests in dongting lake, China: 1961–2012. In Proceedings of the 2016 IEEE International Conference on Knowledge Engineering and Applications (ICKEA), Singapore, 28–30 September 2016; pp. 197–201. [Google Scholar]
- Nourani, V.; Mehr, A.D.; Azad, N. Trend analysis of hydroclimatological variables in Urmia lake basin using hybrid wavelet Mann–Kendall and Şen tests. Environ. Earth Sci. 2018, 77, 1–18. [Google Scholar] [CrossRef]
- Yu, W.; Fu, A.; Shao, L.; Liu, H.; Yao, X.; Chen, T.; Zhang, H. Characteristics of Climate Change in the Lake Basin Area of Gangcha County. Comput. Mater. Contin. 2022, 73, 364–379. [Google Scholar] [CrossRef]
- Yao, H.; James, A.; McConnell, C.; Turnbull, B. Relative contributions of stream concentration, stream discharge and shoreline load to base cation trends in Red Chalk and Harp lakes, south-central Ontario, Canada. Hydrol. Process. 2016, 30, 858–872. [Google Scholar] [CrossRef]
- Liu, Q.; Hao, Y.; Stebler, E.; Tanaka, N.; Zou, C.B. Impact of plant functional types on coherence between precipitation and soil moisture: A wavelet analysis. Geophys. Res. Lett. 2017, 44, 12197–12207. [Google Scholar] [CrossRef]
- Han, Q.; Zhou, L.; Sun, W.; Wang, G.; Shrestha, S.; Xue, B.; Li, Z. Assessing alterations of water level due to environmental water allocation at multiple temporal scales and its impact on water quality in Baiyangdian Lake, China. Environ. Res. 2022, 212, 113366. [Google Scholar] [CrossRef] [PubMed]
- Amantai, N.; Ding, J. Analysis on the spatio-temporal changes of LST and its influencing factors based on VIC model in the arid region from 1960 to 2017: An example of the Ebinur Lake Watershed, Xinjiang, China. Remote Sens. 2021, 13, 4867. [Google Scholar] [CrossRef]
- Foroumandi, E.; Nourani, V.; Dąbrowska, D.; Kantoush, S.A. Linking spatial–temporal changes of vegetation cover with hydroclimatological variables in terrestrial environments with a focus on the lake Urmia Basin. Land 2022, 11, 115. [Google Scholar] [CrossRef]
- Cengiz, T. Periodic structures of great lakes levels using wavelet analysis. J. Hydrol. Hydromech. 2011, 59, 24–35. [Google Scholar] [CrossRef][Green Version]
- Nourani, V.; Ghasemzade, M.; Mehr, A.D.; Sharghi, E. Investigating the effect of hydroclimatological variables on Urmia Lake water level using wavelet coherence measure. J. Water Clim. Chang. 2019, 10, 13–29. [Google Scholar] [CrossRef]
- Lei, X.; Gao, L.; Ma, M.; Dang, H.; Gao, J. Spatiotemporal Distribution and Non-stationarity Characteristics of Extreme Precipitation in the Poyang Lake Basin. J. Appl. Ecol. 2021, 32, 3277–3287. (In Chinese) [Google Scholar]
- Zhang, S.; Wang, Y.; Hou, Q.; Dong, X.; Sun, K. Spatiotemporal Variation Characteristics of Drought Index in Qinghai Province and Its Relationship with Climate Indices. Pratacult. Sci. 2015, 32, 1980–1987. (In Chinese) [Google Scholar]
- Ling, X.; Tang, Z.; Gao, J.; Li, C.; Liu, W. Changes in Qinghai Lake Area and Their Interactions with Climatic Factors. Remote Sens. 2023, 16, 129. [Google Scholar] [CrossRef]
- Zhan, S.; Song, C.; Wang, J.; Sheng, Y.; Quan, J. A global assessment of terrestrial evapotranspiration increase due to surface water area change. Earth’s Future 2019, 7, 266–282. [Google Scholar] [CrossRef]
- Nichols, W.D. Regional Ground-Water Evapotranspiration and Ground-Water Budgets, Great Basin, Nevada; US Geological Survey: Reston, VA, USA, 2000. [Google Scholar]
Disclaimer/Publisher’s Note: The statements, opinions and data contained in all publications are solely those of the individual author(s) and contributor(s) and not of MDPI and/or the editor(s). MDPI and/or the editor(s) disclaim responsibility for any injury to people or property resulting from any ideas, methods, instructions or products referred to in the content. |
© 2024 by the authors. Licensee MDPI, Basel, Switzerland. This article is an open access article distributed under the terms and conditions of the Creative Commons Attribution (CC BY) license (https://creativecommons.org/licenses/by/4.0/).