Article

Remote Sensing-Based Drought Monitoring in Iran’s Sistan and Balouchestan Province

1
Department of Geography, Yazd University, Yazd 891581841, Iran
2
Institute for Atmospheric Sciences, Weather and Climate, Department of Physics, University of Iceland and Icelandic Meteorological Office (IMO), Bustadavegur 7, IS-108 Reykjavik, Iceland
*
Authors to whom correspondence should be addressed.
Atmosphere 2024, 15(10), 1211; https://doi.org/10.3390/atmos15101211
Submission received: 29 July 2024 / Revised: 5 October 2024 / Accepted: 7 October 2024 / Published: 10 October 2024
(This article belongs to the Section Meteorology)

Abstract

:
Drought is a natural phenomenon that has adverse effects on agriculture, the economy, and human well-being. The primary objective of this research was to comprehensively understand the drought conditions in Sistan and Balouchestan Province from 2002 to 2017 from two perspectives: vegetation cover and hydrology. To achieve this goal, the study utilized MODIS satellite data in the first part to monitor vegetation cover as an indicator of agricultural drought. In the second part, GRACE satellite data were employed to analyze changes in groundwater resources as an indicator of hydrological drought. To assess vegetation drought, four indices were used: Vegetation Health Index (VHI), Vegetation Drought Index (VDI), Visible Infrared Drought Index (VSDI), and Temperature Vegetation Drought Index (TVDI). To validate vegetation drought indices, they were compared with Global Land Data Assimilation System (GLDAS) precipitation data. The vegetation indices showed a strong, statistically significant correlation with GLDAS precipitation data in most regions of the province. Among all indices, the VHI showed the highest correlation with precipitation (moderate (0.3–0.7) in 51.7% and strong (≥0.7) in 45.82% of lands). The output of vegetation indices revealed that the study province has experienced widespread drought in recent years. The results showed that the southern and central regions of the province have faced more severe drought classes. In the second part of this research, hydrological drought monitoring was conducted in fifty third-order sub-basins located within the study province using the Total Water Storage (TWS) deficit, Drought Severity, and Total Storage Deficit Index (TSDI Index). Annual average calculations of the TWS deficit over the period from April 2012 to 2016 indicated a substantial depletion of groundwater reserves in the province, amounting to a cumulative loss of 12.2 km3 Analysis results indicate that drought severity continuously increased in all study basins until the end of the study period. Studies have shown that all the studied basins are facing severe and prolonged water scarcity. Among the 50 studied basins, the Rahmatabad basin, located in the semi-arid northern regions of the province, has experienced the most severe drought. This basin has experienced five drought events, particularly one lasting 89 consecutive months and causing a reduction of more than 665.99 km3. of water in month 1, placing it in a critical condition. On the other hand, the Niskoofan Chabahar basin, located in the tropical southern part of the province near the Sea of Oman, has experienced the lowest reduction in water volume with 10 drought events and a decrease of approximately 111.214 km3. in month 1. However, even this basin has not been spared from prolonged droughts. Analysis of drought index graphs across different severity classes confirmed that all watersheds experienced drought conditions, particularly in the later years of this period. Data analysis revealed a severe water crisis in the province. Urgent and coordinated actions are needed to address this challenge. Transitioning to drought-resistant crops, enhancing irrigation efficiency, and securing water rights are essential steps towards a sustainable future.

1. Introduction

Drought is one of the natural disasters that does great harm to human beings [1,2,3], and its recurring and long-lasting nature causes serious environmental [4,5], social [6], and economic disasters worldwide [2,7,8]. With global warming, economic losses due to drought amount to billions of dollars and affect more than two billion people every year [9,10,11,12], which is far more than the losses caused by other natural disasters. The Iranian economy depends on agriculture. Nearly 32% of Iranian crops come from the 60% rainfed farmlands’ share of the total cultivated farmland [13]. Existing studies indicate that reduced rainfall during the past two decades has caused several droughts. In recent years, due to the rapid development of the local economy and the fragile ecological environment, extreme weather has occurred frequently, leading to noticeable warming and drying of the climate. They forecast a 5–40% decrease in the area under cultivation for grains in rainfed farms. Droughts fall into four categories: meteorological absence of precipitation [14], hydrological (HD) (absence of surface runoffs [15,16]), agricultural (AD) (reduced soil moisture [17,18]), and socioeconomic (reduction in income and public prosperity) [19,20]. The phenomenon harms the carbon cycle [21], underground water resources [22,23,24,25,26], gross national product (GDP) [27], crops [28], and livestock [22]. Existing research used different indicators, such as the standardized precipitation evapotranspiration index (SPEI) and the standardized precipitation index SPI [29].
The Sistan and Balouchestan Province in Iran is grappling with a worsening drought crisis. Its arid climate and erratic rainfall patterns make it particularly vulnerable to extreme weather events. The frequency and severity of droughts in the region have escalated dramatically, adversely affecting agriculture, the economy, and the livelihoods of its inhabitants. Understanding the patterns of these droughts is essential for developing effective strategies to mitigate their impacts on agricultural production and disaster management. Traditional drought monitoring methods have limitations, but advancements in remote sensing technology offer promising solutions to these challenges. It is important to remember that the World Meteorological Organization (WMO) recommends at least 30 years of data for accurate drought monitoring. However, the study area faces challenges due to limited long-term data and its vast size, which can compromise the reliability of drought assessments. Despite these limitations, research has shown that even with shorter-term data, it is possible to conduct meaningful drought monitoring. In fact, this study found that a 10–20-year timeframe can be acceptable for certain regions, enabling countries that started collecting weather data between 2002 and 2012 to assess droughts.
Furthermore, the studied province faces additional challenges due to its vast size, which makes it difficult to collect accurate and consistent data across the entire region [30,31,32].
The significant distance between meteorological stations and the scarcity of long-term data in this province have posed significant challenges to accurate drought monitoring using traditional methods. Consequently, remote sensing has emerged as a complementary, and even alternative, approach to station-based data, particularly in areas with limited station access [33]. In this context, numerous remote sensing-based drought indices have been developed to reflect drought conditions. One of the most widely used vegetation cover indices is the Normalized Difference Vegetation Index (NDVI) [34]. In 1995, Kogan introduced the Vegetation Condition Index (VCI). This index is derived by normalizing NDVI values to the maximum range for a specific region [35]. “Therefore, normalization was successfully able to minimize the ecosystem component”. The VCI has been extensively employed for drought monitoring and analysis within operational frameworks [36]. The Vegetation Health Index (VHI), a composite index derived from the VCI and the Temperature Condition Index (TCI), effectively captures the combined effects of vegetation cover and land surface temperature in drought monitoring. The VHI effectively captures the stress experienced by vegetation under rising temperatures and can accurately identify drought misclassifications arising from excessive moisture conditions [37]. The VHI has been extensively evaluated for its effectiveness in drought monitoring and assessment across various regions of Iran. These evaluations have been documented in numerous studies, including: in the Kashan region [38], in Isfahan Province [39], in Markazi Province [39], in Tuyserkan, in Hamedan [40], and in Sirjan [41]. The researchers consistently affirmed the remarkable accuracy of the VHI in monitoring agricultural droughts. The researchers further acknowledged the significant contribution of remote sensing-based drought monitoring indices, such as the VHI, in aiding environmental planners in effectively monitoring agricultural droughts. The rapid evolution of thermal remote sensing technologies has revolutionized the field of crop water stress assessment, leading to the development of increasingly sophisticated indices, such as the Vegetation Drought Index (VDI). The VDI has been widely accepted as a reliable indicator for assessing crop water stress [42,43,44,45,46]. Numerous studies conducted in diverse regions, including Costa Rica [47], Central Asia [48], Jordan, Montana (USA) [49], Iran [50], Eastern Botswana (Southern Africa) [51], and Brazil [52], have consistently validated the index’s effectiveness in detecting and monitoring crop water stress.
The Vegetation Temperature Dryness Index (TVDI) emerged as a pioneering remote sensing technique, first proposed by Sandholt et al., in 2002. The studies cited in [53,54,55] employed the Vegetation Temperature Dryness Index (TVDI) and the Vegetation Dryness Index (VDI) to develop suitable methods for identifying water stress in semi-arid regions of Iran. In addition to the significance of monitoring vegetation drought in Sistan and Balouchestan Province, the assessment of hydrological drought in this region is of immense value. The definition and development of Total Water Storage (TWS)-based drought indices necessitate the establishment of a comprehensive network of spatially distributed hydrological, snow gauging, meteorological, synoptic, and observational well stations to acquire continuous, comprehensive, and long-term soil moisture and groundwater observations. The establishment and maintenance of such a network entail substantial financial costs [47]. Remote sensing, with its inherent capabilities, has addressed some of these challenges, as exemplified by the Gravity Recovery and Climate Experiment (GRACE) (Gravity Recovery and Climate Experiment) satellite and its meteorological observations. Thomas et al. proposed an extensively applicable methodology for hydrological drought monitoring utilizing GRACE satellite gravity data and demonstrated its effectiveness, particularly in data-scarce basins [56]. Zhang et al. and Almamalachy et al. employed this approach for drought monitoring in watersheds in China and Iraq, respectively, achieving promising results. Accordingly, in this research, combined drought indexes are employed to investigate the spatiotemporal variations in meteorological and agricultural droughts and analyze the association between them [57,58]. Accordingly, in this research, combined drought indices are employed to investigate the spatiotemporal variations in meteorological and agricultural droughts and analyze the association between them. This study has been conducted to specify the spatiotemporal characteristics of agricultural, and hydrological droughts on the annual scales over the period of 2002–2017 in a large study area using the agricultural and hydrological drought indices.
Finally, based on the optimized drought indices, the spatiotemporal variation characteristics of drought in Sistan Province from 2002 to 2017 were analyzed.

2. Materials and Methods

2.1. Overview of the Study Area

The region known as Sistan and Balouchestan Province covers a vast area of 181,785 square kilometers, making it the largest province in Iran, located in the southeastern part of the country. Its geographical expanse extends over a considerable 5° of latitude. This province encompasses 50 third-order drainage basins, as illustrated in Figure 1. Positioned at lower latitudes, this province encounters a warm and arid climate, with the dominance of the subtropical high-pressure system persisting for more than half of the year.

2.2. Data Sources and Research Methods

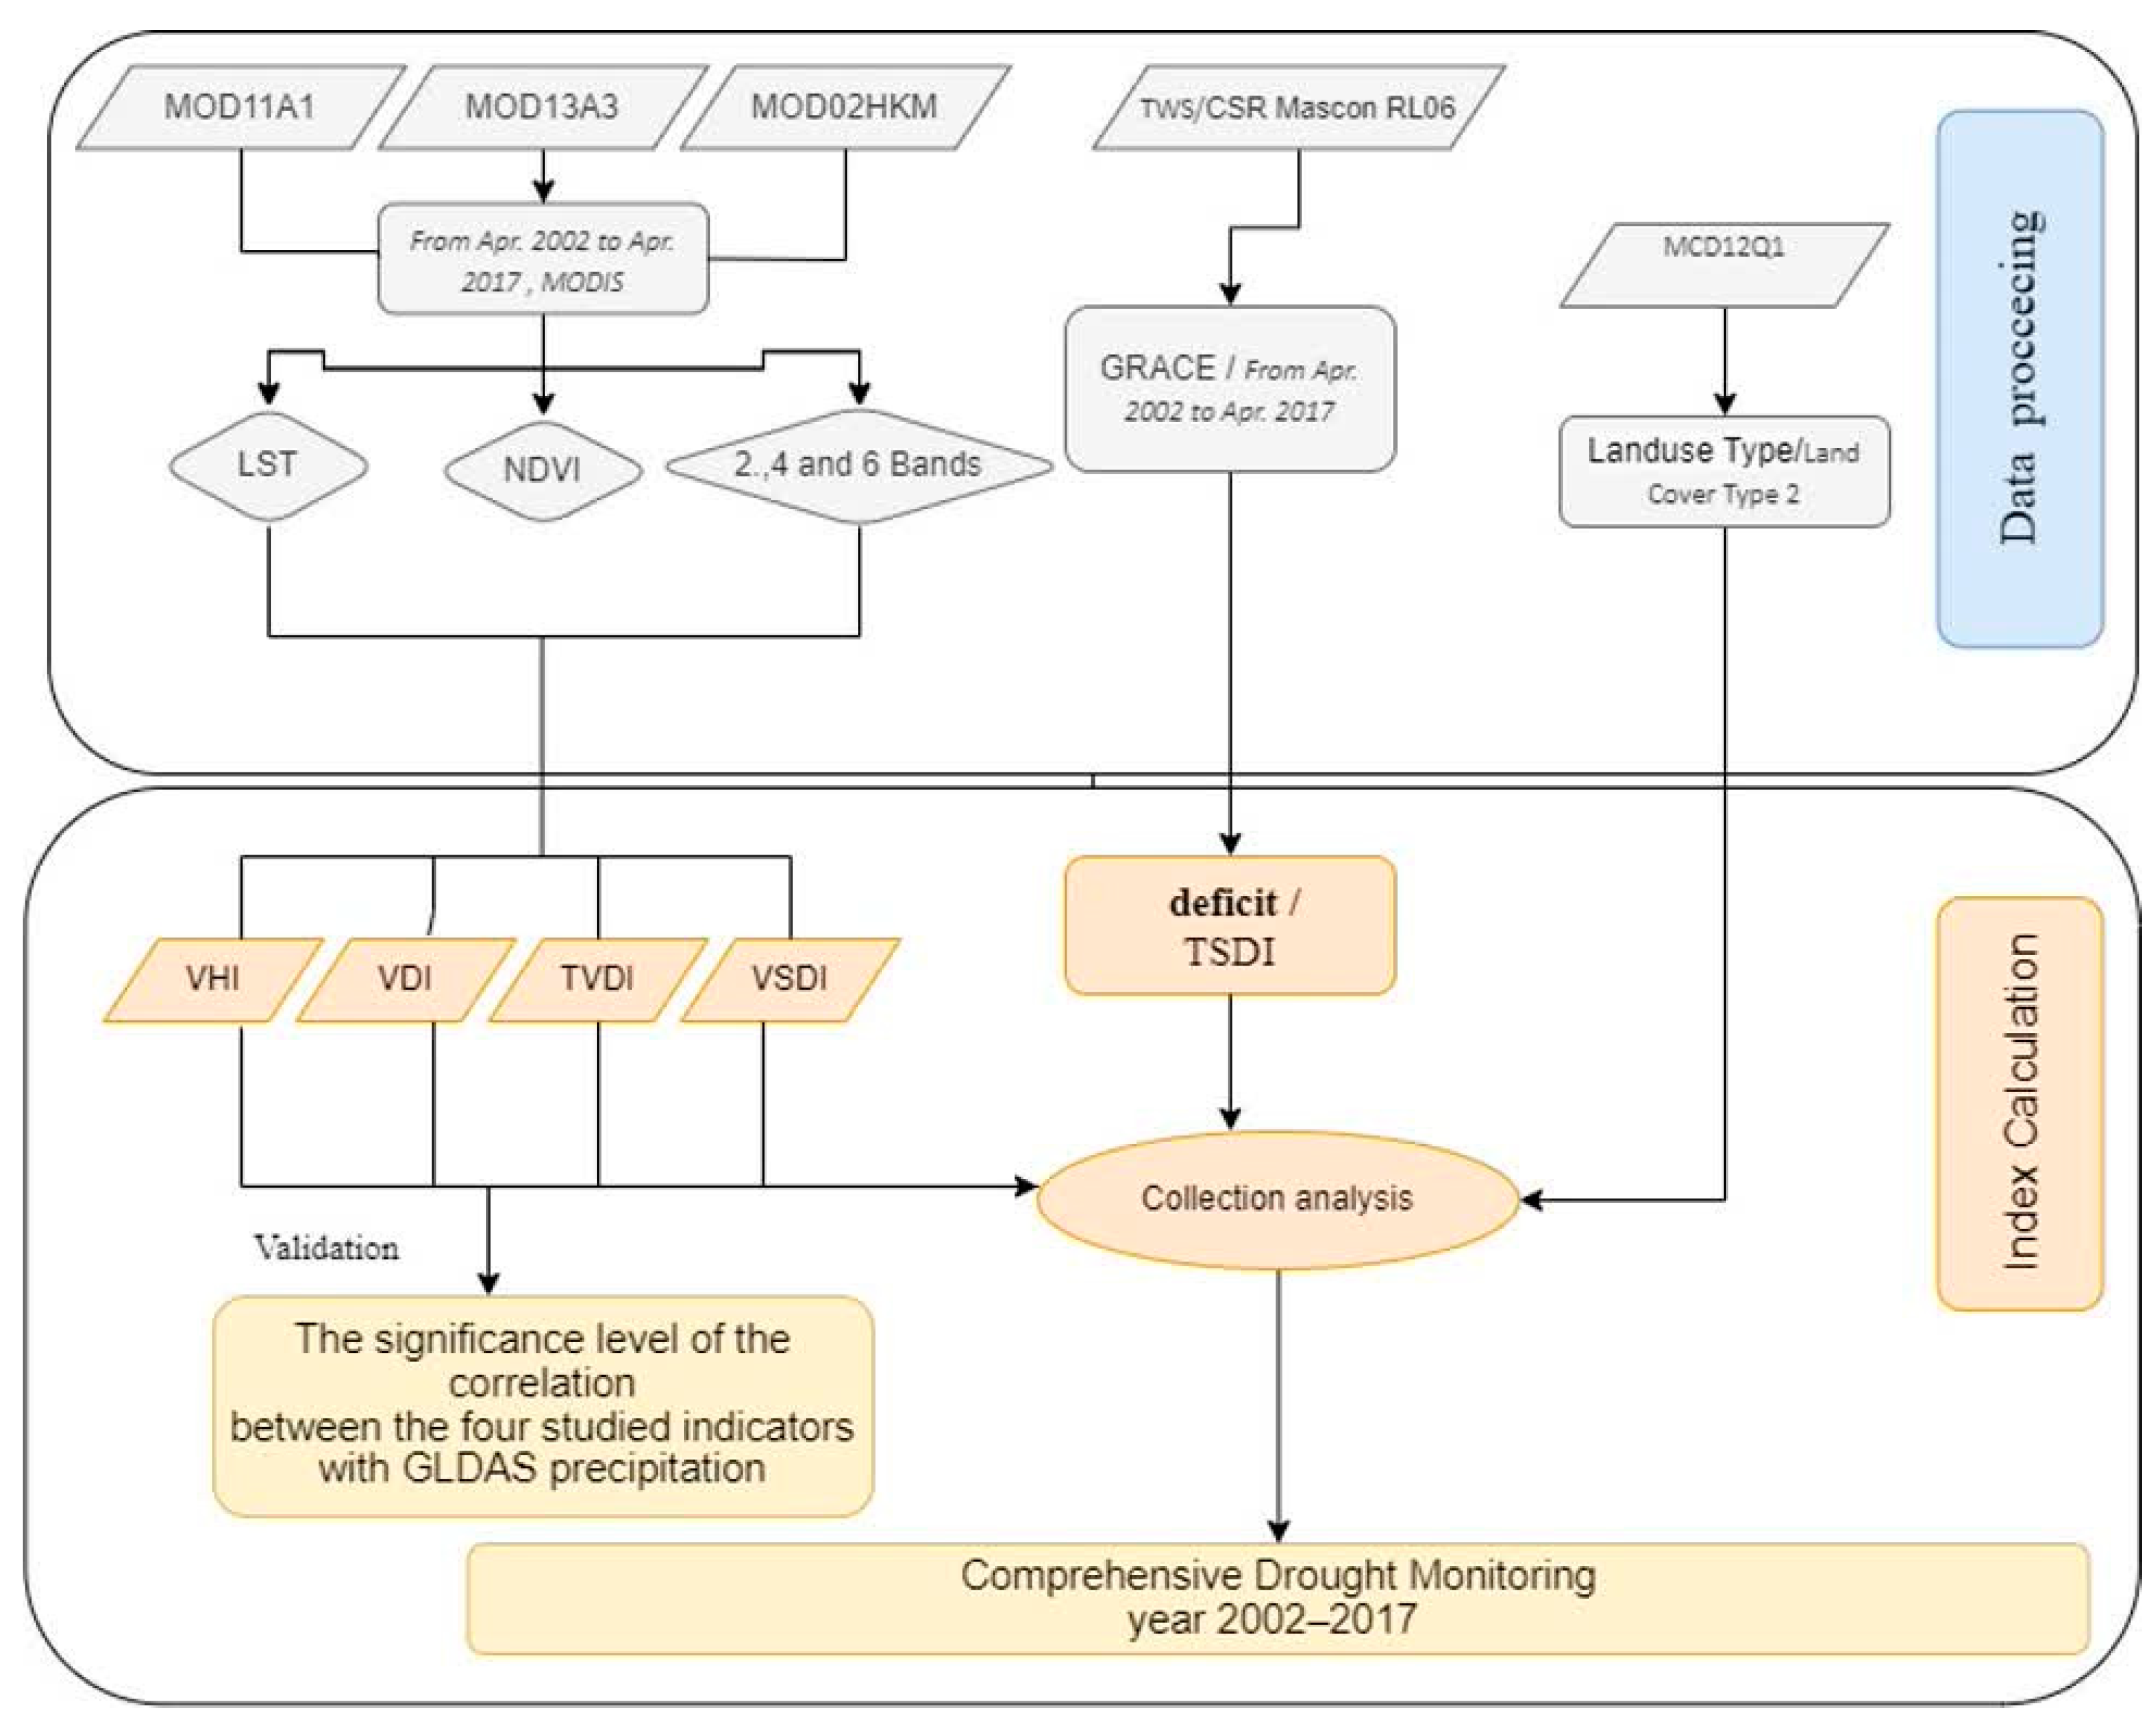
This article mainly applies RS and GIS technologies, based on MODIS digital data and GLDAS data, to analyze the spatiotemporal pattern of drought in the study area under the premise of model verification. The technology roadmap is shown below in Figure 2:

2.2.1. Data Sources

The study employs vegetation index and surface temperature data from the MODIS sensor aboard the Terra satellite to calculate VHI, VDI, VSDI, and TVDI, respectively. (https://ladsweb.modaps.eosdis.nasa.gov (accessed on 1 April 2023)). Daily time resolution Level 1B MOD02HKM data were utilized to assess the surface temperature (LST) and Normalized Difference Vegetation Index (NDVI). LST was extracted from the Terra Moderate Resolution Imaging Spectroradiometer (MODIS) Land Surface Temperature/Emissivity Daily (MOD11A1), while NDVI was derived from the Terra Moderate Resolution Imaging Spectroradiometer (MODIS) Vegetation Indices (MOD13A3). (https://ladsweb.modaps.eosdis.nasa.gov (accessed on 1 April 2023)). [38]. To ensure data consistency, resampling and averaging techniques were employed to harmonize the spatial and temporal resolutions of the satellite imagery, thereby preparing the data for subsequent integrated analysis [41].
The study examined the relationship between rainfall and four vegetation indices: VHI, VDI, VSDI, and TVDI. Precipitation data were acquired from the Global Land Data Assimilation System (GLDAS): Noah land surface model version 1 monthly data with a 0.25 × 0.25 degree spatial resolution. To align the spatial resolutions, the four indices were resampled to match the precipitation data. Subsequently, Pearson correlation coefficients were calculated spatially over each pixel to assess the correlation between rainfall and the vegetation indices [59].
In the second part of this article, we utilized the most recent Level 2, Release-06 GRACE-Tellus mascon data with a spatial resolution of 1 km by 1 km. The data, formatted in NETCDF, were obtained from the GRACE-Tellus website and are named “RL06_Mascons_all-corrections_v02 (3).NETCDF”. This dataset, which includes all corrections and is provided in the latest release, was essential. A description of the relevant data is shown in Table 1:
April is the peak month for plant growth in Sistan and Balouchestan, a region with an arid climate. Phenological analysis and satellite vegetation indices (NDVI) confirmed the maximum plant activity and growth during this time. In order to isolate vegetative areas, the MCD12Q1 product was utilized. The product is provided annually at a spatial resolution of 0.05 degrees. The land cover dataset of 2002 was used and the University of Maryland (UMD) type 2 classification scheme was chosen following Ahmadalipour et al. [60]. For masking purposes, all vegetation classes were combined together and isolated from other non-vegetated classes (e.g., urban areas).

2.2.2. Research Methods

(1)
Vegetation Health Index
Kogan proposed VHI, a vegetation index that relies on NDVI and temperature as its main components. It is important to mention that VHI is based on the assumption that the relation between vegetation and temperature is negative, that is, vegetation experiences stress when the temperatures is high. One of the merits of VHI is the ability to detect the false drought signals that may arise from excessive moisture conditions [2,29].
NDVI = NIR + RED NIR RED
VCI i = NDVI i NDVI min NDVI max NDVI min
LST = LST day LST night 2
TCI = LST max LST i LST max LST min
V H I = α 1 × V C I i + α 2 × Δ T C I i
V C I i = N D V I i N D V I m i n N D V I m a x N D V I m i n   For each grid cell, NDVIi represents the value of the ith month, where i ranges from 1 to 16 months (April). N D V I m a x ,   N D V I m i n . The maximum and minimum NDVI values for each pixel across all months are determined (Equation (1)). L S T m a x , L S T m i n . The minimum and maximum land surface temperatures within a specified time period are calculated. Equation (4) provides the temperature as the land surface temperature (LST) for daytime and nighttime separately. The formulation V C I i is the index of the vegetation status and TCI is the index of the temperature status (Equations (4) and (5)) [61].
(2)
Vegetation Drought Index
Estimating the Vegetation Drought Index (VDI) requires the computation of two sub-indices: the Water Condition Index (WCI) and the Delta Temperature Condition Index (∆TCI). Both WCI and ∆TCI exhibit a positive correlation with drought conditions. The Vegetation Drought Index (VDI) is a comprehensive indicator of vegetation health that incorporates two sub-indices: the Water Condition Index (WCI) and the Delta Temperature Condition Index (∆TCI). Temperature is provided as the land surface temperature (LST) for daytime and nighttime separately. Both WCI and ∆TCI exhibit a positive correlation with drought conditions, meaning that higher values reflect favorable conditions and lower values indicate unfavorable conditions [46,62,63].
NDWI = N I R + S W I R N I R S W I R
W C I i = N D W I i N D W I m i n N D W I m a x N D W I m i n
L S T = L S T D a y L S T N i g h t
T C I = Δ L S T m a x L S T i Δ L S T m a x Δ L S T m i n
VDI = α 1 × W C I i +   α 2 × Δ T C I i
For each grid cell, NDWIi represents the value of the ith month, where i ranges from 1 to 16 months. N D W I m a x , N D W I m i n : the maximum and minimum NDWI for a pixel in all months (Equations (6) and (7)). L S T m a x , L S T m i n : the minimum and maximum temperature of the Earth’s surface are known for a period of time, and the lower the TCI value, the warmer the climate, and vice versa (Equations (8) and (9)) [62].
(3)
Visible and Shortwave Infrared Drought Index
VSDI was proposed as an agricultural drought-monitoring index where its validity was tested for Oklahoma. VSDI employs the SWIR, Red, and Blue bands in order to monitor drought. It was found that SWIR is the most sensitive band to water content variation in vegetation, followed by the Red band, while the Blue band was found to be the least sensitive to the vegetation moisture content [64].
VSDI = 1 − ((SW IR − Blue) + (Red − Blue))
(4)
Temperature and Vegetation Dryness Index
In their study of soil moisture, in 2002, Sandholt found a number of contours in the characteristic space of the normalized vegetation index and the surface temperature, based on which the TVDI was proposed. The defining equation is [54,65].
TVDI = L S T L S T m i n L S T m a x L S T m i n
L S T m i n = a 1 + b 1 × N V D I  
L S T m a x = a 2 + b 2 × N V D I  
Equation (12) defines L S T N D V I as the land surface temperature (LST) corresponding to each pixel in the image. L S T max N D V I and L S T min N D V I , represent the maximum and minimum LST values, respectively, corresponding to each pixel. These extrema are referred to as the dry and wet edges. a 1 ,   b 1 and a 2 ,   b 2 are the fitting coefficients for dry and wet edges. TVDI has a value between 0 and 1; a smaller TVDI value indicates a more humid region, while a larger value indicates a drier region.

2.3. Hydrological Drought

(1)
Drought Deficit
This study adopts a similar approach to that of Thomas [56]. However, the calculation of the deficit in Equation (3) differs slightly from their method. While Thomas et al. defined the deficit as the negative difference between the monthly TWSA and its long-term mean, in this study, months with negative TWSA values are considered deficit months. In other words, the definition of deficit in this study focuses on the first term, as shown in Equation (15) [58]. It is calculated as the average deficit fraction from the start of the drought to the current month, multiplied by the number of months from the start of the drought event to the end of the event. This definition can also be expressed in a cumulative form [56,66].
Deficit ( i ) = TWSA   ( i ) Where   TWSA < 0
(2)
Drought Severity
Severity is defined as the combined effect of deficit magnitude and its persistence. The severity for month I is calculated as the mean deficit from the onset of a drought to the ith month multiplied by the number of months from the onset of the drought event to the ith month. The aforementioned definition can also be expressed as the cumulative deficit from the onset of a drought event to the specified month. Equation (16) expresses severity mathematically [56,66].
S e v e r i t y i = 1 i D i f i c i t i
where i represents the position of the month being calculated relative to drought onset. Severity is then measured in (km3/month). The total severity of a drought event is the severity at the final month before the drought’s termination.
(3)
Total Storage Deficit Index
The Total Storage Deficit Index (TSDI) serves as an effective tool for quantifying groundwater storage variations, leveraging total water storage change (TWS) data derived from the GRACE satellite. The TSDI effectively serves as a long-term indicator of drought and wetness conditions. The calculation of the TSDI index begins with the cumulative determination of total water storage deficit (TSD). Swenson’s Equation (17) is used to calculate the monthly TSD values [67].
T S D i j = T W S I i j M   T W S I j M   T W S I j M i n   T W S I j × 100
where TSDi,j and TWSAi,j are the total storage deficit (%) and TWSA, respectively, in the jth month of year i (2002–2017) and MTWSAj, MinTWSAj and MaxTWSAj are the long-term mean, minimum, and maximum TWSA of the jth month, respectively. By using Equation (17), the seasonal variation in TWS is removed so that the value of the TSD can be compared between different seasons. Second, the TSDI should be calculated based on the TSD values. The original method for computation of the TSDI introduced by Yirdaw is inconvenient to apply on a global scale. Moreover, the critical parameter (named C by [68], which symbolizes the TSDI value for a period of dryness) was obtained from the drought monograph [69] or determined by the aid of another drought indicator, e.g., the SPI, in different regions, and there is no uniform criteria to define the drought monograph [70]. Hence, in order to establish a convenient, globally applicable drought index dataset, in this study, the TSDI is simply computed by standardizing the values of the TSD as follows [71]:
T S D I = T S D i j μ σ
where μ and σ are, respectively, the average value and standard deviation of the TSD. The TSDI values for all the grids range from −3 to +3, representing extremely dry to extremely wet conditions. Because the TSDI values were standardized between −3 and +3, they can be spatially comparable between different hydro-climatic regions (arid or humid) [72]. (Table 2).
(4)
Other methods
The Pearson correlation coefficient is widely used to measure the degree of correlation between two variables. In order to test the drought-monitoring ability of different remote sensing indices, the correlation index R between the four indices and GLDAS data is analyzed, which represents the difference ratio between the different indices and the Pearson correlation coefficient, reflecting the dispersion degree of the drought index itself [74,75]. Overall, the correlation analysis between drought indices can help to identify which indices are most effective in monitoring drought conditions, and can provide valuable information for drought management and mitigation efforts.

3. Results

3.1. Validation of Integrated Drought Monitoring Models

3.1.1. Correlation Analysis

(1)
Spatial distribution patterns of drought indices
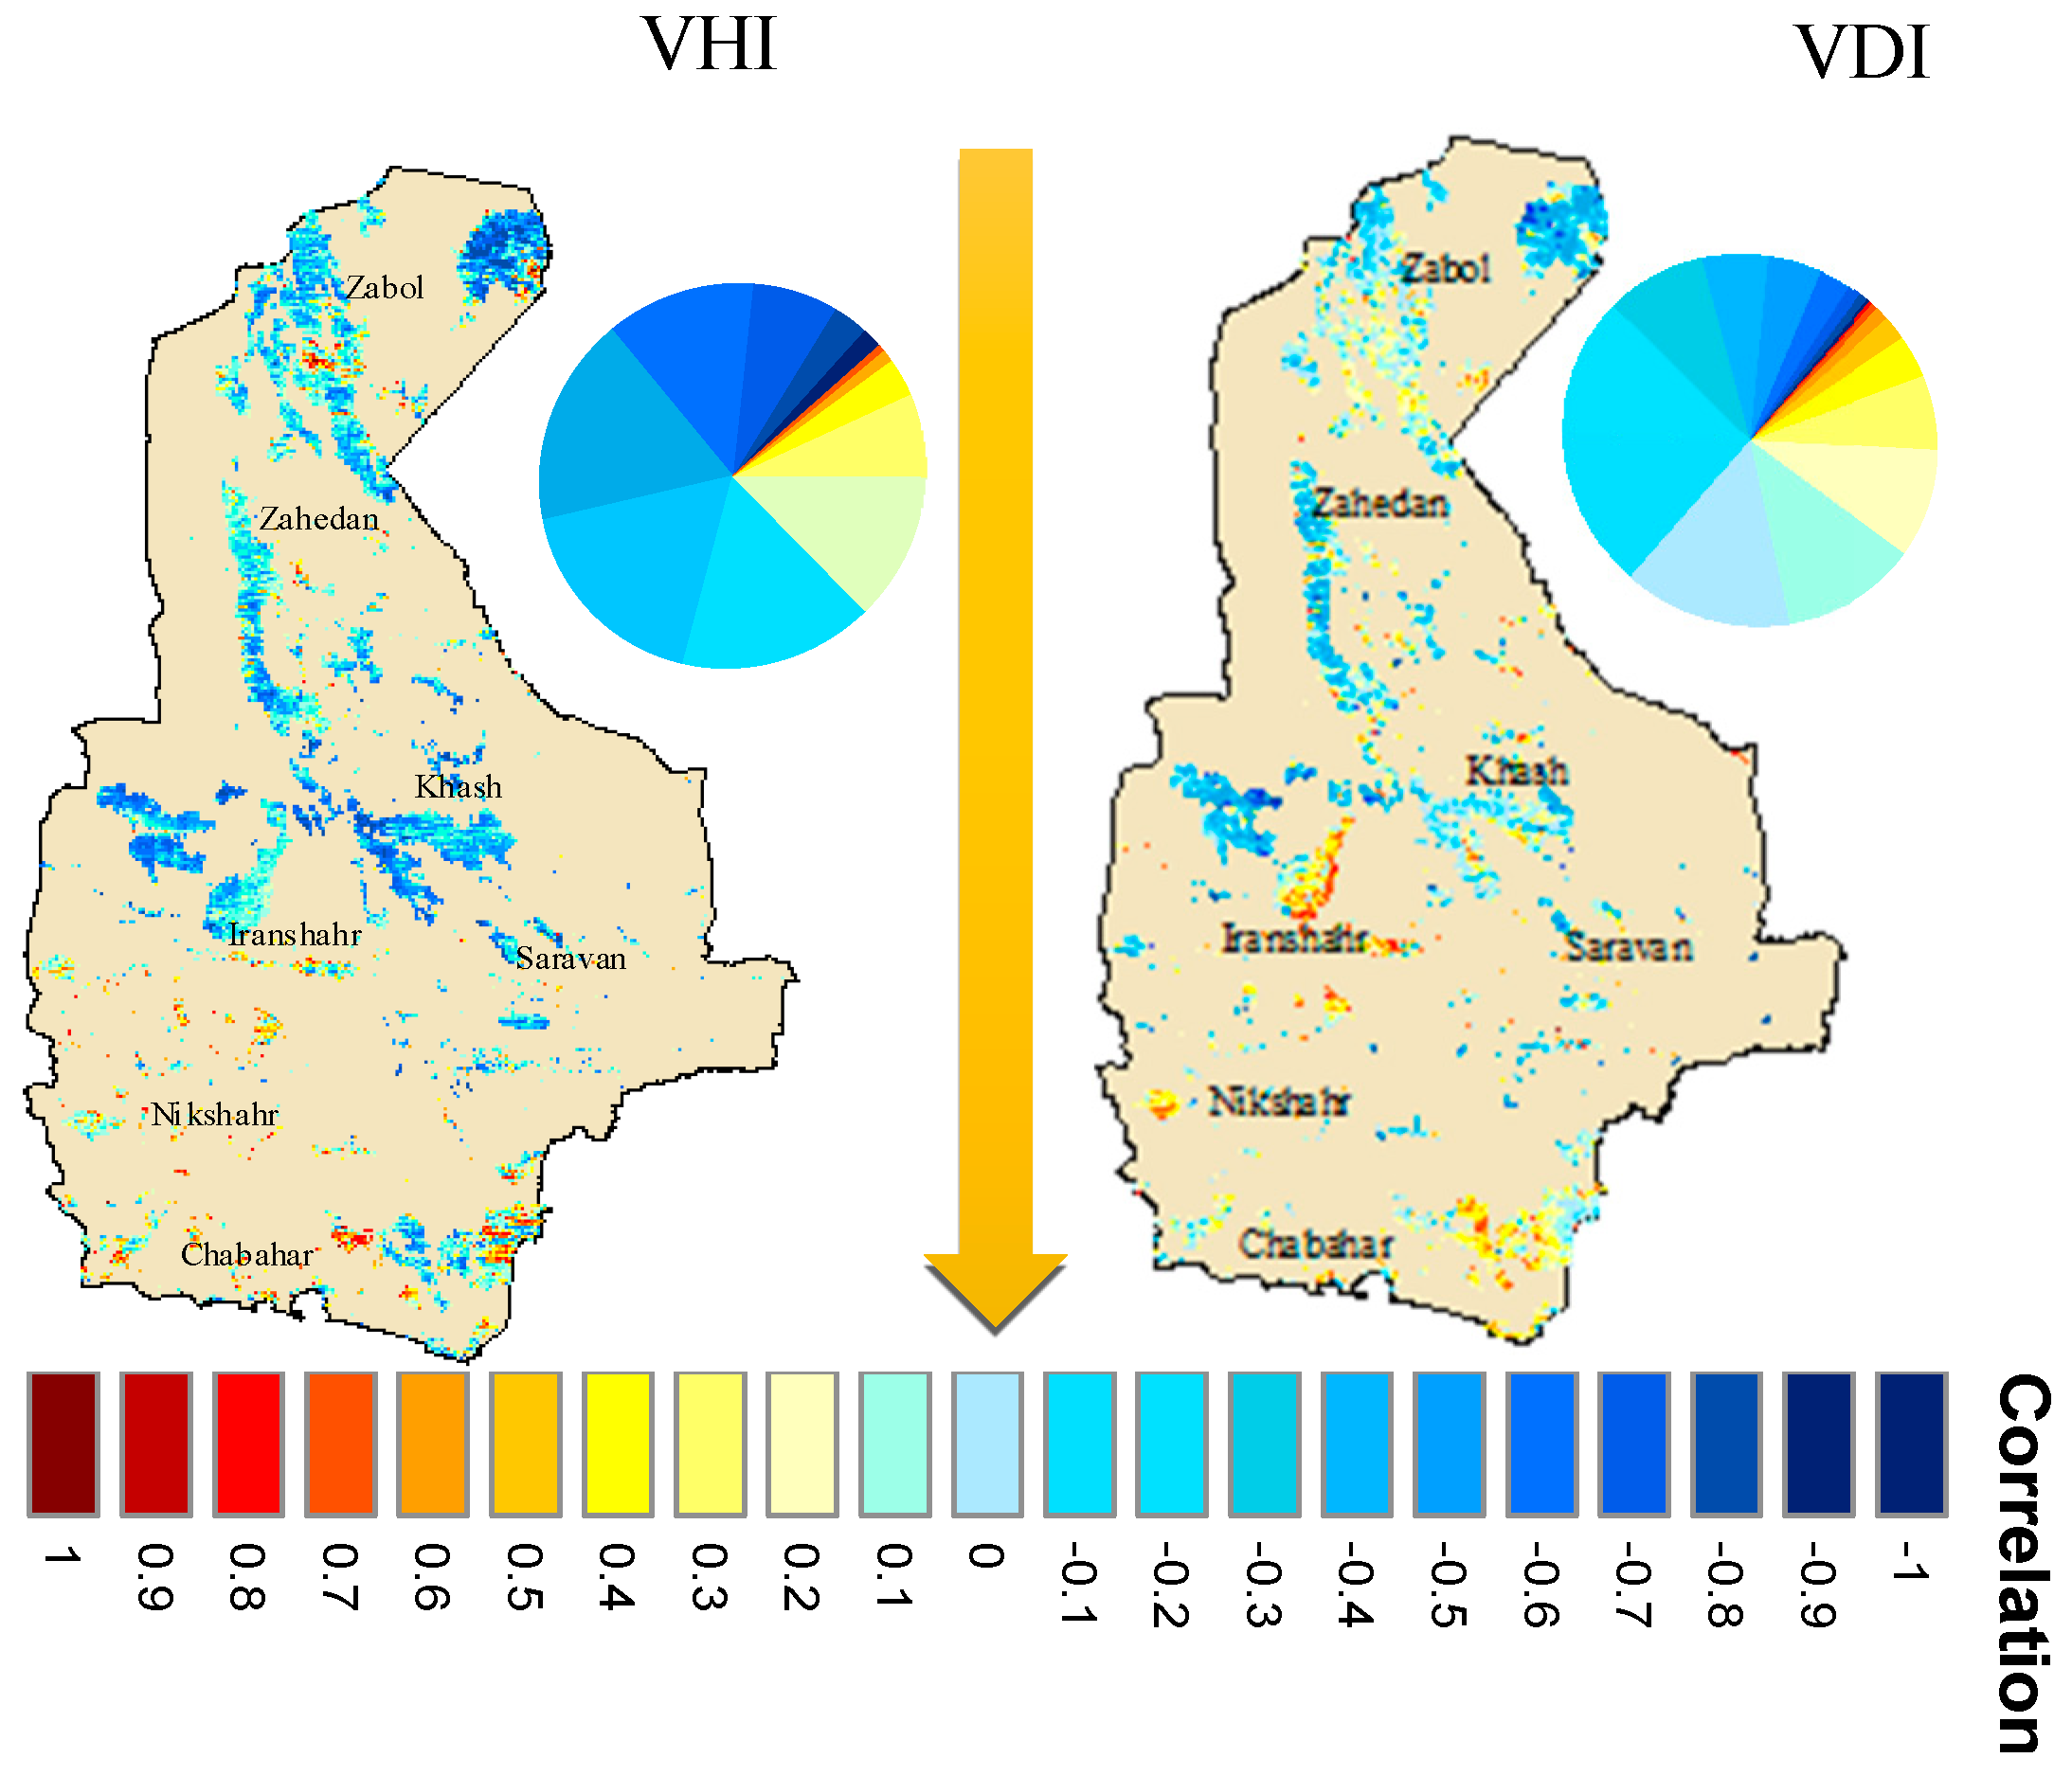
The assumptions of the VHI and VDI indices are assessed through the calculation of the Pearson correlation coefficient among their respective components. It has been previously noted that the VHI posits a negative correlation between NDVI and LST, while the VDI suggests a negative association between NDWI and ∆LST [62]. In cases where a positive correlation is identified within the research area, it is anticipated that this may lead to uncertainties in the drought findings. To address this issue, correlation analysis is performed for specific time periods: the growing season and the entire duration of the study period (Figure 3). Figure 3 illustrates a negative correlation exceeding 80.23% among the components of the VHI index. This notable negative correlation plays a crucial role in reducing uncertainty in drought monitoring. Within the study area, a mere 19.88% positive correlation was identified, possibly linked to the vegetation type and agricultural irrigation methods. The VDI index postulates a negative association between NDVI and LST. Any positive correlation detected in the study area may introduce uncertainty into the findings, particularly regarding drought implications [62]. To validate the outcomes in the study area, an evaluation of the correlation between the computed Normalized Difference Water Index (NDWI) and the Daytime Land Surface Temperature Difference (∆LST) was conducted. Figure 3 vividly displays a notably strong negative correlation between NDWI and the alternate variable (R− = 75.5%, R+ = 24.5%).
(2)
Validation of result by GLDAS
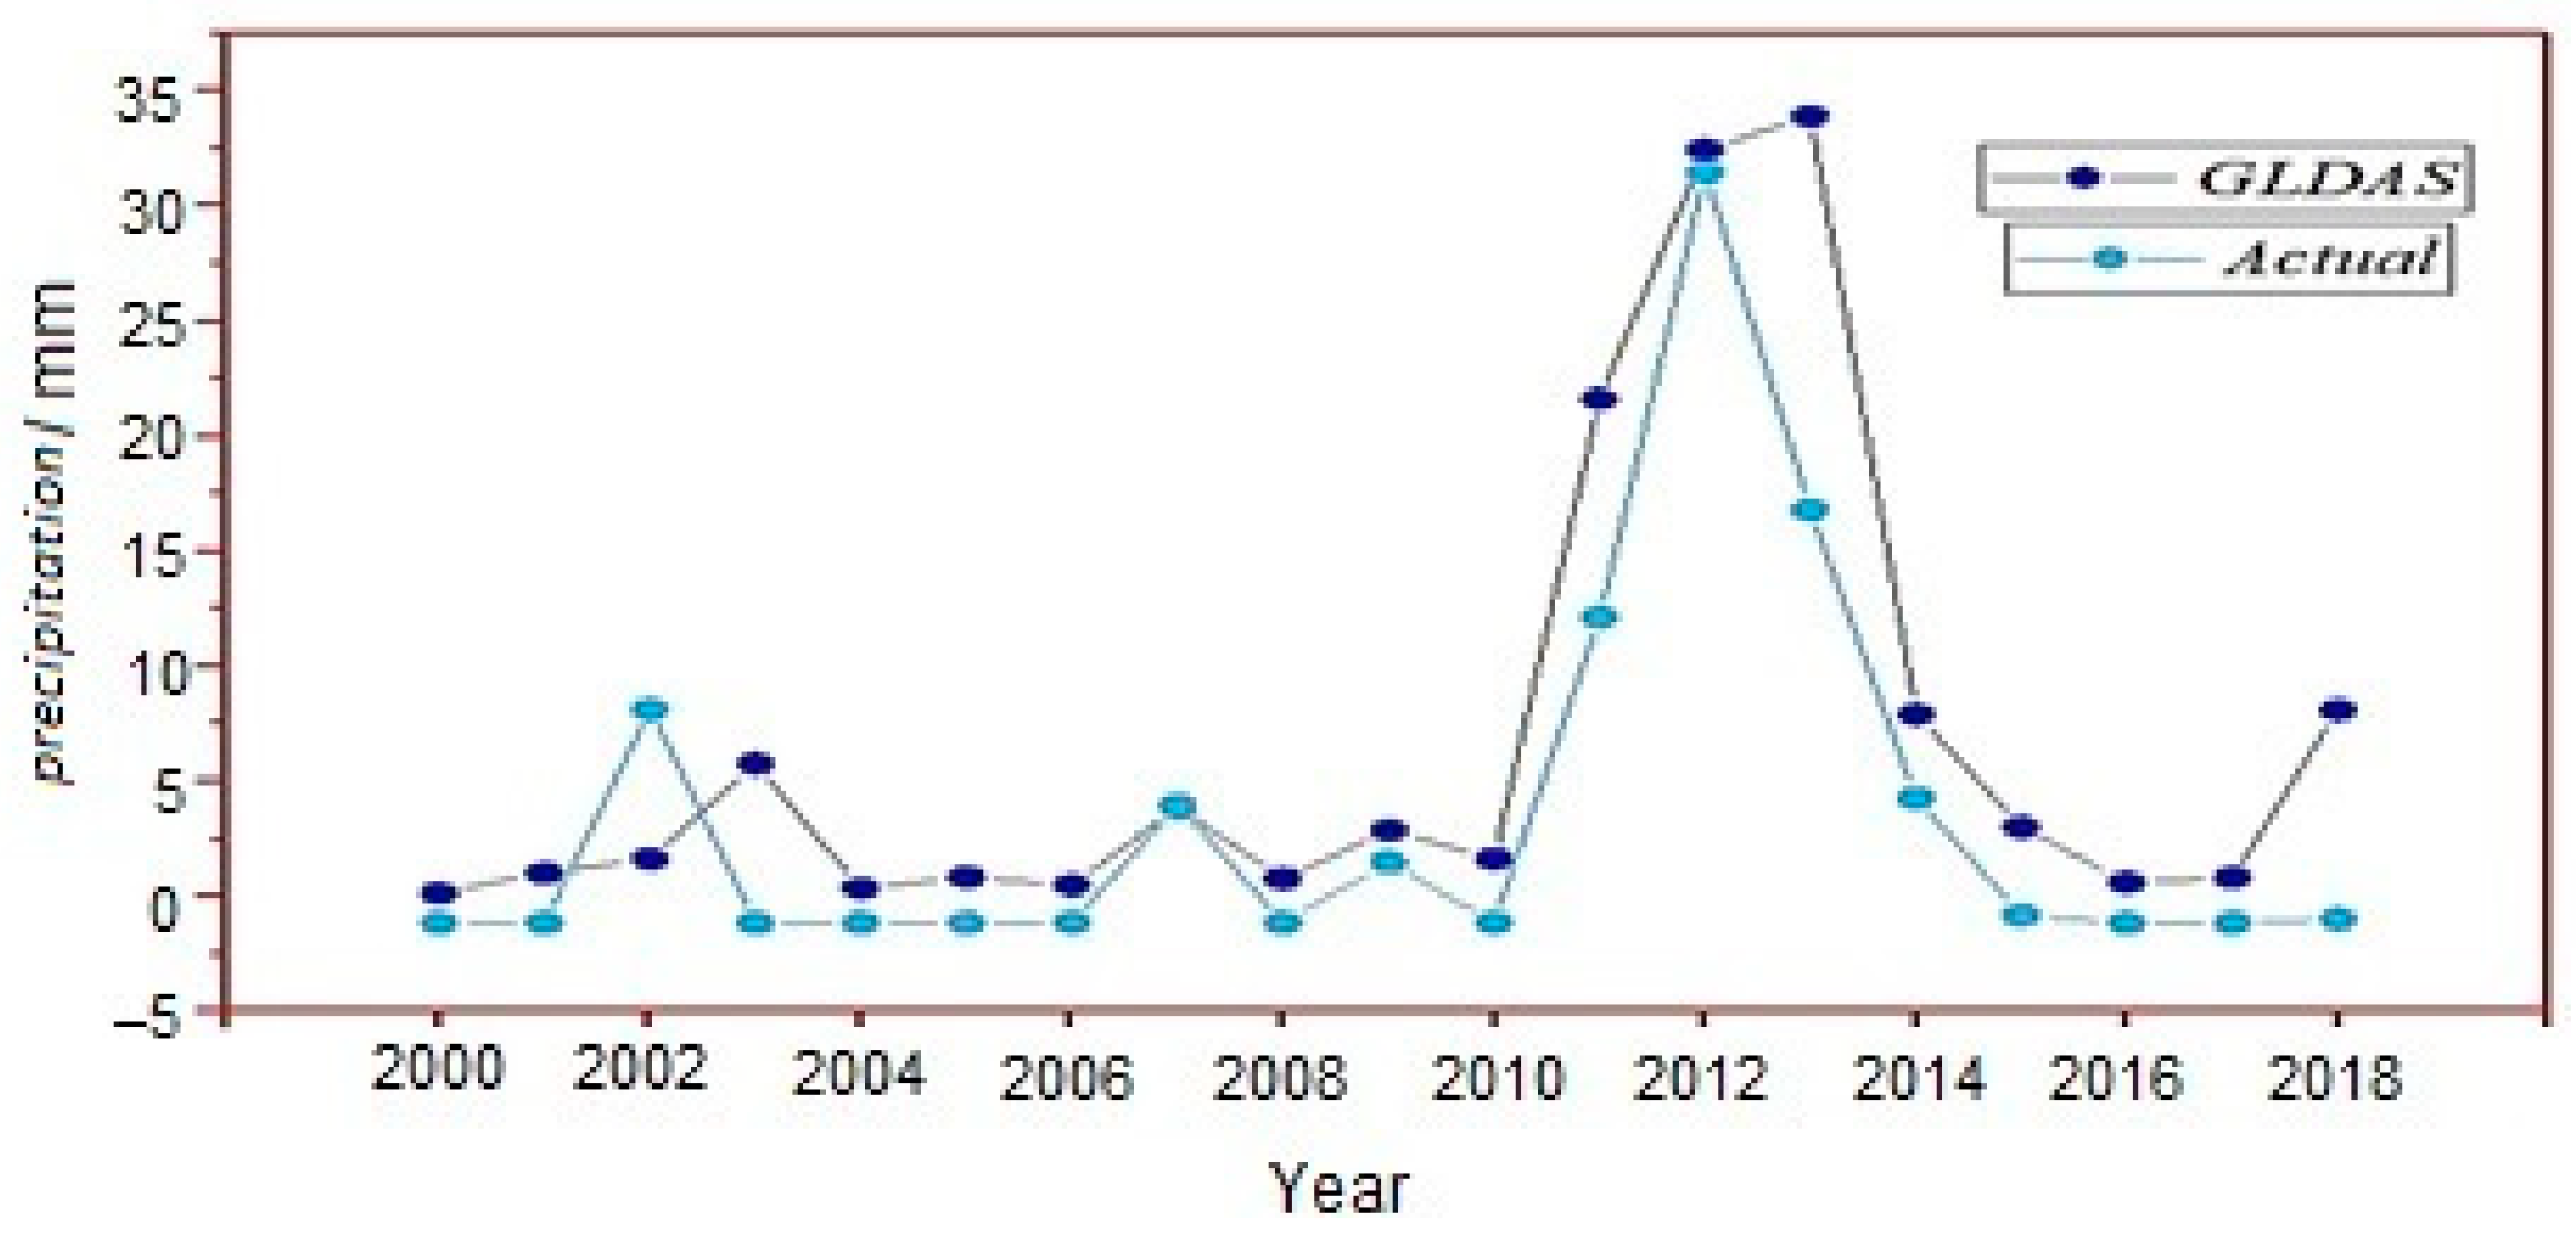
To evaluate the accuracy of the four remote sensing drought indices, a Pearson correlation analysis was conducted between the indices derived from GLDAS data (Figure 3), and pixel-by-pixel Pearson correlation was used to assess the relationship between the two datasets. To streamline the discussion, a single case study was presented, comparing the accuracy of GLDAS precipitation data with data from the Iran Shahr synoptic station (Figure 4). GLDAS precipitation data for a specific location near Iran Shahr were obtained from the NASA website. Visual inspection revealed a strong correlation between the station precipitation data and the GLDAS model precipitation data. The statistical characteristics of these variables are further illustrated in the accompanying figure. The obtained level of significance (below 0.05) confirms the reliability of the GLDAS model in the region. Therefore, this study used the GLDAS model for the evaluation of the various indices. Moreover, numerous prior studies have attested to the exceptional performance of this model.
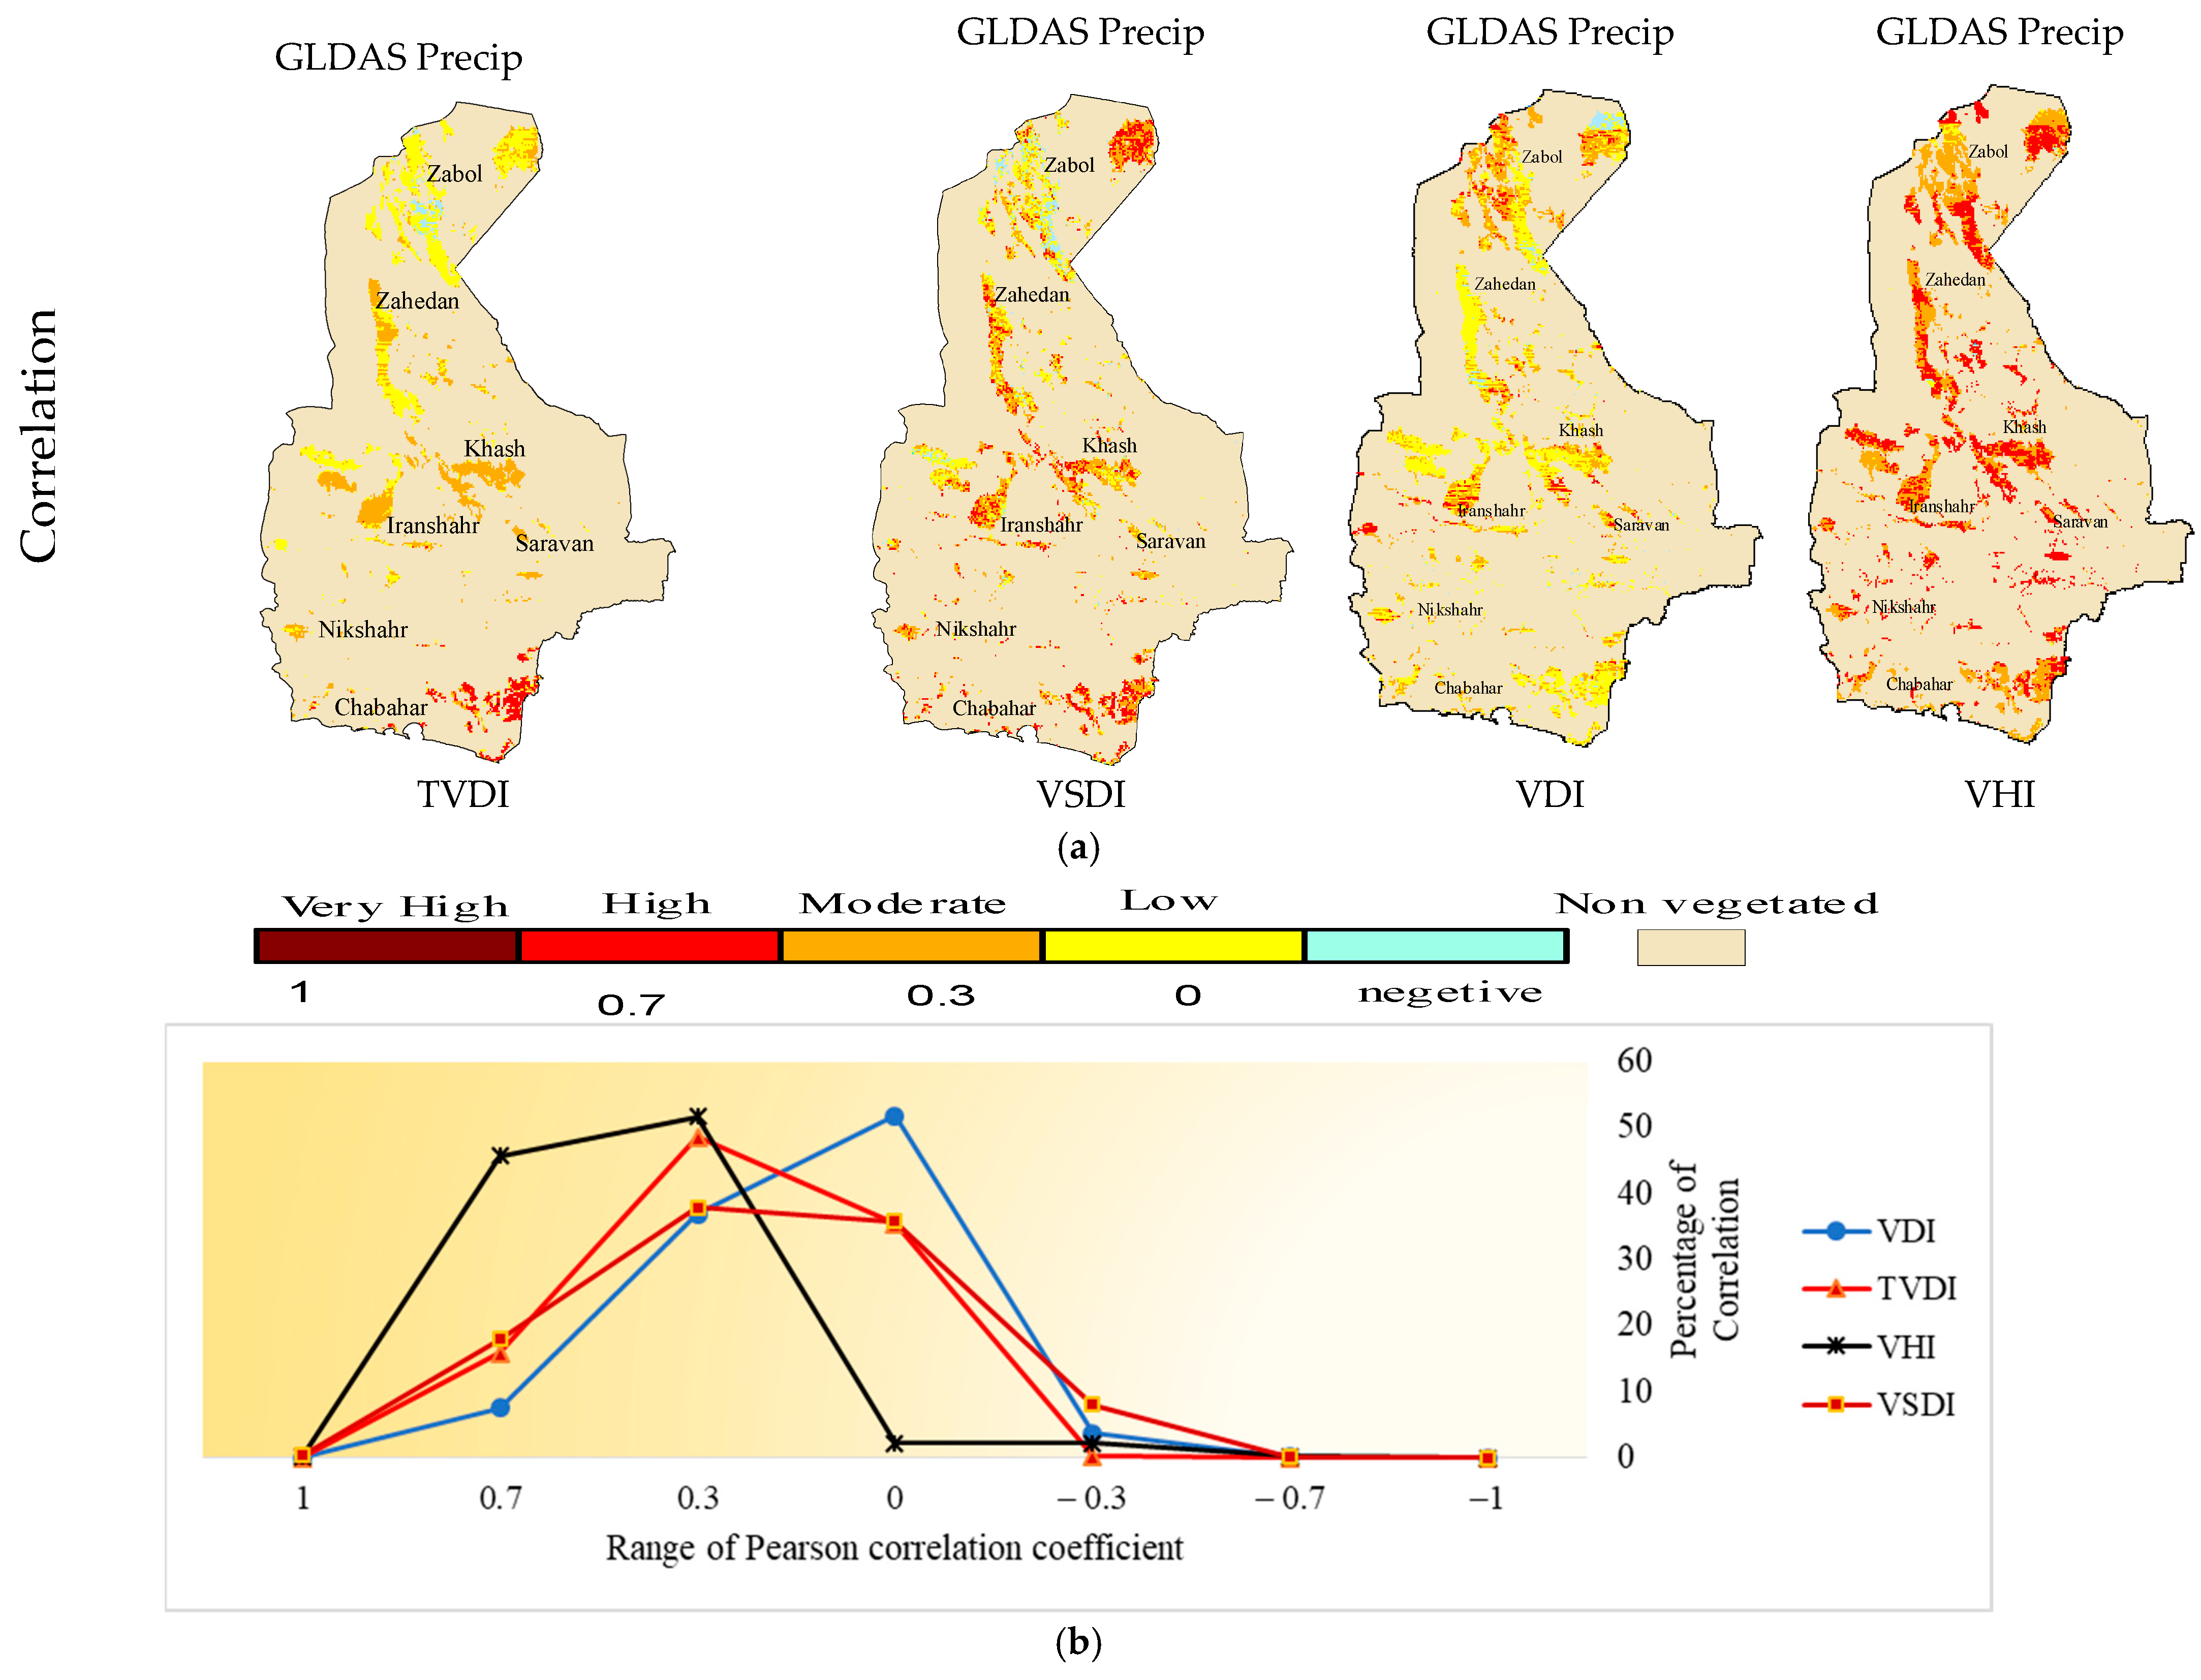
To assess the sensitivity of the drought indices under investigation, the correlation coefficient between the concurrent outputs of the indices and precipitation was calculated. An analysis of the correlation between the VHI, VDI, VSDI, and TVDI indices and April precipitation revealed a simultaneous effect of precipitation on vegetation cover. Figure 5 illustrates that the most pronounced concurrent impact of precipitation on vegetation cover occurred in April for the VHI and VSDI indices, indicating a rapid response of these indices to precipitation during that month. To determine the statistical significance of these correlations, p-values were computed on a pixel-by-pixel basis. By averaging the p-values for all four indices, it was found that regions within the province exhibiting strong correlations displayed the highest level of confidence, with all p-values being less than 0.05.
Figure 5 clearly demonstrates a strong correlation between the indices and precipitation.
(3)
Verifying Drought Events
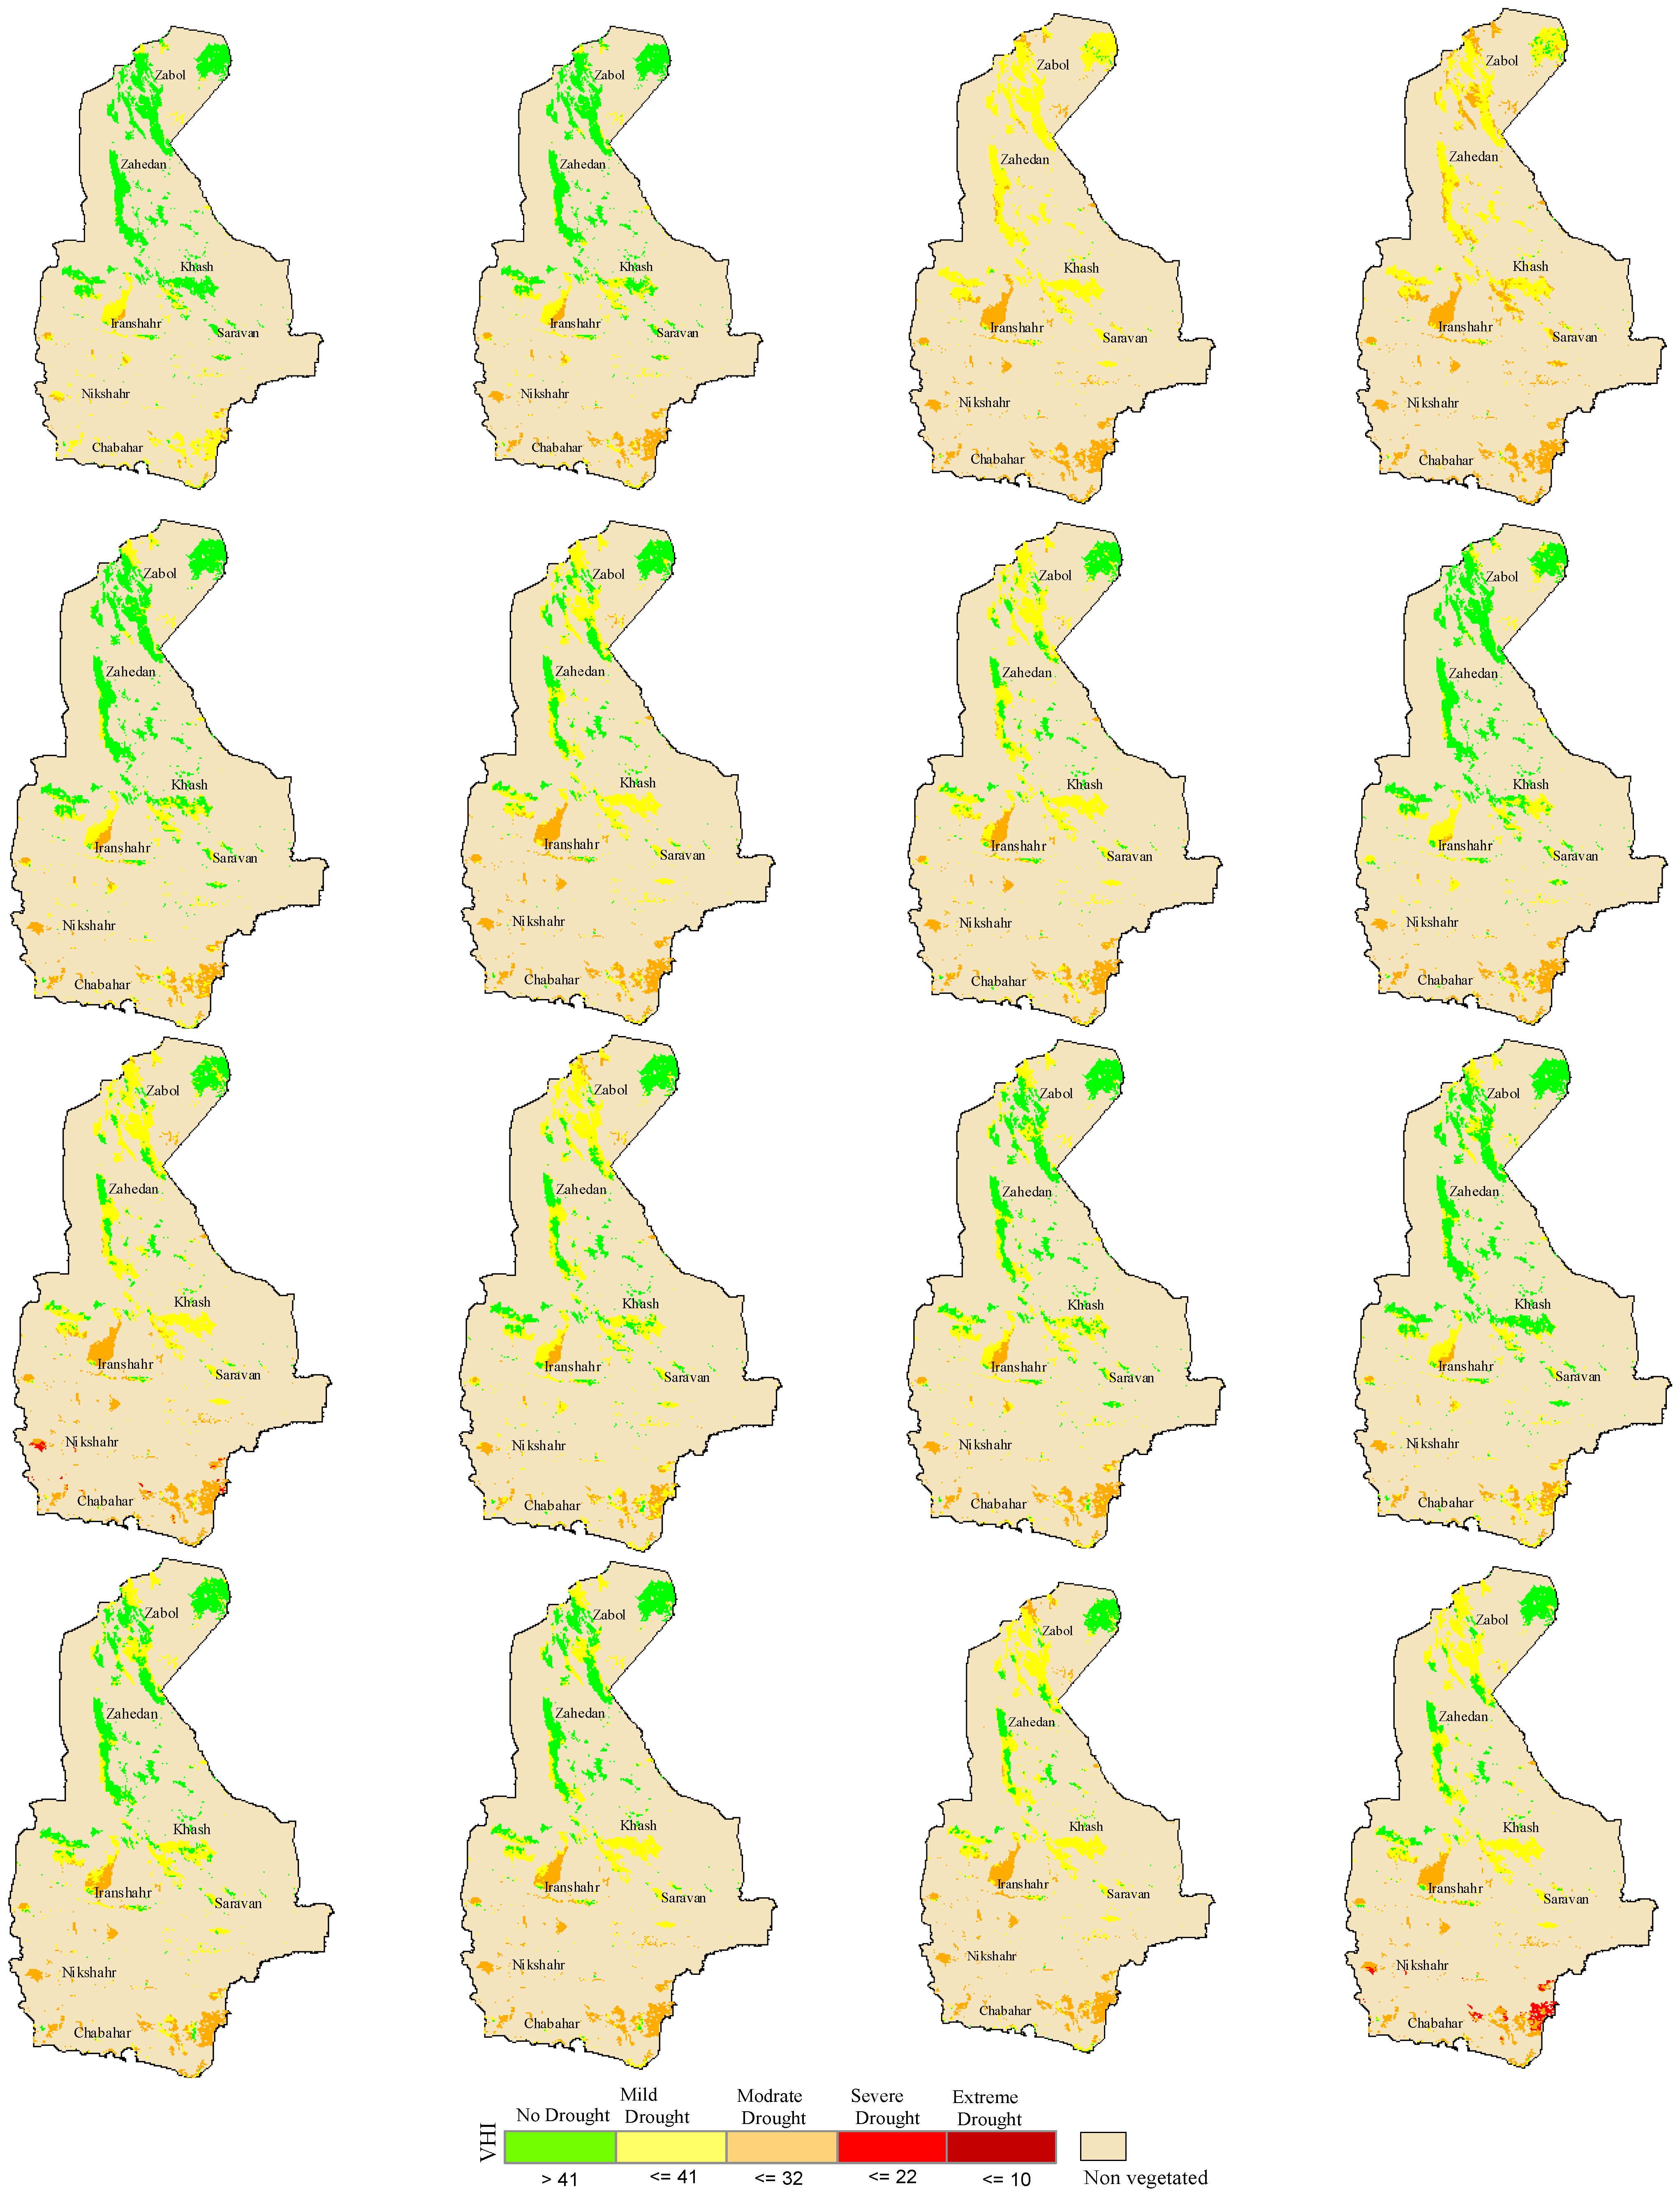
Initially, 16 VHI-based drought maps were produced for April to evaluate drought conditions in the study area (Figure 6). These maps offer a comprehensive overview of drought severity during that month, facilitating further analysis and identification of drought-prone regions. As evidenced by the drought maps, vegetated areas in the northern part of the province have either not experienced drought or have faced only mild drought conditions in all years. The southern region, however, exhibited severe drought classifications solely in 2017 and 2010, affecting 4.5% and 1.46% of the area, respectively. Drought severity in this index generally surpassed the average type, with no instances of extremely severe or exceptional droughts in any year. Nonetheless, it is crucial to highlight the occurrence of severe meteorological droughts in this province, as indicated by various studies [76,77]. The importance of groundwater aquifers and their unsustainable utilization in the agricultural prosperity of this province warrants discussion (Figure 6).

3.1.2. Spatial Variation Characteristics of Drought

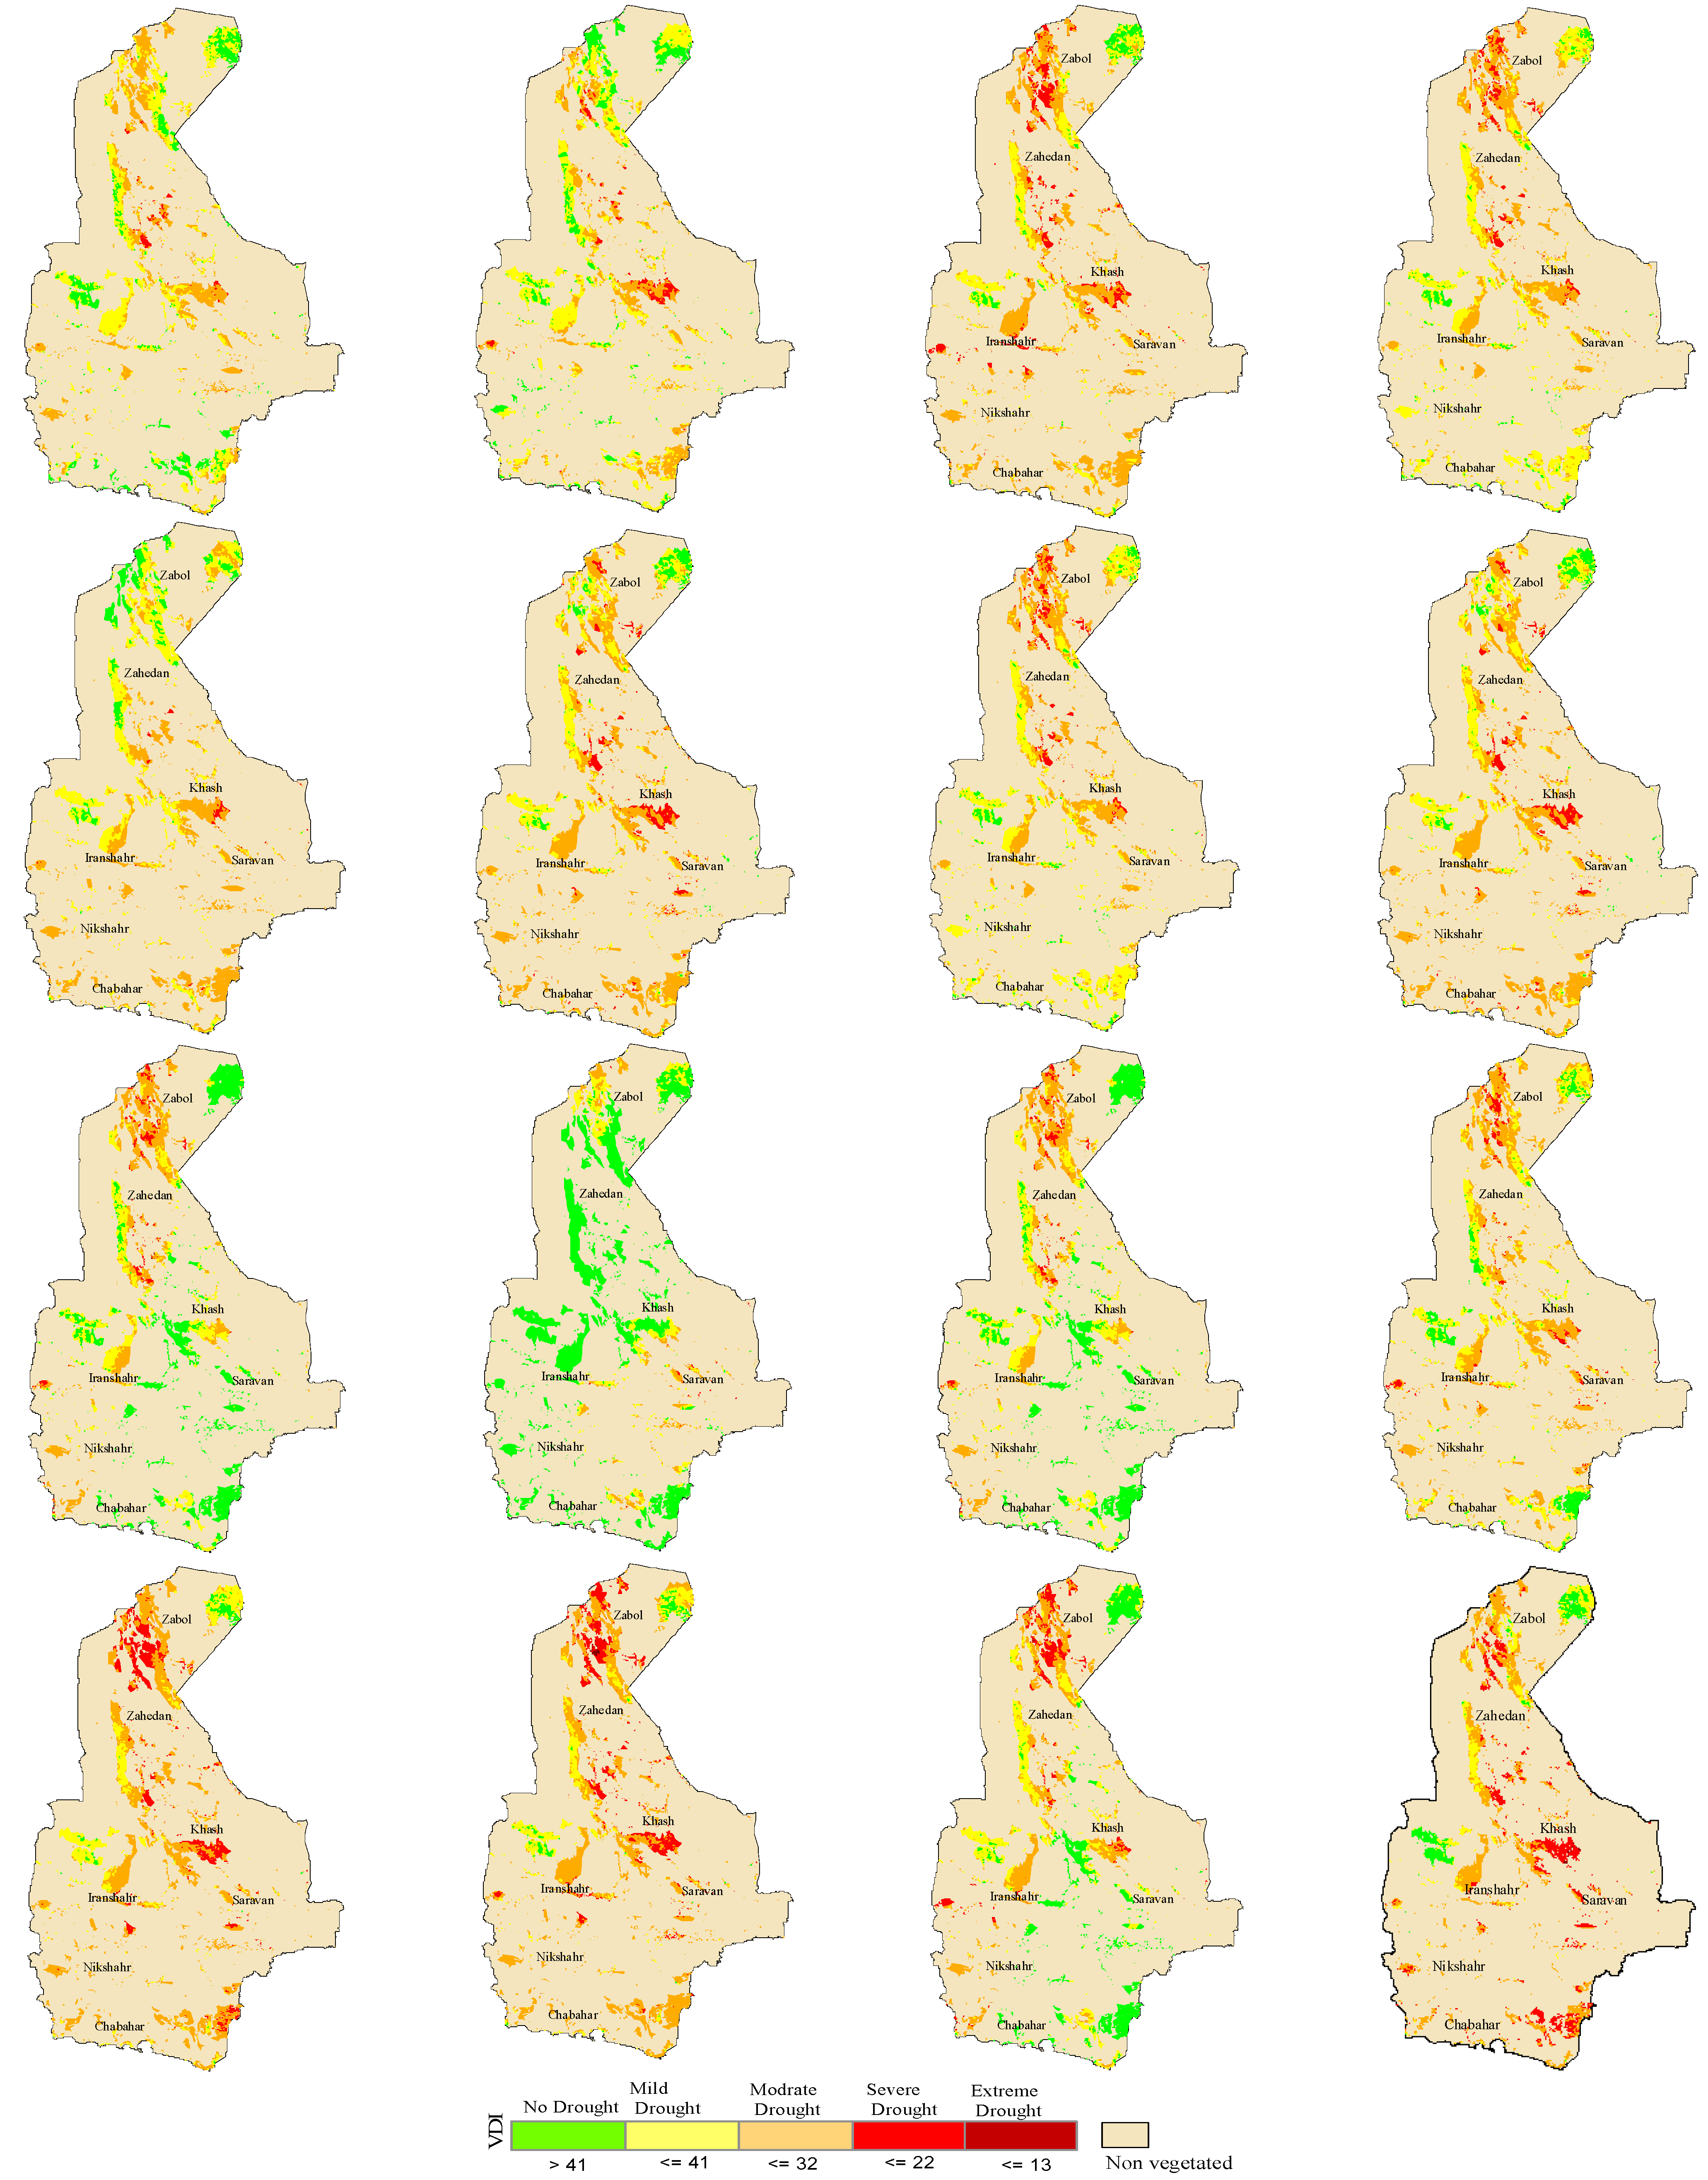
Both the Vegetation Health Index (VHI) and Vegetation Drought Index (VDI) consistently identified 2005 as a dry year, as confirmed by Figure 6 and Figure 7. However, the severity of the drought as assessed by VHI and VDI differed. While VHI categorized the 2005 drought as moderate, VDI classified it as severe. In this study, VHI and VDI were used to evaluate drought conditions in in the study area. The results revealed a strong overall correlation between the two indices, but VDI exhibited a more pronounced response to severe and extreme drought categories due to its incorporation of the MODIS SWIR band, which is highly sensitive to moisture (Figure 7). Drought events were observed in the study area in 2004, 2005, 2010, and 2017. Severe drought conditions in 2010 and 2017 affected 46.1% and 47.4% of the vegetation cover, respectively. Such events could have negative impacts on agriculture, water resources, and ecosystems.
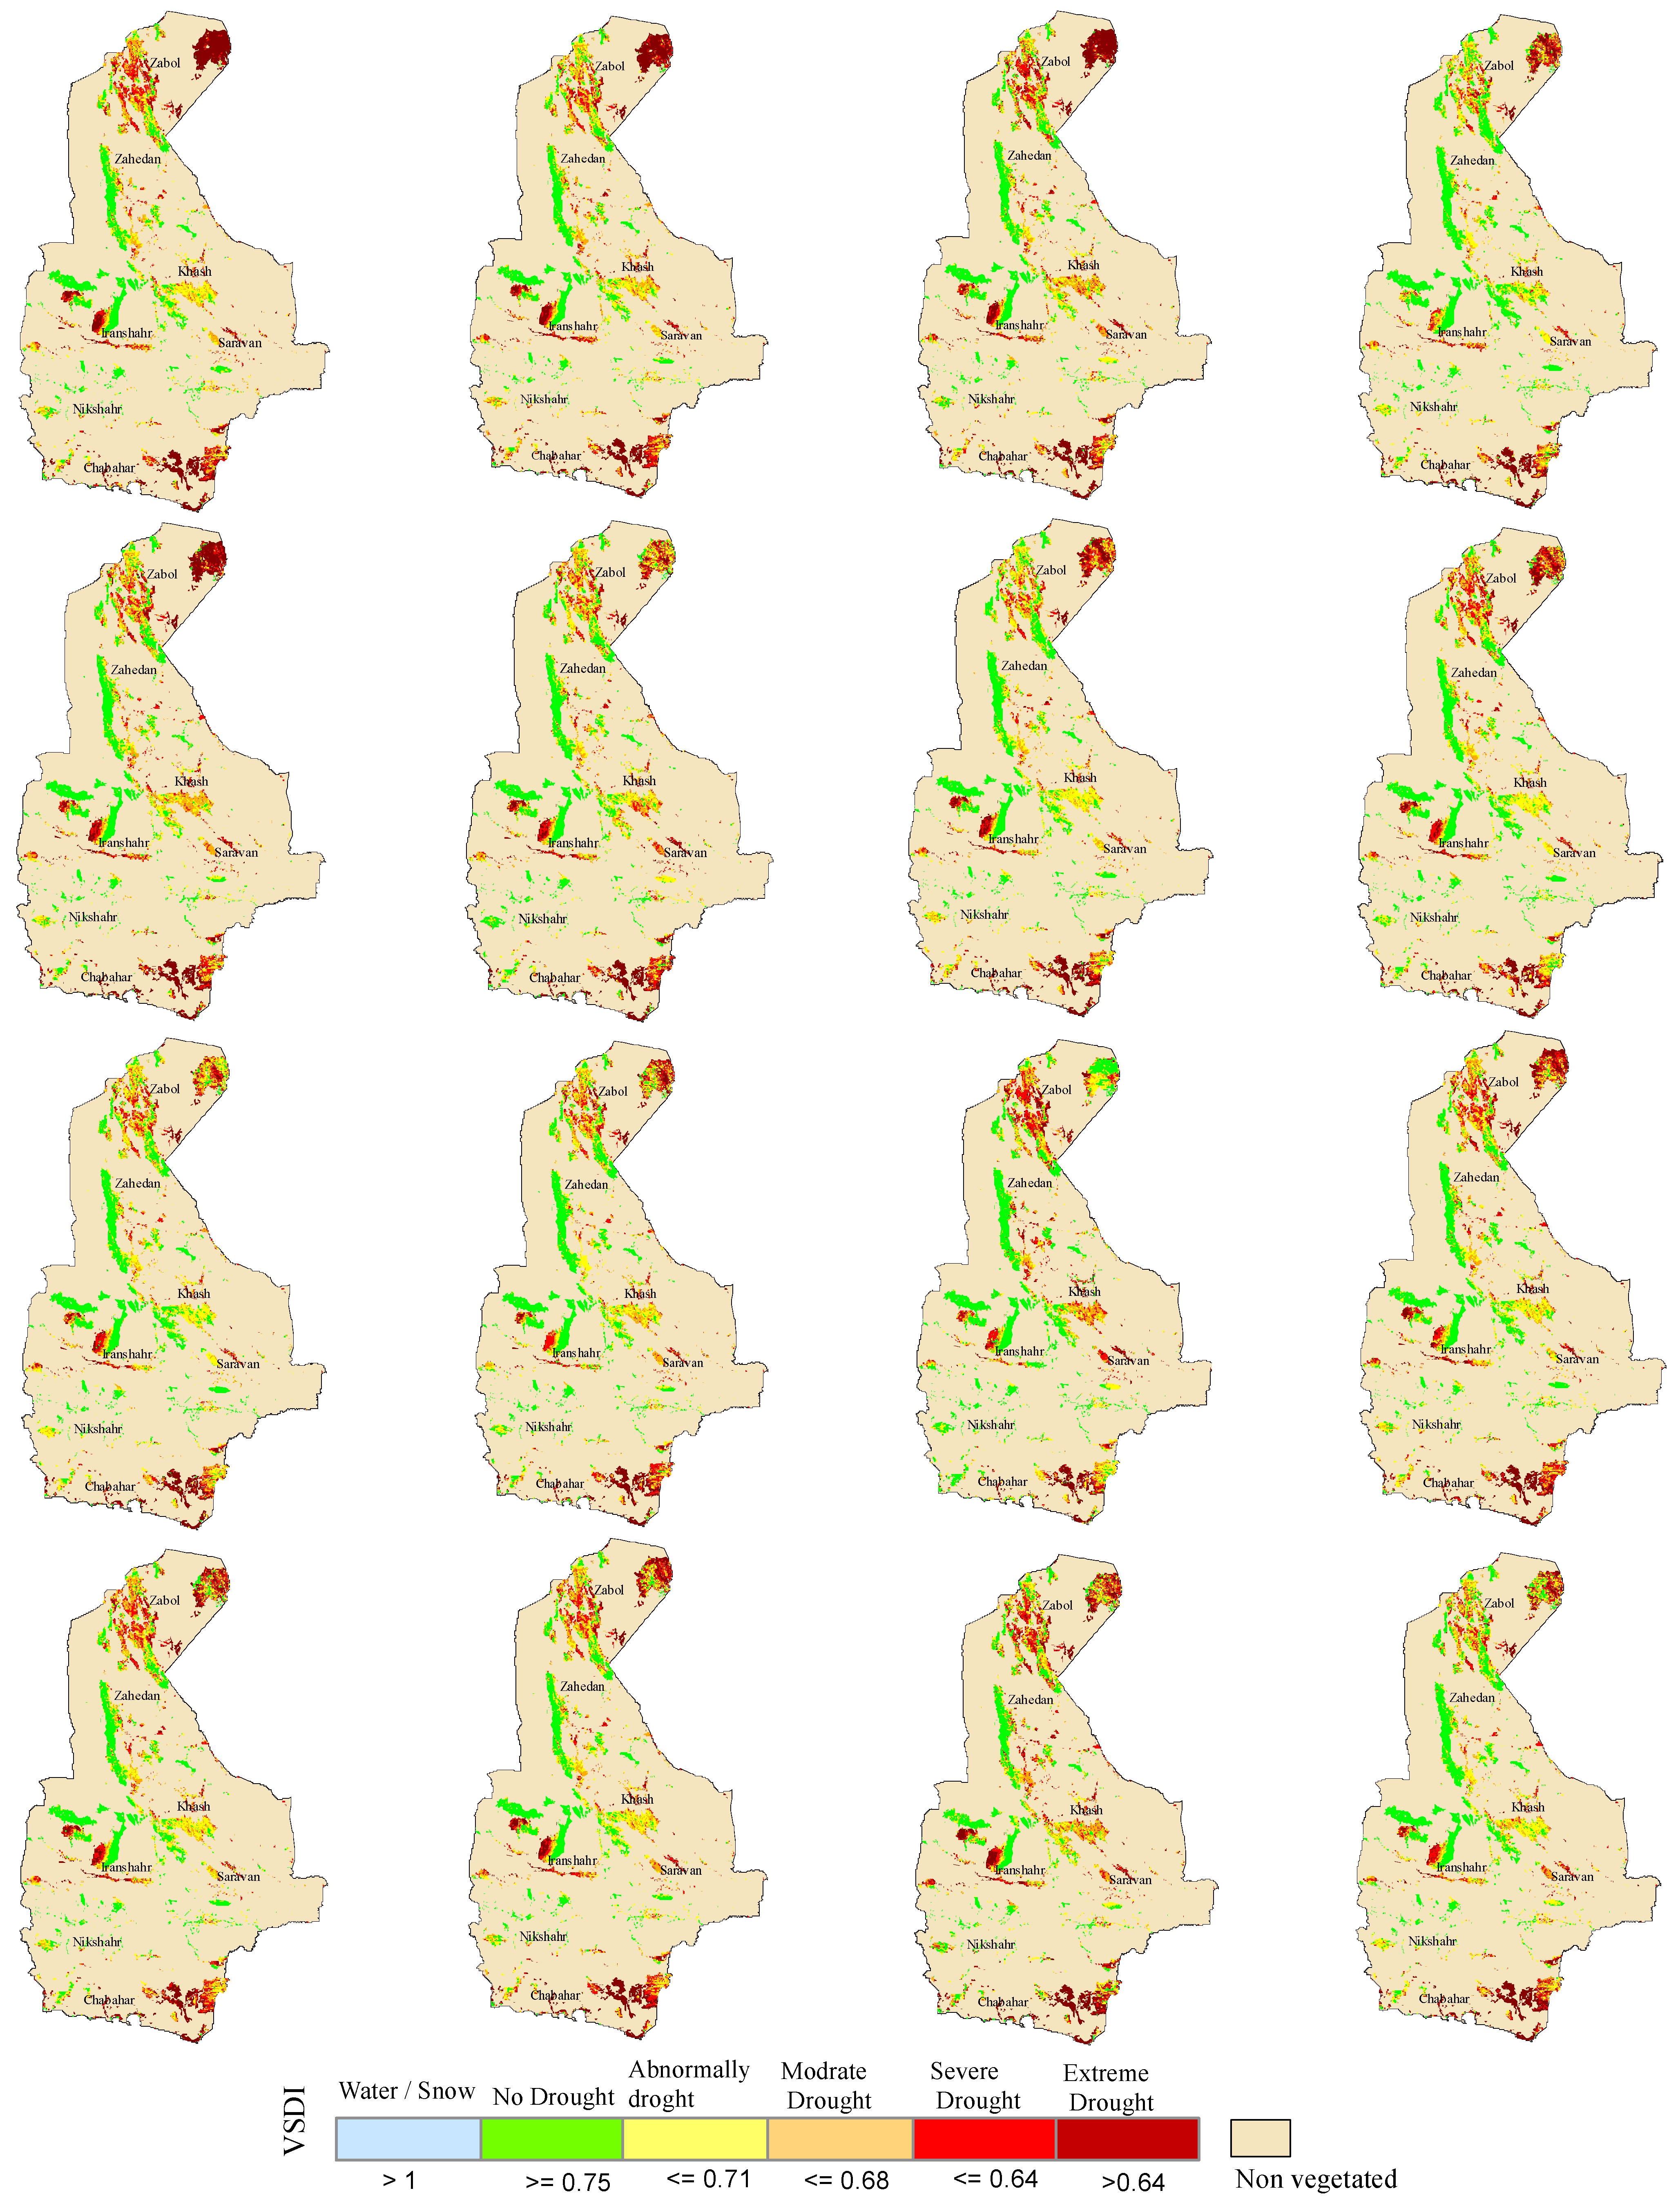
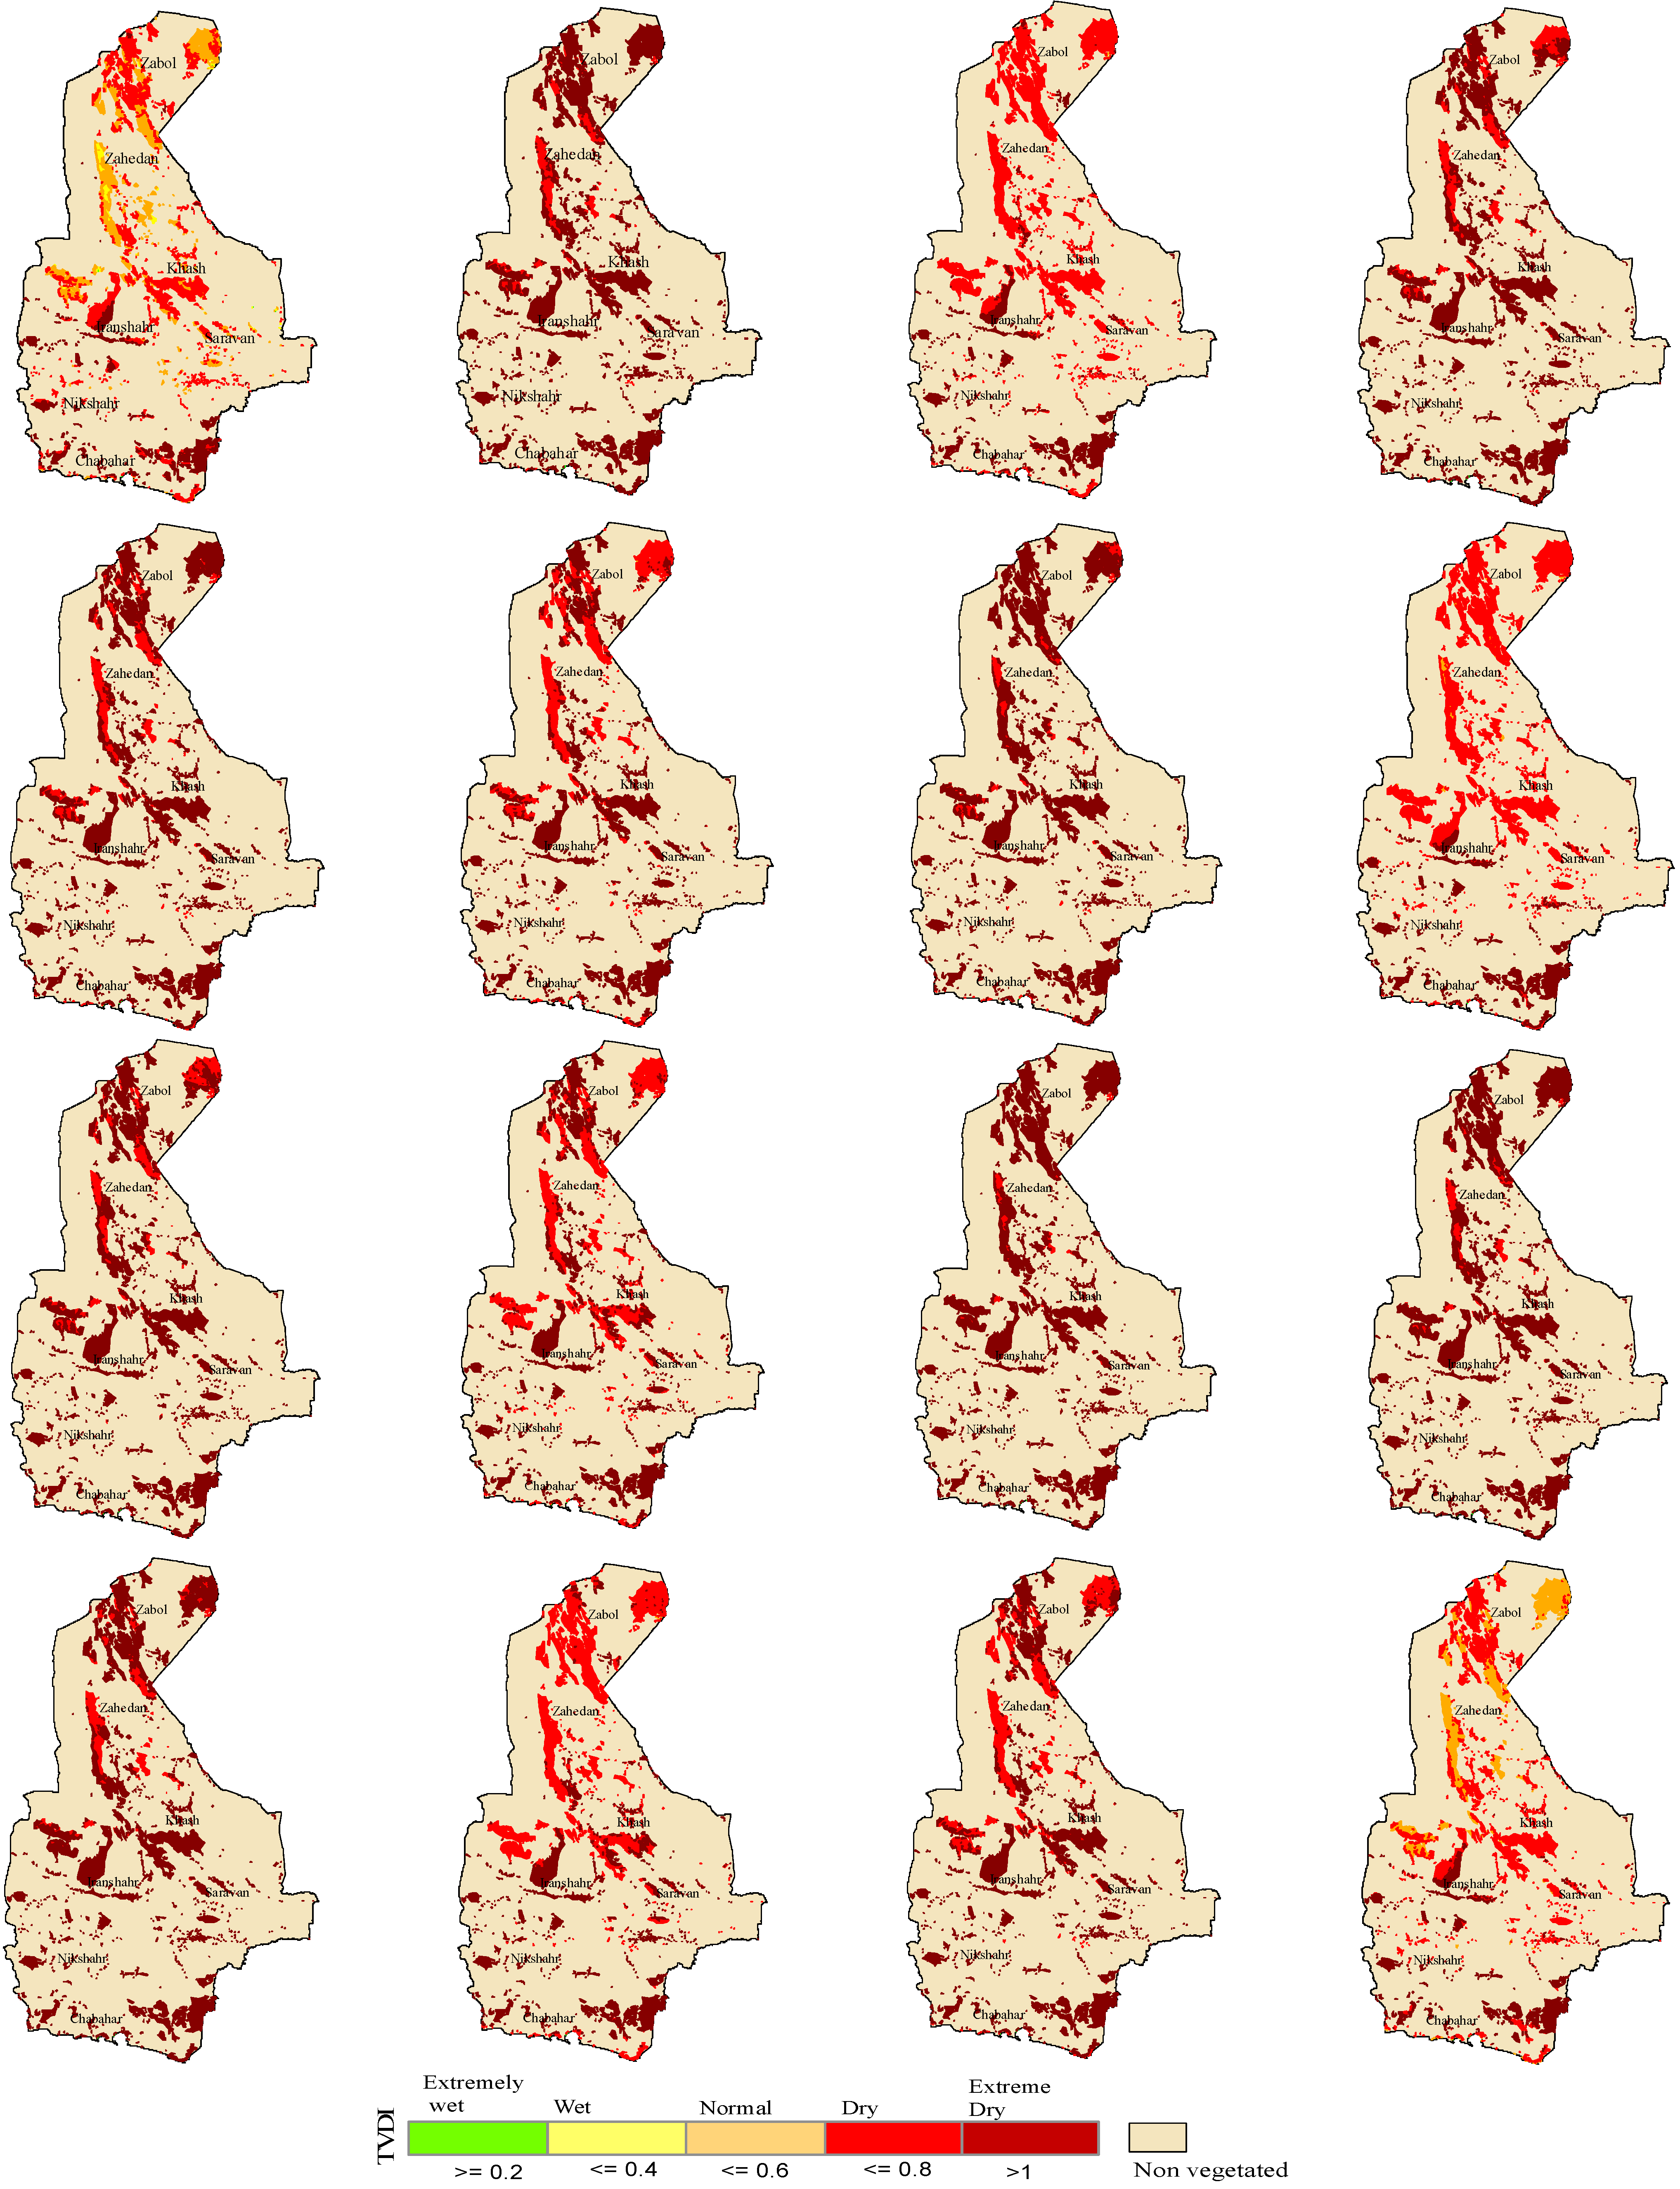
The VHI and VDI indices differ from the TVDI and VSDI indices in terms of utilizing distinct classification systems, making direct comparison challenging. Notably, VSDI tends to assign more severe drought classifications compared to VHI and VDI. This discrepancy can be attributed to the unique characteristics of VSDI’s spectral band input data, which do not consider temperature. The VSDI index output maps depicted in Figure 8 highlight that the years 2009, 2010, and 2011 featured extensive areas classified as normal or non-drought conditions. The VSDI index map illustrated in Figure 8 reveals that in 2003, a significant portion of the area was classified as normal (64.36%) and wet (4.1%). In 2017, about 17.32% of the state’s area was categorized as normal in terms of drought, ranking second among the examined years, while the remaining years exhibited moderate or severe drought conditions. In contrast, 2003 saw fewer severe drought categories across all four drought indices compared to other years. Analysis based on TVDI in Figure 9 shows that most drought categories in the studied years fell under “very dry” and “dry” classifications, with dry or very dry conditions prevailing throughout the study. The TVDI, primarily a soil moisture index, demonstrated limitations in identifying specific drought events across wide regions, consistently categorizing most study years as dry or very dry. Ultimately, the research findings suggest that the VSDI index showed a stronger correlation with precipitation compared to TVDI. However, the association between VHI and VDI was notably more robust and evident than with these other indices [78].
In a separate investigation, Refs. [77,79,80,81] recognized the timeframe from 2000 to 2004 as a series of highly arid years, aligning with the results obtained from the VSDI, VDI, and VHI indices. Alizadeh examined the monitoring and forecasting of drought in Sistan and Balouchestan Province, Iran. The researchers utilized the Standardized Precipitation Index (SPI), the percent of normal index, and the Markov chain method. Their results indicated that a majority of drought occurrences in this area were categorized as mild and moderate droughts, displaying a robust association with the Vegetation Health Index (VHI) and Vegetation Drought Index (VDI). In another study, the severity and spatial distribution of drought in Sistan and Balouchestan Province, Iran, were explored through the statistical approach of the percent of normal index. According to this study, Chabahar and Konarak stations were grouped in Group 1 with an average drought severity of 41.98%. Iranshahr, Khash, Saravan, and Zahedan stations fell under Group 2, with an average drought severity of 97.98%. Meanwhile, Zabol and Zehak stations were categorized into Group 3, with an average drought severity of 101.85%. Group 3 consistently faced more intense drought conditions in comparison to the other two groups. The researchers linked the lower drought index values in the remaining groups to two primary geographical factors: the elevated positioning of Group 2 (located near the Taftan Mountains) and the coastal proximity of Group 3 (adjacent to the Sea of Oman, receiving seasonal rainfall). These findings were in line with the spatial distribution of drought noted in the analyzed indices. The outcomes of the present study concur with previous research. For instance, the year 2000 was denoted as a period of extremely weak drought based on the SPI index, consistent with the findings of the four indices scrutinized in this study. Similarly, [80] identified the period from 2000 to 2004 as a series of very dry years, which aligns with the results of the VSDI, VDI, and VHI indices. As discussed earlier, the TVDI presents limitations in effectively identifying specific drought occurrences across vast regions. Conversely, the VHI, VDI, and VSDI indices have demonstrated superior performance in assessing drought conditions. VHI and VDI, in particular, are deemed more appropriate for assessing drought severity in arid and semi-arid areas, including the study site. This preference is due to their incorporation of temperature, a crucial factor influencing vegetation health and water stress, in their computations. Unlike VSDI, which relies solely on soil moisture data, the absence of temperature information can result in overestimations of drought severity in these regions. This deficiency in temperature data impedes VSDI’s ability to capture the intricate relationship between temperature, vegetation health, and drought stress.

3.1.3. Hydrological Drought Monitoring

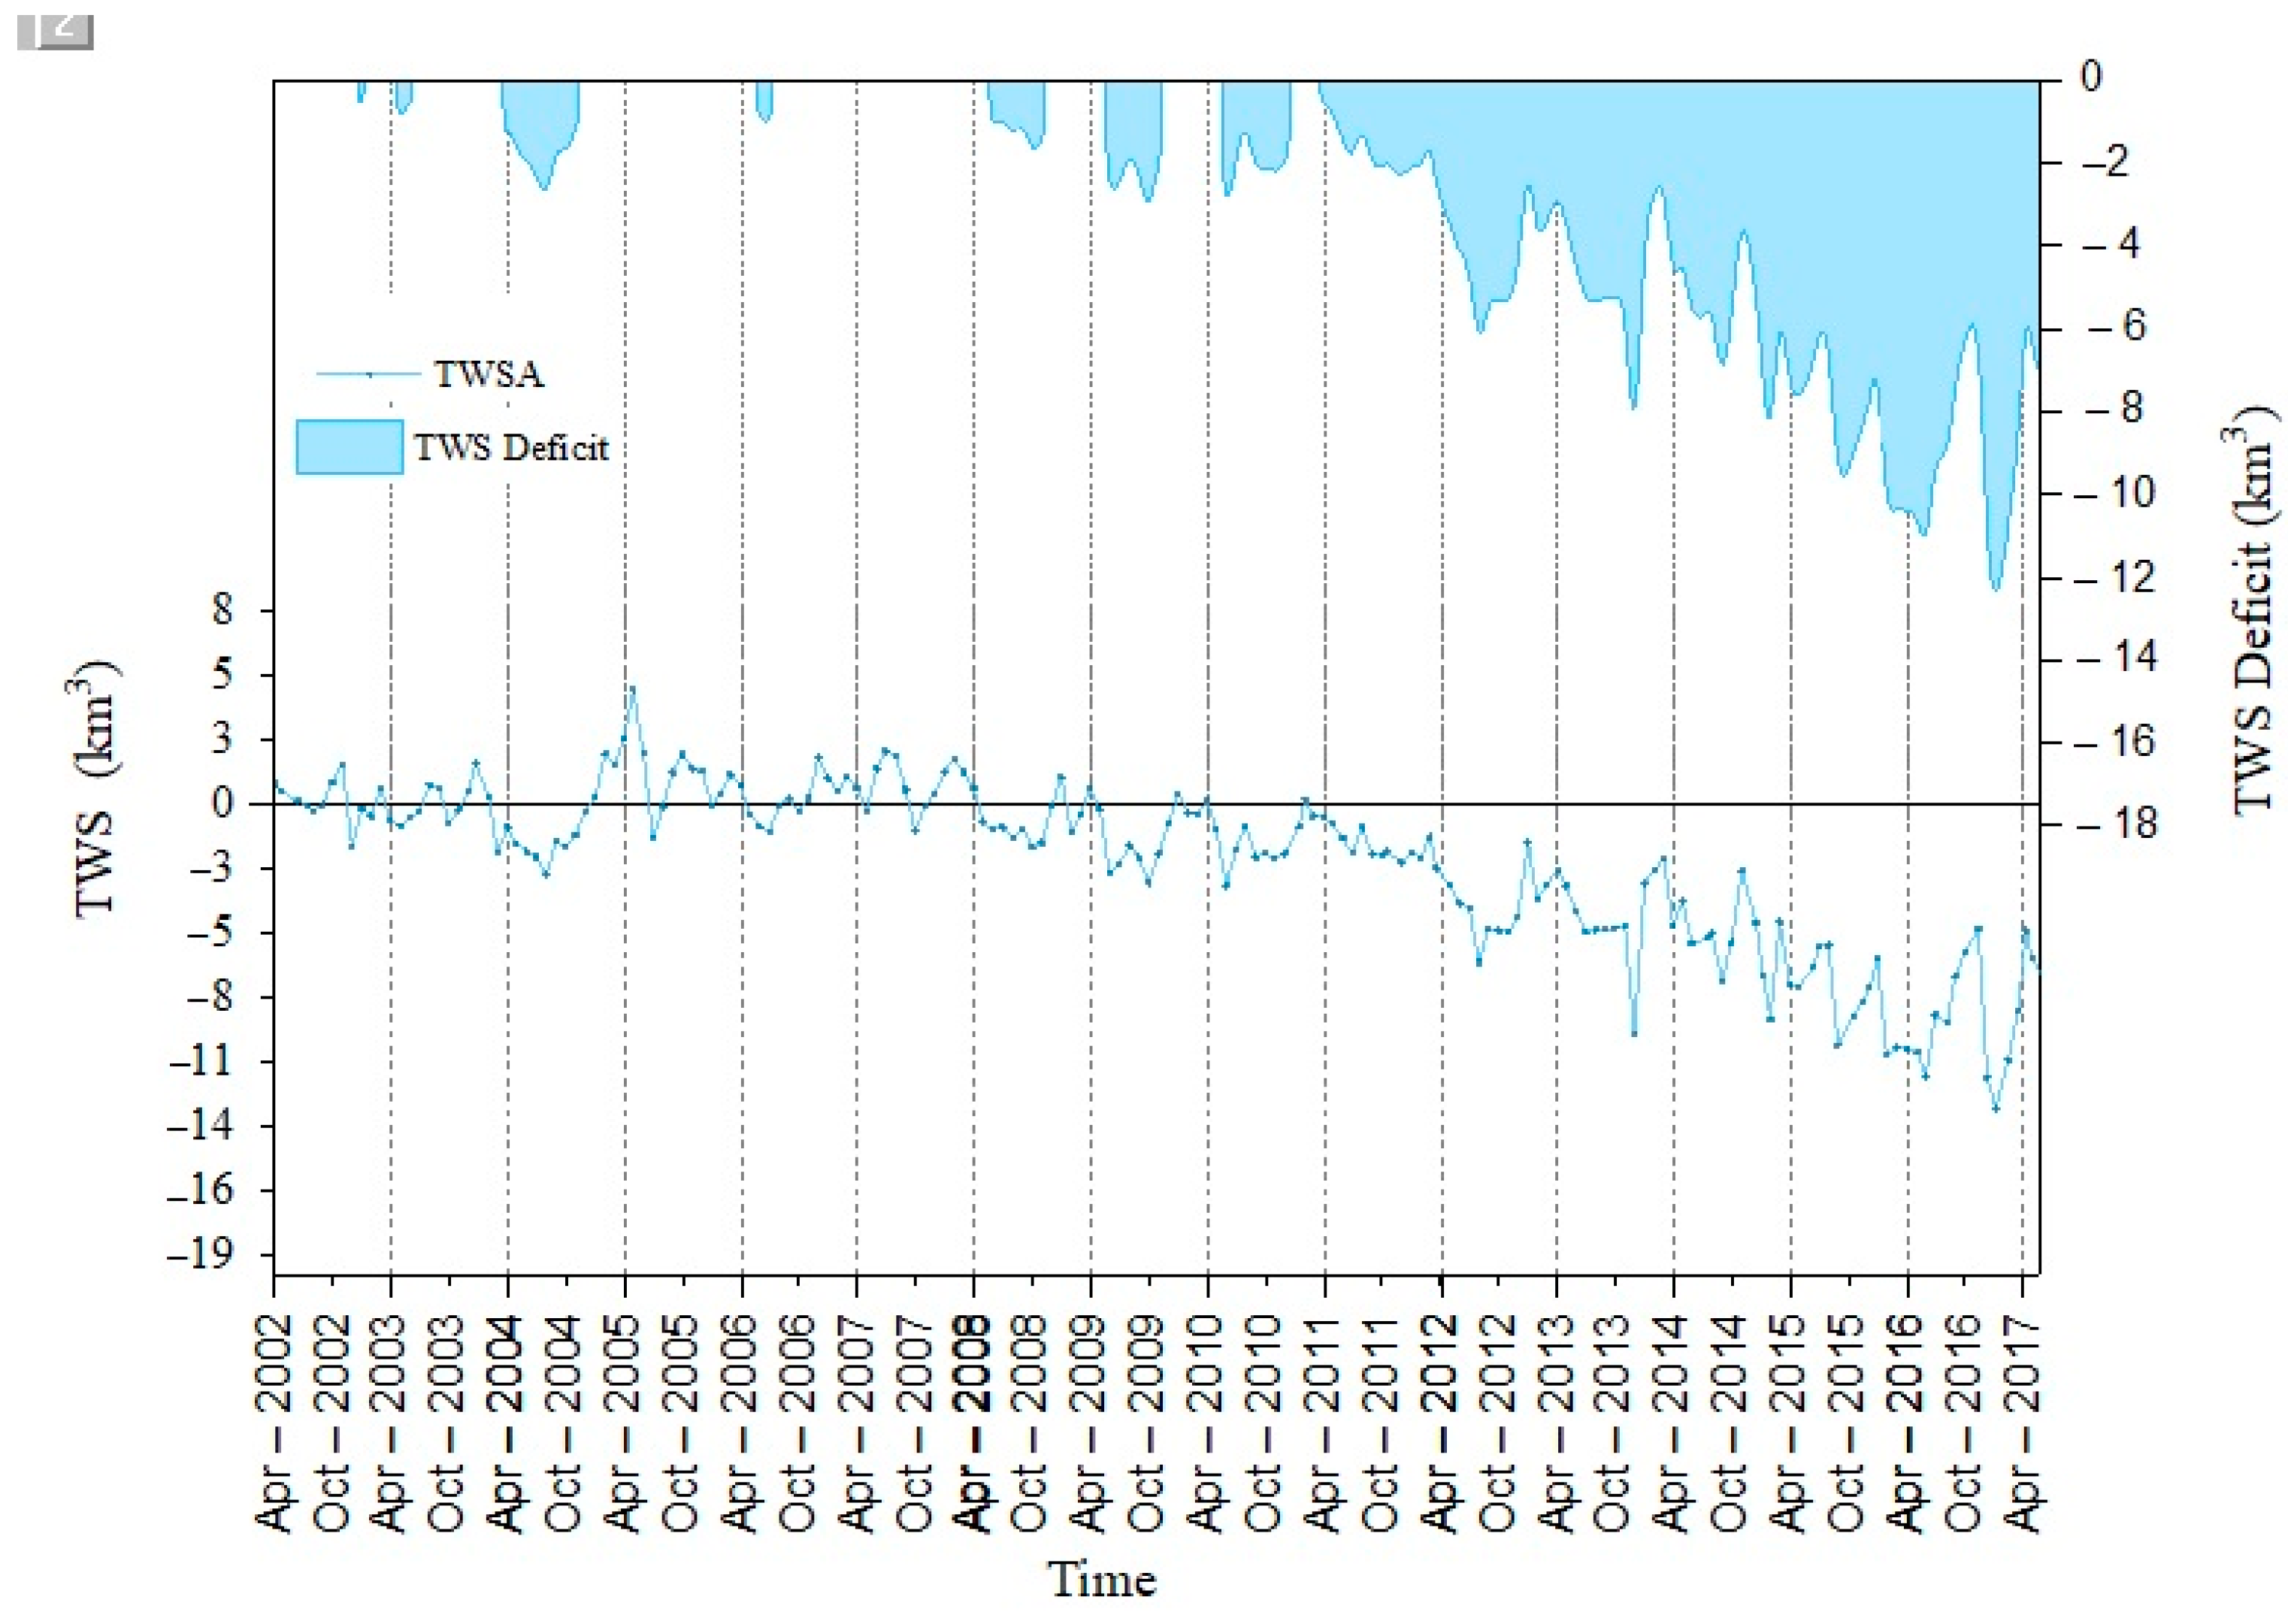
This section explores the evaluation of hydrological drought in the southeastern region of Iran, utilizing the Total Storage Deficit Index (TSDI). The analysis specifically concentrates on Sistan and Balouchestan Province, which includes 50 third-order watersheds. A visual representation of the study area is depicted in Figure 1. To assess the fluctuations in total water storage across the third-order watersheds of the study area, the most recent CSR GRACE RL06 data, updated monthly, were utilized, focusing on the Total Water Storage Anomaly (TWSA) from April 2002 to June 2017. The data were available at a spatial resolution of 0.25° × 0.25°. It is essential to highlight that, in recent times, GRACE satellite operations have integrated power-saving measures, resulting in sporadic data gaps in certain months. Interpolation techniques, as recommended, can be employed to handle these missing data points and reconstruct the time series. Following the interpolation of missing data points, the Total Storage Deficit Index (TSDI) was computed for each of the 50 watersheds. In this investigation, months of drought were defined as those with negative TWSA values. Drought events lasting less than four months were excluded, and TWSA surpluses of less than three months were not considered wet periods. These criteria are in line with the viewpoints presented by [82,83], aiming to mitigate the influence of minor TWSA fluctuations, such as deficits or surpluses, on the detection of significant drought occurrences. In Figure 6, the blue line illustrates the Total Water Storage Anomaly (TWSA) values obtained from GRACE satellite data, while the shaded blue area indicates the calculated TWS deficit linked to drought events. As shown in Figure 9, Sistan and Balouchestan Province encountered substantial TWS deficits from April 2012 to the conclusion of the study period. For example, the average annual deficit for the province in 2016 was 12.2 km3. It is crucial to emphasize that the average annual TWS deficit portrayed in Figure 10 represent the mean value for the entire province. Although similar patterns were observed in most individual watersheds, the specific deficits varied among different regions. Separate computations were conducted for each watershed, but for conciseness, only the overall provincial average is presented here.
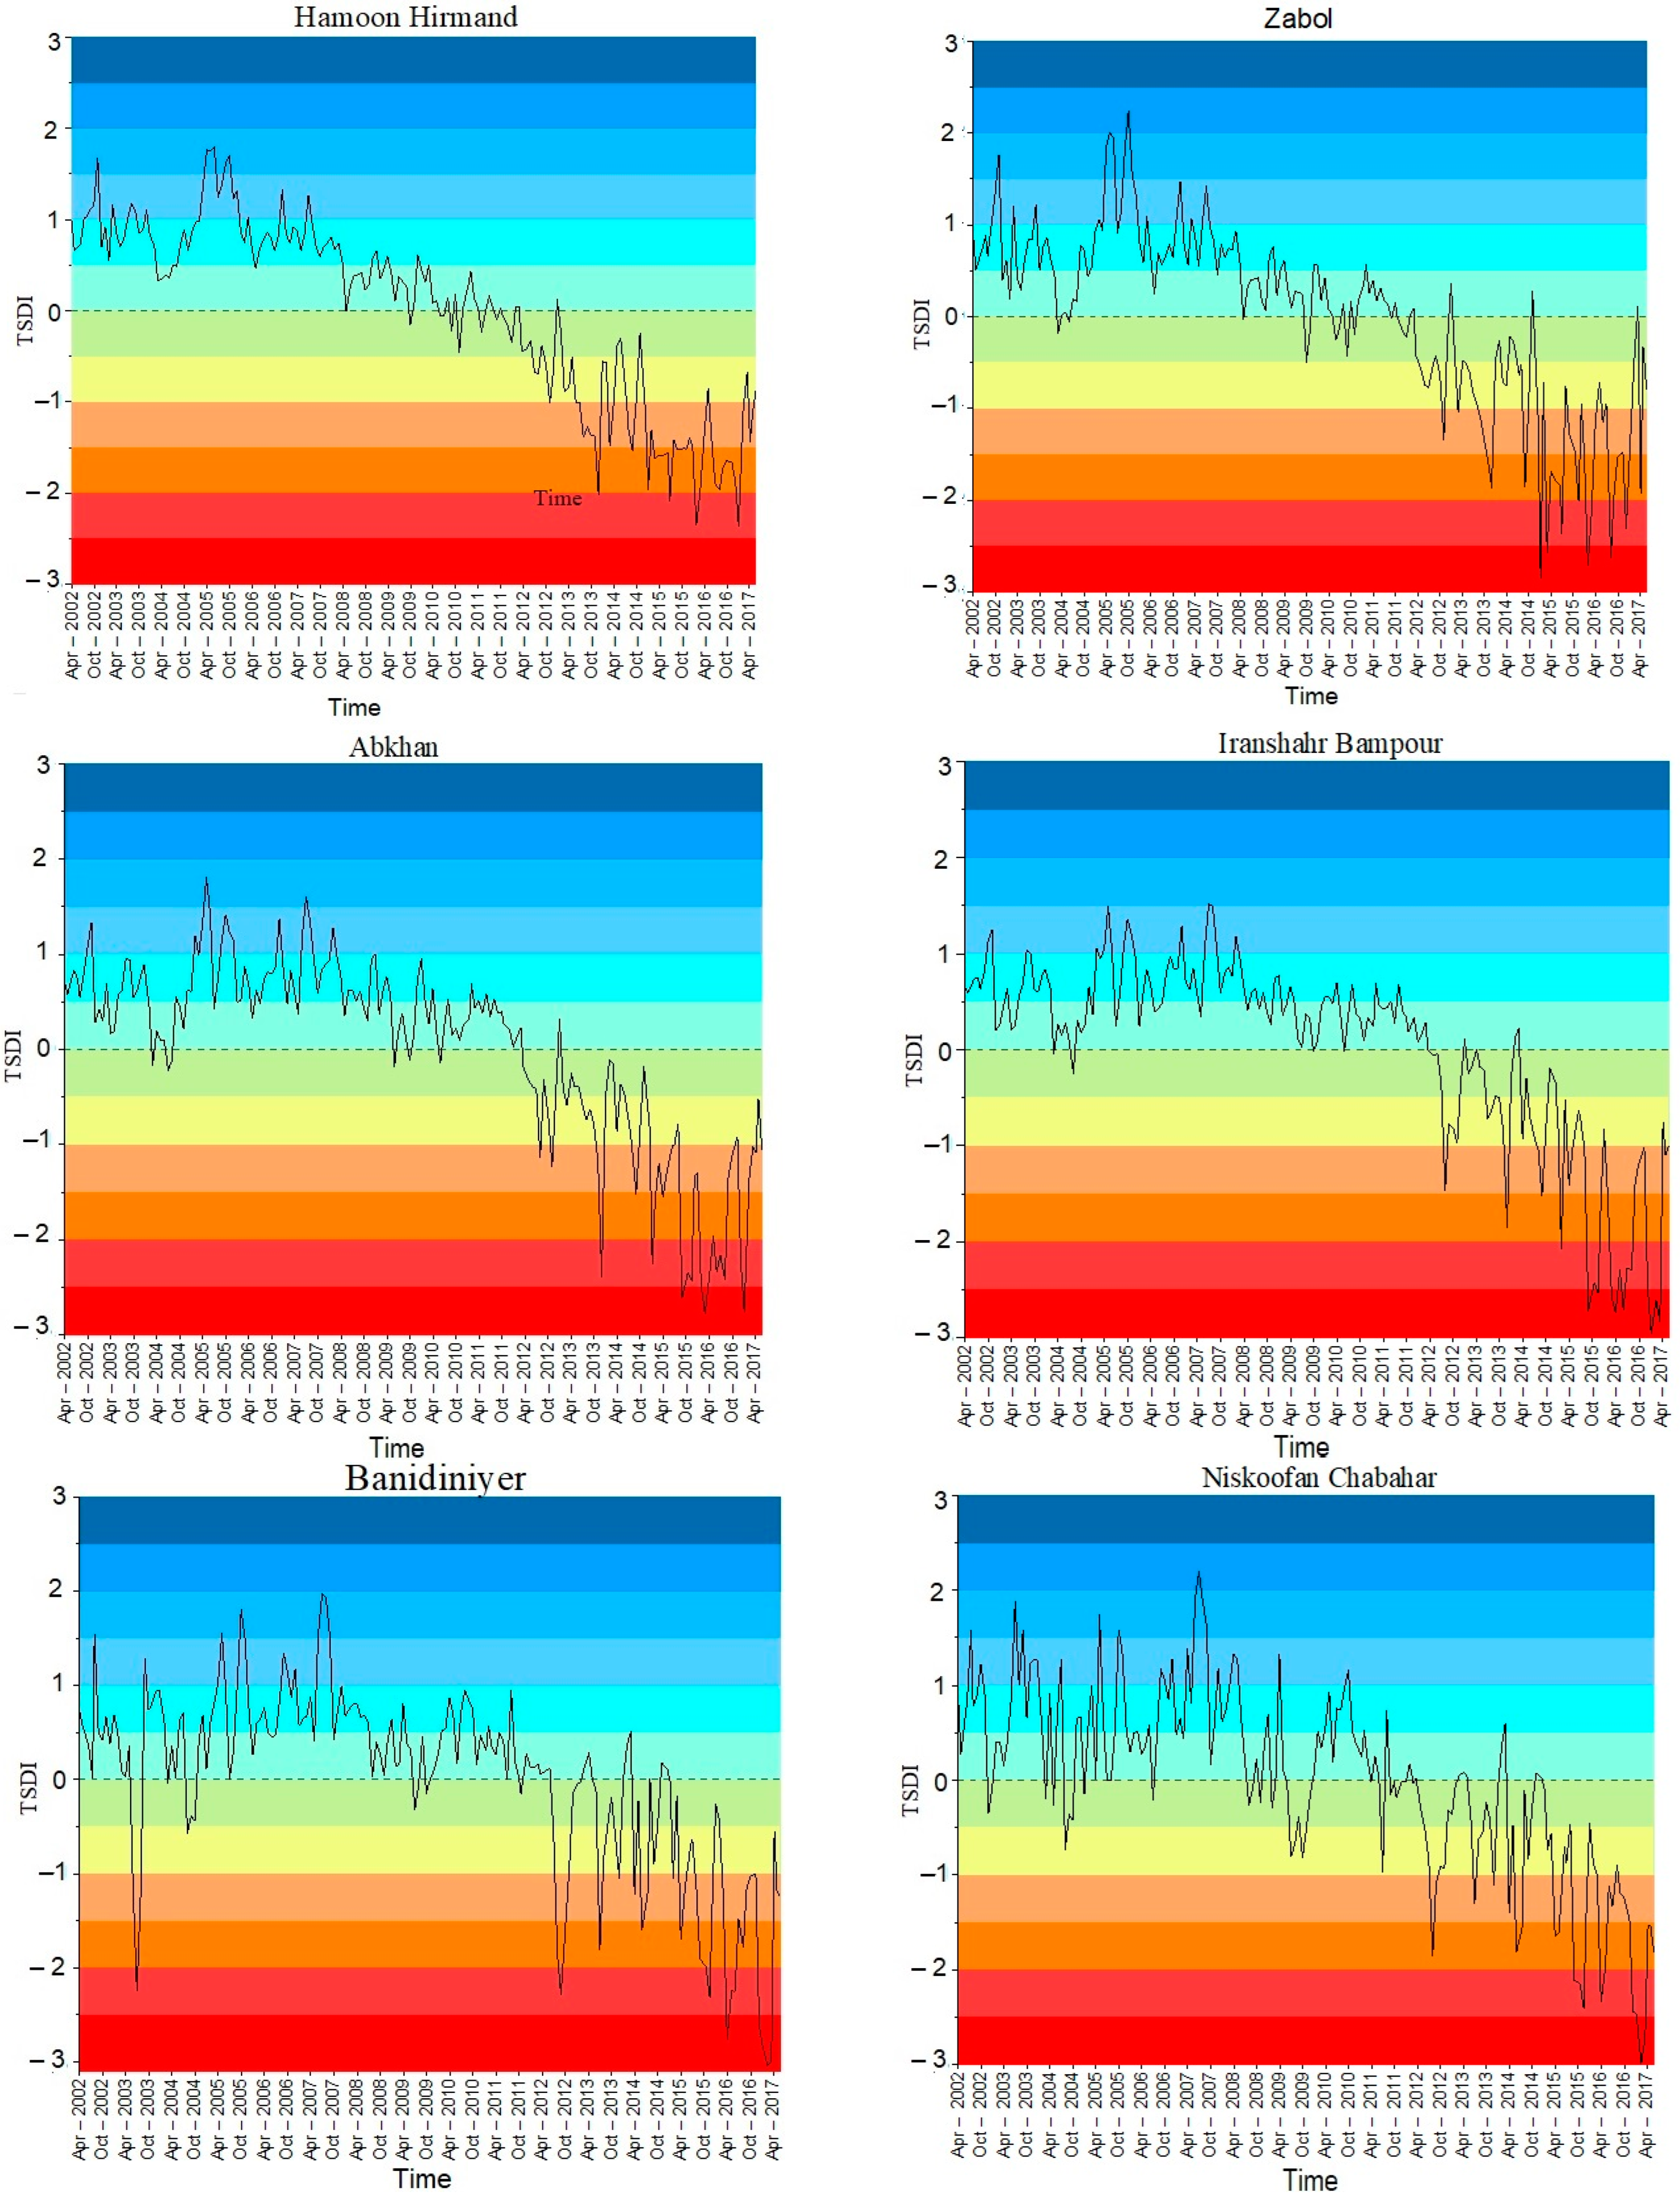
This basin experienced five drought events, with the most severe lasting 89 consecutive months during the final study period (February 2010 to June 2017). In contrast, the Niskoofan Chabahar basin had the lowest cumulative drought severity, totaling 111.214 km3 per month across 10 drought events. The most severe drought event in this basin also occurred during the final study period (January 2015 to June 2017). Details of the drought periods in Table 3 outline the key characteristics of droughts in the two mentioned basins. The table includes information on the number of drought events, average deficits, and total drought severity. Notably, the Rahmat Abad basin faced the most severe drought, with a total intensity of 665.99 km3 per month. The characteristics of these two basins are provided in Table 4. Subsequently, after calculating the Standardized Drought Index (TSDI) for all 50 watersheds, we randomly selected two watersheds from each of the northern, central, and southern regions of the province due to the large number of watersheds. Detailed information regarding these six watersheds, including area, location, and other characteristics, is presented in Table 3.
The TSDI calculation for all 50 studied watersheds revealed a consistent trend of increasing drought severity from 2002 to 2017. Analysis of drought index graphs across different severity classes confirmed that all watersheds experienced drought conditions, particularly in the later years of this period (Figure 11).

4. Discussion

Climatic studies indicate that Sistan and Balouchestan Province has evolved into an arid region highly susceptible to prolonged droughts due to a combination of climatic factors such as low precipitation, high evaporation rates, strong winds, and limited vegetation cover. Based on research conducted between 2000 and 2015, approximately 58% of the province’s total area has been directly affected by drought. These findings align with previous studies which have shown that dry years with below-average rainfall constitute more than 52% of the province’s climatic record [80,84,85].
Statistical analysis of meteorological data reveals significant and irregular fluctuations in annual precipitation patterns within the region. In particular, a gradual decline in rainfall over the past two decades has been evident. This decreasing trend in precipitation, coupled with rising temperatures and evaporation rates, has created more favorable conditions for the intensification of droughts and the expansion of desertification in the province. The results of this research confirm that drought is a fundamental challenge facing this region and has had detrimental impacts on the ecosystem and local communities [86,87].
This research, while confirming the findings of previous studies, has further revealed the spatial distribution of drought in the region through the use of satellite data, enhancing our understanding of this complex phenomenon and focuses on three aspects of drought monitoring in Sistan and Balouchestan Province, located in southeastern Iran: meteorological, vegetation, and hydrological. Initially, four remote sensing-based drought indices derived from MODIS satellite products were employed over a 16-year period (2002–2017). The choice of this timeframe was due to statistical limitations related to the GRACE satellite, which operated from 2002 to 2019. Notably, there was a data gap from June 2017 to 16 June 2018 (11 months) due to the satellite’s limitations.
To achieve the study’s objectives, four drought indices (VHI, VDI, VSDI, and TVDI) were used. Non-vegetated and desert areas were excluded from the analysis to mitigate uncertainties arising from arid soil. The VHI and VDI indices, combining vegetation temperature and humidity, exhibited a negative correlation between their components (80.23% for VHI and 75.5% for VDI), reducing uncertainty in drought assessment. However, positive correlations occurred in specific regions, indicating a mismatch between rainfall and vegetation types.
The VHI and VDI maps for April depicted drought classes consistently, with the only difference being the absence of the “extreme drought” class in the VHI index. While both indices characterized 2005 as a drought year, VDI indicated more severe drought. In 2005, VHI showed that 97.78% of vegetated areas experienced mild or moderate drought, while VDI indicated dominant severe or moderate drought (89.56%). In summary, both indices exhibited similar behavior, but the VDI index was particularly sensitive to severe and very severe drought due to its reliance on the moisture-sensitive MODIS SWIR band. Meanwhile, the TVDI index consistently indicated extremely dry or dry conditions throughout the study years.
To evaluate the sensitivity of the four drought indices under investigation, we analyzed their correlation with precipitation data. Specifically, we examined the correlation between VHI, VDI, VSDI, and TVDI drought indices and April precipitation. Notably, VHI and VSDI showed a strong contemporaneous influence of precipitation on vegetation during that month, suggesting a rapid response to precipitation events. In the subsequent section, we utilized the Total Storage Deficit Index (TSDI), derived from GRACE satellite data, to assess hydrological drought in Iran’s southeastern basins. By incorporating indicators such as drought deficit, severity, and the TSDI, our analysis provided a comprehensive and spatially explicit assessment of hydrological drought extent across these basins, spanning from north to south. These findings offer valuable insights into regional groundwater levels.
This study explored hydrological drought distribution across the province using the Total Storage Deficit Index (TSDI) derived from GRACE satellite data. It assessed water deficit magnitude and drought severity for all regions during the study period. Notably, from April 2012 to the study’s end, all areas experienced significant water shortages.
This research, while confirming the findings of previous studies, has further revealed the spatial distribution of drought in the region through the use of satellite data, enhancing our understanding of this complex phenomenon.

5. Conclusions

According to the UNESCO report by GDACS (Global Disaster Alert and Coordination System), Iran and its neighboring countries have been placed on orange alert [69]. Precipitation in South Khorasan Province has decreased by nearly 50% compared to the long-term average, while in southeastern Sistan and Balouchestan Province, the decrease has reached up to 80%. This research, employing a dual approach, conducted a comprehensive investigation into the impacts of drought on vegetation, groundwater resources, and agriculture in southeastern Iran. To enhance the accuracy of the results in the vegetation section, April was selected as the study period. During this month, due to peak vegetation growth and high atmospheric clarity, higher-quality and more precise satellite images of vegetation could be obtained. Groundwater data were obtained from the GRACE satellite, with data collection beginning in 2002. Due to the availability of complete data up to June 2017, this time frame was chosen for analysis to ensure a comprehensive and consistent dataset. The analysis of vegetation drought indices in Sistan and Baluchestan Province revealed distinct patterns and limitations. The VSDI index, while sensitive to vegetation conditions, may overestimate drought severity due to its reliance on spectral band data without temperature considerations. The TVDI, primarily a soil moisture index, consistently classified most study years as dry or very dry, suggesting potential limitations in identifying specific drought events. In contrast, the VHI and VDI indices, which incorporate temperature and vegetation factors, demonstrated a stronger correlation with precipitation data, particularly in terms of identifying moderate and severe drought conditions. These findings underscore the importance of using a combination of indices to comprehensively assess drought conditions in the region. In the second part of this research, by utilizing valuable data from the GRACE satellite and employing the Total Storage Deficit Index (TSDI), a comprehensive assessment of hydrological drought in the southeastern watersheds of the country was conducted. The results indicated that this method can accurately estimate indices such as drought deficit, drought severity, and total water storage in various basins. These findings suggest that the TSDI is an efficient tool for precise and timely monitoring of hydrological drought and sustainable water resource management in arid and semi-arid regions of the country. The results of this study, as is consistent with other research, emphasize the severity of drought in terms of the vegetation and hydrology of the study areas and highlights the importance of using satellite-based indices in drought assessment and management.
Our study indicates that Sistan and Baluchestan Province, particularly the Sistan region, is facing severe challenges due to prolonged droughts. The acute water scarcity has resulted in the desiccation of Hamoun Lake, negatively impacting the region’s vegetation, wildlife, and groundwater resources. As a consequence, the increased prevalence of dust storms, environmental degradation, and public health issues have become significant concerns. This crisis not only threatens the environment but also has a profound impact on the lives of the local population. The loss of livelihoods in agriculture and fishing has forced many residents to migrate. Consequently, the region is now grappling with severe social and economic challenges, including poverty, unemployment, and a rise in social problems. In conclusion, the water crisis in Sistan and Baluchestan is a complex issue with far-reaching social, economic, and environmental implications. Addressing this crisis requires urgent and comprehensive action at both the national and regional levels. To ensure sustainable water management in this province, it is imperative to vigorously pursue water allocation in the Hirmand River, in addition to implementing the following measures:
  • Transboundary water negotiations: To resolve disputes over shared water resources between countries, methods such as international mediation, international arbitration, establishing early dispute resolution mechanisms, and information sharing can be used. These methods help to reduce tensions and increase cooperation.
  • Groundwater management: To prevent excessive groundwater extraction, measures such as limiting water withdrawals, promoting rainwater harvesting, improving irrigation methods, and shifting cropping patterns towards less water-intensive crops can be taken.
  • Sustainable agriculture: To reduce water consumption in agriculture, methods such as drip irrigation, crop rotation, cultivating drought-resistant plant species, precise soil management, and farmer education can be used.
Successful implementation of these proposals requires cooperation from all sectors of society, attention to local conditions, and consideration of climate change.

Author Contributions

Conceptualization, K.O., M.N. and I.R.; data curation M.N.; formal analysis, K.O., M.N. and I.R.; investigation, M.N.; methodology, K.O., M.N. and I.R.; project administration, H.O.; resources, H.O.; software, M.N. and I.R.; supervision, K.O. and H.O.; visualization, M.N. and I.R.; writing—original draft, M.N. and I.R.; writing—review and editing, K.O., M.N., I.R. and H.O. All authors have read and agreed to the published version of the manuscript.

Funding

This work was supported by Vedurfelagid, Rannis and Rannsoknastofa i vedurfraedi.

Institutional Review Board Statement

Not applicable.

Informed Consent Statement

Not applicable.

Data Availability Statement

Data available after contacting Masoume Nabavizadeh at [email protected]. The data are not publicly available due to Iranian National Science Foundation (INSF) restrictions.

Acknowledgments

This paper is derived from a doctoral dissertation approved and defended at Yazd University. The authors express their sincere gratitude to the Iranian National Science Foundation (INSF) for their financial support, which significantly enhanced the quality of this research. Also, the authors are deeply grateful to Haraldur Olafsson (Institute for Atmospheric Sciences-Weather and Climate, and Department of Physics, University of Iceland, and Icelandic Meteorological Office (IMO)), for his great support and kind guidance.

Conflicts of Interest

The authors declare no conflicts of interest. The funders had no role in the design of the study; in the collection, analyses, or interpretation of data; in the writing of the manuscript; or in the decision to publish the results.

References

  1. Ji, L.; Peters, A.J. Assessing vegetation response to drought in the northern Great Plains using vegetation and drought indices. Remote Sens. Environ. 2003, 87, 85–98. [Google Scholar] [CrossRef]
  2. Mishra, A.K.; Singh, V.P. A review of drought concepts. J. Hydrol. 2010, 391, 202–216. [Google Scholar] [CrossRef]
  3. Jiang, C.; Wang, Y.; Yang, Z.; Zhao, Y. Do adaptive policy adjustments deliver ecosystem-agriculture-economy co-benefits in land degradation neutrality efforts? Evidence from southeast coast of China. Environ. Monit. Assess. 2023, 195, 1215. [Google Scholar] [CrossRef] [PubMed]
  4. Li, J.; Zhao, Y.; Chen, D.; Zhao, P.; Zhang, C.; Wang, Y. The Quantitative Role of Moisture and Vertical Motion in Shaping Summer Heavy Rainfall over North China under Two Distinct Large-Scale Weather Patterns. J. Clim. 2024, 37, 2655–2672. [Google Scholar] [CrossRef]
  5. Zhang, J.; Wang, S.; Huang, J.; He, Y.; Ren, Y. The precipitation-recycling process enhanced extreme precipitation in Xinjiang, China. Geophys. Res. Lett. 2023, 50, e2023GL104324. [Google Scholar] [CrossRef]
  6. Li, R.; Zhu, G.; Lu, S.; Sang, L.; Meng, G.; Chen, L.; Jiao, Y.; Wang, Q. Effects of urbanization on the water cycle in the Shiyang River basin: Based on a stable isotope method. Hydrol. Earth Syst. Sci. 2023, 27, 4437–4452. [Google Scholar] [CrossRef]
  7. Mohammad, A.H.; Jung, H.C.; Odeh, T.; Bhuiyan, C.; Hussein, H. Understanding the impact of droughts in the Yarmouk Basin, Jordan: Monitoring droughts through meteorological and hydrological drought indices. Arab. J. Geosci. 2018, 11, 103. [Google Scholar] [CrossRef]
  8. Xie, D.; Huang, H.; Feng, L.; Sharma, R.P.; Chen, Q.; Liu, Q.; Fu, L. Aboveground biomass prediction of arid shrub-dominated community based on airborne Lidar through parametric and nonparametric methods. Remote Sens. 2023, 15, 3344. [Google Scholar] [CrossRef]
  9. Masih, I.; Maskey, S.; Mussá, F.; Trambauer, P. A review of droughts on the African continent: A geospatial and long-term perspective. Hydrol. Earth Syst. Sci. 2014, 18, 3635–3649. [Google Scholar] [CrossRef]
  10. Cheng, P.; Wu, L.; Zhang, H.; Zhou, J. Inclusion of root water absorption and reinforcement in upper bound limit stability analysis of vegetated slopes. Comput. Geotech. 2024, 169, 106227. [Google Scholar] [CrossRef]
  11. Yin, L.; Wang, L.; Keim, B.D.; Konsoer, K.; Yin, Z.; Liu, M.; Zheng, W. Spatial and wavelet analysis of precipitation and river discharge during operation of the Three Gorges Dam, China. Ecol. Indic. 2023, 154, 110837. [Google Scholar] [CrossRef]
  12. Ren, Y.; Liu, J.; Shalamzari, M.J.; Arshad, A.; Liu, S.; Liu, T.; Tao, H. Monitoring recent changes in drought and wetness in the source region of the Yellow River basin, China. Water 2022, 14, 861. [Google Scholar] [CrossRef]
  13. Karimi, V.; Karami, E.; Keshavarz, M. Climate change and agriculture: Impacts and adaptive responses in Iran. J. Integr. Agric. 2018, 17, 1–15. [Google Scholar] [CrossRef]
  14. Afshar, M.H.; Bulut, B.; Duzenli, E.; Amjad, M.; Yilmaz, M. Global spatiotemporal consistency between meteorological and soil moisture drought indices. Agric. For. Meteorol. 2022, 316, 108848. [Google Scholar] [CrossRef]
  15. Salimi, H.; Asadi, E.; Darbandi, S. Meteorological and hydrological drought monitoring using several drought indices. Appl. Water Sci. 2021, 11, 11. [Google Scholar] [CrossRef]
  16. Kheyruri, Y.; Nikaein, E.; Sharafati, A. Spatial monitoring of meteorological drought characteristics based on the NASA POWER precipitation product over various regions of Iran. Environ. Sci. Pollut. Res. 2023, 30, 43619–43640. [Google Scholar] [CrossRef]
  17. Fawen, L.; Manjing, Z.; Yong, Z.; Rengui, J. Influence of irrigation and groundwater on the propagation of meteorological drought to agricultural drought. Agric. Water Manag. 2023, 277, 108099. [Google Scholar] [CrossRef]
  18. Zhang, F.; Cui, N.; Guo, S.; Yue, Q.; Jiang, S.; Zhu, B.; Yu, X. Irrigation strategy optimization in irrigation districts with seasonal agricultural drought in southwest China: A copula-based stochastic multiobjective approach. Agric. Water Manag. 2023, 282, 108293. [Google Scholar] [CrossRef]
  19. Wang, T.; Tu, X.; Singh, V.P.; Chen, X.; Lin, K.; Zhou, Z.; Tan, Y. Assessment of future socioeconomic drought based on CMIP6: Evolution, driving factors and propagation. J. Hydrol. 2023, 617, 129009. [Google Scholar] [CrossRef]
  20. Valenzuela-Morales, G.; Hernández-Téllez, M.; Fonseca-Ortiz, C.; Gómez-Albores, M.; Esquivel-Ocadiz, A.; Arévalo-Mejía, R.; Mejía-Olivares, A.; Mastachi-Loza, C. Climatic and socioeconomic regionalization of the meteorological drought in Mexico using a predictive algorithm. Nat. Hazards 2023, 117, 1381–1403. [Google Scholar] [CrossRef]
  21. Hoover, D.L.; Hajek, O.L.; Smith, M.D.; Wilkins, K.; Slette, I.J.; Knapp, A.K. Compound hydroclimatic extremes in a semi-arid grassland: Drought, deluge, and the carbon cycle. Glob. Chang. Biol. 2022, 28, 2611–2621. [Google Scholar] [CrossRef] [PubMed]
  22. de Medeiros, F.J.; Gomes, R.d.S.; Coutinho, M.D.L.; Lima, K.C. Meteorological droughts and water resources: Historical and future perspectives for Rio Grande do Norte state, Northeast Brazil. Int. J. Climatol. 2022, 42, 6976–6995. [Google Scholar] [CrossRef]
  23. Zhou, G.; Lin, G.; Liu, Z.; Zhou, X.; Li, W.; Li, X.; Deng, R. An optical system for suppression of laser echo energy from the water surface on single-band bathymetric LiDAR. Opt. Lasers Eng. 2023, 163, 107468. [Google Scholar] [CrossRef]
  24. Zhou, G.; Zhang, H.; Xu, C.; Zhou, X.; Liu, Z.; Zhao, D.; Lin, J.; Wu, G. A real-time data acquisition system for single-band bathymetric LiDAR. IEEE Trans. Geosci. Remote Sens. 2023, 61, 1–21. [Google Scholar] [CrossRef]
  25. Xu, J.; Zhou, G.; Su, S.; Cao, Q.; Tian, Z. The development of a rigorous model for bathymetric mapping from multispectral satellite-images. Remote Sens. 2022, 14, 2495. [Google Scholar] [CrossRef]
  26. Du, W.; Wang, G. Intra-event spatial correlations for cumulative absolute velocity, Arias intensity, and spectral accelerations based on regional site conditions. Bull. Seismol. Soc. Am. 2013, 103, 1117–1129. [Google Scholar] [CrossRef]
  27. Liu, Y.; Chen, J. Socioeconomic risk of droughts under a 2.0 C warmer climate: Assessment of population and GDP exposures to droughts in China. Int. J. Climatol. 2021, 41, E380–E391. [Google Scholar] [CrossRef]
  28. Raza, A.; Mubarik, M.S.; Sharif, R.; Habib, M.; Jabeen, W.; Zhang, C.; Chen, H.; Chen, Z.H.; Siddique, K.H.; Zhuang, W. Developing drought-smart, ready-to-grow future crops. Plant Genome 2023, 16, e20279. [Google Scholar] [CrossRef]
  29. Kogan, F.N. Application of vegetation index and brightness temperature for drought detection. Adv. Space Res. 1995, 15, 91–100. [Google Scholar] [CrossRef]
  30. Sun, L.; Wang, Q.; Chen, Y.; Zheng, Y.; Wu, Z.; Fu, L.; Jeon, B. CRNet: Channel-enhanced remodeling-based network for salient object detection in optical remote sensing images. IEEE Trans. Geosci. Remote Sens. 2023, 61, 5618314. [Google Scholar] [CrossRef]
  31. Chen, X.; Xie, D.; Zhang, Z.; Sharma, R.P.; Chen, Q.; Liu, Q.; Fu, L. Compatible Biomass Model with Measurement Error Using Airborne LiDAR Data. Remote Sens. 2023, 15, 3546. [Google Scholar] [CrossRef]
  32. Abu Arra, A.; Şişman, E. Innovative Drought Classification Matrix and Acceptable Time Period for Temporal Drought Evaluation. Water Resour. Manag. 2024, 38, 2811–2833. [Google Scholar] [CrossRef]
  33. Han, Y.; Li, Z.; Huang, C.; Zhou, Y.; Zong, S.; Hao, T.; Niu, H.; Yao, H. Monitoring droughts in the Greater Changbai Mountains using multiple remote sensing-based drought indices. Remote Sens. 2020, 12, 530. [Google Scholar] [CrossRef]
  34. Anyamba, A.; Tucker, C.J. Analysis of Sahelian vegetation dynamics using NOAA-AVHRR NDVI data from 1981–2003. J. Arid Environ. 2005, 63, 596–614. [Google Scholar] [CrossRef]
  35. Vicente-Serrano, S.M.; Pons-Fernández, X.; Cuadrat-Prats, J. Mapping soil moisture in the central Ebro river valley (northeast Spain) with Landsat and NOAA satellite imagery: A comparison with meteorological data. Int. J. Remote Sens. 2004, 25, 4325–4350. [Google Scholar] [CrossRef]
  36. Jiao, W.; Zhang, L.; Chang, Q.; Fu, D.; Cen, Y.; Tong, Q. Evaluating an enhanced vegetation condition index (VCI) based on VIUPD for drought monitoring in the continental United States. Remote Sens. 2016, 8, 224. [Google Scholar] [CrossRef]
  37. Singh, R.P.; Roy, S.; Kogan, F. Vegetation and temperature condition indices from NOAA AVHRR data for drought monitoring over India. Int. J. Remote Sens. 2003, 24, 4393–4402. [Google Scholar] [CrossRef]
  38. Shamsipour, A.; Alavipanah, S.; Mohammadi, H. Efficiency of vegetation and thermal indices of NOAA-AVHRR satellite in ecological drought analysis of Kashan region. Iran. J. Range Desert Res. 2010, 17, 445–465. [Google Scholar] [CrossRef]
  39. Zamanian, M.T.; Behyar, M.B.; Karimi, H.A.; Dost, M.V. Monitoring and Analyzing Agricultural Drought Using Satellite Products of NOAA-AVHRR Sensor. J. Climatol. 2012, 3, 33–54. [Google Scholar]
  40. Pourmohammadi, S.; Rahimian, M.H. Determination Drought indices of Evaporative Stress Index (ESI) and Vegetation Health Index (VHI) in the Tuyserkan catchment using MODIS Satellite Images. Appl. Geogr. Inf. Syst. Remote Sens. Plan. 2017, 8, 63–74. [Google Scholar]
  41. Pourkhosravani, M.; Mehrabi, A.; Mousavi, S.H. Drought Spatial Analysis of Sirjan Basin Using Remote Sensing. Desert Ecosyst. Eng. 2018, 7, 13–22. [Google Scholar] [CrossRef]
  42. Jackson, R.D.; Idso, S.; Reginato, R.; Pinter, P., Jr. Canopy temperature as a crop water stress indicator. Water Resour. Res. 1981, 17, 1133–1138. [Google Scholar] [CrossRef]
  43. Yi, J.; Li, H.; Zhao, Y.; Zhang, H.; Liu, M. Assessing soil water balance to optimize irrigation schedules of flood-irrigated maize fields with different cultivation histories in the arid region. Agric. Water Manag. 2022, 265, 107543. [Google Scholar] [CrossRef]
  44. Zhao, Y.; Wang, H.; Song, B.; Xue, P.; Zhang, W.; Peth, S.; Hill, R.L.; Horn, R. Characterizing uncertainty in process-based hydraulic modeling, exemplified in a semiarid Inner Mongolia steppe. Geoderma 2023, 440, 116713. [Google Scholar] [CrossRef]
  45. Zhang, K.; Li, Y.; Yu, Z.; Yang, T.; Xu, J.; Chao, L.; Ni, J.; Wang, L.; Gao, Y.; Hu, Y. Xin’anjiang nested experimental watershed (XAJ-NEW) for understanding multiscale water cycle: Scientific objectives and experimental design. Engineering 2022, 18, 207–217. [Google Scholar] [CrossRef]
  46. Huang, L.S.; Guan, Q.S.; Dong, Y.S.; Zhang, D.Y.; Huang, W.J.; Liang, D. Using Temperature Vegetation Drought Index for Monitoring Drought Based on Remote Sensing Data. Adv. Mater. Res. 2012, 356, 2854–2859. [Google Scholar] [CrossRef]
  47. Chen, J.; Wilson, C.; Tapley, B.; Longuevergne, L.; Yang, Z.; Scanlon, B. Recent La Plata basin drought conditions observed by satellite gravimetry. J. Geophys. Res. Atmos. 2010, 115, 1–12. [Google Scholar] [CrossRef]
  48. Chang, S.; Chen, H.; Wu, B.; Nasanbat, E.; Yan, N.; Davdai, B. A practical satellite-derived vegetation drought index for arid and semi-arid grassland drought monitoring. Remote Sens. 2021, 13, 414. [Google Scholar] [CrossRef]
  49. Al Bakri, J.; Rakonczai, J. Applicability of a Combined Drought Index to Monitoring Drought in Jordan. J. Eng. Res. Appl. 2019, 9, 20–39. [Google Scholar]
  50. Amiri, M.; Jafari, R.; Tarkesh, M.; Modarres, R. Spatiotemporal variability of soil moisture in arid vegetation communities using MODIS vegetation and dryness indices. Arid Land Res. Manag. 2020, 34, 1–25. [Google Scholar] [CrossRef]
  51. Akinyemi, F.O.; Kgomo, M.O. Vegetation dynamics in African drylands: An assessment based on the Vegetation Degradation Index in an agro-pastoral region of Botswana. Reg. Environ. Chang. 2019, 19, 2027–2039. [Google Scholar] [CrossRef]
  52. dos Santos, G.L.; Pereira, M.G.; Delgado, R.C.; Magistrali, I.C.; da Silva, C.G.; de Oliveira, C.M.M.; Larangeira, J.P.B.; da Silva, T.P. Degradation of the Brazilian Cerrado: Interactions with human disturbance and environmental variables. For. Ecol. Manag. 2021, 482, 118875. [Google Scholar] [CrossRef]
  53. BAJGIRAN, P.R.; Shimizu, Y.; Hosoi, F.; OMASA, K. MODIS vegetation and water indices for drought assessment in semi-arid ecosystems of Iran. J. Agric. Meteorol. 2009, 65, 349–355. [Google Scholar] [CrossRef]
  54. Sandholt, I.; Rasmussen, K.; Andersen, J. A simple interpretation of the surface temperature/vegetation index space for assessment of surface moisture status. Remote Sens. Environ. 2002, 79, 213–224. [Google Scholar] [CrossRef]
  55. Son, N.T.; Chen, C.; Chen, C.; Chang, L.; Minh, V.Q. Monitoring agricultural drought in the Lower Mekong Basin using MODIS NDVI and land surface temperature data. Int. J. Appl. Earth Obs. Geoinf. 2012, 18, 417–427. [Google Scholar] [CrossRef]
  56. Thomas, A.C.; Reager, J.T.; Famiglietti, J.S.; Rodell, M. A GRACE-based water storage deficit approach for hydrological drought characterization. Geophys. Res. Lett. 2014, 41, 1537–1545. [Google Scholar] [CrossRef]
  57. Zhang, D.; Zhang, Q.; Werner, A.D.; Liu, X. GRACE-based hydrological drought evaluation of the Yangtze River Basin, China. J. Hydrometeorol. 2016, 17, 811–828. [Google Scholar] [CrossRef]
  58. Almamalachy, Y.S.; Al-Quraishi, A.M.F.; Moradkhani, H. Agricultural drought monitoring over Iraq utilizing MODIS products. Environ. Remote Sens. GIS Iraq 2020, 2, 253–278. [Google Scholar] [CrossRef]
  59. Rodell, M.; Chen, J.; Kato, H.; Famiglietti, J.S.; Nigro, J.; Wilson, C.R. Estimating groundwater storage changes in the Mississippi River basin (USA) using GRACE. Hydrogeol. J. 2007, 15, 159–166. [Google Scholar] [CrossRef]
  60. Ahmadalipour, A.; Moradkhani, H. Analyzing the uncertainty of ensemble-based gridded observations in land surface simulations and drought assessment. J. Hydrol. 2017, 555, 557–568. [Google Scholar] [CrossRef]
  61. Kogan, F.N. Operational space technology for global vegetation assessment. Bull. Am. Meteorol. Soc. 2001, 82, 1949–1964. [Google Scholar] [CrossRef]
  62. Sun, H.; Zhao, X.; Chen, Y.; Gong, A.; Yang, J. A new agricultural drought monitoring index combining MODIS NDWI and day–night land surface temperatures: A case study in China. Int. J. Remote Sens. 2013, 34, 8986–9001. [Google Scholar] [CrossRef]
  63. Gao, B.-C. NDWI—A normalized difference water index for remote sensing of vegetation liquid water from space. Remote Sens. Environ. 1996, 58, 257–266. [Google Scholar] [CrossRef]
  64. Zhang, N.; Hong, Y.; Qin, Q.; Liu, L. VSDI: A visible and shortwave infrared drought index for monitoring soil and vegetation moisture based on optical remote sensing. Int. J. Remote Sens. 2013, 34, 4585–4609. [Google Scholar] [CrossRef]
  65. Gao, Z.; Gao, W.; Chang, N.-B. Integrating temperature vegetation dryness index (TVDI) and regional water stress index (RWSI) for drought assessment with the aid of LANDSAT TM/ETM+ images. Int. J. Appl. Earth Obs. Geoinf. 2011, 13, 495–503. [Google Scholar] [CrossRef]
  66. Madadgar, S.; Moradkhani, H. Spatio-temporal drought forecasting within Bayesian networks. J. Hydrol. 2014, 512, 134–146. [Google Scholar] [CrossRef]
  67. Swenson, S.; Wahr, J. Methods for inferring regional surface-mass anomalies from Gravity Recovery and Climate Experiment (GRACE) measurements of time-variable gravity. J. Geophys. Res. Solid Earth 2002, 107, ETG 3-1–ETG 3-13. [Google Scholar] [CrossRef]
  68. Yirdaw, S.Z.; Snelgrove, K.R.; Agboma, C.O. GRACE satellite observations of terrestrial moisture changes for drought characterization in the Canadian Prairie. J. Hydrol. 2008, 356, 84–92. [Google Scholar] [CrossRef]
  69. Agboma, C.; Yirdaw, S.; Snelgrove, K. Intercomparison of the total storage deficit index (TSDI) over two Canadian Prairie catchments. J. Hydrol. 2009, 374, 351–359. [Google Scholar] [CrossRef]
  70. Cao, Y.; Nan, Z.; Cheng, G. GRACE gravity satellite observations of terrestrial water storage changes for drought characterization in the arid land of northwestern China. Remote Sens. 2015, 7, 1021–1047. [Google Scholar] [CrossRef]
  71. Wanders, N.; van Lanen, H.A.; van Loon, A.F. Indicators for Drought Characterization on a Global Scale; Wageningen Universiteit: Wageningen, The Netherlands, 2010. [Google Scholar]
  72. Narasimhan, B.; Srinivasan, R. Development and evaluation of Soil Moisture Deficit Index (SMDI) and Evapotranspiration Deficit Index (ETDI) for agricultural drought monitoring. Agric. For. Meteorol. 2005, 133, 69–88. [Google Scholar] [CrossRef]
  73. Vermote, E. MOD09A1 MODIS/terra surface reflectance 8-day L3 global 500m SIN grid V006. NASA EOSDIS Land Process. DAAC 2015, 10. [Google Scholar]
  74. Cohen, I.; Huang, Y.; Chen, J.; Benesty, J.; Benesty, J.; Chen, J.; Huang, Y.; Cohen, I. Pearson correlation coefficient. Noise Reduct. Speech Process. 2009, 1–4. [Google Scholar]
  75. Sharma, T.; Panu, U. Predicting return periods of hydrological droughts using the Pearson 3 distribution: A case from rivers in the Canadian prairies. Hydrol. Sci. J. 2015, 60, 1783–1796. [Google Scholar] [CrossRef]
  76. Zare-Abianeh, H.; Sabzi-Parvar, A.A.; Maroufi, S.; Qiami, F.; Kazemi, S.S.M.-M.A. Meteorological drought analysis and monitoring in Sistan and Balouchestan region. Environ. Sci. Technol. Q. 2015, 3, 49–61. [Google Scholar] [CrossRef]
  77. Piri, H.; Ansari, H. Studying the drought of the Sistan plain and its impact on Hamon International Wetland. Wetl. Ecobiol. 2013, 15, 63–74. [Google Scholar]
  78. Kohkhakohan, M.S.; Ranjbar-Ferdavi, A.; Mousavi, S.H.; Wali, A.A. Assessment of drought dynamics in Sistan and Balouchestan province using MODIS satellite data (2000–2015). Pasture Desert Res. Iran 2019, 26, 754–771. [Google Scholar] [CrossRef]
  79. Khosravi, M. The environmental effects of the interaction of Hirmand river fluctuations with the 120-day winds of Sistan. Publ. Geogr. Res. 2009, 23, 19–48. [Google Scholar]
  80. Mahmoudi, P.; Shirazi, S.A.; Firoozi, F.; Jahanshahi, S.M.A.; Mazhar, N. Detection of land cover changes in Balouchestan (shared between Iran, Pakistan, and Afghanistan) using the MODIS Land Cover Product. Arab. J. Geosci. 2020, 13, 1–14. [Google Scholar] [CrossRef]
  81. Alizadeh, A.; Ansari, H.; Ershadi, S.; Toosi, S.A. Drought monitoring and forecasting in Sistan and Balouchestan province. Geogr. Reg. Dev. 2009, 11, 5–17. [Google Scholar]
  82. Faraji, Z.; Kaviani, A.; Shakiba, A. Evaluation of Evapotranspiration, Precipitation and Air Temperature from Global Land Data Assimilation System (GLDAS) by Lysimeter Data in Qazvin. J. Water Soil Prot. Res. 2017, 24, 283–297. [Google Scholar] [CrossRef]
  83. Nasr-Azadegan, A.; Shams, S.; Fard’, H.K. Investigating changes in soil moisture and precipitation and their impact on dust production in Mesopotamia between 2001 and 2014. In Proceedings of the Third Regional Conference on Climate Change and Global Warming, Zanjan City, Iran, 8 March 2016. [Google Scholar]
  84. Firoozi, F.; Mahmoudi, P.; Jahanshahi, S.M.A.; Tavousi, T.; Liu, Y.; Liang, Z. Modeling changes trend of time series of land surface temperature (LST) using satellite remote sensing productions (case study: Sistan plain in east of Iran). Arab. J. Geosci. 2020, 13, 1–14. [Google Scholar] [CrossRef]
  85. Piri, H.; Rahdari, V.; Maleki, S. Study and compare performance of four meteorological drought index in the risk management droughts in Sistan and Balouchestan province. Irrig. Water Eng. 2013, 3, 96–114. [Google Scholar]
  86. Khosnoodi Far, Z.; Ghanji, M.; Mojtabi, S. Assessing the Vulnerability of Drought Beneficiaries and Analyzing the Components Explaining Drought Crisis Management (Case Study: Sistan and Balouchestan Province). Nat. Environ. Hazards 2022, 11, 135–154. [Google Scholar]
  87. Mahmoudi, P.; Tavosi, T.; Shahuzai, A.R. Drought and Its Effects on Groundwater Resources Quality in Sistan and Balouchestan Province. Water Res. Agric. 2015, 29, 21–35. [Google Scholar]
Figure 1. (a): The location of Sistan and Balouchestan province in Iran. (b): The studied watersheds (50 grade 3 watersheds). (c): Land cover using MCD12Q1 images for year 2018.
Atmosphere 15 01211 g001
Figure 2. Flowchart of the study.
Atmosphere 15 01211 g002
Figure 3. Correlation coefficient between the elements of the indicators.
Atmosphere 15 01211 g003
Figure 4. Comparison of GLDAS precipitation with Iranshahr synoptic station precipitation.
Atmosphere 15 01211 g004
Figure 5. The spatial significance level of the correlation (a), and the percentage of each correlation level (b) between the four studied indicators and GLDAS precipitation.
Atmosphere 15 01211 g005
Figure 6. VHI index in the month of April during the 16 years of the study period. The images are arranged chronologically from left to right, starting in 2002 and ending in 2017.
Atmosphere 15 01211 g006
Figure 7. VDI index in the month of April during the 16 years of the study period. The images are arranged chronologically from left to right, starting in 2002 and ending in 2017.
Atmosphere 15 01211 g007
Figure 8. VSDI index in the month of April during the 16 years of the study period. The images are arranged chronologically from left to right, starting in 2002 and ending in 2017.
Atmosphere 15 01211 g008
Figure 9. TVDI index in the month of April during the 16 years of the study period. The images are arranged chronologically from left to right, starting in 2002 and ending in 2017.
Atmosphere 15 01211 g009
Figure 10. Calculation of the average deficit of the basins of Sistan and Balouchestan Province.
Atmosphere 15 01211 g010
Figure 11. Drought severity classification using the TSDI index in the studied station of Sistan and Balouchestan.
Atmosphere 15 01211 g011
Table 1. Data resolution used in this study.
Date of Data CollectionSatelliteData
Layer
From April 2002 to April 2017MODIS/MOD11A1LST daily time resolution
From April 2002 to April 2017MODIS/MOD13A3NDVI monthly time resolution
From April 2002 to April 2017MODIS/MOD02HKMLEVEL 1B data, daily time resolution
Preciptaion Noah 0–10 cm
From April 2002 to June 2017
NASA Global Land Data Assimilation SystemGLDAS Noah Land Surface Model L4 monthly
CSR Mascon RL06
From April 2002 to April 2017
GRACE/TWSRL06_Mascons_all-corrections_v02 (3).NETCDF
MCD12Q1, 2002–2017MODIS/Terra + Aqua Land Cover Type YearlyLand Cover Type 2: Annual University of Maryland (UMD) classification
1987–2018Zahedan, Zabul, Saravan, Khash, Iranshahr, and Chabahar synoptic stationsdaily rainfall
Table 2. Classification of the drought indices compared in this study [29,54,56,62,73].
ClassVHIVDIVSDITVDITSDI
Extreme/Exceptional drought≤10≤13>0.64Extremely dry≤1Extreme/Exceptional drought ≥−2
Severe drought≤20≤22≥0.64Dry≤0.8Severe drought−1.5 to −1.99
Moderate drought≤30≤32≥0.68Normal≤0.6Moderate drought−1 to −1.49
Abnormally dry≤40≤41≥0.71Wet≤0.4Mild drought0 to −0.99
No drought>40>41≥0.75Extremely wet≤0.2Normal0 to 0.99
Moderate wet1 to 1.49
Severe wet1.5 to 1.99
Extreme wet≥2
Table 3. Table of characteristics of selected watersheds.
NoThe Location of the WatershedBasin NameArea in km
26North of the provinceZabol3075/28
19Hamon Hirmand4176.57
1Center of the provinceAbkhan3076.1
6Iranshahr–Bampur10,051.98
10South of the provinceBandini2290.13
47Niskoofan–ChaBahar1143.60
Table 4. Characteristics of drought periods in the studied basins of Sistan and Balouchestan.
AreaNo. of Event
Duration of with ≥4 Months
Time Span of Each EventDuration (Months)Average
Deficit km3
Total Severity km3 per Month
Rahmatabad Basin5Apr 2003–Jul 20034−0.87−3.51
Mar 2004–Nov 20049−2.28−20.5
May 2008–Dec 20088−1.58−12.68
May 2009–Dec 20098−2.71−21.67
Feb 2010–Jun 201789−7.48−655.99
Niskoofan Basin10Apr 2002–July 20024−0.7−2.8
Mar 2003–Jun 20034−0.93−3.72
Mar 2004–Oct 20048−1.205−9.643
Apr 2006–Aug 20065−1.193−5.695
Jun 2008–Sep 20084−1.059−4.234
May 2009–Dec 20098−1.37−10.963
Mar 2010–Jul 20105−0.967−4.833
Apr 2011–Jul 20114−2.076−8.302
Jun 2012–Feb 201426−1.52−39.47
Jan 2015–Jun 201730−3.707−111.214
Disclaimer/Publisher’s Note: The statements, opinions and data contained in all publications are solely those of the individual author(s) and contributor(s) and not of MDPI and/or the editor(s). MDPI and/or the editor(s) disclaim responsibility for any injury to people or property resulting from any ideas, methods, instructions or products referred to in the content.