Article

Quality Assessment of ERA5 Wind Speed and Its Impact on Atmosphere Environment Using Radar Profiles along the Bohai Bay Coastline

1
China Meteorological Administration Xiong’an Atmospheric Boundary Layer Key Laboratory, Xiong’an New Area, Baoding 071800, China
2
School of Electronic Science and Engineering, Hunan University of Information Technology, Changsha 410000, China
3
Key Laboratory of Intelligent Monitoring on Navigation Safety, Hunan University of Information Technology, Changsha 410000, China
4
College of Computer, National University of Defense Technology, Changsha 410000, China
5
Key Laboratory of Meteorology and Ecological Environment of Hebei Province, Shijiazhuang 050021, China
6
Hebei Cangzhou Meteorological Observatory, Cangzhou 061000, China
7
Northwest Institute of Eco-Environment and Resources, Chinese Academy of Sciences, Beijing 100029, China
8
School of Geoscience and Technology, Zhengzhou University, Zhengzhou 450001, China
9
College of Resource and Environment, Northeast Agricultural University, Harbin 150030, China
10
Key Laboratory of Smart Earth, Beijing 100094, China
*
Authors to whom correspondence should be addressed.
Atmosphere 2024, 15(10), 1153; https://doi.org/10.3390/atmos15101153
Submission received: 19 August 2024 / Revised: 8 September 2024 / Accepted: 19 September 2024 / Published: 26 September 2024

Abstract

:
The accuracy of ERA5 reanalysis datasets and their applicability in the coastal area of Bohai Bay are crucial for weather forecasting and environmental protection research. However, synthesis evaluation of ERA5 in this region remains lacking. In this study, using a tropospheric wind profile radar (CFL-06L) placed in coastal Huanghua city, the deviations of ERA5 reanalysis data are assessed from the ground to an altitude of 5 km. The results indicate that the wind speed of ERA5 reanalysis data exhibits good consistency from the surface to the tropospheric level of about 5 km, with R2 values ranging from 0.5 to 0.85. The lowest mean wind speed error, less than 3 m/s, occurs in the middle layer, while larger errors are observed at the surface and upper layers. Specifically, at 150 m, the R2 is as low as 0.5, with numerous outliers around 5000 m. Seasonal analysis shows that the ERA5 wind field performs best in summer and worst in autumn and winter, especially at lower levels affected by circulation systems, high stratus clouds, and aerosols, with errors reaching up to 10 m/s. Further analysis of extreme weather events, such as heavy rain; hot, dry winds; and snowstorms, reveals that the effects of sea-land winds and strong convective systems significantly impact the observation of wind profiles and the assimilation of reanalysis data, particularly under the constrain of boundary layer height. Additionally, we also find that the transition of sea-land breeze is capable of triggering the nighttime low-level jet, thereby downward transporting the aloft ozone to the ground and resulting in an abnormal increase in the surface ozone concentration. The study provides a scientific basis for improving meteorological forecasting, optimizing wind energy resource utilization, and formulating environmental protection policies, highlighting its significant scientific and practical application value.

1. Introduction

Atmospheric wind profile detection plays a pivotal role in meteorology, aviation, and environmental monitoring. The ability to understand and quantify long-term variations and refined features of the wind field is integral to enhancing the accuracy of numerical weather prediction models and advancing our understanding of atmospheric circulation patterns [1,2,3,4,5]. High-precision wind profile detection also helps identify and predict important weather phenomena such as wind shear and sea-land breeze, providing essential support for preventing and mitigating the impacts of storms and hurricanes and ensuring flight safety [6,7,8,9]. Therefore, high-precision observation and correction of wind profile data are significant for the development of refined numerical forecasts, especially for coastal environments where wind profile detection is severely lacking. Furthermore, vertical wind structure and its variations directly impact atmospheric environmental issues such as particulate pollution and exhaust dispersion [10,11,12,13,14]. Currently, direct detection like radiosondes is the main way to obtain atmospheric wind profiles, which provide accurate data but suffer from the discontinuous observations and heights caused by the rapid position shifts of balloons [15,16,17]. In addition, indirect detection based on dynamic physical laws, such as wind profile radars that use the Doppler effect to obtain horizontal and vertical wind parameters, offers not only high temporal and spatial resolution but also high precision and continuous all-weather high-altitude observations [18,19,20,21]. Moreover, domestic atmospheric detection radars mainly include L-band radiosondes and radar. L-band radiosondes are used for comprehensive high-altitude atmospheric detection, measuring key meteorological elements such as wind direction, wind speed, temperature, pressure, and humidity, providing fundamental data for weather prediction and research. Radar has a wide field of view and can maintain stable detection performance even in adverse weather conditions such as rain and fog, making it suitable for high-precision atmospheric composition measurements [22,23]. Therefore, the methodologies employed in this study not only fill significant gaps in our current capabilities in atmospheric observation and analysis but also pave the way for more informed environmental management and policy-making. This approach significantly contributes to our ability to safeguard public health and safety while fostering a deeper understanding of atmospheric sciences.
With existing detection methods, complex atmospheric phenomena such as sea-land breeze and their impact mechanisms can be better studied [24,25,26,27]. As local circulation occurring in coastal areas, sea-land breeze circulation is driven by temperature differences and exhibits periodic diurnal variations. The variation patterns of the sea breeze blowing from the sea to the land during the day and the land breeze blowing from the land to the sea at night constitute this local circulation system [28,29,30,31,32,33]. Previous studies have provided valuable insights into these phenomena. For instance, Cui et al. [34] utilized ERA5 reanalysis data to analyze sea breeze characteristics in the southeastern coastal region of China, validating their findings against radiosonde data, and demonstrated good consistency between reanalysis data and observed wind speeds despite the low temporal resolution of the validation data. Similarly, Deng et al. [35] compared horizontal wind vertical profiles observed in Anhui with ERA5 reanalysis data, finding that horizontal wind discrepancies increase with height but fit well at lower atmospheric levels. Zhou et al. [36] analyzed the structure and role of low-level jets during two heavy rainfall events in southern China using wind profile radar and ERA5 data, indicating that ERA5 data has a certain reference value in extreme weather events. Such knowledge is vital for developing targeted environmental policies that aim to mitigate pollution episodes in urban coastal environments, where the impact of sea-land breezes is most pronounced. The ability to predict these dynamics allows for better planning and response strategies, potentially reducing the health and economic impacts of poor air quality episodes. By advancing our understanding of these complex atmospheric interactions, many recent studies also support the refinement of numerical weather prediction models, especially in wind energy applications [37,38]. This refinement enhances the models’ utility in simulating and predicting local weather wind energy with higher precision, which is indispensable for effective weather warning systems and for minimizing the adverse impacts of severe weather conditions.
When evaluating the quantification of ERA5 wind speed, many previous studies have also proved that it is applicable in many regions all around the world by comparing it with observations. For example, a study comparing ERA5 reanalysis wind speed data against in-situ measurements from 205 UK stations found mean wind speed biases of +0.166 m/s onshore and −0.136 m/s offshore, with larger errors in low wind speed event predictions, particularly during autumn and winter. Despite these biases, ERA5 outperforms other global reanalysis products in the UK for predicting low wind speed events [39]. Chen et al. [40] evaluate ERA5’s representation of extratropical cyclones (ETCs) in central and eastern North America, revealing that ERA5 accurately predicts wind speeds with a small normalized mean bias. Moreover, ERA5 significantly underestimates the most extreme 5% of ETCs, highlighting notable limitations for high-impact event analysis. These analyses collectively demonstrate the broad applicability of ERA5 reanalysis data. However, they also underscore the need for regional calibration, especially in areas with complex topographies or extreme weather conditions.
The Bohai Sea is the northernmost offshore sea in China. Bohai Bay is one of the three bays of the Bohai Sea in China, and it is one of the typical areas affected by sea and land winds. Bohai Bay is small in area, surrounded by land on three sides, and with many cities scattered along the coast, it is easily affected by extreme weather such as typhoons, extreme precipitation, and cold waves. Considering these significant regional characteristics, this study introduces an innovative approach by integrating high-precision wind profile radar data with ERA5 reanalysis datasets to study the refined effects of long-term sea-land wind circulation on local wind fields in Huanghua, a coastal city in Bohai Bay. By employing this novel integration of observational radar data and global reanalysis datasets, our methodology offers a more robust framework for capturing the dynamic variability of wind profiles across different scales and conditions. Furthermore, our research contributes significantly to the field by quantitatively analyzing the relative errors within the 0–5 km range of the observed wind fields, providing critical insights into the limitations and biases present in reanalysis data. Additionally, this work explores the exacerbating factors of ground-level O3 pollution in coastal environments, examining the role of low-level jets in nighttime O3 concentration variations. These aspects underscore the importance of our methodological advancements in addressing the challenges of atmospheric science, particularly in coastal regions susceptible to extreme weather conditions and pollution. By clarifying the underlying mechanisms of local circulation systems and their impact on weather phenomena and environmental conditions, this study not only enhances the predictive capabilities of weather models but also offers practical implications for environmental management and policy-making in coastal zones.
Following the introduction, the structure of this study is outlined as follows. Section 2 provides a detailed description of the study site and methodological approaches, including wind field computation methods and the diagnosis of variables such as the inversion algorithm for boundary layer height, Taylor analysis for forecast accuracy, and discrimination methods for phenomena like low-level jet streams and sea-land breezes. Section 3 presents our results and analysis, segmented into three sections: quantitative comparative analysis of wind field variations against ERA5 data, wind field variations during extreme weather processes, and the impacts of these variations on local ozone levels and the occurrence of low-level jet streams. In Section 4, we discuss the broader implications of our findings, emphasizing their relevance to both theoretical and practical aspects of atmospheric science. The paper concludes with Section 5, where we summarize the key findings and contributions of our study, offering recommendations for future research and potential practical applications in weather forecasting and environmental management.

2. Data and Methods

2.1. Site

This study focuses on the changes in boundary layer height, tropospheric wind structure, and ozone-induced in the coastal area of the west coast of Bohai Bay, as shown in the left picture of Figure 1. The observation period is from 1 January 2020 to 1 January 2022, and the observation site is located in Huanghua Station, Cangzhou City, Hebei Province (117.66° E, 38.40° N). In addition, the hourly ground-level ozone data observed at the Huanghua Environmental Monitoring Station (117.21° E, 38.25° N) is used as the representative value of surface ozone for the coastal area of the western Bohai Bay, as shown in Figure 1a,b.

2.2. Instruments

The actual wind structure was obtained by a tropospheric wind profile radar (CFL-06L), as shown in the right picture of Figure 1. This instrument is a clear sky detection pulse Doppler radar with atmospheric turbulence as a detection target, which can provide a vertical profile of a three-dimensional wind structure (horizontal and vertical). The effective detection height ranges from 150 m to 10,110 m, with a time resolution of 6 min and a minimum vertical resolution of 60 m (120 m and 240 m, optionally). To enhance the clarity and utility of our data for analysis, we have averaged these measurements to a 10-min interval. The antenna design bandwidth of this radar product is 100 MHz, and it can work in the frequency band range of 1270 MHz~1375 MHz. The antenna gain in the full frequency band is greater than or equal to 33 dB. Other parameters are shown in Table 1. The five-beam method is used to obtain the three-dimensional wind structure over the radar. First, the radial wind speeds in the east (Vr90), south (Vr180), west (Vr270), and north directions (Vr0) and the radial wind speed in the vertical direction (Vh) are measured. The elevation angle and azimuth angle of the radar antenna are α and β (90°, 180°, 270°, 0°), respectively. Assuming that the wind distribution is horizontal and uniform, the horizontal wind speeds Vu and Vv (where Vu and Vv represent the longitudinal wind and latitudinal wind components of V, respectively) and the vertical wind speed Vw are obtained through simultaneous equations:
V r = V u cos β sin α + V v sin β cos α + V w cos α V u = ( V r 0 + V r 180 ) / 2 sin α V v = ( V r 90 + V r 270 ) / 2 sin α V w = ( V r 0 + V r 90 + V r 180 + V r 270 ) / 4 cos α + V h V = ( V u 2 + V v 2 ) 1 / 2 θ = arctan ( V u / V v )
Considering the need to study land and sea winds, pollution weather, and some extreme weather processes, this study constructs hour-by-hour refined wind profile datasets from about 150–5500 m by data fusion and data reconstruction to analyze the characteristics of the wind structure and dynamical mechanisms near the west coast of Bohai Bay.

2.3. ERA5 Reanalysis Dataset

For the purposes of comparison and analysis, this study used the horizontal velocities (u and v components) from different isobaric surfaces in the ERA5 reanalysis data from the European Centre for Medium-Range Weather Forecasts (ECMWF) to assess wind radar observations and cubic spline interpolation method to complete the wind profile. The horizontal resolution of ERA5 is 0.25° × 0.25°, with a time resolution of 1 h and a vertical range from 1000 hPa to 1 hPa (41 layers in total).
Distance from Radar to ERA5 Node: The radar site is located approximately 10 km from the nearest ERA5 reanalysis grid point. This distance was considered acceptable for comparison, given the spatial resolution of ERA5 data and the generally consistent terrain between the radar site and the ERA5 node.
Land Surface Type: The radar site is situated in a coastal area characterized by mixed land use, primarily consisting of open fields and some urban infrastructure. The proximity to the coast introduces specific atmospheric dynamics, including sea-land breeze interactions, which are taken into consideration during the analysis.
Roughness Coefficient: The roughness coefficient (z0) for the area surrounding the radar site is estimated to be approximately 0.03 m, typical for open terrain with low vegetation. This parameter influences the wind profile near the surface, and its impact on wind speed measurements has been taken into account during the comparison of ERA5 data and radar observations.

2.4. Diagnose Variables

(1)
Inversion Algorithm of Boundary layer height
ERA5 uses the Bulk Richardson Number (Rib) to calculate the boundary layer height (BLH). The Rib is a dimensionless ratio in meteorology that represents the consumption of turbulence relative to the shear production of turbulence kinetic energy caused by wind shear. It is used to indicate dynamic stability and the formation of turbulence. As the layer thickness approaches zero, the Rib converges to the Gradient Richardson Number, which has a critical value of approximately Ric = 0.25. Values of Rib below this critical threshold indicate dynamic instability and a propensity for turbulence. Therefore, the BLH is identified as the height below which all Rib values in the vertical direction are less than Ric.:
R i b = g θ v Δ θ v Δ θ z ( Δ u ) 2 + ( Δ v ) 2
where g is the gravitational acceleration (9.81 m/s2), θv is the virtual potential temperature, Δθv, Δθz, Δu, and Δv are the difference in virtual potential temperature, height, the u component of wind, and the v component of wind and between a certain height and surface.
(2)
Taylor analysis
Taylor diagrams are often used to evaluate the accuracy of a model, and the commonly used accuracy indicators are correlation coefficient (R), standard deviation (STD), and root mean square error (RMSE). Generally speaking, the scatter in a Taylor diagram represents the model result, the radial line represents the correlation coefficient, the horizontal and vertical axes represent the STD, and the dotted line represents the RMSE.
(3)
Discrimination of low-level jet stream and sea-land breeze
The low-level jet in the boundary layer is defined as the maximum wind speed at the jet core within 1500 m, exceeding the minimum wind speed above and below this height by more than 2 m/s [41]. The outbreak of low-level jets is generally dominated by two factors: the inertial oscillation of shallow winds caused by the removal of turbulent friction after sunset and atmospheric baroclinicity caused by the heterogeneous thermal properties of the surface.
Sea-land breezes are winds caused by the uneven heating of the ocean and land. During the day, the land heats up quickly, forming a low-pressure area over the land and a relatively high-pressure area over the sea. This causes winds to blow from the sea to the land, forming a sea breeze. When it comes to night, the land cools rapidly while the ocean cools slowly, creating a relatively high-pressure area over the land and a low-pressure area over the ocean. As a result, land breezes blowing from the land to the sea are formed [42,43].
In terms of wind structure, the development height of the sea breeze is about 1.5 km, while the height of the land breeze is lower, around a few hundred meters. The coverage of sea and land breezes is affected by factors such as the shape of the coastline, topography, and tides, and generally ranges from a few dozen kilometers to about 100 km. One of the basic characteristics of sea and land breezes is the diurnal reversal of wind direction, which involves both sudden changes in wind direction and sustained changes over time. Therefore, to recognize the formation of a sea breeze or an onshore breeze, not only must there be a significant change in wind direction, but the change in wind direction must last for a certain period of time (usually not less than 2 h). When a sea breeze is established or dissipates, the wind speed and direction at 10 m height will undergo significant changes. During the peak development of the sea breeze, there will be a maximum wind speed (the near-surface wind speed must not exceed 10 m/s) [44].

3. Results

3.1. Quantitative Comparative Analysis

The temporal comparison sequence depicted in Figure 2 highlights the discrepancies between ERA5 reanalysis data and Doppler radar-observed daily mean horizontal wind speeds at various altitudes (150 m, 510 m, 1110 m, 1590 m, 2550 m, and 5070 m). In Figure 2a, the depiction of wind speed at 150 m is presented. The ERA5 line plot indicates slightly elevated horizontal wind speeds compared to observations, with overestimations reaching up to 10 m/s in December 2020 and March 2022. Nevertheless, the overall trends are consistent with actual observations. At an altitude of 510 m (Figure 2b), ERA5 demonstrates notably reduced wind velocities as altitude increases during April-May. Similar patterns emerge around altitudes of 1110 m and 1500 m during May and June 2020 and August to October 2021. Despite lower observed wind speeds in the middle layer, the variation pattern remains coherent with ERA5 data across multiple overlapping areas. The time-series comparison for horizontal windspeeds at 5070 m shown in Figure 2f reveals a significant decrease at higher altitudes, especially in 2020. However, since 2021, the horizontal wind speeds in the ERA5 data closely align with the observed results.
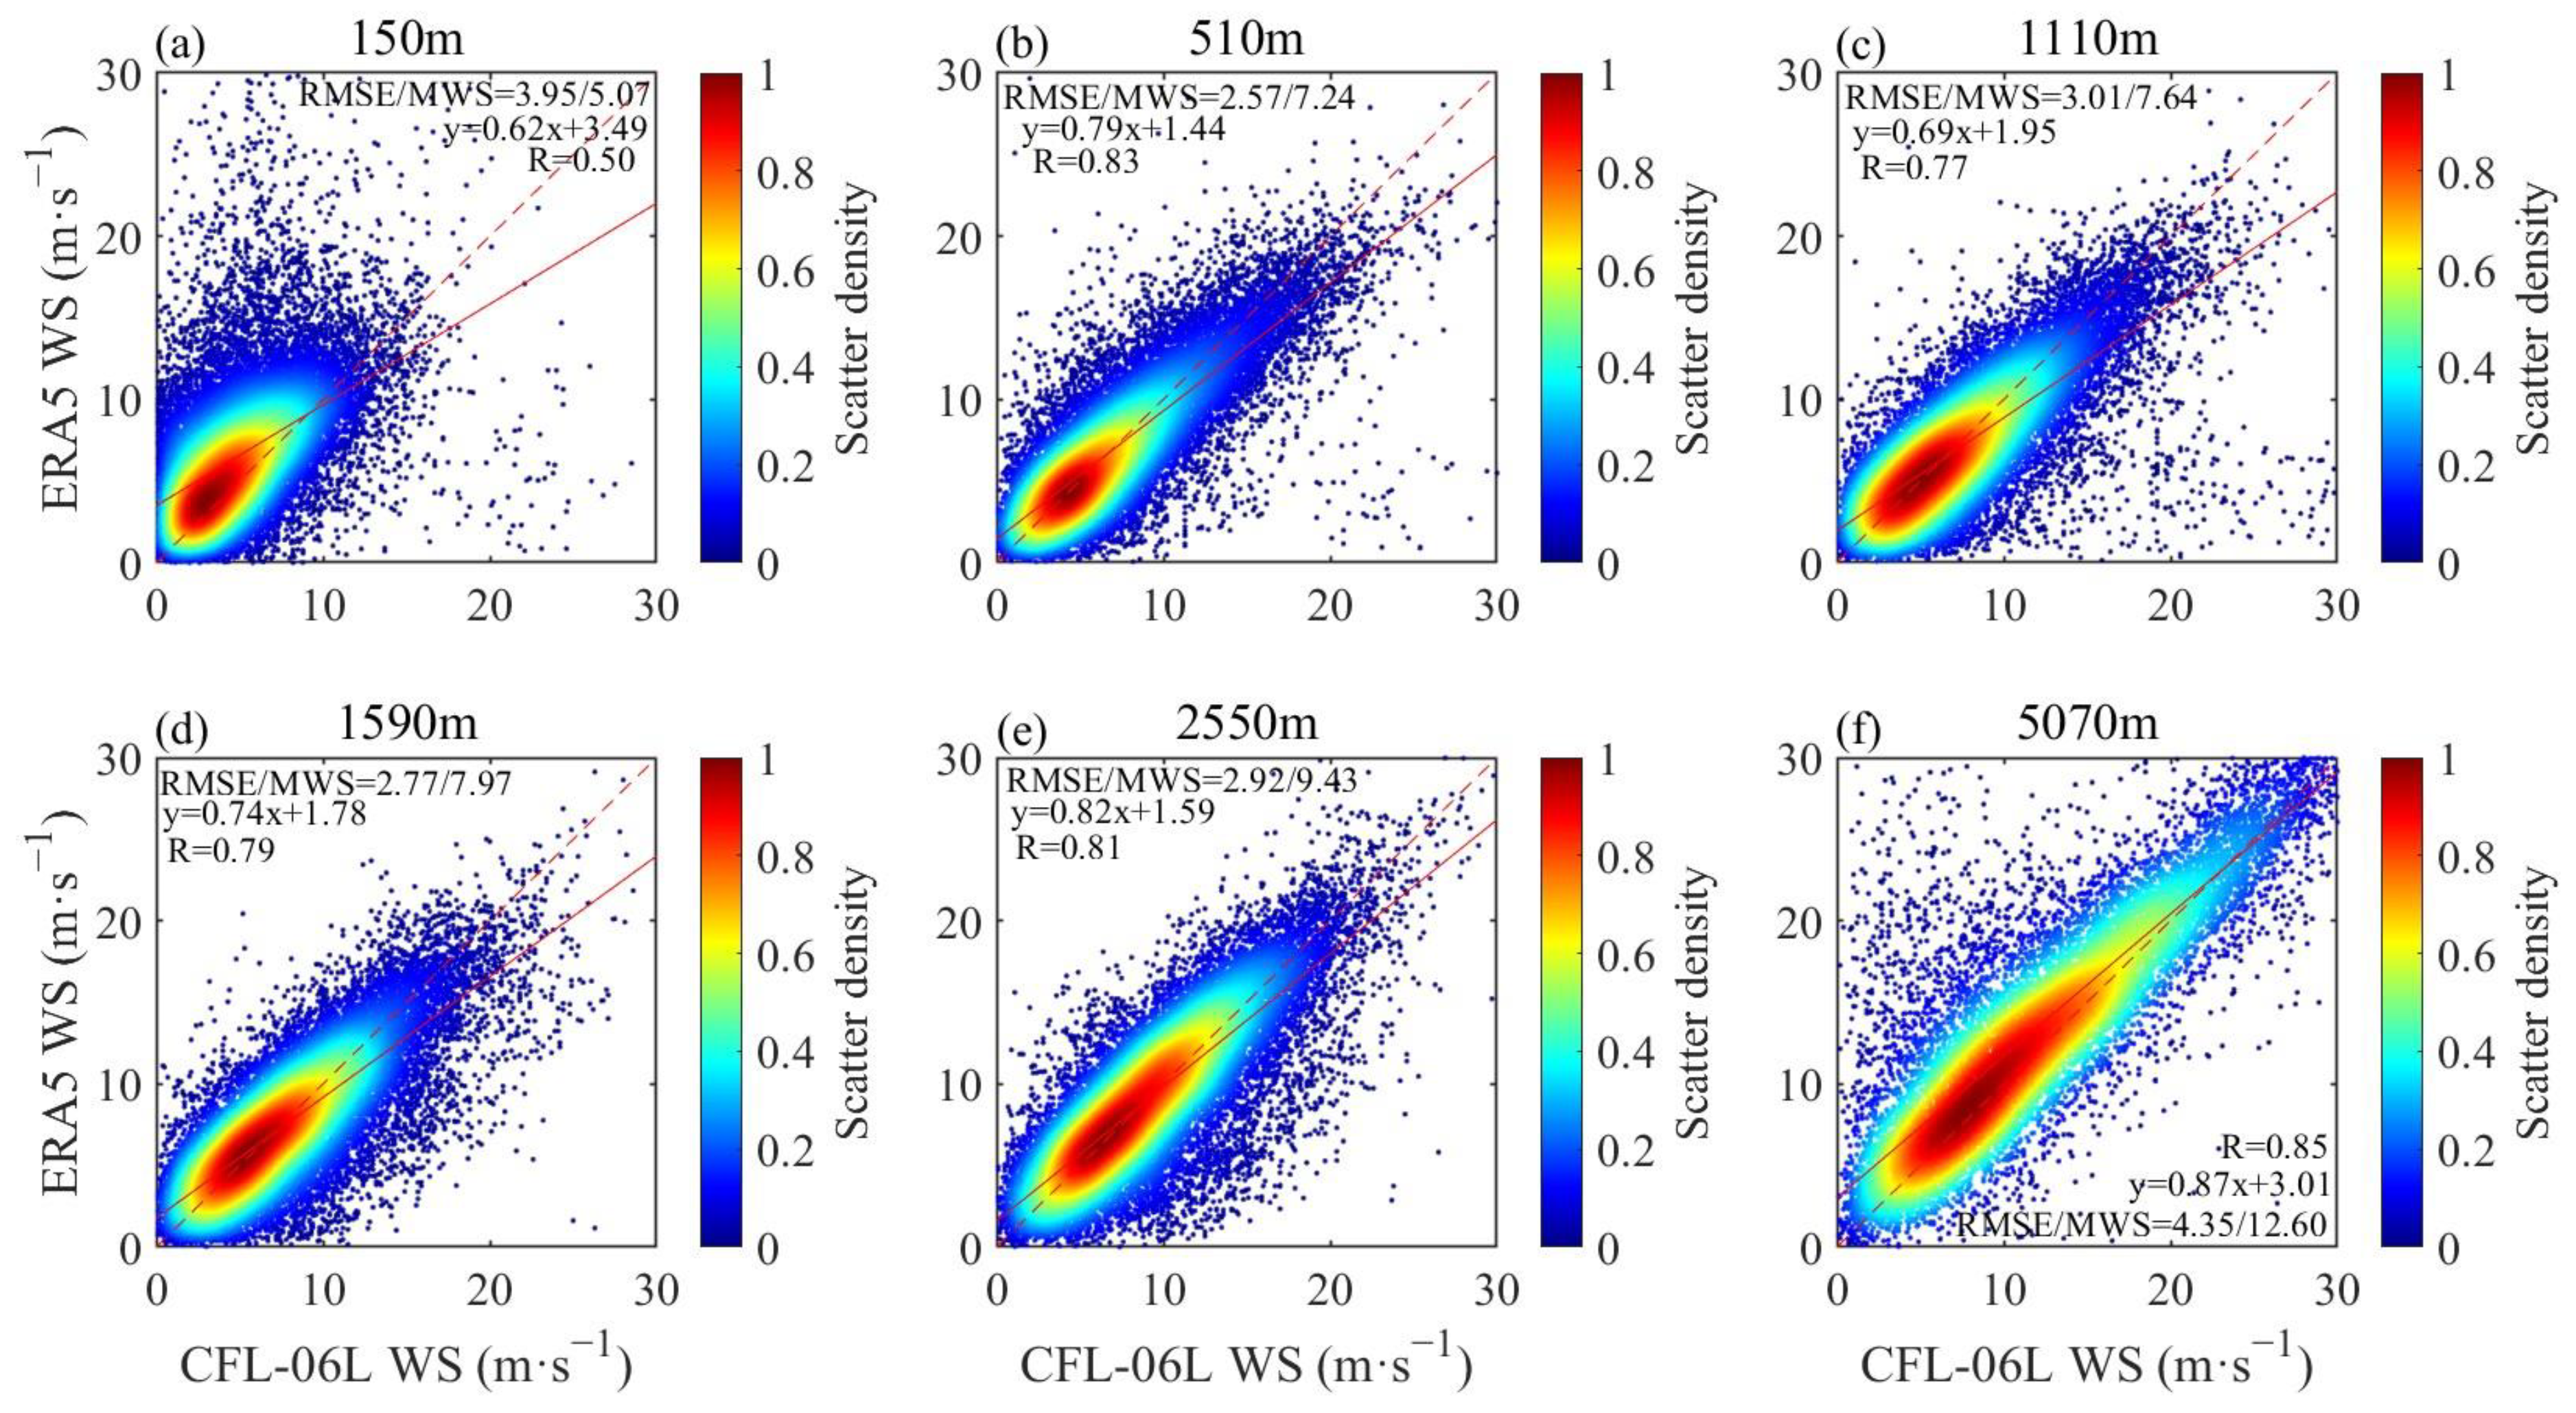
After initially establishing the variation pattern of wind speed at coastal stations, our study proceeded to conduct anomaly analysis and correlation analysis of observation data and ERA5 data. Figure 3. illustrates the density scatter plot of observed wind speed and reanalysis data at different altitudes. The fitted straight line demonstrates a strong correlation between the two datasets, ranging from an average ground-level wind speed of approximately 3–5 m/s to an average altitude wind speed of about 10 m/s, reflecting the physical trend in wind speed changes. As altitude increases, the correlation between observed data and ERA5 reanalysis data gradually strengthens, with R2 reaching its peak at 0.85 (5070 m). However, it is evident that there are more outliers near ground level and at high altitudes, indicating that some ERA5 wind speeds significantly exceed observed values. This could be attributed to substantial land-sea breeze effects experienced by coastal sites leading to significant diurnal variations not accurately captured by reanalysis data during certain periods. Furthermore, upper-level winds influenced by intense convective systems may result in extreme fluctuations in wind speeds; hence, ERA5 data might exhibit errors in processing such convective systems, causing high-altitude wind speeds to deviate significantly from observed values.
In our study, the original observations were taken at a 6-min resolution, and we chose to average these to a 10-min interval for the main analysis to smooth out short-term fluctuations and better highlight longer-term trends and patterns. This approach was intended to provide a clearer understanding of the overall wind speed behavior during the period under study rather than focusing on minute-to-minute variations. Figure 2g–l illustrates the variations in wind speed during the winter months with a refined temporal resolution, capturing the critical phases of meteorological events and offering a more granular view of the wind conditions. This addition will allow for a better assessment of the ERA5 data’s accuracy in capturing high-resolution temporal fluctuations and enhance the overall analysis of wind speed consistency during key meteorological events. Across Figure 2g–l, the ERA5 reanalysis data generally follows the trends observed in the actual wind speed measurements, though with some discrepancies in magnitude, particularly noticeable at higher altitudes. There appears to be increased variability in the discrepancies as the period progresses into January 2022, which might indicate seasonal influences on the accuracy of ERA5 data or increased weather variability affecting wind speed patterns. Moreover, the underestimations at higher altitudes, especially notable in panel (l) for 5070 m, point to potential limitations of ERA5 in capturing dynamic and rapid changes in wind speeds, which could impact applications requiring high-altitude data accuracy, such as aviation weather forecasting and high-altitude wind energy projects.
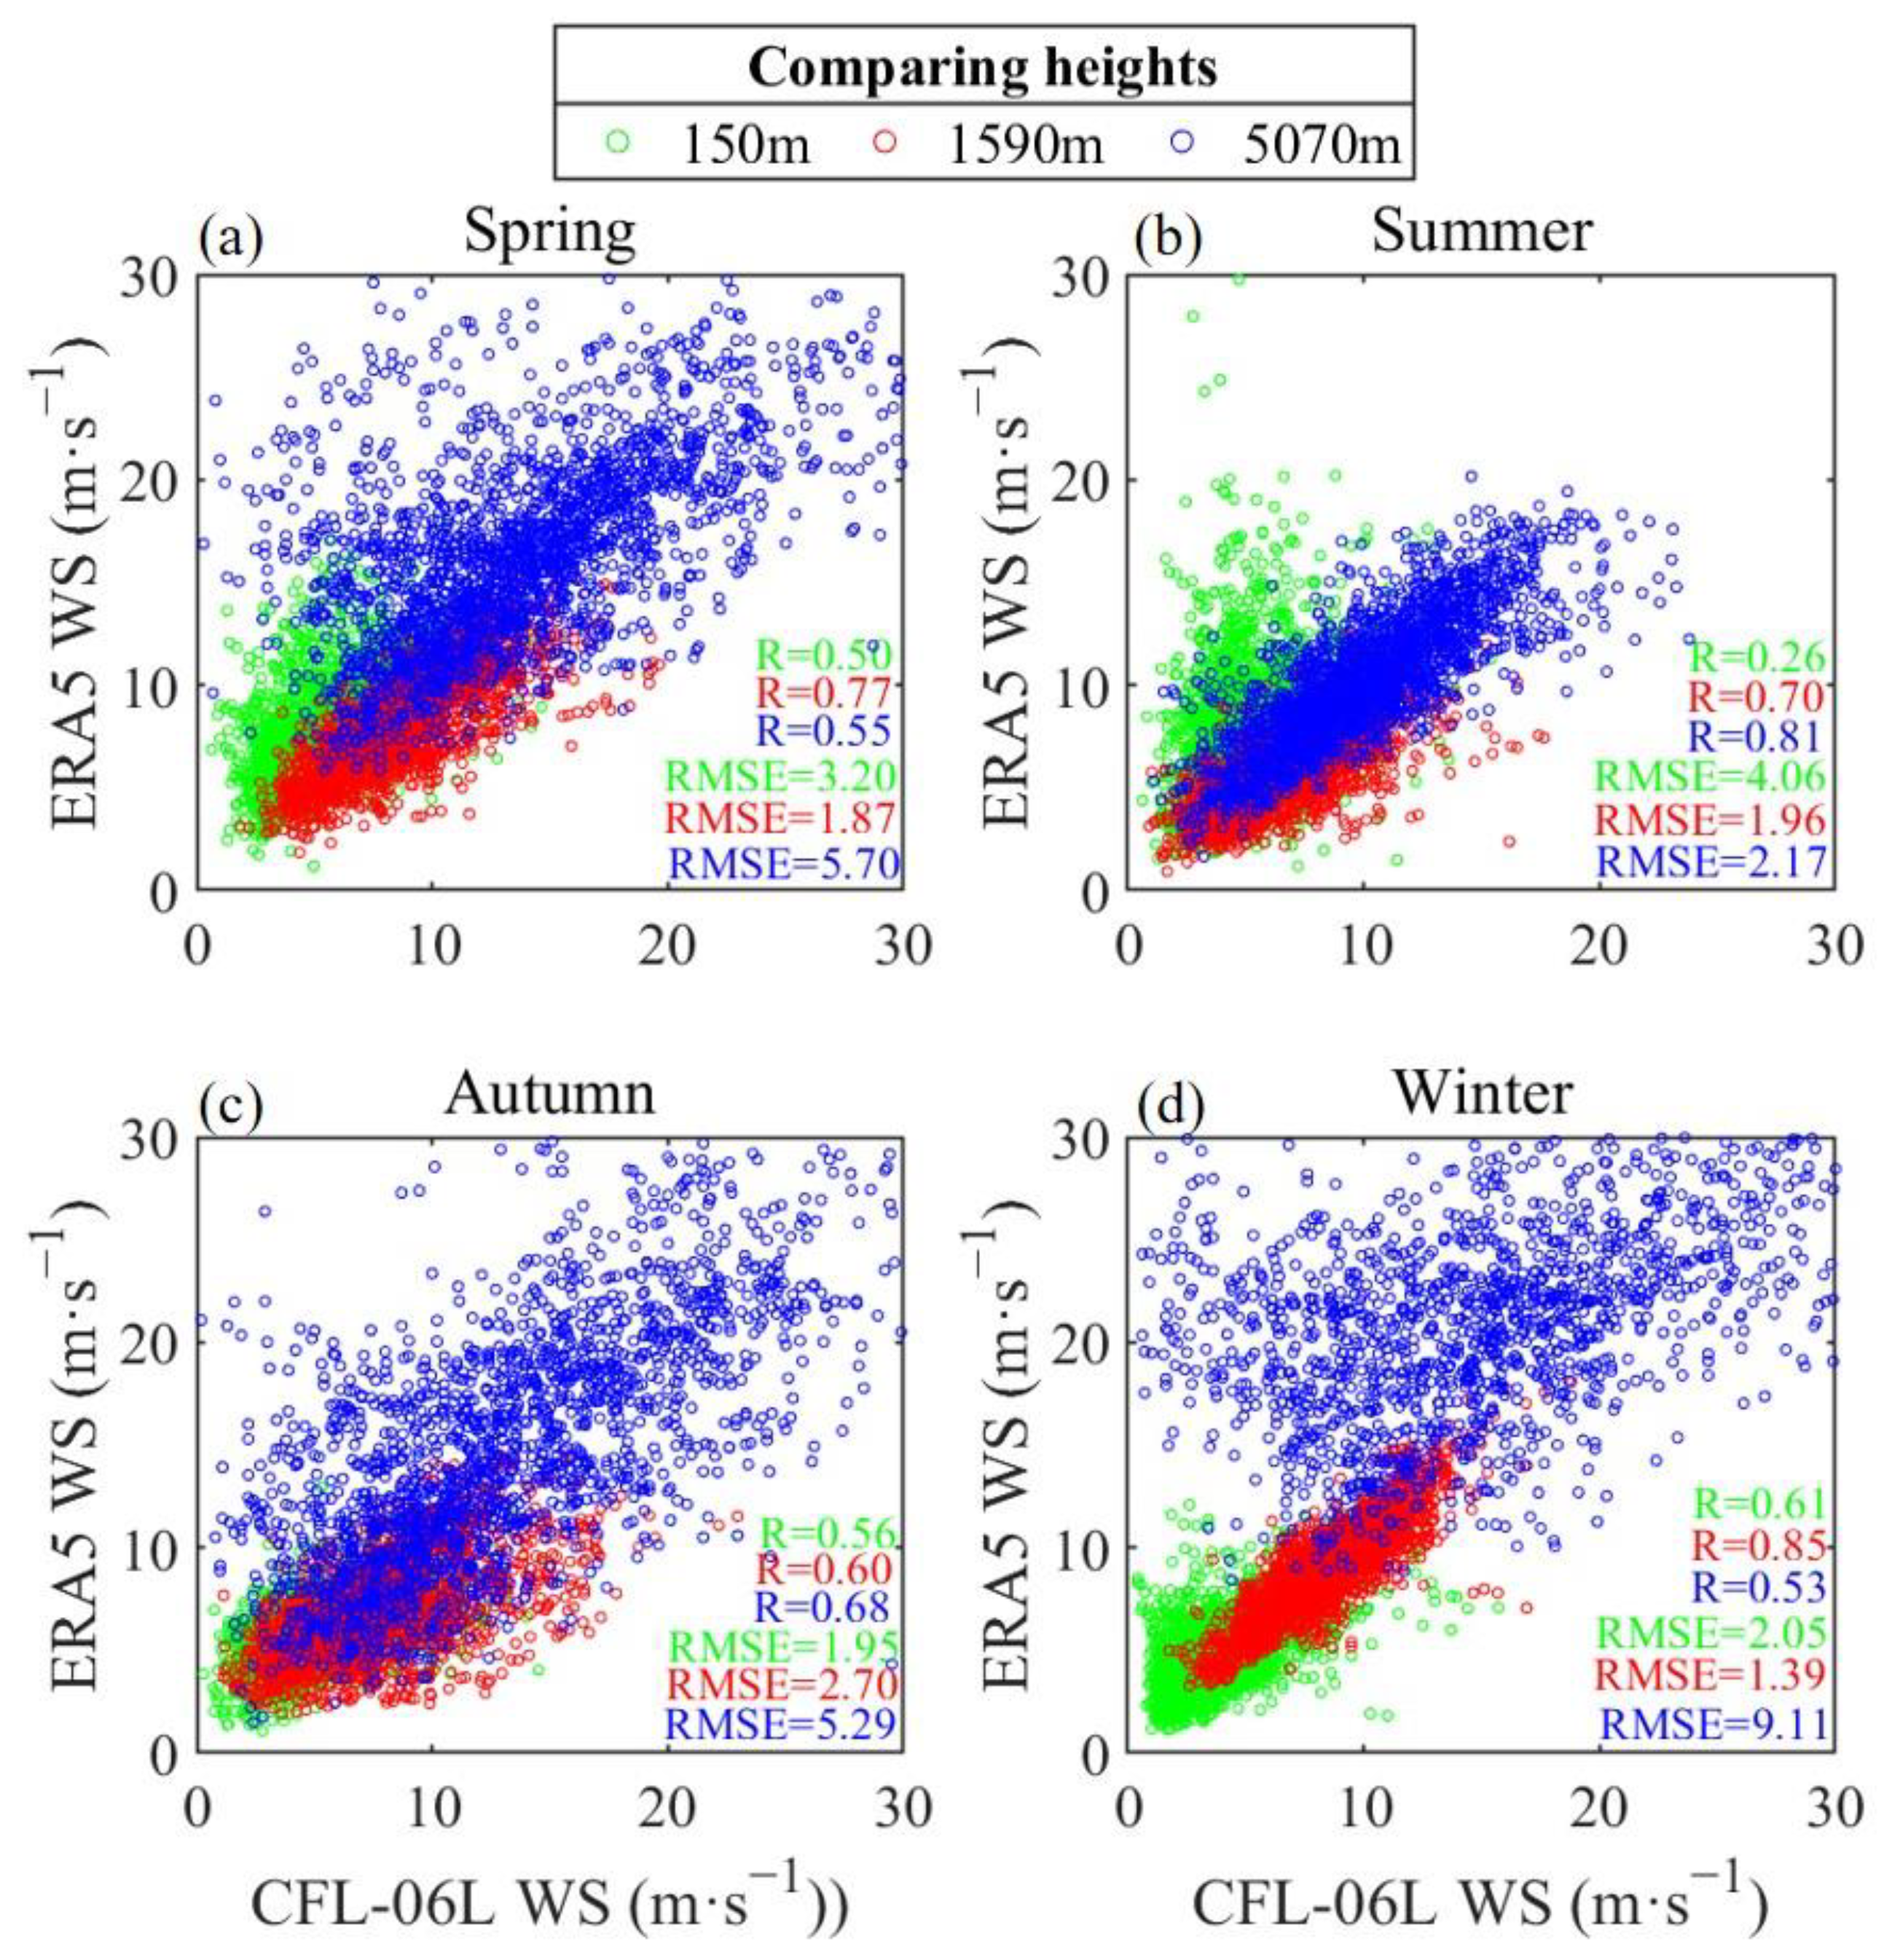
To investigate the influence of seasonal changes on the accuracy of reanalysis data, the ERA5 reanalysis data for 2020 to 2022 was averaged by season to obtain four seasons of WS data for 1 year. Figure 4 shows scatter plots comparing the ERA5 reanalysis data at 150 m (green), 1590 m (red), and 5070 m (blue) at different heights with the CFL-06L radar WS data for the four seasons of spring, summer, fall, and winter. Through the analysis, it was found that in spring (Figure 4a), the R values for the 150 m, 1590 m, and 5070 m heights were 0.50, 0.77, and 0.55, respectively, with RMSE/mean wind speed (MWS) values of 3.20 m/s, 1.87 m/s, and 5.70 m/s. The correlation was higher at the middle layer (1590 m), indicating that ERA5 and the observed wind speed were more consistent at this height. This may be due to the uniform atmospheric layer at this height, with the WS measurement results being more similar. However, the correlation was lower, and the RMSE was higher at the 150 m and 5070 m heights, indicating that there was a greater difference at these heights. The error at the 150 m height was due to surface interactions and friction with obstacles, while the error at the 5070 m height was due to the complex motion of the tropospheric atmosphere. In summer (Figure 4b), the R value at 150 m was the lowest, and the RMSE was larger due to strong surface heating and active turbulent motion. At higher altitudes (1590 m and especially 5070 m), the surface heating effect decreases with increasing altitude, and R significantly increases, with RMSE maintained at a lower level. The scatter plot at 5070 m altitude shows that the data is very concentrated, suggesting good consistency between the two datasets at this height, indicating good consistency between the two datasets in the free atmosphere during the summer. In the fall (Figure 4c), R increases gradually with altitude but not as clearly as in the summer. The lowest RMSE at 150 m indicates that the ground conditions in the fall are more stable than in other seasons, with better measurement consistency. However, the scatter plot at 5070 m altitude shows a greater degree of dispersion, reflecting significant differences in the upper atmosphere measurements in this season, which may be due to the transitional weather patterns and unstable atmospheric conditions in the fall. In winter (Figure 4d), the highest correlation is observed at 1590 m altitude (R = 0.85), indicating that the atmospheric conditions at this height are relatively stable in winter. However, the scatter plot at 5070 m altitude shows widespread dispersion, with a remarkably high RMSE, indicating significant differences in the upper atmosphere, which may be attributed to the complex atmospheric movements in winter, including intense winds and turbulence, highlighting the challenges of measuring and modeling high-altitude wind speeds in winter. In summary, the differences are the smallest in the summer in all seasons. At all heights, the middle layer (1590 m) typically exhibits the highest R and lower RMSE, with significant differences between the surface and the upper atmosphere, reflecting the influence of surface interactions and the complex dynamics of the upper atmosphere. Understanding these differences is crucial for improving weather prediction models and integrating observational data into reanalysis frameworks.
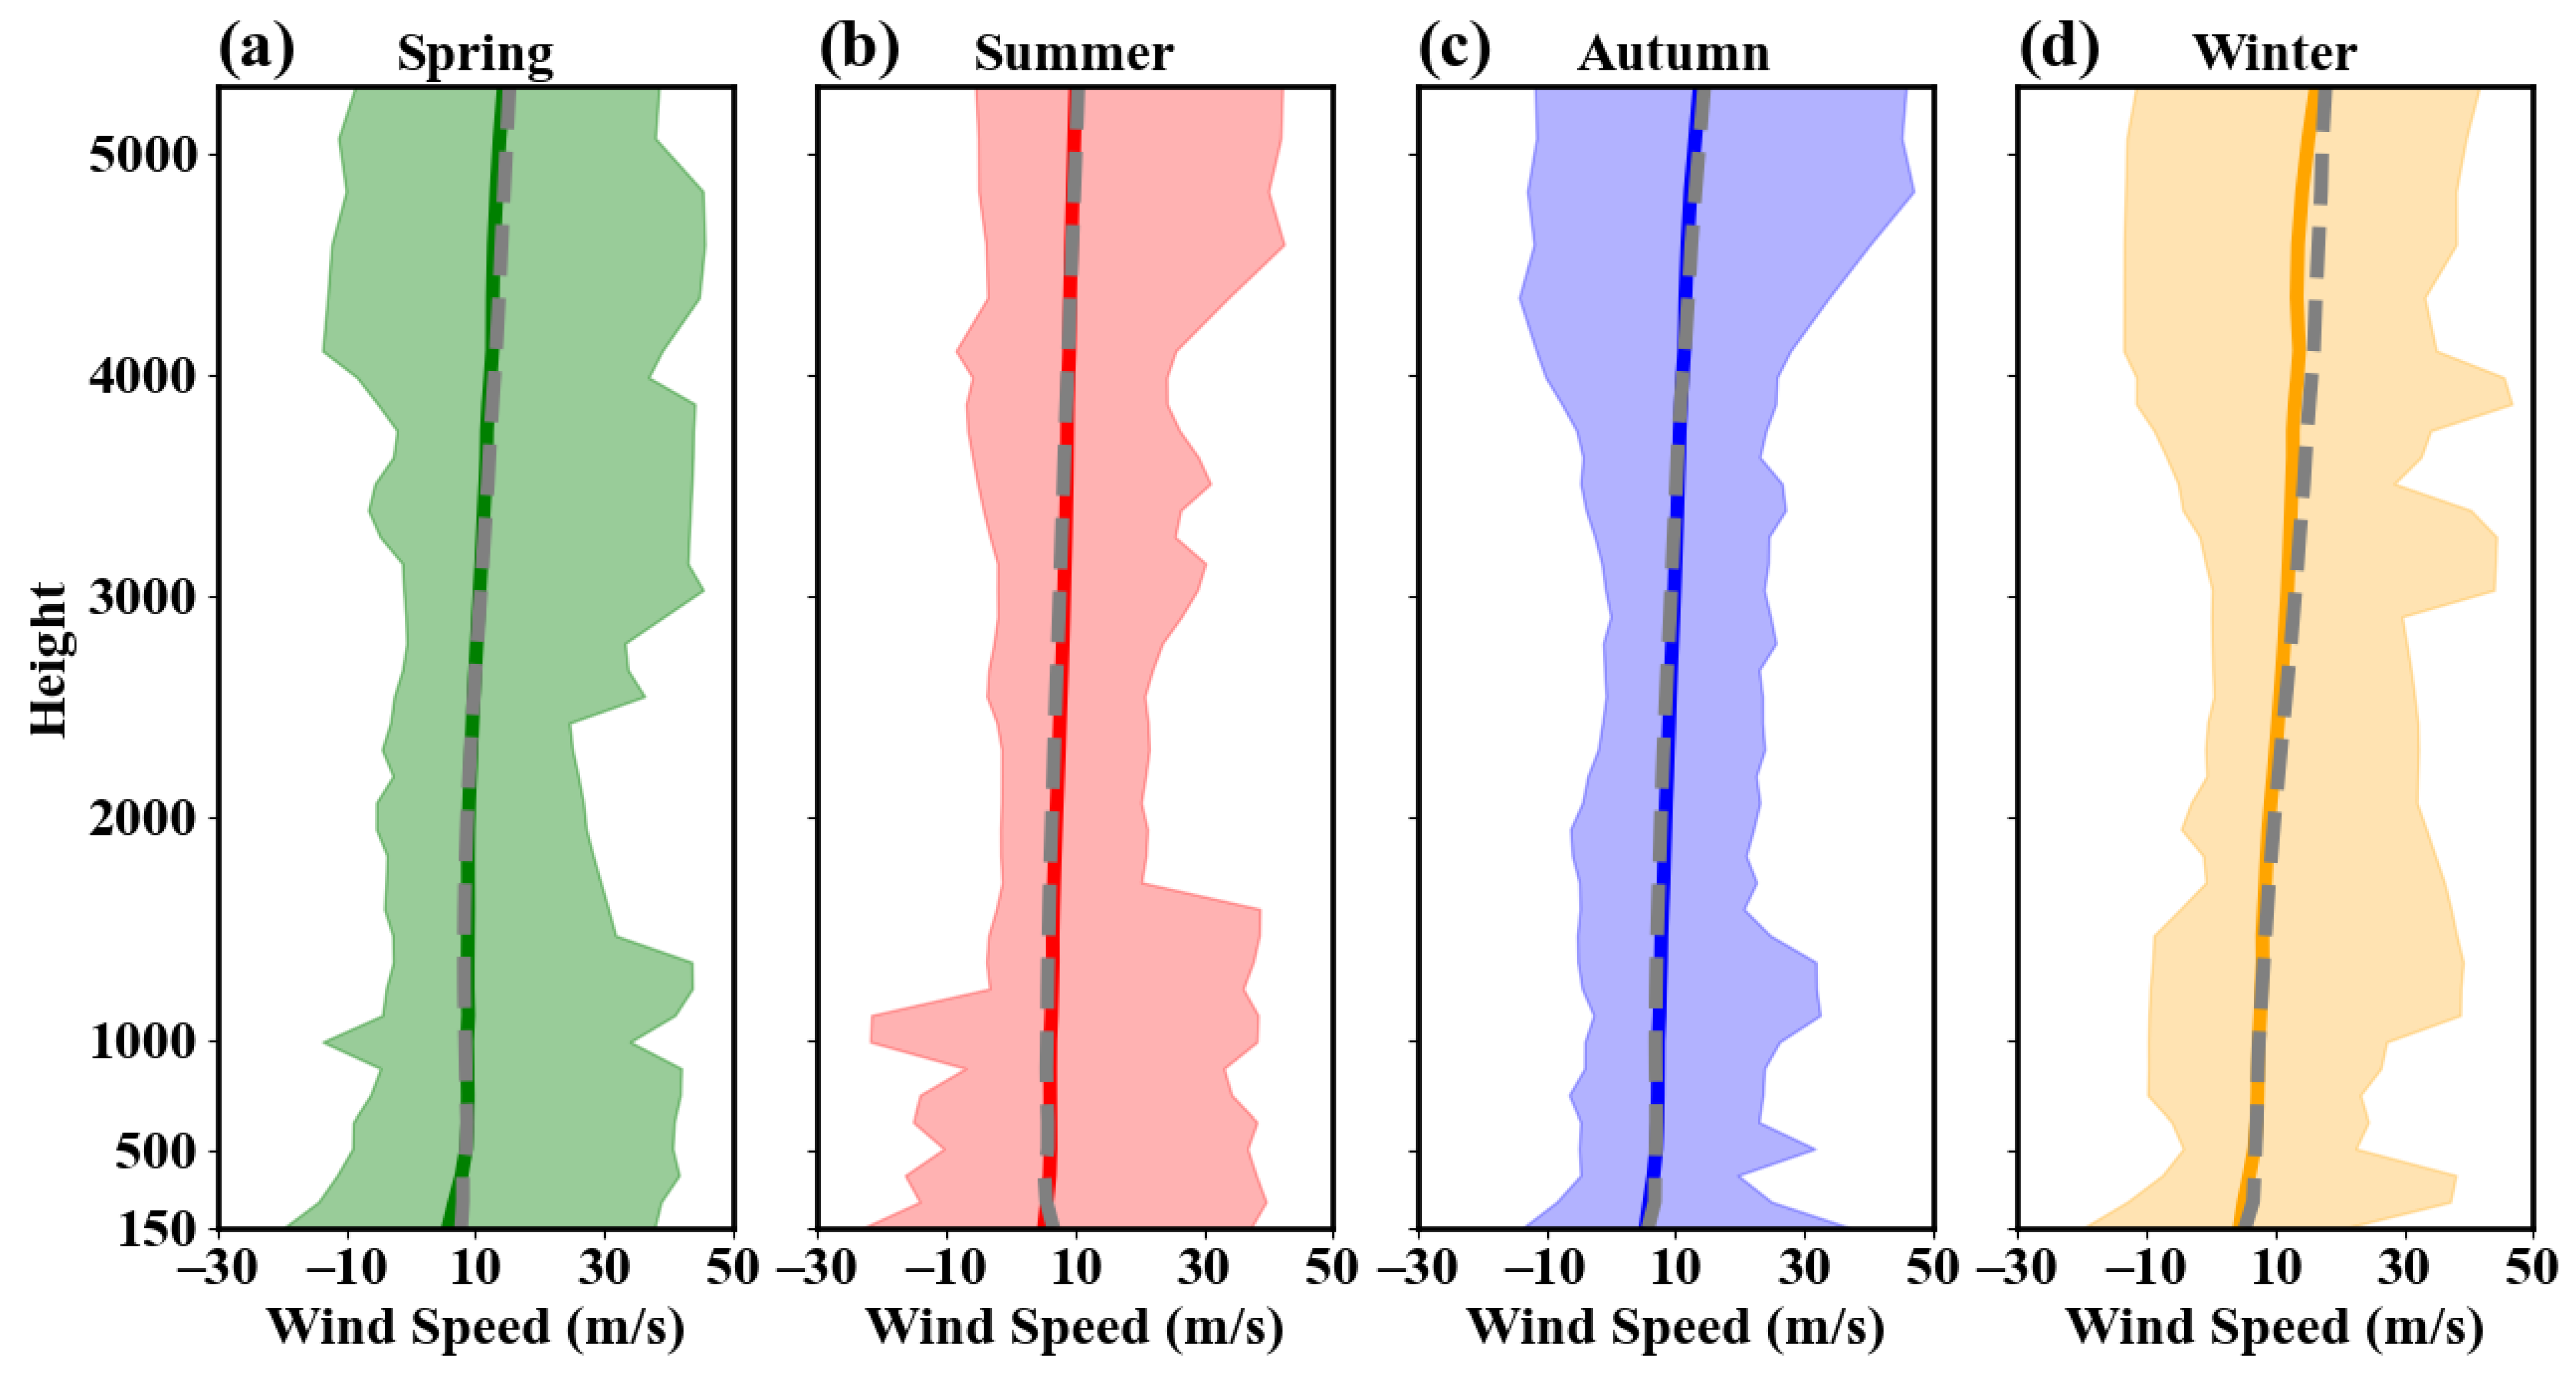
To further quantify the differences between wind speeds at various altitudes, our study analyzed the error between the wind profile and ERA5 data from 150 to 5500 m. As shown in Figure 5, the range of wind speed errors at coastal stations from surface to altitudes is concentrated in the range of −30 m/s to 30 m/s for each season, and most of them are concentrated in the range of −10 m/s to 20 m/s. These error values are significantly higher than the average wind speed in inland areas, indicating greater variability in wind speed at coastal stations. As the altitude increases, the wind speed error shows a significant fluctuation between 150 m and 5000 m, and the fluctuation range is significantly different from season to season. At the altitudes from 150 m to 1000 m, the error of wind speed in the boundary layer is significantly higher than that in the middle and upper layers, especially in spring and summer, due to the influence of the sea-land circulation and the small-scale vortex system near the surface. This indicates that land-sea interaction and thermal interaction have a greater influence on wind speed at lower altitudes.
At the middle and upper levels (1000 m to 4000 m), the wind speed errors of the two datasets (wind profile and ERA5) tend to be consistent, and the deviation is small, both within 10 m/s. This indicates that the variation law of wind speed at the higher level is consistent, and the error is relatively small. When the altitude exceeds 4000 m, the error of the ERA5 data relative to the observed data begins to rise again, which may be due to the influence of a strong convective system, resulting in some extreme outliers in the troposphere region. In general, there are obvious seasonal differences in the distribution of wind speed profiles, and the fluctuations of wind speed at different altitudes reflect the considerable influence of seasons on wind speed. These analyses are of great significance for understanding seasonal wind speed characteristics around the coast, especially in meteorological studies and wind energy utilization. The understanding of seasonal wind speed characteristics can help optimize the utilization of wind energy resources, improve the power generation efficiency of wind farms, and provide support for relevant meteorological forecasting.
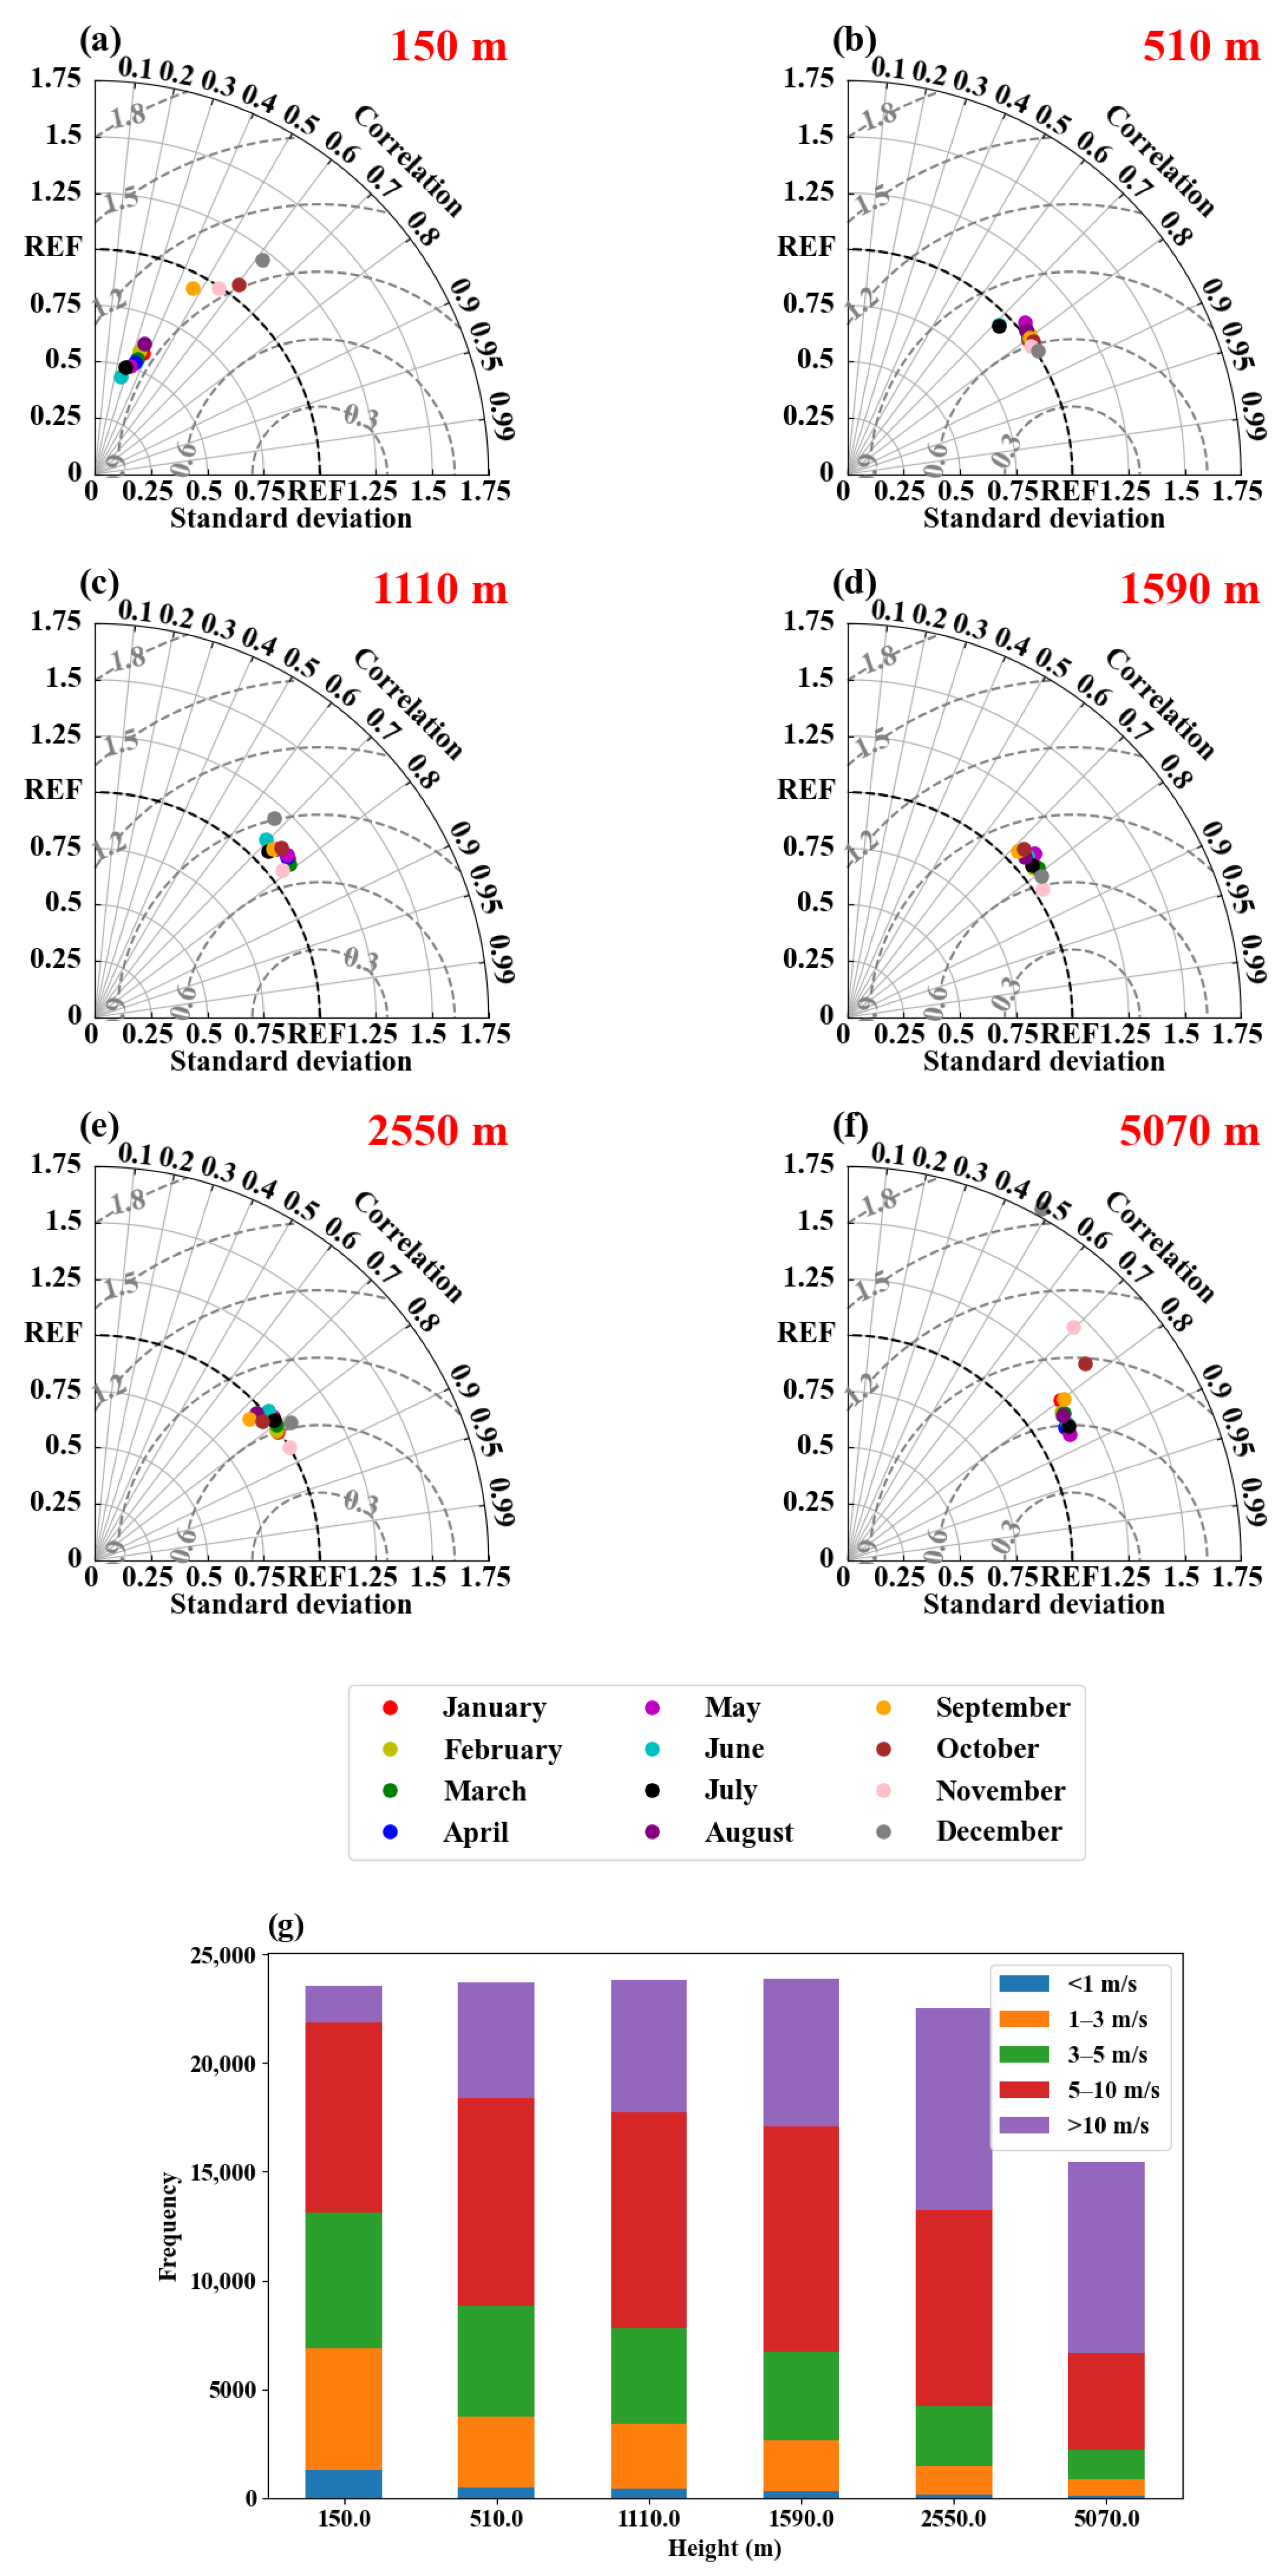
After analyzing the seasonal error, it is necessary to conduct a quantitative analysis of the month-to-month correlation for the specific height. Figure 6 shows the Taylor plot of average month-to-month wind field errors. As can be seen from the results, there are significant errors between the ERA5 data and the observed data for each month at a height of 150 m. The standard error is as high as 0.5 times the standard deviation in the summer months, and the fall and winter results (September to December) show a discrete state with R2 between 0.5 and 0.6. As the height increases gradually, the error of each month also decreases gradually, the correlation increases gradually, and the R2 is as high as 0.8–0.9. However, when the altitude increases to about 5000 m, the wind speed starts to deviate from the reference value (REF) again, especially in October and December, and the deviation of ERA5 relative to the observed value is close to 1.5 standard deviations. The deviation of high-altitude detection is large. Firstly, it should be blocked by clouds and aerosols, and the detection accuracy of radar will be significantly reduced. However, the pollution process in fall and winter is relatively serious, blocked by haze and particulate matter, and wind radar data may have a certain degree of distortion. This is also the main reason for the large error between the results from September to December and the reanalysis.
Figure 6g illustrates the wind speed frequency distribution at different heights (150 m, 510 m, 1110 m, 1590 m, 2550 m, and 5070 m). The wind speeds are divided into five intervals: <1 m/s, 1–3 m/s, 3–5 m/s, 5–10 m/s, and >10 m/s. Each color represents a wind speed range, and the bar chart displays the frequency of occurrence of each wind speed interval at the respective heights. As observed from the bar chart, with increasing height, the frequency of the lower wind speed intervals (<1 m/s and 1–3 m/s) decreases, while the frequency of the higher wind speed intervals (5–10 m/s and >10 m/s) progressively increases, especially at greater heights (5070 m). At lower heights (150 m and 510 m), the bar chart shows that the lower wind speed intervals (<1 m/s and 1–3 m/s) account for a significant proportion. Generally, wind speed variations in these intervals are small, which could result in lower RMSE at these heights due to smaller wind speed simulation errors. At medium heights (1110 m, 1590 m, 2550 m), the frequency of wind speeds in the 3–5 m/s and 5–10 m/s intervals increases with height, reflecting more intense wind speed variations. This may lead to an increase in RMSE at these heights, particularly during the summer when wind speeds are higher, potentially causing larger errors. At high heights (5070 m), the wind speed distribution is more concentrated in the higher wind speed interval (>10 m/s), indicating more frequent occurrences of high wind speeds. Since high wind speeds are typically accompanied by larger variations, this could contribute to an increase in RMSE.

3.2. Extreme Weather Processes

Figure 7a depicts a regional large-scale precipitation event in 2022. The boundary layer height is less than 500 m, and the wind field exhibits relative calmness. Large-scale precipitation typically induces atmospheric stability by lowering the boundary layer height due to the release of latent heat from water vapor condensation during precipitation. Consequently, wind speeds are below 10 m/s at this time, with minimal changes in wind direction and weaker speeds contributing to maintaining a lower boundary layer and reducing dynamic disturbances. However, higher wind speeds lead to increased atmospheric instability, causing the boundary layer to rise above 1000 m. Figure 7b illustrates a dry and hot wind weather process in 2022 characterized by significant increases in low-level atmospheric wind speeds and substantial fluctuations in boundary layer height reaching approximately 4500 m. Dry and hot winds typically bring about low humidity and elevated temperatures, enhancing vertical mixing in the atmosphere while often positioning the boundary layer near the maximum wind speed height zone, resulting in heightened fluctuations. Figure 7c showcases a heavy rainfall weather process in 2021 marked by a sharp increase in boundary layer height alongside dramatic changes in the wind field. Heavy precipitation is frequently associated with robust weather systems, such as thunderstorm fronts or low-pressure systems that generate strong vertical airflow, leading to significant increases in boundary layer height accompanied by fast winds with complex directions along with heavy precipitation and severe convective activities. Figure 7d shows the process of a blizzard in 2020, in which the wind field and boundary layer show obvious instability, the wind direction is complex, and the wind speed fluctuates greatly. Heavy snowstorms are associated with low temperatures and rapid changes in air pressure, resulting in unstable atmospheric junctions and rapid changes in wind fields. Fluctuations in the boundary layer reflect the rapid exchange between different layers of temperature and humidity in the atmosphere, which is part of the intense weather characteristics of the blizzard.
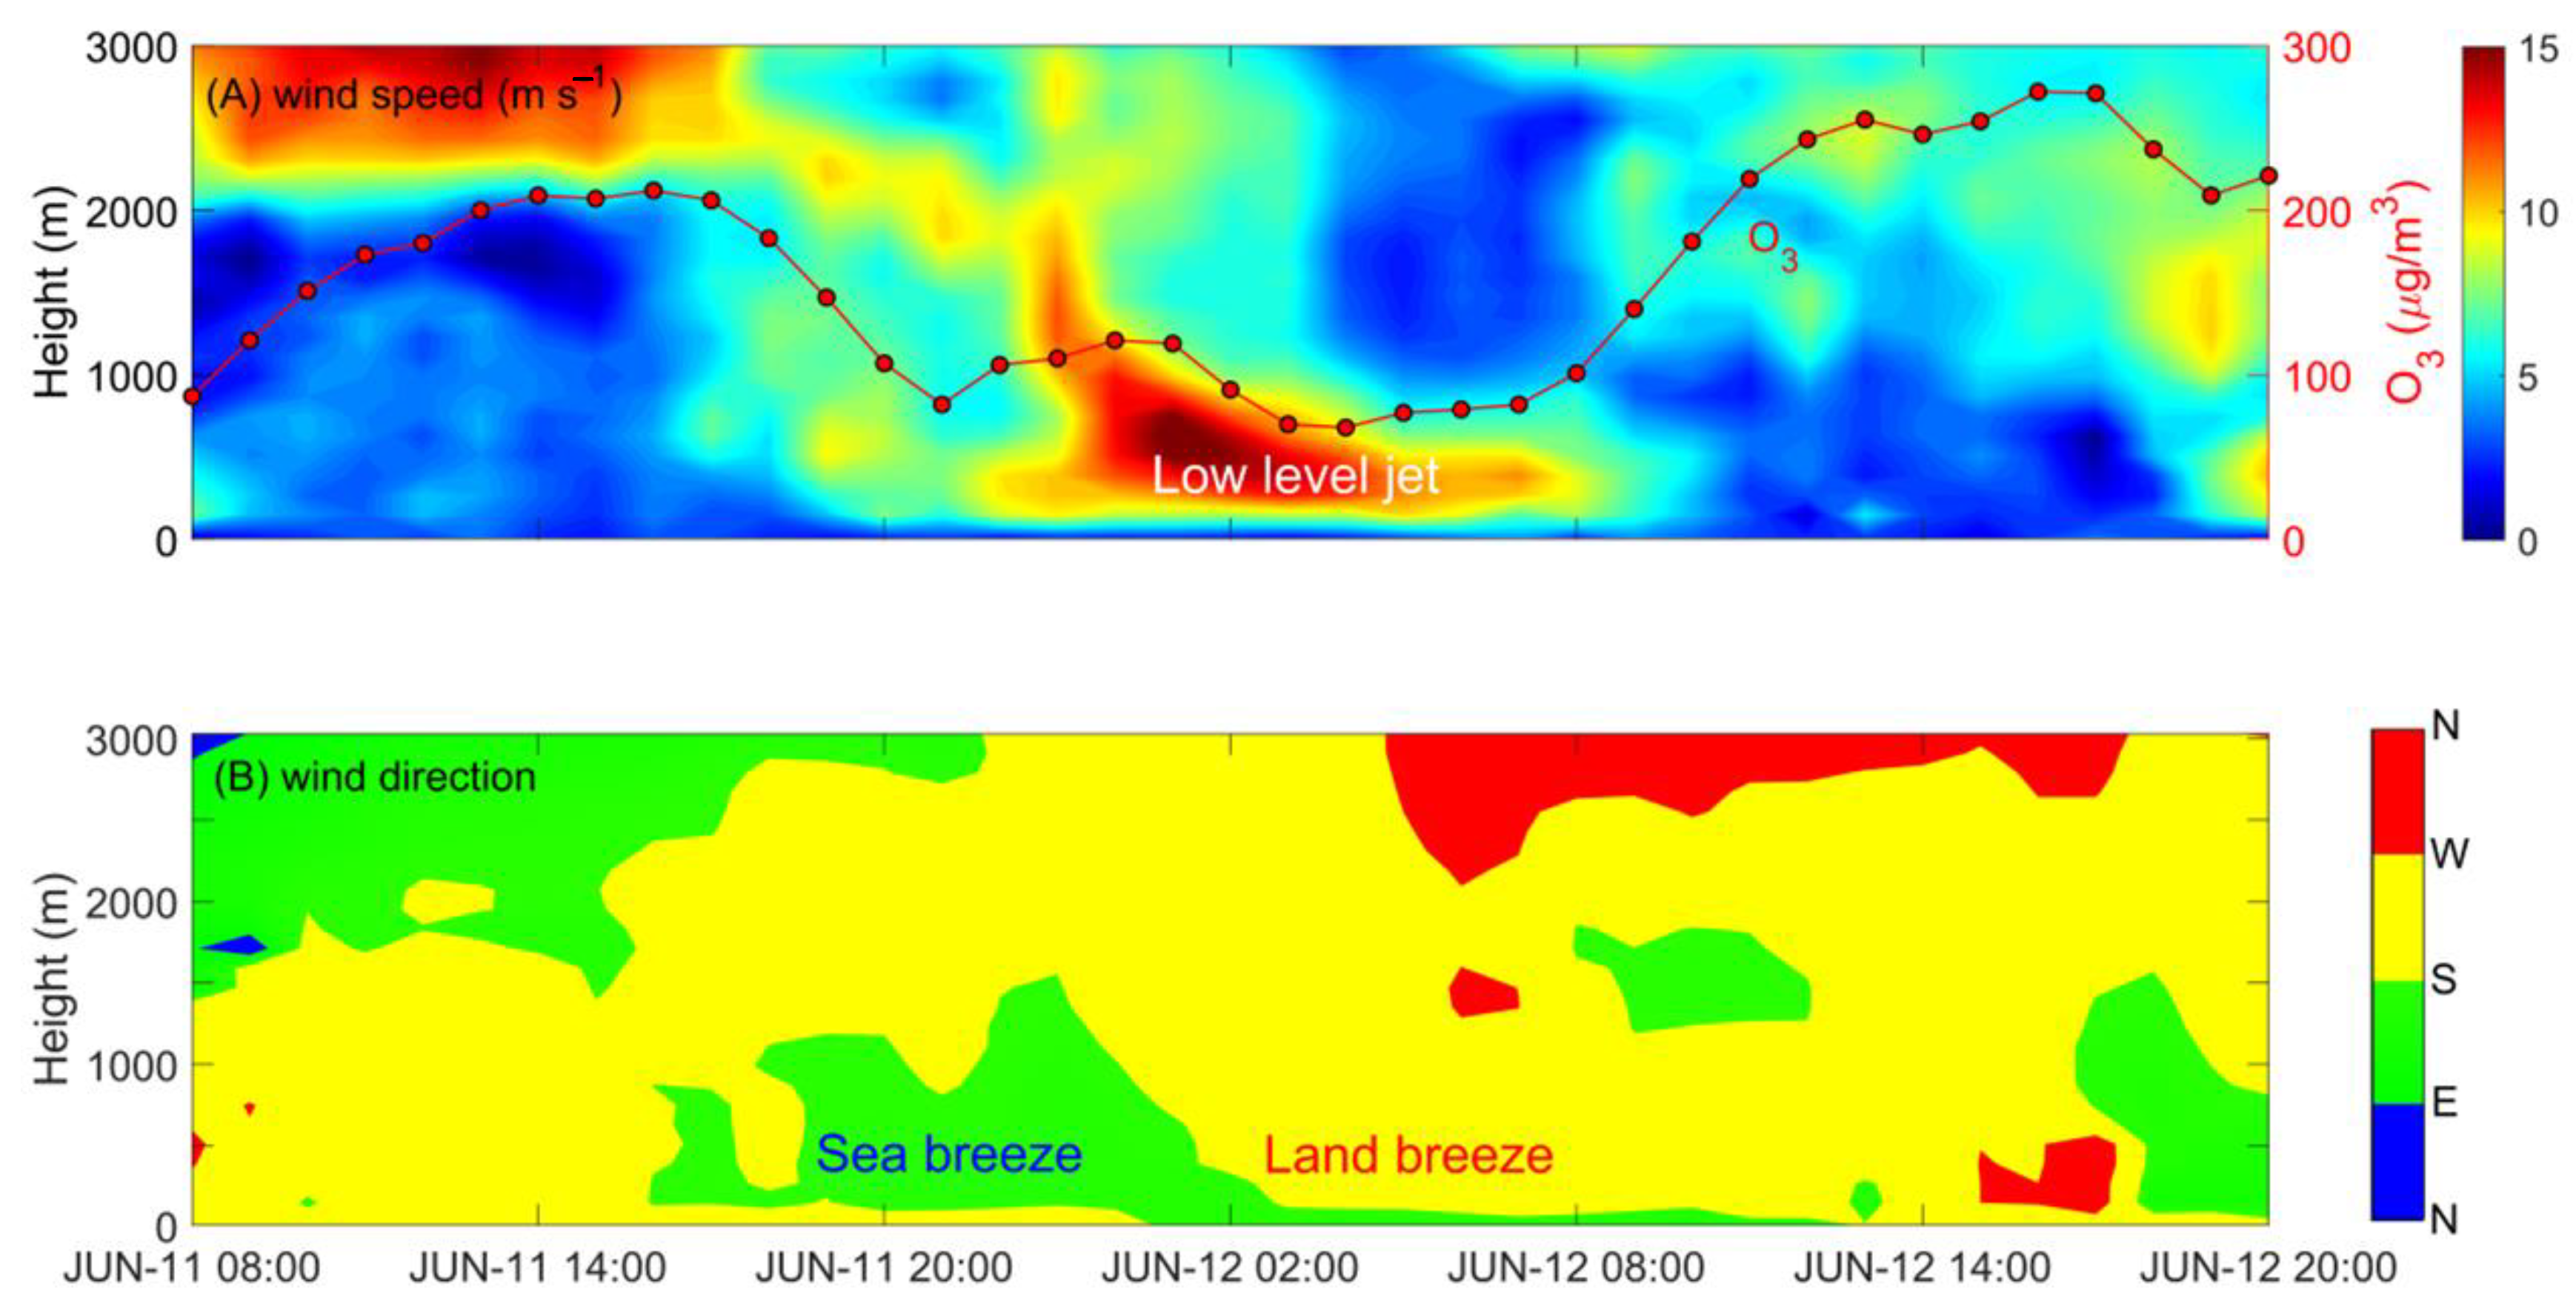
The sea-land breeze, motivated by the thermal contrast of land and waters, is a common phenomenon over coastal areas across the whole world. In this study, a case appearing on 11–12 June 2021 is selected for analysis. As shown in Figure 8, the southeasterly sea breeze with a height of around 1000 m dominated in the afternoon and persisted until the deep night; however, at 22:00–23:00, the aloft wind direction gradually turned to the southwesterly land breeze and finally held for the same throughout the vertical layer after 02:00. In the meantime, a visible jet core of 15 m s−1 is found to be formatted at 500–600 m along with the transition of sea breeze and land breeze, indicating that the dynamic transformation of sea-land wind has the potential to trigger the low-level jet stream. Moreover, we also observed an abnormal increase in the nocturnal O3 concentration. The O3 dropped to 82 µg m−3 at 21:00, and inversely rose to 121 µg m−3 at 00:00. As we all know, the depletion reaction of O3 with NO in the nighttime can cause the plummet of ground surface O3; therefore, the abnormal phenomenon is inferred to be highly associated with the vertical transport of the simultaneous low-level jet. Similar results have also been reported by [45], who discovered that the sea-land breeze can motivate the nighttime low-level jet and then contribute to the second peak of O3 using in-situ observations in Ningbo city, coastal Huanghai. The second increase of nocturnal O3 plays a non-neglectable role in raising the base value of O3 the following day, which reminded us of the urgency to differentiate the O3-levels control strategy for cities located along the coast.

4. Discussion

  • The analysis presented in Figure 3 and Figure 4 underscores the inherent challenges and intricacies of wind speed measurement and modeling at various altitudes, particularly in coastal environments. These findings highlight the varying degrees of correlation between observed data and ERA5 reanalysis data across different altitudes and seasons, illustrating the complex interplay of atmospheric dynamics that influence wind speed accuracy. The strengthening correlation with altitude and the peak R2 value at 5070 m suggests that ERA5 reanalysis data tend to align more closely with observed data at higher altitudes. This trend may be attributed to the lesser influence of local surface interactions and obstacles at greater heights, which can complicate wind speed measurements near the ground. However, the presence of outliers, particularly at ground level and high altitudes, indicates substantial discrepancies that could stem from the dynamic land-sea interactions and the impact of convective systems, which are not consistently captured by ERA5. This observation is crucial as it points to potential areas for refinement in reanalysis techniques, especially in their ability to model diurnal variations and respond to rapid atmospheric changes induced by local geographical features.
  • Seasonal variations in wind speed measurement consistency suggest that surface heating, turbulent motions, and transitional weather patterns notably affect the accuracy of wind speed predictions, underscoring the need for ERA5 and similar datasets to adapt to these dynamic conditions. Understanding the differential accuracy of wind speed measurements across various altitudes and seasons is essential for refining weather prediction models. The observed discrepancies and their patterns provide valuable feedback for improving the assimilation of observational data into reanalysis frameworks, particularly in handling complex phenomena like sea-land breezes and convective systems. By addressing these specific challenges, meteorological models can be better equipped to deliver more precise forecasts, which are critical for a wide range of applications from aviation safety to environmental management.
  • The analysis presented in Figure 5 and Figure 6 provides a detailed quantification of the discrepancies in wind speed errors across different altitudes and seasons, offering critical insights into the variability and reliability of wind speed measurements in coastal environments. The increase in wind speed errors above 4000 m, particularly noted through the fluctuations in ERA5 data relative to observed data, points to the influence of strong convective systems in the troposphere. These systems can induce extreme outliers in wind speed measurements, complicating the accuracy of both observed and reanalysis data. Such discrepancies are crucial for understanding the limits of current reanalysis models, especially in capturing the dynamics of upper atmospheric layers influenced by complex meteorological phenomena.
  • Given the observed discrepancies, there is a clear need for further research focusing on improving the integration of observational data into reanalysis frameworks, particularly for high-altitude and pollution-impacted periods. Enhancements in radar detection capabilities and adjustments to reanalysis algorithms to better account for atmospheric pollutants and convective disturbances could lead to substantial improvements in the accuracy of wind speed data, especially in complex coastal environments.
  • The distinct atmospheric phenomena depicted in Figure 7 highlight the complex interplay between weather processes and boundary layer dynamics. Each panel (a through d) provides insight into how different weather conditions impact the boundary layer height and wind field characteristics, offering a comprehensive view of atmospheric stability and turbulence. Understanding these dynamics is essential for improving weather forecasting models, particularly in predicting the onset and severity of different weather conditions. Additionally, these insights can aid in the development of more robust atmospheric monitoring and analysis tools, crucial for effective disaster management and mitigation strategies in response to extreme weather events.
  • We now discuss how variations in surface roughness, which can range from urban landscapes with high building densities to open rural areas, significantly affect wind speed measurements. Surface roughness alters the wind profile by increasing friction at lower altitudes, which is not always accurately captured by reanalysis models like ERA5, which may use more generalized surface characteristics. Moreover, the influence of topography on wind speed accuracy is another aspect we have incorporated. Mountains, valleys, and other geographical features can lead to localized accelerations and decelerations of wind, creating microclimates that are challenging to model accurately without high-resolution topographical data. These features often lead to the underestimation or overestimation of wind speeds in reanalysis data, particularly in regions with complex terrain.
  • The diurnal and nocturnal variations in O3 concentrations influenced by sea-land breeze dynamics highlight the need for tailored air quality management strategies in coastal cities. The ability of sea-land breezes to modulate pollution levels, especially O3, must be considered in urban planning and pollution control strategies. Understanding these local atmospheric processes is crucial for forecasting and mitigating pollution episodes, particularly in regions where sea-land breezes are prevalent. Given the substantial impact of sea-land breezes on local climatology and air quality, further research is recommended to explore the predictive modeling of these phenomena and their broader environmental impacts. Additionally, policymakers should consider these dynamics in air quality regulations and control strategies to address the variability in pollution levels effectively, ensuring public health and environmental safety.

5. Conclusions

In this paper, using a combination of tropospheric wind profile radar (CFL-06L) observations and ERA5 reanalysis data, we analyze the variations and ERA5 errors in wind speed at different elevations. The results indicate that within a vertical range of 150 m to 5070 m, the trend of wind speed in ERA5 reanalysis data is generally consistent with radar observations, and the ERA5 data exhibit high correlation (R2 ≈ 0.8) and low error (≈5 m/s) in the middle layer (1000–4000 m). In contrast, larger errors exist at the surface and high altitudes, with errors exceeding 1.5 times higher than the standard deviation at 5000 m. Seasonal and month-to-month analyses reveal significant discrepancies between wind radar detections and ERA5 data in autumn and winter. In particular, correlations in November and December are around 0.85, which may potentially influenced by haze, clouds, and aerosols, especially in high-altitude detections.
Further analysis examines the effects of sea-land interactions and strong convective systems on observed wind speeds and reanalysis data. Considering the constraints of boundary layer height, we elucidate the possible triggering conditions of extreme weather and their associated dynamic field. Additionally, we find that a low-level jet appeared near the surface, motivated by the transition of sea-land breeze, is highly related to the nighttime increase in ozone concentration, in which the strong wind-shear turbulence generated by the low-level jet can downward transport the aloft ozone to the ground. This second rise in nighttime O3 plays a crucial role in elevating the baseline O3 value the following day, underscoring the urgency for coastal cities to develop differentiated O3 concentration control strategies.
These findings contribute to improving the accuracy of ERA5 reanalysis data, as well as refining the initialization of weather prediction models. Understanding the wind speed across different altitudes and seasons provides valuable guidance for optimizing wind energy resource utilization and improving wind farm power generation efficiency. More importantly, the results offer a scientific basis for future meteorological research and environmental protection policy formulation. To build on the current study, future research will focus on developing advanced modeling techniques to better incorporate and simulate the dynamics of sea-land breezes, low-level jets, and their impact on pollution dispersion, particularly in coastal areas. Furthermore, we will explore the mechanisms at high altitudes, especially the role of aerosols and clouds in influencing wind speed errors, to improve the accuracy of high-altitude wind predictions.

Author Contributions

Conceptualization, C.S., A.S. and K.P.; methodology, A.S. and K.P.; software, C.S. and K.P.; validation, X.C., Y.T. and C.Y.; formal analysis, K.P.; resources, K.P.; data curation, C.S. and A.S.; writing-original draft, A.S. and C.S.; writing-review and editing, C.S., A.S., K.P., Y.T., X.C., C.Y., S.Y. and Y.W.; visualization, S.Y., G.W.; supervision, K.P., Y.W. and G.W.; project administration, X.C. and C.Y.; funding acquisition, X.C., C.Y. All authors have read and agreed to the published version of the manuscript.

Funding

This study is supported by the National Natural Science Foundation of China (Grant Nos. 42005003 and 41475094), and Cangzhou Key R&D Project Guidance Project 222108006.

Institutional Review Board Statement

Not applicable.

Informed Consent Statement

Not applicable.

Data Availability Statement

The original contributions presented in the study are included in the article, further inquiries can be directed to the corresponding author/s due to intellectual property rights.

Conflicts of Interest

The authors declare no conflicts of interest.

References

  1. Kotthaus, S.; Bravo-Aranda, J.A.; Collaud Coen, M.; Guerrero-Rascado, J.L.; Costa, M.J.; Cimini, D.; O'Connor, E.J.; Hervo, M.; Alados-Arboledas, L.; Jimenez-Portaz, M.; et al. Atmospheric boundary layer height from ground-based remote sensing: A review of "capabilities and limitations. Atmos. Meas. Tech. 2023, 16, 433–479. [Google Scholar] [CrossRef]
  2. Kottayil, A.; Mohanakumar, K.; Samson, T.; Rebello, R.; Manoj, M.G.; Varadarajan, R.; Santosh, K.R.; Mohanan, P.; Vasudevan, K. Validation of 205 MHz wind profiler radar located at Cochin, India, Using radiosonde wind measurements. Radio Sci. 2016, 51, 106–117. [Google Scholar] [CrossRef]
  3. Wang, C.; Chen, M.; Chen, Y. Impact of Combined Assimilation of Wind Profiler and Doppler Radar Data on a Convective-Scale Cycling Forecasting System. Mon. Wea. Rev. 2022, 150, 431–450. [Google Scholar] [CrossRef]
  4. Amaireh, A.; Zhang, Y.; Chan, P.W. Atmospheric Humidity Estimation From Wind Profiler Radar Using a Cascaded Machine Learning Approach. IEEE J. Sel. Top. Appl. Earth Obs. Remote Sens. 2023, 16, 6352–6371. [Google Scholar] [CrossRef]
  5. Kim, D.-K.; Lee, D.-I. Raindrop size distribution properties associated with vertical air motion in the stratiform region of a springtime rain event from 1290 MHz wind profiler, micro rain radar and Parsivel disdrometer measurements. Met. Apps. 2016, 23, 40–49. [Google Scholar] [CrossRef]
  6. Levi, Y.; Shilo, E.; Setter, I. Climatology of a Summer Coastal Boundary Layer with 1290-MHz Wind Profiler Radar and a WRF Simulation. J. Appl. Meteor. Climatol. 2011, 50, 1815–1826. [Google Scholar] [CrossRef]
  7. Liu, B.; Ma, X.; Guo, J.; Li, H.; Jin, S.; Ma, Y.; Gong, W. Estimating hub-height wind speed based on a machine learning algorithm: Implications for wind energy assessment. Atmos. Chem. Phys. 2023, 23, 3181–3193. [Google Scholar] [CrossRef]
  8. Anandan, V.K.; Sureshbabu, V.N.; Pan, C.J.; Vijayabhaskara Rao, S. Observation of wave generation and non-local perturbations in the atmosphere during the passage of a typhoon. J. Earth Syst. Sci. 2013, 122, 603–612. [Google Scholar] [CrossRef]
  9. He, J.; Li, Q.; Chan, P.-W.; Choy, C.-W.; Mak, B.; Lam, C.-C.; Luo, H.-Y. An Observational Study of Typhoon Talim over the Northern Part of the South China Sea in July 2023. Atmosphere 2023, 14, 1340. [Google Scholar] [CrossRef]
  10. He, Y.; Li, L.; Wang, H.; Xu, X.; Li, Y.; Fan, S. A cold front induced co-occurrence of O3 and PM2.5 pollution in a Pearl River Delta city: Temporal variation, vertical structure, and mechanism. Environ. Pollut. 2022, 306, 119464. [Google Scholar] [CrossRef]
  11. Hua, Y.; Wang, S.; Wang, J.; Jiang, J.; Zhang, T.; Song, Y.; Kang, L.; Zhou, W.; Cai, R.; Wu, D.; et al. Investigating the impact of regional transport on PM2.5 formation using vertical observation during APEC 2014 Summit In Beijing. Atmos. Chem. Phys. 2016, 16, 15451–15460. [Google Scholar] [CrossRef]
  12. Meng, C.; Cheng, T.; Gu, X.; Shi, S.; Wang, W.; Wu, Y.; Bao, F. Contribution of meteorological factors to particulate pollution during winters in Beijing. Sci. Total Environ. 2019, 656, 977–985. [Google Scholar] [CrossRef] [PubMed]
  13. Ma, Y.; Chen, D.; Fu, X.; Shang, F.; Guo, X.; Lang, J.; Zhou, Y. Impact of Sea Breeze on the Transport of Ship Emissions: A Comprehensive Study in the Bohai Rim Region, China. Atmosphere 2022, 13, 1094. [Google Scholar] [CrossRef]
  14. Meng, L.; Li, Y.; Han, S.; Hao, T. Influence of Sea-Land Breeze on the Concentrations of PM2.5 and O3 in Tianjin City. Res. Environ. Sci. 2019, 32, 390–398. [Google Scholar] [CrossRef]
  15. Moradi, I.; Buehler, S.A.; John, V.O.; Eliasson, S. Comparing upper tropospheric humidity data from microwave satellite instruments and tropical radiosondes. J. Geophys. Res. 2010, 115, D24310. [Google Scholar] [CrossRef]
  16. Philipona, R.; Mears, C.; Fujiwara, M.; Jeannet, P.; Thorne, P.; Bodeker, G.; Haimberger, L.; Hervo, M.; Popp, C.; Romanens, G.; et al. Radiosondes show that after decades of cooling, the lower stratosphere is now warming. J. Geophys. Res. Atmos. 2018, 123, 12509–12522. [Google Scholar] [CrossRef]
  17. Inoue, J.; Enomoto, T.; Hori, M.E. The impact of radiosonde data over the ice-free Arctic Ocean on the atmospheric circulation in the Northern Hemisphere. Geophys. Res. Lett. 2013, 40, 864–869. [Google Scholar] [CrossRef]
  18. Yamamoto, M.; Hashiguchi, H.; Fukao, S.; Shibano, Y.; Imai, K. Development of a Transportable 3-GHz Wind Profiler for Wind and Precipitation Studies. J. Meteor. Soc. Japan. Ser. II 2002, 80, 273–283. [Google Scholar] [CrossRef]
  19. Chen, Z.-Y.; Chu, Y.-H.; Su, C.-L. Intercomparisons of Tropospheric Wind Velocities Measured by Multi-Frequency Wind Profilers and Rawinsonde. Atmosphere 2021, 12, 1284. [Google Scholar] [CrossRef]
  20. Lau, E.; McLaughlin, S.; Pratte, F.; Weber, B.; Merritt, D.; Wise, D.; Zimmerman, G.; James, M.; Solan, M. The DeTect Inc. RAPTOR VAD-BL Radar Wind Profiler. J. Atmos. Ocean. Technol. 2013, 30, 1978–1984. [Google Scholar] [CrossRef]
  21. Schumann, R.S.; Taylor, G.E.; Merceret, F.J.; Wilfong, T.L. Performance Characteristics of the Kennedy Space Center 50-MHz Doppler Radar Wind Profiler Using the Median Filter/First-Guess Data Reduction Algorithm. J. Atmos. Ocean. Technol. 1999, 16, 532–549. [Google Scholar] [CrossRef]
  22. Wang, Y.; Zeng, X.; Xu, X.; Galarneau, T.J., Jr.; Li, F.; Zhao, Y. Power spectra and diurnal variation of low-level horizontal winds observed by a wind profiler radar network over China. Geophys. Res. Lett. 2024, 51, e2023GL105652. [Google Scholar] [CrossRef]
  23. Liu, B.; Guo, J.; Gong, W.; Shi, L.; Zhang, Y.; Ma, Y. Characteristics and performance of wind profiles as observed by the radar wind profiler network of China. Atmos. Meas. Tech. 2020, 13, 4589–4600. [Google Scholar] [CrossRef]
  24. Shen, L.; Zhao, C.; Yang, X. Climate-driven characteristics of sea-land breezes over the globe. Geophys. Res. Lett. 2021, 48, E2020GL092308. [Google Scholar] [CrossRef]
  25. Qian, T.; Epifanio, C.C.; Zhang, F. Topographic effects on the tropical land and sea breeze. J. Atmos. Sci. 2012, 69, 130–149. [Google Scholar] [CrossRef]
  26. Drobinski, P.; Dubos, T. Linear breeze scaling: From large-scale land/sea breezes to mesoscale inland breezes. Q. J. R. Meteorol. Soc. 2009, 135, 1766–1775. [Google Scholar] [CrossRef]
  27. Huang, M.; Gao, Z.; Miao, S.; Xu, X. Characteristics of sea breezes over the Jiangsu coastal area, China. Int. J. Climatol. 2016, 36, 3908–3916. [Google Scholar] [CrossRef]
  28. Zhang, Q.; Hu, W.; Ren, H.; Yang, J.; Deng, J.; Wang, D.; Sun, Y.; Wang, Z.; Kawamura, K.; Fu, P. Diurnal variations in primary and secondary organic aerosols in an eastern China coastal city: The impact of land and sea breezes. Environ. Pollut. 2023, 319, 121016. [Google Scholar] [CrossRef]
  29. Allouche, M.; Bou-Zeid, E.; Iipponen, J. The influence of synoptic wind on land–sea breezes. Q. J. R. Meteorol. Soc. 2023, 149, 3198–3219. [Google Scholar] [CrossRef]
  30. Xiao, Y.; Yang, J.; Cui, L.; Deng, J.; Fu, P.; Zhu, J. Weakened Sea-Land Breeze in a Coastal Megacity Driven by Urbanization and Ocean Warming. Earth's Future 2023, 11, e2022EF003341. [Google Scholar] [CrossRef]
  31. Yang, J.; Xin, J.; Zhang, Y.; Xiao, X.; Xia, J.C. Contributions of sea–land breeze and local climate zones to daytime and nighttime heat island intensity. NPJ Urban Sustain. 2022, 2, 12. [Google Scholar] [CrossRef]
  32. Huang, W.-R.; Chan, J.C.L.; Wang, S.-Y. A planetary-scale land–sea breeze circulation in East Asia and the western North Pacific. Q. J. R. Meteorol. Soc. 2010, 136, 1543–1553. [Google Scholar] [CrossRef]
  33. You, C.; Fung, J.C.H. Characteristics of the Sea-Breeze Circulation in the Pearl River Delta Region and Its Dynamical Diagnosis. J. Appl. Meteor. Climatol. 2019, 58, 741–755. [Google Scholar] [CrossRef]
  34. Cui, Z.; Mei, S.; Li, X.; Wang, S.; Zeng, M. Climatology of sea breeze over Jiangsu coast: The An overview from the ERA5 reanalysis. Int. J. Climatol. 2024, 44, 3821–3834. [Google Scholar] [CrossRef]
  35. Deng, X.; He, D.; Zhang, G.; Zhu, S.; Dai, R.; Jin, X.; Fu, W.; Shen, W.; Chen, J.; Fan, Y.; et al. Comparison of horizontal wind observed by wind profiler radars with ERA5 reanalysis data in Anhui, China. Theor. Appl. Climatol. 2022, 150, 1745–1760. [Google Scholar] [CrossRef]
  36. Zhou, X.; Cheng, Z.; Li, H.; Hu, D. Comparison between the Roles of Low-Level Jets in Two Heavy Rainfall Events over South China. J. Meteorol. Res. 2022, 36, 326–341. [Google Scholar] [CrossRef]
  37. Li, M.; Jiang, X.; Carroll, J.; Negenborn, R.R. Operation and maintenance management for offshore wind farms integrating inventory control and health information. Renew. Energy 2024, 231, 120970. [Google Scholar] [CrossRef]
  38. Li, M.; Jiang, X.; Carroll, J.; Negenborn, R.R. A closed-loop maintenance strategy for offshore wind farms: Incorporating dynamic wind farm states and uncertainty-awareness in decision-making. Renew. Sustain. Energy Rev. 2023, 184, 113535. [Google Scholar] [CrossRef]
  39. Potisomporn, P.; Adcock, T.A.A.; Vogel, C.R. Evaluating ERA5 reanalysis predictions of low wind speed events around the UK. Energy Rep. 2023, 10, 4781–4790. [Google Scholar] [CrossRef]
  40. Chen, T.C.; Collet, F.; Di Luca, A. Evaluation of ERA5 Precipitation and 10-m Wind Speed Associated with Extratropical Cyclones Using Station Data over North America. Int. J. Climatol. 2024, 44, 729–747. [Google Scholar] [CrossRef]
  41. Karipot, A.; Leclerc, M.Y.; Zhang, G. Characteristics of nocturnal low-level jets observed in the north Florida area. Mon. Weather Rev. 2009, 137, 2605–2621. [Google Scholar] [CrossRef]
  42. Rohli, R.V.; Li, C. Sea and Land Breezes. In Meteorology for Coastal Scientists; Springer: Cham, Switzerland, 2021. [Google Scholar] [CrossRef]
  43. Jia, D.; Xin, J.; Wang, Z.; Wang, W.; Wang, X.; Xiao, H.; Liu, C.; Zhou, J.; Tong, L.; Sun, Y.; et al. The dynamic, thermal and material structures of sea-land breeze circulation at the coastal of Ningbo, East China Sea. Atmos. Res. 2023, 283, 106540. [Google Scholar] [CrossRef]
  44. Azorin-Molina, C.; Chen, D.; Tijm, S.; Baldi, M. A multi-year study of sea breezes in a Mediterranean coastal site: Alicante (-). Int. J. Climatol. 2011, 31, 468–486. [Google Scholar] [CrossRef]
  45. Zhao, D.; Xin, J.; Gong, C.; Quan, J.; Wang, Y.; Tang, G.; Ma, Y.; Dai, L.; Wu, X.; Liu, G.; et al. The impact threshold of the aerosol radiative forcing on the boundary layer structure in the pollution region. Atmos. Chem. Phys. 2021, 21, 5739–5753. [Google Scholar] [CrossRef]
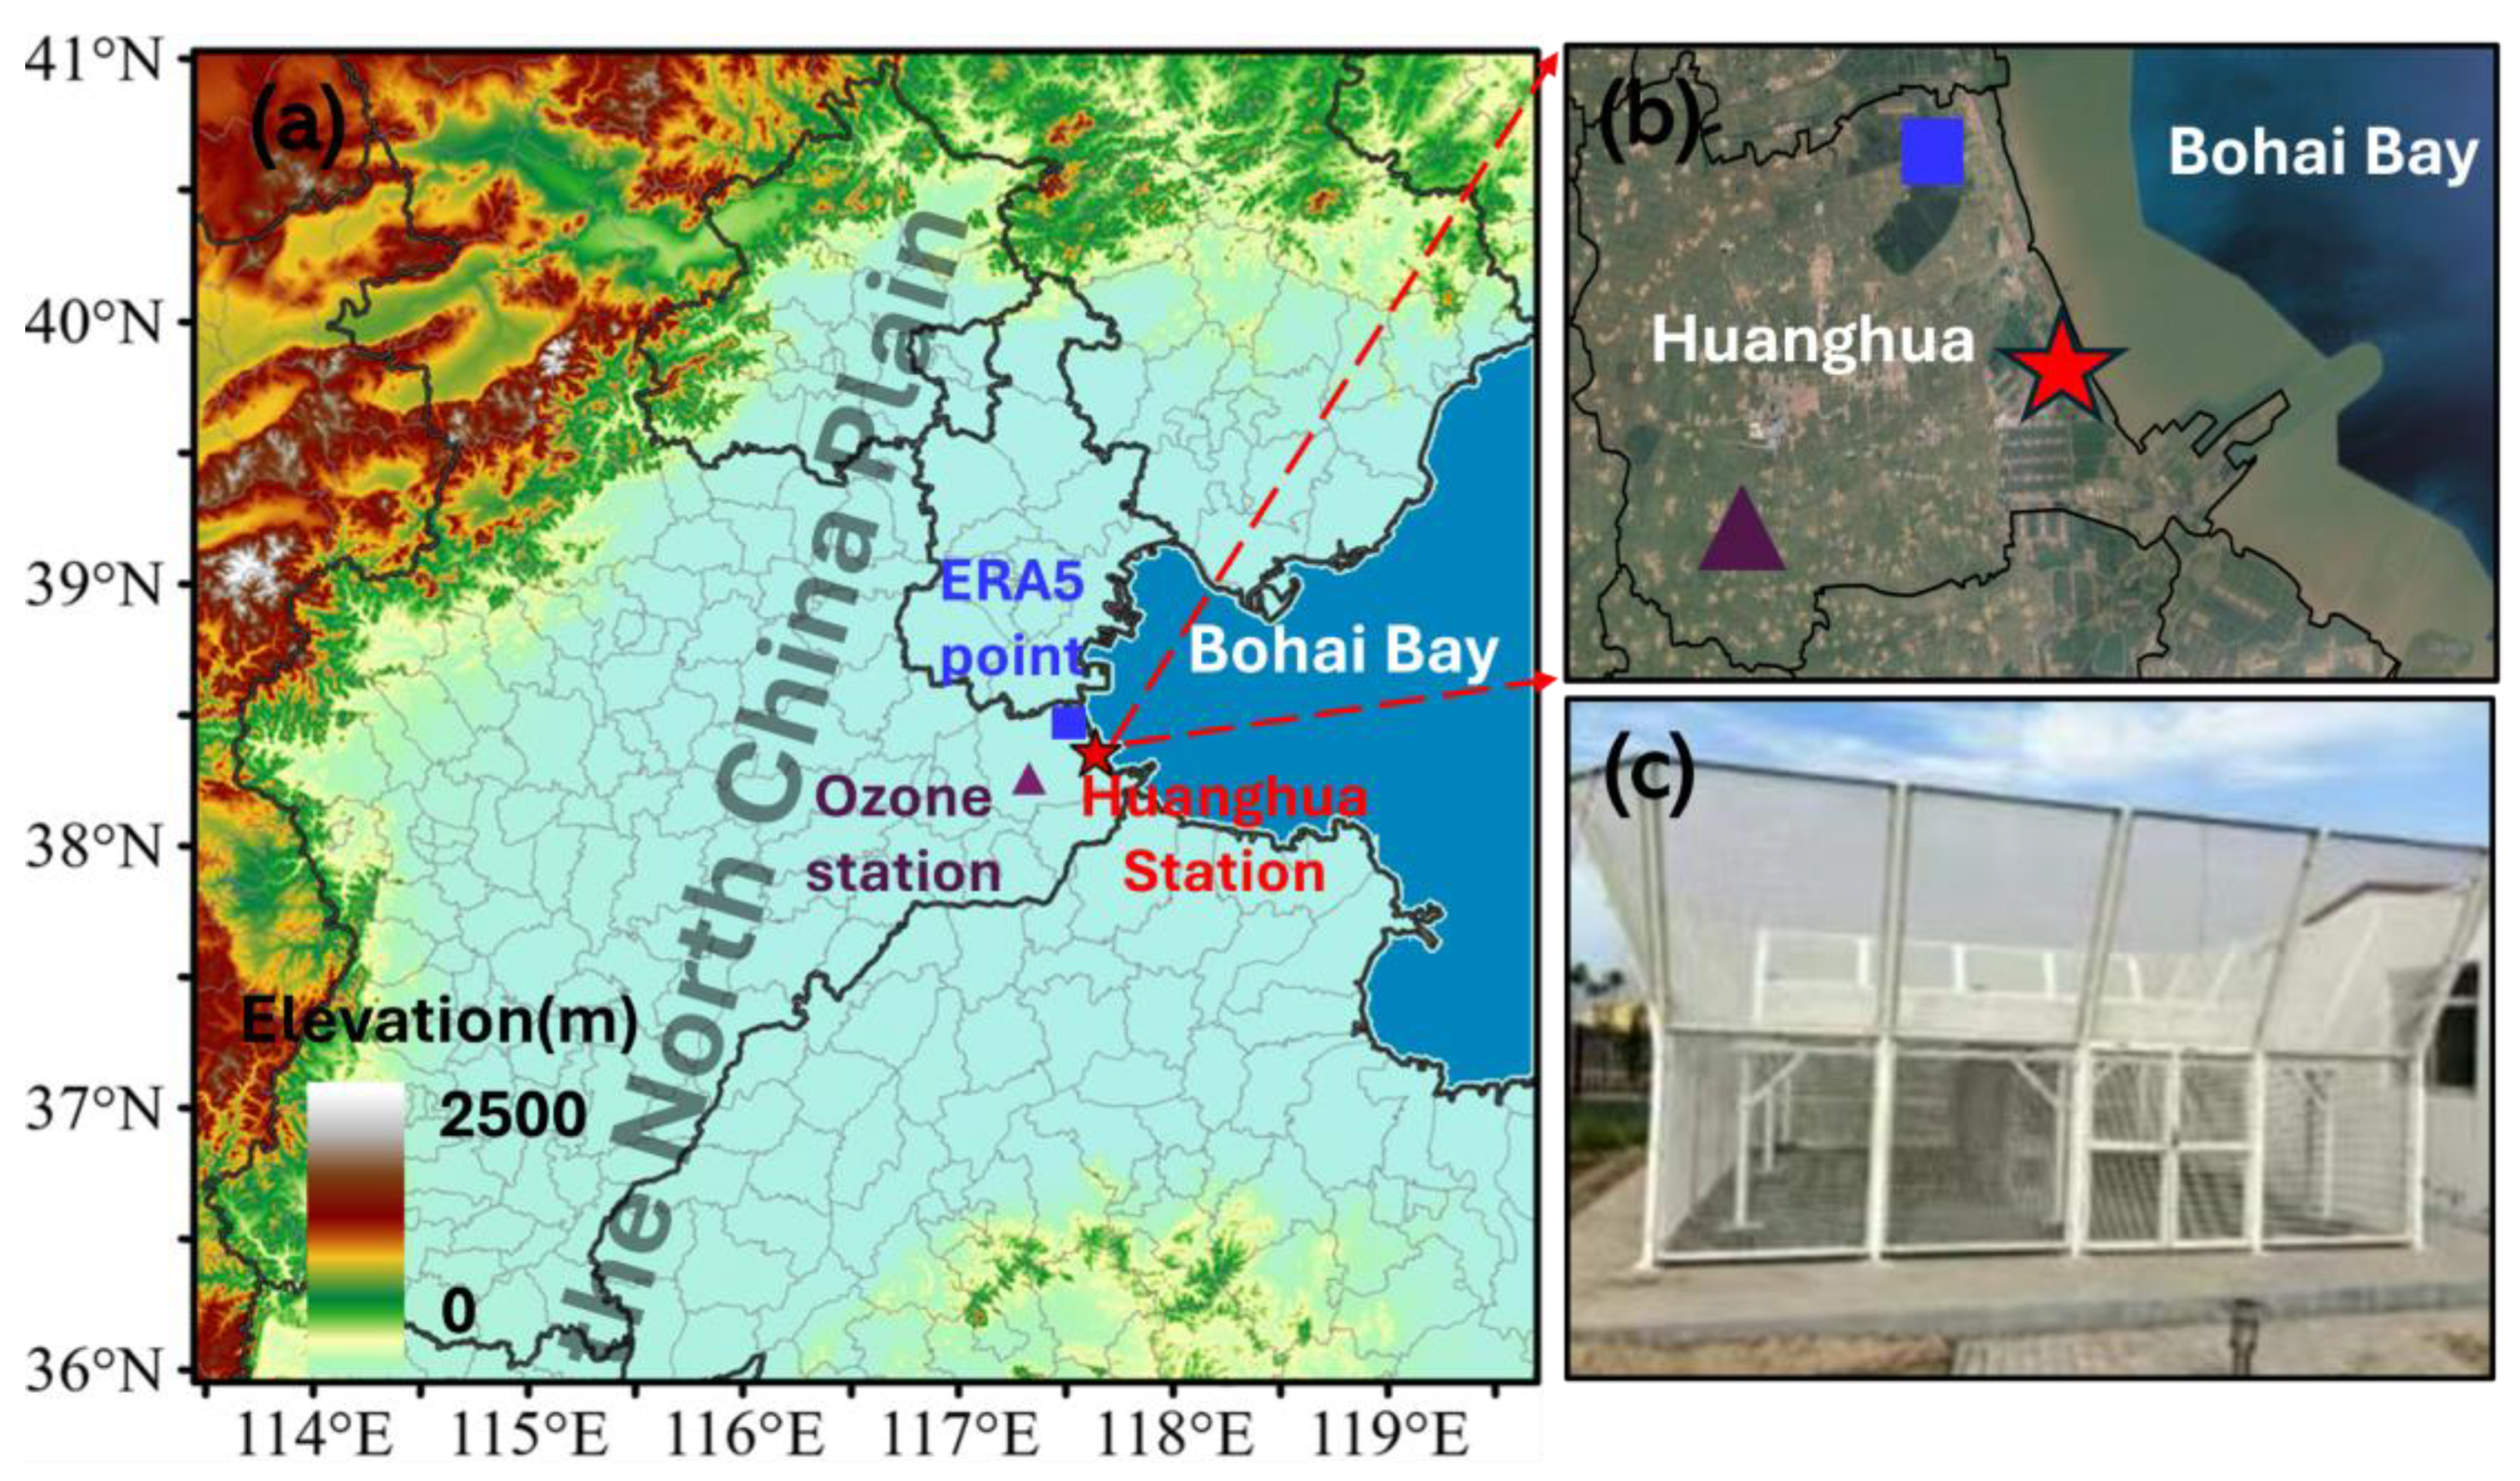
Figure 1. Geographic location and surrounding topographical environment of the Huanghua station. (a) The station location is marked with a pentagram, the ERA5 point is marked with a square, and the ozone station is marked with a triangle, mainly surrounded by the North China Plain and Bohai Bay. (b) Shows the specific coastal location of the station, including major city boundaries and coastlines. (c) Displays the tropospheric wind profile radar observation instrument (CFL-06L), which is produced by Beijing Institute of Radio Measurement of China.
Atmosphere 15 01153 g001
Figure 2. Time series of wind speed observations and ERA5 values in 150 m (a), 510 m (b), 1110 m (c), 1590 m (d), 2550 m (e), and 5070 m (f) on the Huanghua station with a daily temporal resolution during January 2020 to January 2022. Time series of wind speed observations and ERA5 values in 150 m (g), 510 m (h), 1110 m (i), 1590 m (j), 2550 m (k), and 5070 m (l) on the Huanghua station a 10-min temporal resolution during December 2021 to January 2022.
Atmosphere 15 01153 g002
Figure 3. Density scatter plots between wind speed of observations and ERA5 reanalysis data in 150 m (a), 510 m (b), 1110 m (c), 1590 m (d), 2550 m (e), and 5070 m (f) on the Huanghua station.
Atmosphere 15 01153 g003
Figure 4. Density scatter plots between wind speed of observations and ERA5 reanalysis data in different seasons; (ad) represent spring, summer, autumn, and winter, respectively.
Atmosphere 15 01153 g004
Figure 5. Time series of errors at various heights for the four seasons. The colored solid lines represent the mean wind speed of radar observations, the gray dashed lines represent the mean wind speed from ERA5, and the shaded areas indicate the deviation range of ERA5 relative to the observations. (ad) are represent the spring, summer, autumn, winter, respectively.
Atmosphere 15 01153 g005
Figure 6. Taylor diagrams of wind speed comparison at various altitudes between radar and ERA5 datasets across different months. (af) Represents the height of 150 m, 510 m, 1110 m, 1590 m, 2550 m, and 5070 m, respectively. (g) The breeze repeatability graph.
Atmosphere 15 01153 g006
Figure 7. Typical weather processes, including large-scale heavy precipitation (a), dry hot wind (b), rainstorm (c), and blizzard (d) and its corresponding variation of boundary layer height with the wind field from surface to 5000 m.
Atmosphere 15 01153 g007
Figure 8. Case of sea-land breeze accompanied by low-level jet from 08:00 11 June 2021 to 20:00 12 June 2021. (A) Wind speed (m s−1) and (B) wind direction. The dotted line is the variation of O3.
Atmosphere 15 01153 g008
Table 1. Main parameters of CFL-06 wind profile radar.
ItemsParameters
Antenna typeModular active microstrip phased array antenna
Operating frequency1270~1375 MHz
Number of beams5
Inclined beam inclination15° ± 1°
Beam width4.5°
Minimum detection height150 m
Noise factor≤6 dB
Wind speed measurement error≤1.0 m/s
Wind direction measurement error10° or less
Disclaimer/Publisher’s Note: The statements, opinions and data contained in all publications are solely those of the individual author(s) and contributor(s) and not of MDPI and/or the editor(s). MDPI and/or the editor(s) disclaim responsibility for any injury to people or property resulting from any ideas, methods, instructions or products referred to in the content.