Article

Characteristics and Source Identification for PM2.5 Using PMF Model: Comparison of Seoul Metropolitan Area with Baengnyeong Island

1
Department of Environmental Engineering, Anyang University, Anyang 14028, Republic of Korea
2
Climate and Air Quality Research Department, National Institute of Environmental Research, Incheon 22689, Republic of Korea
*
Author to whom correspondence should be addressed.
Atmosphere 2024, 15(10), 1146; https://doi.org/10.3390/atmos15101146
Submission received: 31 August 2024 / Revised: 21 September 2024 / Accepted: 23 September 2024 / Published: 24 September 2024
(This article belongs to the Special Issue Novel Insights into Air Pollution over East Asia)

Abstract

:
To establish and implement effective policies for controlling fine particle matters (PM2.5), which is associated with high-risk diseases, continuous research on identifying PM2.5 sources was conducted. This study utilized the positive matrix factorization (PMF) receptor model to estimate the sources and characteristics of PM2.5 between Baengnyeong Island (BNI) and the Seoul Metropolitan Area (SMA). We conducted PMF modeling and backward trajectory analysis using the data on PM2.5 and its components collected from 2020 to 2021 at the Air quality Research Centers (ARC). The PMF modeling identified nine pollution sources in both BNI and the SMA, including secondary sulfate, secondary nitrate, vehicles, biomass burning, dust, industry, sea salt particles, coal combustion, and oil combustion. Secondary particulate matter, vehicles, and biomass burning were found to be major contributors to PM2.5 concentrations in both regions. A backward trajectory analysis indicated that air masses, passing through BNI to the SMA, showed higher concentrations and contributions of ammonium nitrate, vehicles, and biomass burning in the SMA site compared to BNI site. These findings suggest that controlling nitrogen oxides (NOx) and ammonia emissions in the SMA, as well as monitoring the intermediate products that form aerosols, such as HNO3, are needed.

1. Introduction

Fine particulate matter (PM2.5) comes from natural sources like fugitive dust but is also heavily emitted by human activities, such as vehicle emissions, industry, and combustion. These sources significantly affect air quality and public health. PM2.5 is currently a key area of research to understand its sources and impacts for effective mitigation [1,2]. Recent studies analyzing the chemical composition of PM2.5 revealed that ionic components constitute the largest proportion, leading to an increased interest in the secondary pollutants formed through chemical reactions in the atmosphere [3,4,5].
The receptor model is one of the most widely used methods to study source apportionment of PM2.5 based on statistical analysis. The use of receptor models in atmospheric research was begun by Blifford and Meeker to calculate and address air pollution problems [6]. Receptor models allow for the estimation of pollution sources and the quantitative assessment of their contributions with observed data at the receptor site [7,8]. A multivariate receptor model, namely the positive matrix factorization (PMF) model, was developed by Paatero and Tapper to mitigate the limitations of factor analysis and has been continuously improved and updated over the years [9]. Anttila et al. conducted the first atmospheric study using the PMF model [10]. Polissar et al. and Ramadan et al. applied the PMF model for source apportionment in Alaska and Phoenix, Arizona, respectively [11,12]. Han et al. estimated the sources of PM2.5 at a high-altitude region in South Korea (Korea) and applied a novel hybrid receptor model to access contributions based on spatial information [13]. Recently, further advancements were made in receptor modeling by improving PMF-based hybrid models, which have enhanced the performance of the model [14,15].
The differences in characteristics and composition in PM2.5 are affected by various factors such as meteorological conditions, regional and seasonal characteristics, and so on [16]. The Seoul Metropolitan Area (SMA) has a very high population density and is an urban region with active traffic and commercial activities, which leads to complex patterns of PM2.5 distribution and emissions [17]. In particular, high concentrations of air pollutants are influenced by local primary emissions and the air currents of the prevailing westerlies into the SMA [18]. A recent case study showed that long-range transported pollutants, such as nitric acid (HNO3), are formed and transported across the Yellow Sea, and entered the SMA [19]. The studies on these transboundary pollutants were consistently conducted to estimate the sources and identify characteristics of PM2.5 [20,21,22,23].
This study observed concentrations of PM2.5 and its components over a two-year period at the Air quality Research Center (ARC) in both a background site and an urban site. The characteristics and contributions of PM2.5 sources in these measurement sites were identified using the PMF receptor model. Additionally, a backward trajectory analysis was applied to classify the cases where long-range pollutants passed through BNI and transported into the SMA.

2. Experimental Methods of Analysis

2.1. Sampling and Observations

This study was conducted based on data observed at the ARC in two different regions, BNI and the SMA sites (Figure 1). The Baengnyeong ARC site (37.96° N, 124.63° E) is situated the northernmost region of Korea, approximately halfway between Korea and China. BNI is well suited for monitoring and analyzing the movement of long-range pollutants, with minimal interference from anthropogenic sources, playing a role as the site of ambient background concentrations. The Seoul ARC in Bulgwang-dong (37.61° N, 126.933° E) focuses on monitoring and analyzing complex air pollution of high-concentration pollution from traffic and commercial activities in this densely populated area. The measurements at both sites were conducted over a two-year period, from 1 January 2020, to 31 December 2021.
The measurement data were based on hourly averages over the study period. The observed species included the mass concentration (µg m−3) of PM2.5 and its components: 8 ionic species (such as SO42−, NO3, and NH4+), carbonaceous species (organic carbon (OC) and elemental carbon (EC)), and 15 heavy metals (such as Pb, Cr, Cu, and so on), and their method detection limits (MDLs) were shown in Table 1. PM2.5 mass concentrations were measured using a beta attenuation monitor (BAM-1020, MetOne Instrument Inc., Grants Pass, OR, USA) based on beta-ray absorption technique. Air samples were collected at a flow rate of 16.7 L min−1. PM10 was separated via inertial impaction, and PM2.5 was isolated using a cyclone. The separated PM2.5 was collected on a Teflon filter for 42 min/h using a semi-online system. Ionic components were collected using an ambient ion monitor (AIM, URG-900D, URG Corporation, Chapel Hill, NC, USA), which were sampled for 55 min/h. The collected samples were then analyzed using ion chromatography (IC, ICS-2000, DIONEX, Sunnyvale, CA, USA). For carbonaceous components, samples were collected at a flow rate of 8 L min−1 for 45 min and analyzed using an OC/EC analyzer (Model-4, Sunset Laboratory Inc., Tigard, OR, USA) that employed thermal-optical and non-dispersive infrared (NDIR) methods. Metal species were measured using an XRF spectrometer (Xact 625i, SailBri Cooper Inc., Tigard, OR, USA), which utilized a non-destructive method to measure the wavelength and intensity of characteristic fluorescent X-rays. The detailed measurement methods and conditions for each instrument refer to the guidelines for the installation and operation of air pollution monitoring networks provided by the National Institute of Environmental Research (NIER) of Korea [24].

2.2. PMF Receptor Models

Receptor models use techniques such as factor analysis, regression models, and so on to identify pollution sources and access their contributions at the receptor site, even without prior information on the sources or emissions. The PMF receptor model is particularly notable for its ability to handle mixed and overlapping sources. It ensures that source contributions remain positive and optimizes the solution by minimizing the sum of squared residuals [9]. PMF also accounts for data uncertainty, offering improved accuracy over traditional factor analysis models. The basic equation is shown in Equation (1).
X = G × F + E
The matrix X represents a data matrix composed of n samples and m variables. G is an n × p matrix that denotes the contribution of sources, where p represents the number of sources. F is a p × m matrix indicating the source profile, and E is the residual matrix. Both G and F are calculated as positive values using the least squares method, with E minimized as a result. In this study, we used the latest version of the EPA PMF 5.0 model developed by the US EPA. The PMF model may be influenced by user decisions during data preprocessing or source estimation, which can introduce subjectivity and affect the reliability of the results. To mitigate this and standardize model operation, the National Institute of Environmental Research (NIER) has established guidelines for data preprocessing and the use of the PMF program. Following these guidelines, this study conducted pretreatments of data (i.e., outlier processing, ion balance assessment, and calculation uncertainty) [25]. Missing values were replaced with the median of the data, and the uncertainty for each measurement was calculated based on the method detection limits (MDLs) and the equation provided (Equation (2)).
U n c e r t a i n t y = M D L × 5 6 ,     C i < M D L s M e d i a n × 4 ,     M i s s i n g   v a l u e ( C i × e r r o r   f r a c t i o n ) 2 + ( M D L × 0.5 ) 2 ,     C i M D L s
where C i represents the concentration (µg m−3) of each species, and an error fraction was applied at 10% in this study. The MDLs for each species are provided in Table 1.

2.3. Back-Trajectory Analysis

Korea is located downwind in the westerly wind belt, where it is susceptible to long-range transported pollutants. Therefore, tracking those movements of air masses by backward trajectory analysis is crucial. In this study, the backward trajectory model was used to analyze long-range transported pollutants [26,27,28]. The hybrid single particle Lagrangian integrated trajectory (HYSPLIT) model was employed to trace the pathways of air pollutants and wind from external sources [29], using meteorological data from the global data assimilation system (GDAS1) archive to analyze the backward trajectories. The simulation period for the trajectories was set to 72 h (3 days), with a reference altitude of 500 m.
The analysis focused on air masses entering BNI and the SMA from the northwest. We selected cases where the trajectories passed over BNI and then reached the SMA. Trajectories crossing above 37.61° N and below 126.93° E were initially identified. Among these, those passing through BNI before arriving in the SMA were further categorized. Measurements from the two sites corresponding to these selected cases were aligned and compared.

3. Results and Discussion

3.1. Concentrations of PM2.5 and Its Components

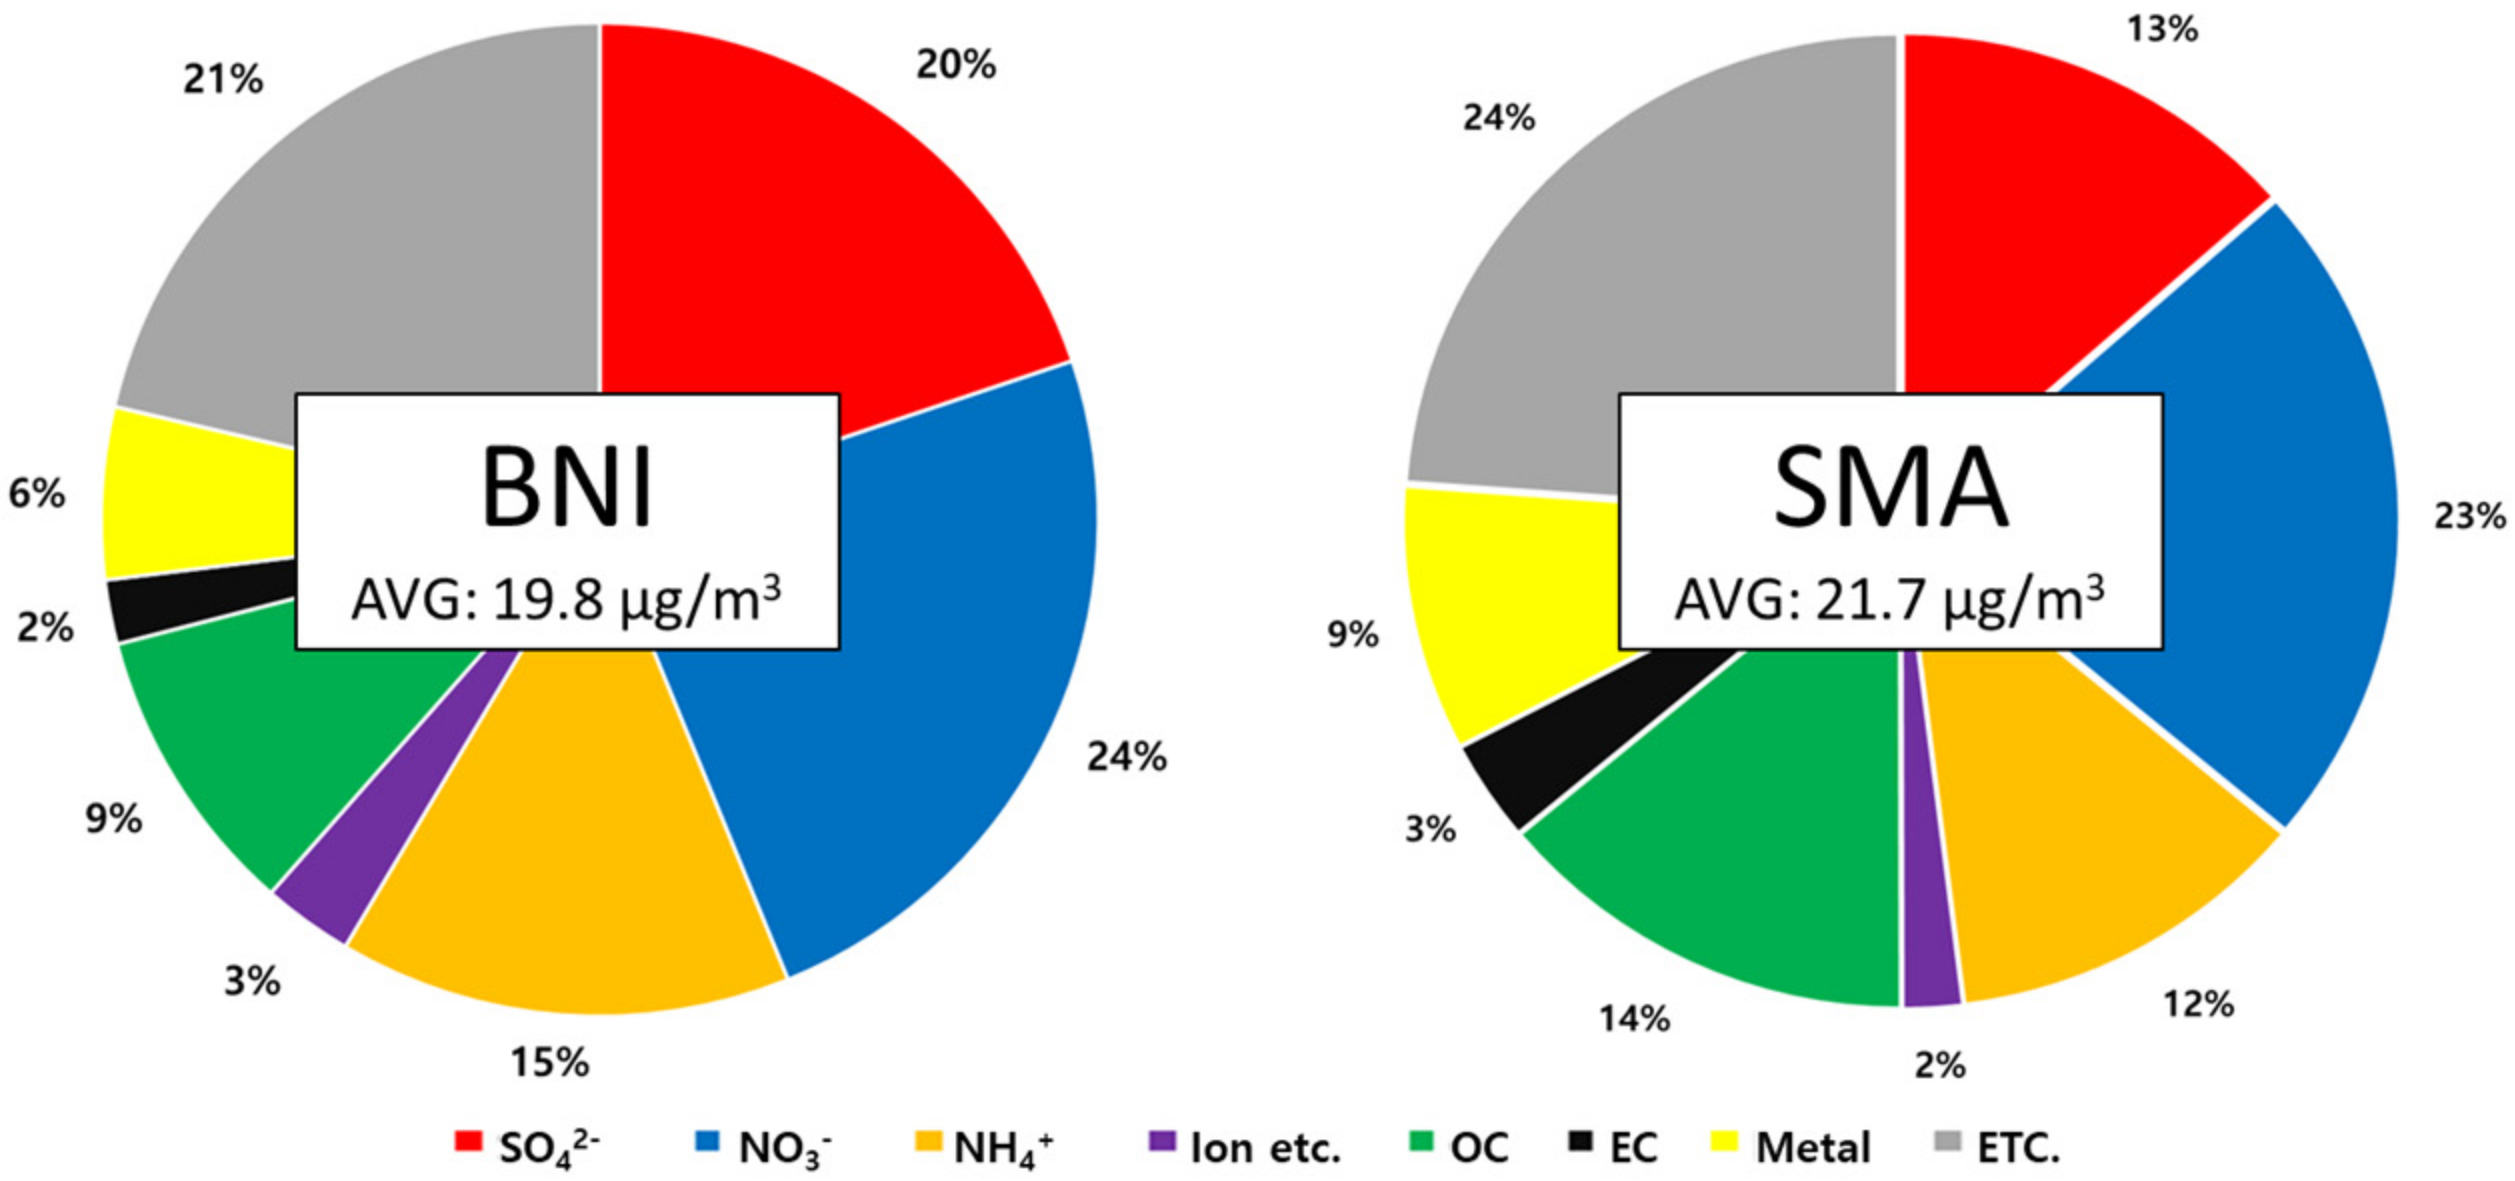
Table 2 presents the statistical summary of PM2.5 mass concentrations and components measured over two years at BNI and the SMA. The average PM2.5 mass concentrations in the SMA (21.7 ± 16.4 µg m−3) were higher than those in BNI (19.8 ± 16.8 µg m−3) due to various anthropogenic activities in the SMA. During the analysis period, yellow dust events occurred 19 and 20 times in BNI and the SMA, respectively. Aside from these events, high PM2.5 concentrations were defined as periods where the concentration exceeded 36 µg m−3 for more than 1 h, as shown in Figure 2. Most high concentration events occurred during winter, likely driven by air masses passing over BNI and into the SMA.
PM2.5 observed at BNI was composed of approximately 61% ionic species, 12% carbons, and 11% metals. In contrast, the PM2.5 composition at the SMA consisted of 50% ions, 18% carbons, and 10% metals. In both sites, ionic species such as nitrate, sulfate, and ammonium ions made up the largest fraction, and the fractions of ions in BNI were higher compared to those in the SMA (Figure 3). Among the ionic species, sulfate and ammonium had higher proportions at BNI, while nitrate levels were nearly equivalent in both sites. This suggested that secondary aerosol formation played a significant role in PM2.5 pollution at BNI, a background site. In the SMA, heavy metals and OC were at higher levels, indicating a substantial influence from primary emissions, likely due to industrial activities or fuel combustion.
Figure 4 shows the average composition ratios of PM2.5 components at each site, grouped by PM2.5 concentration levels. As PM2.5 concentration increased at both BNI and the SMA, the fraction of nitrate significantly increased. In the concentration range of 15 to 30 µg m−3, which aligned the average mass concentrations (BNI: 19.8 µg m−3, SMA: 21.7 µg m−3), the nitrate ion proportion increased by 23 percentage points at BNI and 15 percentage points at the SMA as concentrations approached 60 µg m−3. Additionally, ammonium ions also showed a proportional increase with higher PM2.5 levels. A linear relationship was observed, with both the mass concentration and proportion of nitrate and ammonium ions increasing as PM2.5 levels rose. As shown in Figure 2, high concentration events predominantly occurred in the winter, indicating aerosol formation of the secondary pollutant, such as NH4NO3.

3.2. Pretreatment for Receptor Model

Figure 5 presents the correlation analysis plots of PM2.5 and the mass equivalent concentrations of major ionic species (nitrate, sulfate, chloride, and ammonium ions), used for preprocessing PMF input data and ion balance. The ion balance between anions and cations shows a strong correlation with a slope close to 1:1, and the time series of major ionic components exhibited a strong correlation with those of PM2.5 mass concentrations, indicating the significant role of secondary aerosol formation.
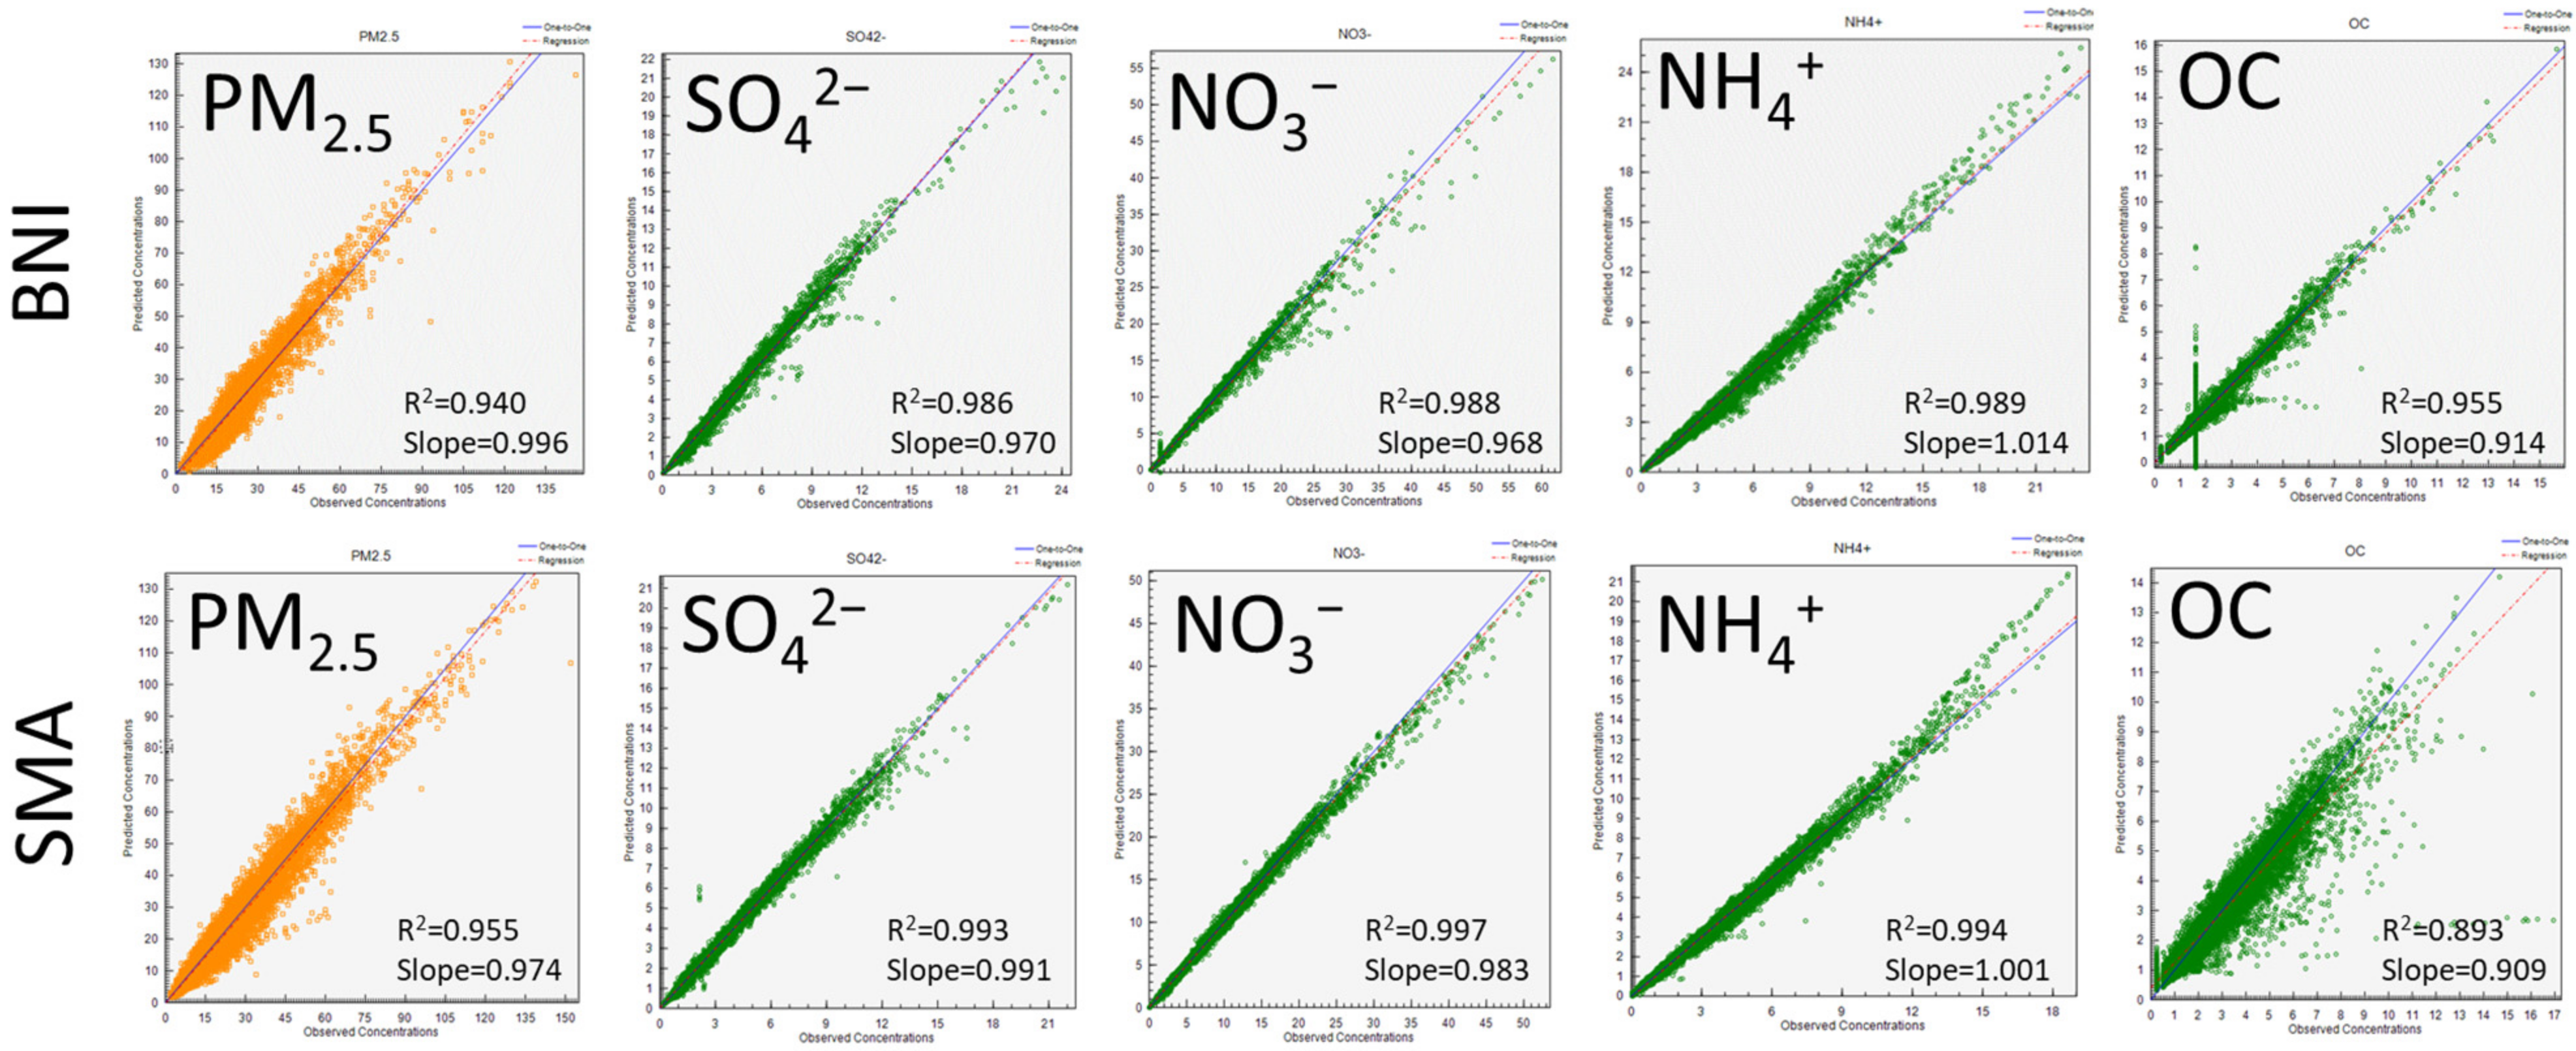
For data measured at BNI site, 9986 data points (57% of the raw data) were used, and their averaged PM2.5 concentrations was 20.7 ± 15.1 µg m−3. In the SMA, 12,668 data points (72% of the raw data) were utilized, resulting in an averaged PM2.5 mass concentration of 24.0 ± 16.9 µg m−3. The categorization process in the PMF model, which affects the accuracy of the model, was primarily determined based on the signal-to-noise (S/N) ratio. Following the initial model run, the categorization was finalized by considering several factors, including the correlation coefficient between observed and modeled values, the presence of source-specific tracers, and the number of data points below the MDLs or missing value. Consequently, the weak category included six species (such as Na+, EC, Ti, Cu, Zn, and Br) in BNI and four species (such as Na+, Cu, Zn, and Pb) in the SMA, respectively. Considering the redundancy among variables, the reliability of the data, and the model result of the base run, a few species (K+, Mg2+, Ca2+, S, V, and Cr in BNI and K+, Mg2+, Ca2+, S, V, Se, and Br in the SMA) were categorized in the bad group, and others were classified as the strong group. Figure 5 shows the correlation between the predicted and observed variables PM2.5 and key component concentrations. The coefficients of determination (R2) for the correlation between modeled and observed PM2.5 (total variables) concentrations were 0.94 for BNI and 0.955 for the SMA, which indicated that the model could explain over 94% of the observed variations (Figure 6). Furthermore, excluding the chemical species categorized as weak, most components also had R2 values above 0.7, indicating that the model reliably explains the variations in observed concentrations.

3.3. Source Apportionment of PMF Analysis

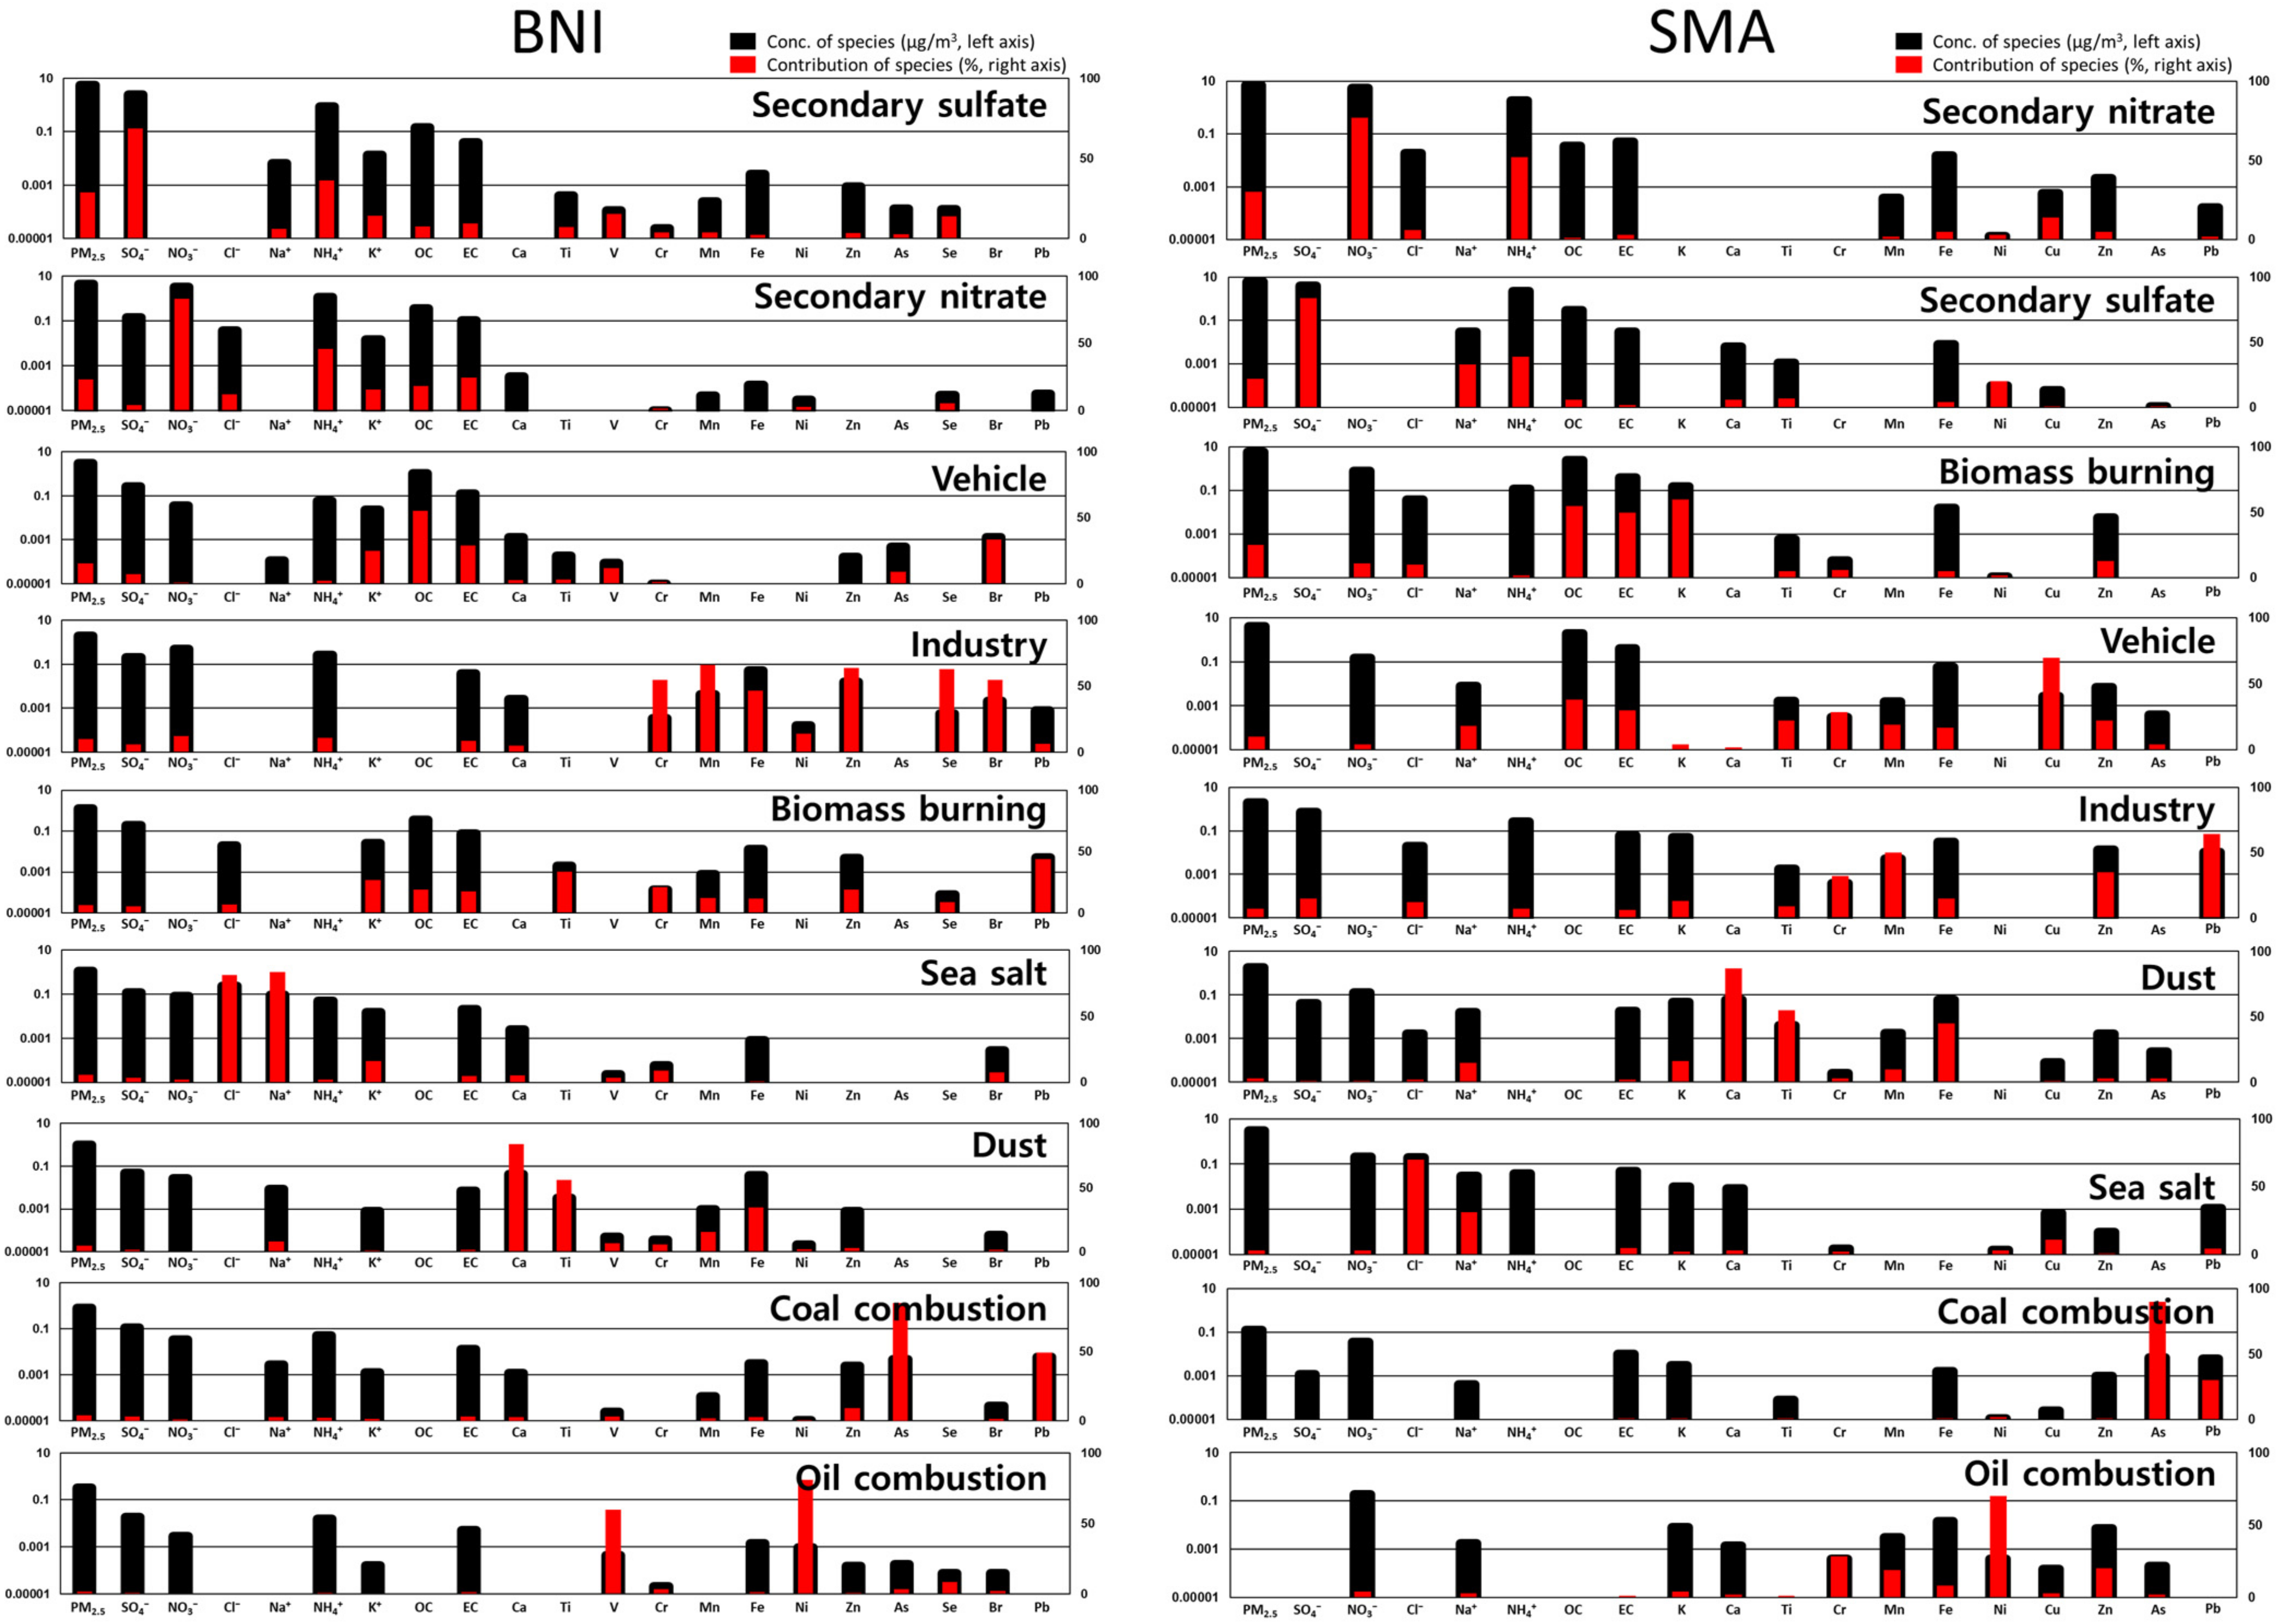
The sources contributing to ambient PM2.5 concentrations at BNI and the SMA were identified based on the species profiles utilizing the PMF model. In both sites, nine sources were identified, including secondary sulfate, secondary nitrate, vehicle emissions, industrial emissions, biomass burning, sea salt particles, soil and dust, coal combustion, and oil combustion. The profiles and contributions of the identified sources in each site are presented in Figure 7 and Table 3.
With NH4+ and SO42− as key indicators, secondary sulfate contributed 30% and 23% of the entire PM2.5 in BNI and the SMA, respectively, showing the largest proportion in BNI. Secondary sulfate is generally known to be primarily emitted during the winter due to the oxidation of SO2, which is associated with the extensive use of sulfur-containing fossil fuels such as coal [30]. Secondary nitrate characterized by NH4+ and NO3, accounted for 26% of the total PM2.5 in BNI and 27% in the SMA, respectively, which indicated significant contributions in both regions. Vehicle emissions were marked by OC, EC, Cu, and Zn and contributed 16% and 13% in BNI and the SMA, respectively. OC and EC are primarily emitted from gasoline and diesel exhaust, and a previous study suggested that Cu and Zn are dispersed mainly from brake abrasion on vehicle pedals [31]. Biomass burning was the third-largest contributing source in the SMA, accounting for 22% of the total PM2.5. In contrast, its contribution was lower at BNI, where it accounted for 8%. Biomass burning is identified by the significant contributions of OC, EC, K, and Pb and typically results from activities like crop residue burning after harvest and wood combustion. This source generally shows a higher contribution during the winter season [32]. Fe, Ni, Zn, Se, and Br are known as key indicators of industrial emissions, contributing 5% and 7% of the total at BNI and the SMA, respectively [33]. Sea salt particles, originated from natural sources such as breaking waves, are characterized by high contributions of Na+ and Cl and contributed equally at 4% to the total PM2.5 in both BNI and the SMA [34]. Ti, Mn, Fe, and Ca are key indicators of dust emissions, heavily influenced by yellow dust carried by westerly winds. These components typically show higher contributions during the spring and autumn seasons, particularly during yellow dust events [15]. The contribution of soil and dust emissions, indicated by Ti, Mn, Fe, and Ca was relatively low, accounting for 5% at BNI and 4% at the SMA. Coal combustion, characterized by As and Pb, contributed 3% at BNI, with higher contributions during winter and early spring, likely due to an increased use for heating purposes [35]. The last source was identified as oil combustion, which showed a relatively low contribution of 3% at BNI. Previous studies used Ni and V as key indicators of oil combustion emissions; however, in this study, V was excluded due to its classification as a bad variable, and only Ni was used to improve model reliability [36]. The contribution of coal and oil combustion sources in the SMA was negligible, both below 0.1%.

3.4. Backward Trajectory and Cluster Analysis

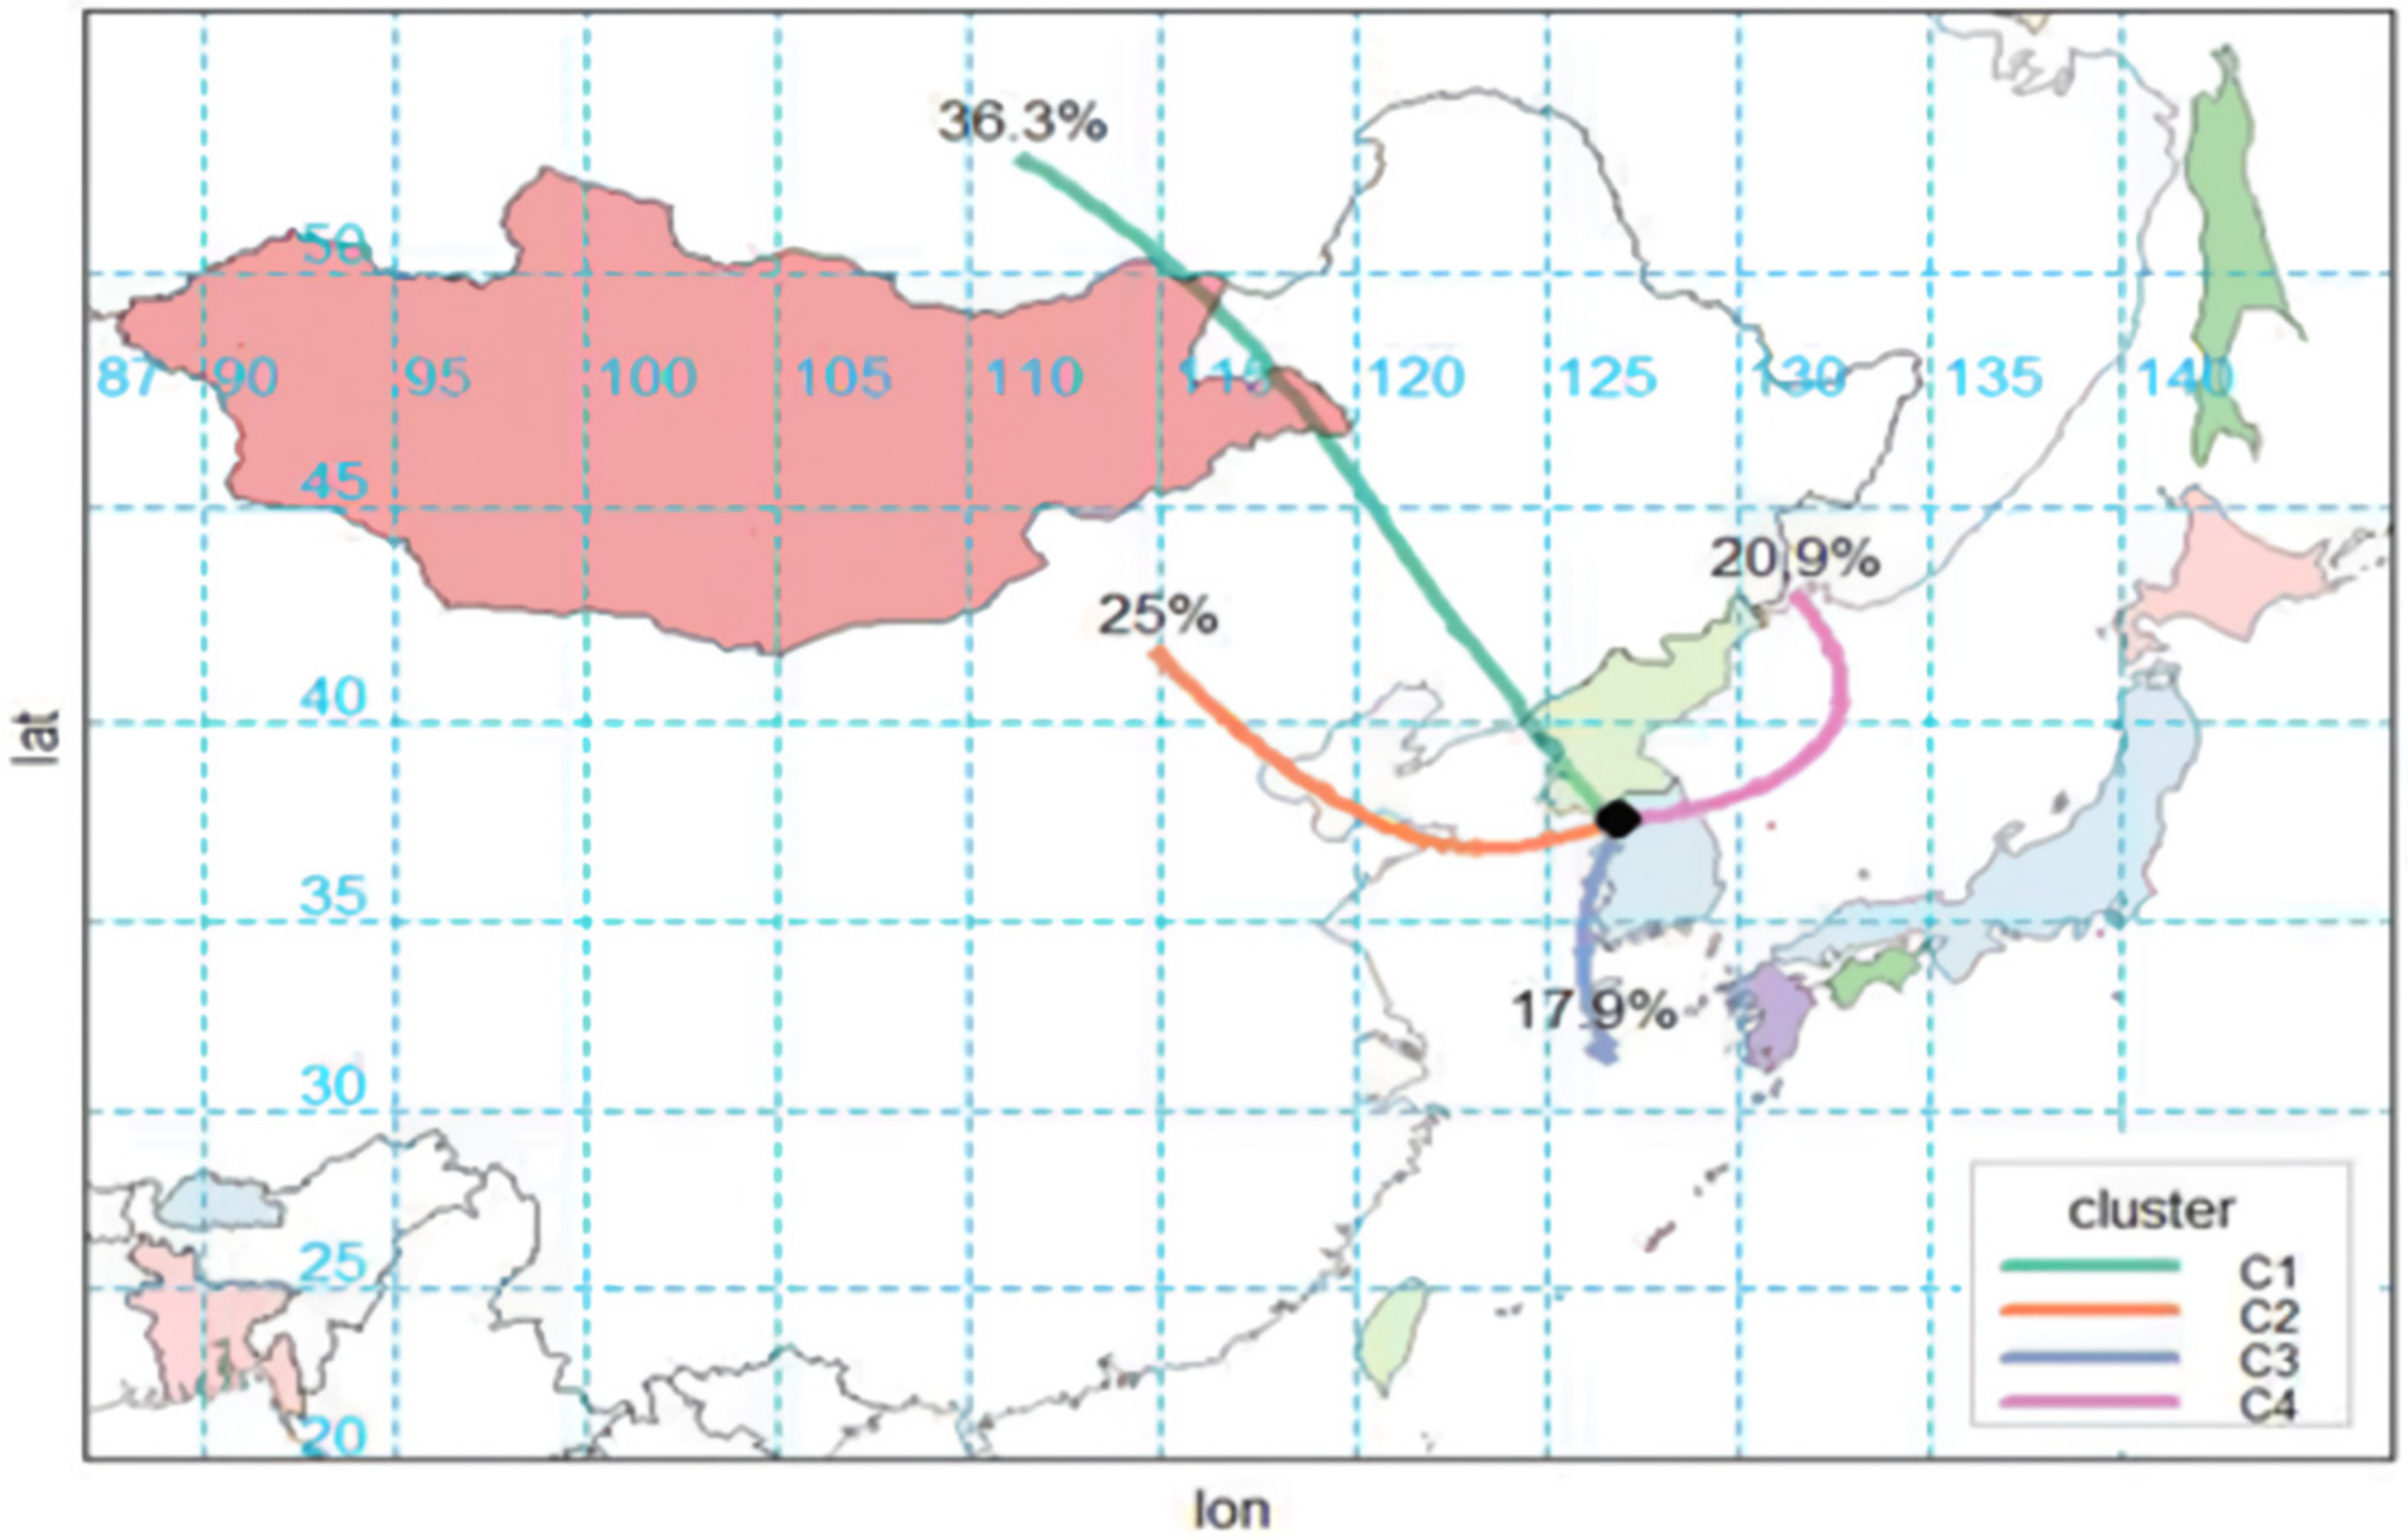
A backward trajectory analysis was conducted based on the data from the SMA, and the results of the trajectory cluster analysis are presented in Figure 8. The analysis indicated that 25% of the air masses entering the SMA originated from northeastern continental regions while 36.3% came from neighboring regions to the northwest. This suggests a significant influence of long-range transported pollutants from these regions on the air quality in the SMA.
In this study, trajectories passing through BNI before reaching the SMA were classified as case studies, with a total of 48 case days identified. The PM2.5 concentrations at both BNI and the SMA for these classified air mass trajectories were compared and are presented in Table 4. The average PM2.5 concentration of the cases was 10.3 µg m−3 higher when the pollutants reached the SMA compared to those measured at BNI. This suggests that as the air mass moved between BNI and the SMA, particularly during its passage through these two locations, there was a noticeable increase in pollutant concentration. Along with PM2.5, the average mass concentrations of most components also increased. Notably, the concentrations of NO3, NH4+, and OC were 4.9 µg m−3, 1.45 µg m−3, and 1.78 µg m−3 higher in the SMA compared to BNI, corresponding to percentage increases of 134.1%, 70.4%, 115.6%, respectively.
In the PMF model results for the classified cases, the contributions from secondary nitrate, secondary sulfate, biomass burning, vehicle emissions, industrial emissions, and sea salt were higher (Table 5). Specifically, in the SMA, the contributions of secondary nitrate and biomass burning were 5.7 µg m−3 and 4.0 µg m−3 higher, respectively, compared to BNI, representing percentage increases of 135.71% and 235.29%, respectively. The contribution from vehicle emissions also showed a slight increase of 0.7 µg m−3. On the other hand, the contributions from dust, coal combustion, and oil combustion sources were lower in the SMA.

3.5. Discussion

In cases where long-range transported pollutants entered the SMA after passing through BNI and the Yellow Sea, higher concentrations of air pollutants were observed in the SMA compared to BNI. This observation suggests the presence of additional pollution sources along the air mass trajectory between these regions. Given that BNI serves as a background site with minimal local emissions, it is evident that supplementary sources within the SMA contributed to the increased PM2.5 levels [37].
In Korea, air pollutant emissions data are reported annually by the Clean Air Policy Support System (CAPSS). This study focused on the emissions data from Seoul, Gyeonggi, and Incheon, which correspond to the SMA (Table 6). For comparison with the categorized source factors in this study, road and non-road mobile sources were combined as the vehicle source, while energy industry combustion, production processes, energy transport and storage, and waste management were combined as the industry source. The biomass burning source was categorized directly as biomass burning. Through the CAPSS data, it was confirmed that the air pollutants identified in this study were indeed emitted from the classified sources, and additional sources were identified. Particularly, emissions from sources with high contributions to the SMA, such as secondary sulfate, secondary nitrate, vehicle emissions, and biomass burning, were found to significantly impact PM2.5 pollution.
The results of the measurements and source apportionments and the formation of ammonium nitrate (NH4NO3) significantly influences PM2.5 pollution in the SMA. There are previous studies on various factors contributing to the formation of ammonium nitrate aerosols.
Kang et al. (2018) reported that the combustion of fossil fuels, leading to SOx pollution, can reduce atmospheric acidity and promote the evaporation of nitrate, thereby increasing gaseous HNO3 concentrations during the winter season [38]. In such cases, HNO3 likely remains in its gaseous form over the Yellow Sea, where NH3 emissions are minimal. As the air mass reaches NH3 local sources on the SMA, a heterogenous reaction between gaseous HNO3 and HN3 actively occurs, which leads to the formation of NH4NO3 [39]. Park et al. (2024) enhanced the accuracy of their model for simulating PM2.5 concentrations in the SMA by incorporating the formation of NH4NO3, thereby confirming the long-range transport potential of HNO3 gas and its significant impact on PM2.5 pollution in the SMA [19]. Zhang et al. (2024) reported that the wintertime increases in NO3 gas in China, influenced by photochemical reactions involving ozone (O3), plays a crucial role in nitrate formation [40]. Similarly, Lee (2019) found that as air masses from eastern and northeastern regions expanded, PM2.5 concentrations and nitrogen-oxygen isotope ratios in the SMA increased [27].
Furthermore, it is assumed that the NOx sources in the SMA affect the higher concentrations of OC and EC in the SMA compared to BNI, along with the higher contribution from vehicle emissions. The vehicle sources likely contribute significantly to NOx pollution, which converts to HNO3 in the atmosphere and reacts with NH3 to form aerosols [41,42]. These findings highlighted the importance of managing ammonia and NOx emissions within the SMA to control PM2.5 pollution.
While this study focused on comparing the background region of BNI and the densely populated SMA, additional case studies are needed for central and southwestern regions of Korea, which are adjacent to the Yellow Sea and have high ammonia emissions. Future research should also analyze the impact of biomass burning on PM2.5 concentrations, particularly considering biomass burning as a significant source of ammonia emissions.

4. Conclusions

This study examined the characteristics of PM2.5 and its components in BNI and the SMA from 2020 to 2021 and estimated the emission sources. Additionally, utilizing a trajectory analysis, we identified changes in the characteristics of long-range transported pollutants as they moved from BNI to the SMA, leading to the following implications.
  • During the measurement period, the average PM2.5 mass concentrations were 19.8 ± 16.8 µg m−3 at BNI and 21.9 ± 16.4 µg m−3 in the SMA. This indicates that a wider variety of emission sources contributed to fine particle pollution in the urban region (SMA) compared to the background region (BNI).
  • In both sites, sulfate and nitrate were the dominant components of PM2.5, and as the PM2.5 concentration increased, the relative proportion of nitrate also rose. It suggests that heterogeneous reactions between gaseous nitric acid and ammonia in the atmosphere were likely enhanced, leading to the formation of ammonium nitrate aerosols.
  • The PMF model analysis of PM2.5 sources identified nine sources at BNI, and secondary sulfate (30%) and secondary nitrate (26%) were dominant sources. Similarly, nine sources were identified in the SMA, and secondary nitrate (27%), secondary sulfate (23%), and biomass burning (22%) were dominant contributors.
  • A comparative analysis of BNI and the SMA in cases where air masses moved from BNI to the SMA revealed that the contributions of secondary pollutants (sulfate and nitrate), biomass burning, and vehicle emissions were higher in the SMA than in BNI. The increase in secondary pollutants is likely due to the HNO3 being transported via BNI and converted from NOx by local vehicles, which then reacted with additional NH3 from domestic sources.
These findings highlight the importance of managing local sources of NH3 and NOx in the SMA and surrounding regions. Additionally, for effective and scientific control of PM2.5 pollution in Korea, further research is needed to better understand the characteristics of long-range transported pollutants entering the country via the BNI.

Author Contributions

Conceptualization, J.-S.H.; methodology, K.-C.K.; validation, J.-S.H., S.-J.S. and J.-Y.A.; formal analysis, K.-C.K., H.-J.S. and C.-S.L.; investigation, K.-C.K. and H.-J.S.; data curation, S.-J.S. and J.-Y.A.; writing—original draft preparation, K.-C.K. and Y.-J.L.; writing—review and editing, K.-C.K. and C.-S.L.; supervision, J.-S.H.; funding acquisition, J.-S.H. All authors have read and agreed to the published version of the manuscript.

Funding

This research and APC were funded by Experts Training Graduate Program for Particulate Matter Management from the Ministry of Environment, Korea.

Institutional Review Board Statement

Not applicable.

Informed Consent Statement

Not applicable.

Data Availability Statement

The data presented in this study are available on request from the corresponding author. The data are not publicly available due to privacy.

Conflicts of Interest

The authors declare no conflicts of interest.

References

  1. Landrigan, P.J. Air Pollution and Health. Lancet Public Health 2017, 2, e4–e5. [Google Scholar] [CrossRef] [PubMed]
  2. Dockery, D.W.; Stone, P.H. Cardiovascular Risks from Fine Particulate Air Pollution. N. Engl. J. Med. 2007, 356, 511–513. [Google Scholar] [CrossRef] [PubMed]
  3. Choi, J.-K.; Heo, J.-B.; Ban, S.-J.; Yi, S.-M.; Zoh, K.-D. Chemical Characteristics of PM2.5 Aerosol in Incheon, Korea. Atmos. Environ. 2012, 60, 583–592. [Google Scholar] [CrossRef]
  4. Glavas, S.D.; Nikolakis, P.; Ambatzoglou, D.; Mihalopoulos, N. Factors Affecting the Seasonal Variation of Mass and Ionic Composition of PM2.5 at a Central Mediterranean Coastal Site. Atmos. Environ. 2008, 42, 5365–5373. [Google Scholar] [CrossRef]
  5. Yao, X.; Chan, C.K.; Fang, M.; Cadle, S.; Chan, T.; Mulawa, P.; He, K.; Ye, B. The Water-Soluble Ionic Composition of PM2.5 in Shanghai and Beijing, China. Atmos. Environ. 2002, 36, 4223–4234. [Google Scholar] [CrossRef]
  6. Blifford, I.H.; Meeker, G.O. A Factor Analysis Model of Large Scale Pollution. Atmos. Environ. 1967, 1, 147–157. [Google Scholar] [CrossRef]
  7. Hwang, I.; Kim, D.-S. Research Trends of Receptor Models in Korea and Foreign Countries and Improvement Directions for Air Quality Management. J. Korean Soc. Atmos. Environ. 2013, 29, 459–476. [Google Scholar] [CrossRef]
  8. McMurry, P.H.; Shepherd, M.F.; Vickery, J.S. Particulate Matter Science for Policy Makers: A NARSTO Assessment; Cambridge University Press: Cambridge, UK, 2004; ISBN 978-0-521-84287-7. [Google Scholar]
  9. Paatero, P.; Tapper, U. Positive Matrix Factorization: A Non-Negative Factor Model with Optimal Utilization of Error Estimates of Data Values. Environmetrics 1994, 5, 111–126. [Google Scholar] [CrossRef]
  10. Anttila, P.; Paatero, P.; Tapper, U.; Järvinen, O. Source Identification of Bulk Wet Deposition in Finland by Positive Matrix Factorization. Atmos. Environ. 1995, 29, 1705–1718. [Google Scholar] [CrossRef]
  11. Polissar, A.V.; Hopke, P.K.; Paatero, P.; Malm, W.C.; Sisler, J.F. Atmospheric Aerosol over Alaska: 2. Elemental Composition and Sources. J. Geophys. Res. Atmos. 1998, 103, 19045–19057. [Google Scholar] [CrossRef]
  12. Ramadan, Z.; Song, X.-H.; Hopke, P.K. Identification of Sources of Phoenix Aerosol by Positive Matrix Factorization. J. Air Waste Manag. Assoc. 2000, 50, 1308–1320. [Google Scholar] [CrossRef] [PubMed]
  13. Han, J.S.; Moon, K.J.; Lee, S.J.; Kim, Y.J.; Ryu, S.Y.; Cliff, S.S.; Yi, S.M. Size-Resolved Source Apportionment of Ambient Particles by Positive Matrix Factorization at Gosan Background Site in East Asia. Atmos. Chem. Phys. 2006, 6, 211–223. [Google Scholar] [CrossRef]
  14. Han, S.; Joo, H.-S.; Song, H.-J.; Lee, S.-B.; Han, J.-S. Source Apportionment of PM2.5 in Daejeon Metropolitan Region during January and May to June 2021 in Korea Using a Hybrid Receptor Model. Atmosphere 2022, 13, 1902. [Google Scholar] [CrossRef]
  15. Han, S.; Joo, H.; Kim, K.; Cho, J.; Moon, K.; Han, J. Modification of Hybrid Receptor Model for Atmospheric Fine Particles (PM2.5) in 2020 Daejeon, Korea, Using an ACERWT Model. Atmosphere 2024, 15, 477. [Google Scholar] [CrossRef]
  16. Kang, S.; Choi, S.; Ban, J.; Kim, K.; Singh, R.; Park, G.; Kim, M.-B.; Yu, D.-G.; Kim, J.-A.; Kim, S.-W.; et al. Chemical Characteristics and Sources of PM2.5 in the Urban Environment of Seoul, Korea. Atmos. Pollut. Res. 2022, 13, 101568. [Google Scholar] [CrossRef]
  17. Yi, S.-M.; Hwang, I. Source Identification and Estimation of Source Apportionment for Ambient PM10 in Seoul, Korea. Asian J. Atmos. Environ. 2014, 8, 115–125. [Google Scholar] [CrossRef]
  18. Jo, H.-Y.; Kim, C.-H. Identification of Long-Range Transported Haze Phenomena and Their Meteorological Features over Northeast Asia. J. Appl. Meteorol. Climatol. 2013, 52, 1318–1328. [Google Scholar] [CrossRef]
  19. Park, H.-Y.; Ahn, J.-Y.; Hong, S.-C.; Lee, J.-B.; Cho, S.-Y. The Formation and Transport of HNO3 over the Yellow Sea and Its Impact on the January 2018 PM2.5 Episode in Seoul. Environ. Sci. Atmos. 2024, 4, 670–684. [Google Scholar] [CrossRef]
  20. Ju, S.; Yu, G.H.; Park, S.; Lee, J.Y.; Lee, S.; Jee, J.; Lee, K.; Lee, M. Pollution Characteristics of PM2.5 Measured during Fall at a Seosan Site in Chungcheong Province. J. Korean Soc. Atmos. Environ. 2020, 36, 329–345. [Google Scholar] [CrossRef]
  21. Park, T.; Ban, J.; Kang, S.; Ghim, Y.S.; Shin, H.-J.; Park, J.S.; Park, S.M.; Moon, K.J.; Lim, Y.-J.; Lee, M.-D.; et al. Chemical Characteristics of PM1 using Aerosol Mass Spectrometer at Baengnyeong Island and Seoul Metropolitan Area. KOSAE 2018, 34, 430–446. [Google Scholar] [CrossRef]
  22. Ju, H.; Kim, H.C.; Kim, B.-U.; Ghim, Y.S.; Shin, H.J.; Kim, S. Long-term Trend Analysis of Key Criteria Air Pollutants over Air Quality Control Regions in South Korea using Observation Data and Air Quality Simulation. KOSAE 2018, 34, 101–119. [Google Scholar] [CrossRef]
  23. Park, S.-Y.; Kim, C.-H. Identification of Long-Range Transported Air Pollution Indicators over Northeast Asia. J. Korean Soc. Atmos. Environ. 2013, 29, 38–55. [Google Scholar] [CrossRef]
  24. NIER Air Pollution Monitoring Network Installation and Operation Guidelines 2022. Available online: https://www.airkorea.or.kr/web/board/3/769/?pMENU_NO=145&page=+1 (accessed on 30 August 2024).
  25. NIER Establishment of Guidelines for the PMF Modeling and Applications 2021. Available online: https://books.google.co.kr/books/about/%EC%88%98%EC%9A%A9%EB%AA%A8%EB%8D%B8_%EC%9A%B4%EC%98%81%EB%B0%A9%EB%B2%95%EC%9D%98_%ED%91%9C%EC%A4%80%ED%99%94.html?id=PYenzwEACAAJ&redir_esc=y (accessed on 30 August 2024).
  26. Lee, H.; Kim, N.; Jo, M.; Lee, S.; Choi, J.; Kang, K.; Choi, S. Characteristics of PM2.5 Pollution and Long-range Atmospheric Transport in Background Areas (Baengnyeong and Jeju Islands). KOSAE 2022, 38, 524–541. [Google Scholar] [CrossRef]
  27. Lee, H. Jo Isotopic Characteristics of Nitrate Aerosols for Tracing PM2.5 Sources in South Korea. Ph.D. Thesis, Seoul National University, Seoul, Republic of Korea, 2019. [Google Scholar]
  28. Oh, H.-R.; Ho, C.-H.; Kim, J.; Chen, D.; Lee, S.; Choi, Y.-S.; Chang, L.-S.; Song, C.-K. Long-Range Transport of Air Pollutants Originating in China: A Possible Major Cause of Multi-Day High-PM10 Episodes during Cold Season in Seoul, Korea. Atmos. Environ. 2015, 109, 23–30. [Google Scholar] [CrossRef]
  29. Draxler, R.R.; Rolph, G.D. HYSPLIT (HYbrid Single-ParticleLagrangian Integrated Trajectory) Model Access via NOAA ARL READY Website. Available online: https://www.arl.noaa.gov/hysplit/ (accessed on 27 July 2024).
  30. Huang, X.; Liu, Z.; Zhang, J.; Wen, T.; Ji, D.; Wang, Y. Seasonal Variation and Secondary Formation of Size-Segregated Aerosol Water-Soluble Inorganic Ions during Pollution Episodes in Beijing. Atmos. Res. 2016, 168, 70–79. [Google Scholar] [CrossRef]
  31. Thorpe, A.; Harrison, R.M. Sources and Properties of Non-Exhaust Particulate Matter from Road Traffic: A Review. Sci. Total Environ. 2008, 400, 270–282. [Google Scholar] [CrossRef]
  32. Park, J.; Kim, H.; Kim, Y.; Heo, J.; Kim, S.-W.; Jeon, K.; Yi, S.-M.; Hopke, P.K. Source Apportionment of PM2.5 in Seoul, South Korea and Beijing, China Using Dispersion Normalized PMF. Sci. Total Environ. 2022, 833, 155056. [Google Scholar] [CrossRef]
  33. Viana, M.; Pandolfi, M.; Minguillón, M.C.; Querol, X.; Alastuey, A.; Monfort, E.; Celades, I. Inter-Comparison of Receptor Models for PM Source Apportionment: Case Study in an Industrial Area. Atmos. Environ. 2008, 42, 3820–3832. [Google Scholar] [CrossRef]
  34. Liu, T.; Hu, B.; Yang, Y.; Li, M.; Hong, Y.; Xu, X.; Xu, L.; Chen, N.; Chen, Y.; Xiao, H.; et al. Characteristics and Source Apportionment of PM2.5 on an Island in Southeast China: Impact of Sea-Salt and Monsoon. Atmos. Res. 2020, 235, 104786. [Google Scholar] [CrossRef]
  35. Helble, J.J. A Model for the Air Emissions of Trace Metallic Elements from Coal Combustors Equipped with Electrostatic Precipitators. Fuel Process. Technol. 2000, 63, 125–147. [Google Scholar] [CrossRef]
  36. Lee, J.H.; Yoshida, Y.; Turpin, B.J.; Hopke, P.K.; Poirot, R.L.; Lioy, P.J.; Oxley, J.C. Identification of Sources Contributing to Mid-Atlantic Regional Aerosol. J. Air Waste Manag. Assoc. 2002, 52, 1186–1205. [Google Scholar] [CrossRef] [PubMed]
  37. Hwang, K.-W.; Kim, D.-Y.; Jin, S.-J.; Kim, I.-H. A Study on the Factors Influencing Air Pollutions in the Islands of Korean Peninsula: Focusing on the Case of Ulleung, Jeju, and Baengnyong Island. J. Korea Acad. Ind. Coop. Soc. 2020, 21, 814–824. [Google Scholar] [CrossRef]
  38. Kang, E.; Lee, M.; Brune, W.H.; Lee, T.; Park, T.; Ahn, J.; Shang, X. Photochemical Aging of Aerosol Particles in Different Air Masses Arriving at Baengnyeong Island, Korea. Atmos. Chem. Phys. 2018, 18, 6661–6677. [Google Scholar] [CrossRef]
  39. Nojiri, R.; Osada, K.; Kurosaki, Y.; Matsuoka, M.; Sadanaga, Y. Variations in Gaseous Nitric Acid Concentrations at Tottori, Japan: Long-Range Transport from the Asian Continent and Local Production. Atmos. Environ. 2022, 274, 118988. [Google Scholar] [CrossRef]
  40. Zhang, Z.; Lu, B.; Liu, C.; Meng, X.; Jiang, J.; Herrmann, H.; Chen, J.; Li, X. Nitrate Pollution Deterioration in Winter Driven by Surface Ozone Increase. NPJ Clim. Atmos. Sci. 2024, 7, 160. [Google Scholar] [CrossRef]
  41. Kim, K.; Lee, C.; Choi, D.; Han, S.; Eom, J.; Han, J. A Study on the Formation Reactions and Conversion Mechanisms of HONO and HNO3 in the Atmosphere of Daejeon, Korea. Atmosphere 2024, 15, 267. [Google Scholar] [CrossRef]
  42. Lurmann, F.W.; Brown, S.G.; McCarthy, M.C.; Roberts, P.T. Processes Influencing Secondary Aerosol Formation in the San Joaquin Valley during Winter. J. Air Waste Manag. Assoc. 2006, 56, 1679–1693. [Google Scholar] [CrossRef]
Figure 1. Sampling sites in Air quality Research Center (ARC) at Baengnyeong Island (BNI) and Seoul Metropolitan Area (SMA).
Atmosphere 15 01146 g001
Figure 2. Time series distributions of PM2.5 (black line), ammonium ions (yellow area), sulfate ions (red area), and nitrate ions (blue area) in BNI and the SMA. The brown boxes and the pink backgrounds represent the yellow dust cases and high PM2.5 pollution periods, respectively.
Atmosphere 15 01146 g002
Figure 3. Composition for major components PM2.5.
Atmosphere 15 01146 g003
Figure 4. Fraction for components of PM2.5 by mass concentration levels.
Atmosphere 15 01146 g004
Figure 5. Correlation for major chemical ions in PM2.5 at BNI and the SMA.
Atmosphere 15 01146 g005
Figure 6. Correlation for each variation of PMF. Yellow and green dots represent weak and strong categories, respectively.
Atmosphere 15 01146 g006
Figure 7. Source apportionments by using PMF model at BNI and the SMA.
Atmosphere 15 01146 g007
Figure 8. Clustering analysis for back trajectories.
Atmosphere 15 01146 g008
Table 1. Method detection limits (µg m−3) for components of PM2.5.
ComponentsMDLsComponentsMDLs
PM2.55K0.00117
Ca0.00030
SO42−0.1Ti0.00016
Cr0.00012
NO30.1Mn0.00014
Fe0.00017
NH4+0.1Cu0.00008
Zn0.00007
OC0.5As0.00006
Br0.00010
EC0.5Pb0.00013
Table 2. Summary of PM2.5 and its components measured in BNI and the SMA (units: µg m−3).
PM2.5SO42−NO3ClNa+NH4+K+Mg2+Ca2+CationAnionIonIon/PM2.5OCECCarbonCarbon/PM2.5MetalMetal/PM2.5
BNIn16,44712,55912,50511,86612,56512,56512,56512,56412,55217,54517,54517,54516,43914,57614,57117,54516,43917,54416,439
AVG19.83.94.80.30.12.90.10.00.03.29.012.20.611.90.42.30.122.10.11
Max27338.574.73.32.530.75.30.51.531.51151474.616.03.419.41.626.01.5
Min1.00.00.00.00.00.00.00.00.00.00.00.10.00.00.00.00.00.00.0
Median15.02.91.40.20.11.60.10.00.01.23.14.30.41.50.31.40.11.60.1
SD16.83.68.30.40.23.50.20.00.13.410.413.70.31.60.42.00.12.10.1
SMAn16,84715,45215,45815,45615,45815,46015,03715,45415,38717,54517,54517,54516,83515,63115,63117,54516,83517,54516,835
AVG21.72.94.90.20.12.60.10.00.12.88.110.90.503.00.73.40.181.90.10
Max15222.052.58.01.118.60.60.22.519.465.084.34.816.911.019.92.112.01.8
Min1.00.00.00.00.00.00.00.00.00.00.00.00.00.00.00.00.00.00.0
Median18.02.12.20.10.01.60.00.00.01.54.35.80.42.70.63.00.21.60.1
SD16.42.56.50.30.12.70.10.00.12.88.110.90.21.90.52.50.11.50.1
Table 3. Contribution of PM2.5 sources.
SourceContribution
BNISMA
Secondary sulfate30%23%
Secondary nitrate26%27%
Vehicle16%13%
Biomass burning8%22%
Industry5%7%
Dust5%4%
Sea salt4%4%
Coal combustion3%0.1%
Oil combustion3%0.1%
Table 4. Comparison of measured values (units: µg m−3) in cases.
SpeciesBNI (a)SMA (b)Variation (b−a)
PM2.516.226.5+10.3
SO42−2.913.21+0.30
NO33.057.14+4.09
Cl0.280.30+0.02
Na+0.110.06−0.05
NH4+2.063.51+1.45
K+0.070.07
Mg2+0.020.02
Ca2+0.030.06+0.03
OC1.543.32+1.78
EC0.320.78+0.46
S1.761.69−0.07
K0.160.21+0.05
Ca0.040.06+0.02
Ti0.000.01+0.01
V0.000.00
Cr0.000.00
Mn0.010.01
Fe0.100.17+0.07
Ni0.000.00
Cu0.000.01+0.01
Zn0.020.04+0.02
As0.010.01
Se0.000.00
Br0.000.01+0.01
Pb0.010.01
Table 5. Comparison of contribution values (units: µg m−3) for sources by PMF in cases.
SourcesBNI (a)SMA (b)Variation (b−a)
Total (PM2.5)17.529.0+11.5
Secondary sulfate5.05.8+0.8
Secondary nitrate4.29.9+5.7
Vehicle2.63.3+0.7
Biomass burning1.75.7+4.0
Dust0.90.9
Industry1.02.1+1.1
Sea salt0.71.2+0.4
Coal combustion0.80.2−0.6
Oil combustion0.5<0.1−0.4
Table 6. The emissions (units: ton/yr) of pollutants from vehicle, industry, and biomass burning sources.
Emission SourceVehicleIndustryBiomass Burning
2020 yearNOx195,77323,287874
SOx132510,66712
PM2.5517010911817
NH386662312
BC3,35,243276
2021 yearNOx181,37223,728831
SOx584932612
PM2.5457912171840
NH370266532
BC2902278276
Disclaimer/Publisher’s Note: The statements, opinions and data contained in all publications are solely those of the individual author(s) and contributor(s) and not of MDPI and/or the editor(s). MDPI and/or the editor(s) disclaim responsibility for any injury to people or property resulting from any ideas, methods, instructions or products referred to in the content.