Abstract
Atmospheric radon measurements assist in many aspects of climate and meteorological research, notably as an airmass tracer and for modelling boundary layer development, mixing heights and stability. Daughter products from radon decay are sometimes incorporated into the particle pollution measurements of commercially available beta-attenuation monitors (BAM). BAMs incorporating radon measurements are used in air quality monitoring networks and can supplement traditional radon measurements. Here we compare in-situ radon measurements from Thermo Fisher Scientific (Franklin, MA, USA) BAM instruments (Thermo Scientific 5014i, Thermo Scientific 5030 SHARP, Thermo Anderson FH62C14) at two air quality monitoring stations in New South Wales, Australia. Between systems we find strong correlations for hourly measurements (r = 0.97–0.99); daily means (r = 0.97–0.99); hour of the day (r = 0.84–0.98); and month (r = 0.82–0.98). The regression analysis for radon measurements between systems showed strong linear responses, although there are some variations in the slopes of the regressions. This implies that with correction BAM measurements can be comparable to standard measurement techniques, for example, from the Australian Nuclear Science and Technology Organisation (ANSTO) dual flow loop monitors. Our findings imply that BAM derived radon measurements are precise, although their accuracy varies. BAM radon measurements can support studies on boundary layer development or where radon is used as an atmospheric transport tracer.
1. Introduction
Radon (222Rn) is a radioactive gas that occurs naturally. It is a product of the uranium decay chain, the immediate product of radium decay (226Ra, t1/2 = 1600 y) and has a half-life (t1/2) of approximately 3.82 days. Radium is found in the Earth’s crust, soil and rocks and is hence emitted continuously over land, but the magnitude of its emissions flux varies across time and space [1].
The German scientists Hans Geitel and Julius Elster discovered radioactive elements in the atmosphere in 1901 and identified in 1904 that “radium emanation” from the soil was their source [2]. The recognition of radon’s potential for atmospheric applications has grown since the 1990s. It is used as an airmass tracer [3,4,5] in many research fields, such as evaluating the global climate model (GCM) [6,7,8] and chemical transport model performance [9]; boundary layer meteorology research [10,11,12,13]; air pollution and urban climate research [14,15,16,17]; and greenhouse gas emission source identification and quantification [18,19,20].
Radon impacts directly on human health. It is inducive to gene mutations and chromosomal aberrations and hence it is carcinogenic [21]. Radon exposure is a leading cause of lung cancer [22] and amplifies the health impacts of particle air pollution [23].
Continuous radon measurements occur within some monitoring networks, such as the Global Atmosphere Watch (GAW) network of the World Meteorological Organisation (WMO) [24] and the Integrated Carbon Observation System (ICOS) [25]. These networks are often focussed on specific techniques, and hence there is limited harmonisation of measurements and measurement methods [26].
Continuous radon measurements typically are made using one of three methods: (1) dual flow-loop, twin filter detectors measuring radon directly via fluorescence [27], (2) collecting particles on a single filter paper and measuring the decay of radon progeny attached to the particles [28], and (3) electrostatic precipitation [29,30]. The Australian Nuclear Science and Technology Organisation (ANSTO) twin filter, dual flow-loop system, provides low minimum detection limits and high-precision [31,32,33] and is the primary radon instrument at many GAW and ICOS stations.
Radon measurement techniques have been compared in several studies. A study at a south-western Germany mountaintop site [34] showed high correlations (R2 in the range of 0.68–0.90) between a single filter monitor and the ANSTO monitor. Another study compared the ANSTO monitor and single filter monitors at three locations in Europe and compared different single filter monitors at another six European locations [35], finding that measurements from different systems were comparable. A study that compared the three main techniques at two sites near Paris [36] showed high correlations between instruments (R2 of 0.90–0.93), although that study was only for a relatively short period (2 months and 3 weeks).
In contrast to radon specific monitors, beta-attenuation monitors (BAM) are designed to principally measure atmospheric particle pollution, with radon measurements a secondary measurement stream in some BAMs. The BAM technique for estimating particle mass measures the attenuation of beta radiation by particles collected on a filter [37] which is in effect the same technique as the radon specific single-filter method.
A recent study comparing radon measurements from an ANSTO monitor and a BAM in Sydney, Australia [38], found strong correlations between systems for hourly measurements (R2 = 0.91), daily means (R2 = 0.95), hour of day (R2 = 0.72–0.94) and by month (R2 = 0.83–0.94). This study demonstrated that there is potential for using BAMs to obtain networked radon measurements and to supplement high-grade radon specific monitors. However, the study utilised a single BAM instrument at a single site and only for a single year.
BAM radon measurements have been used to describe atmospheric stability in Rome, Italy [39], and in Lanzhou and Jinhua, China [40,41]. Outside Italy and China, there have been few studies utilising BAM radon measurements, and there have been none that we are aware of that compare the relative performance of radon measurements between different BAM instruments.
Our motivation for this study is to extend the work of Riley et al. (2023) [38] by comparing the performance of radon measurements from different commercially available BAMs. If the radon measurements from the different instruments can be shown to be similar, this will further support the use of BAMs for radon measurements in air quality monitoring networks, assisting to fill existing gaps in radon measurements regionally and globally.
If the instruments are shown to be precise, and there are no systematic biases due to the prevalent weather or seasonal conditions, then we hypothesize that radon measurements from BAMs could be used for boundary layer development studies at individual locations and across regions, particularly in urban environments. This is of interest to researchers interested in urban boundary layer development such as urban climatologists and air pollution meteorologists.
2. Materials and Methods
2.1. Site Locations
Measurements were conducted at two locations in New South Wales (NSW), Australia as part of a series of instrument acceptance testing for PM2.5 monitors within the NSW Air Quality Monitoring Network (AQMN) [42].
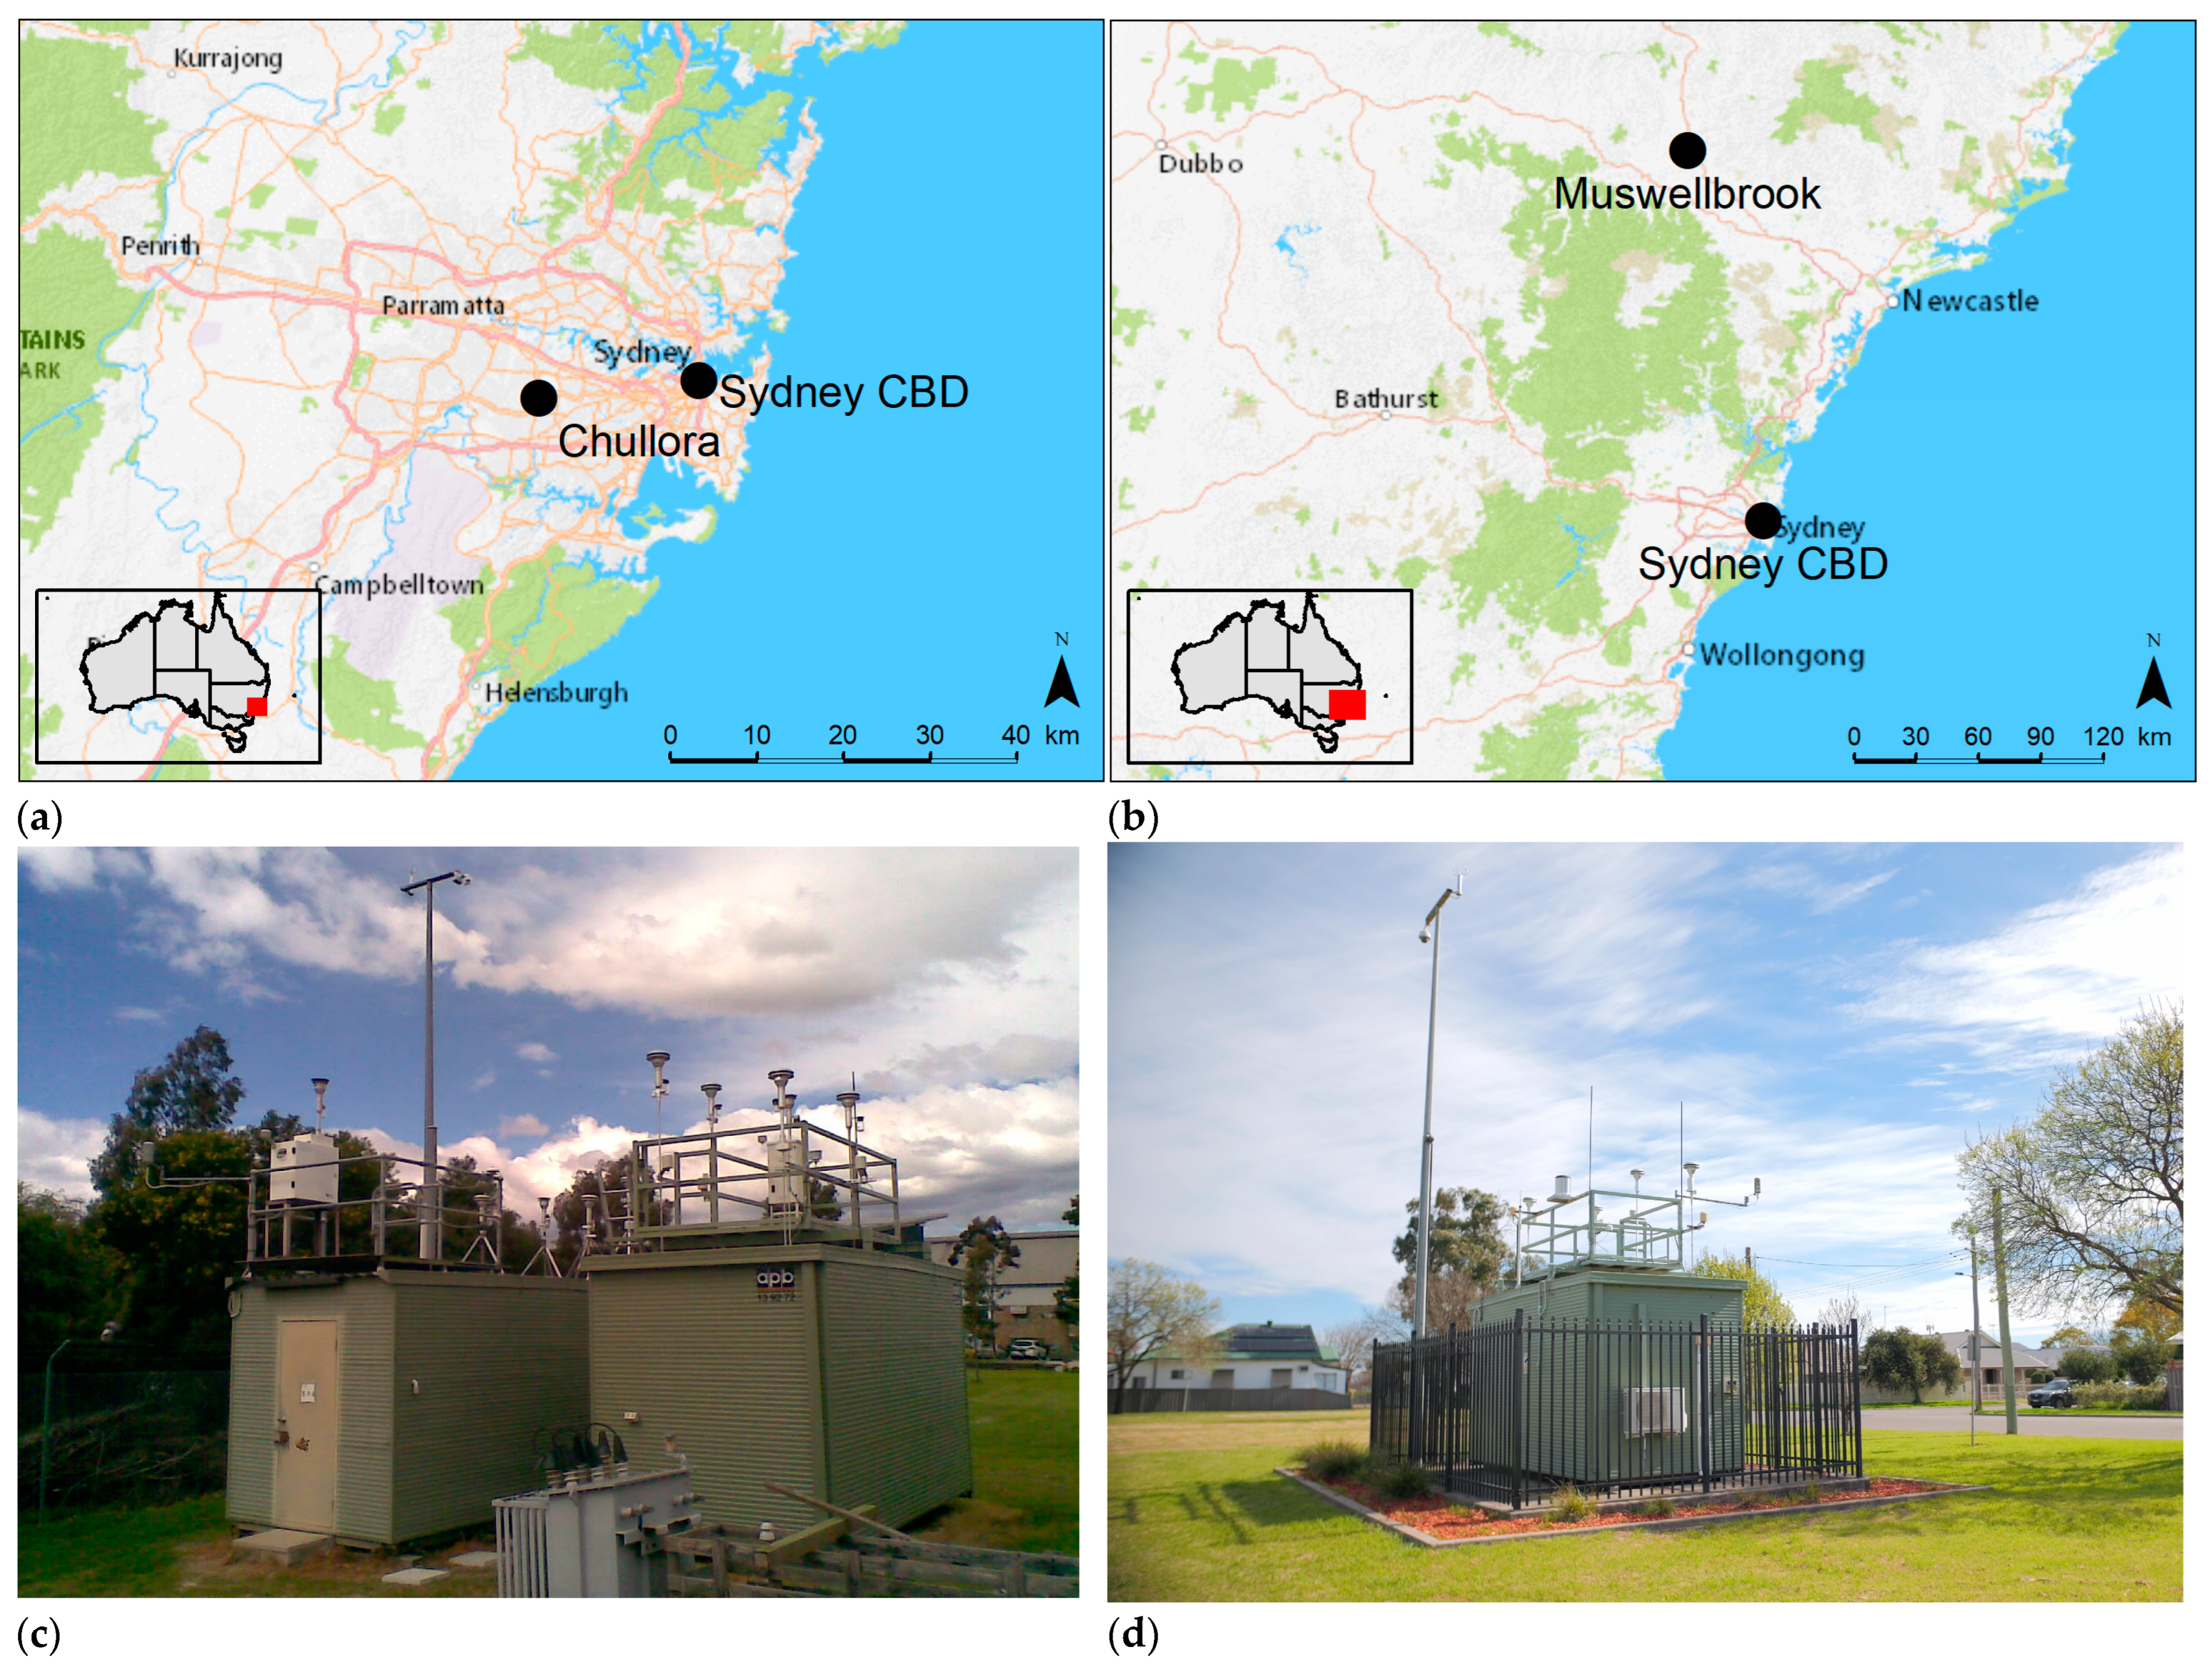
The first series of tests were undertaken at Chullora (Figure 1a,c), a suburb of Sydney (population~5.3 m). Sydney is in the mid-latitudes (34° S, 151° E) with a Köppen–Geiger climate classification of Cfa, with humid sub-tropical traits such as cool winters and warm and hot summers. The greater city occupies a coastal basin that is bounded by the Pacific Ocean to the east, the Blue Mountains (reaching an altitude of 1189 m.a.s.l.) to the west, the Hawkesbury River to the north and by the Georges River and Woronora Plateau to the south. The geology of the Basin is dominated by sandstone and Triassic shales with two major soil types, sandy loams and alluvium [43].
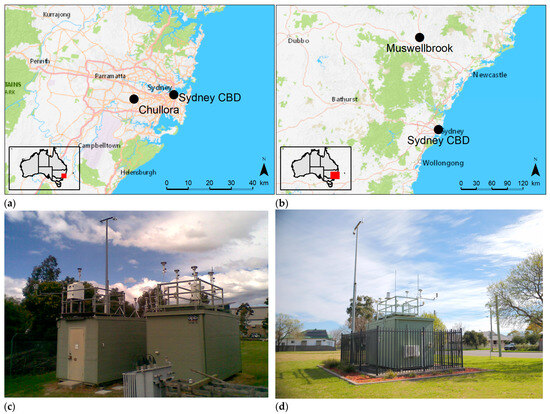
Figure 1.
Study locations showing positioning with respect to the Sydney CBD (a,b) and photographs of the Chullora (c) and Muswellbrook (d) monitoring compounds.
The suburb of Chullora is about 15 km west of the CBD (Figure 1a). It is a major hub of transport and logistics and houses commercial, educational and light-industrial facilities. The NSW Government Department of Planning and Environment (DPE) Chullora air quality monitoring station is at 33.89° S, 151.05° E (Figure 1c). The site monitors local meteorology, and air pollutants, including O3, NO2, NO, NOx, SO2, CO, PM10, PM2.5, black carbon and visibility.
Measurements were also conducted at Muswellbrook, a small town in the Upper Hunter Valley region of NSW. Muswellbrook has a population of 16,000 people and is located approximately 110 km NW of Newcastle (pop. 400,000) and 180 km NNW of Sydney (Figure 1b). Muswellbrook has the same climate classification as Sydney (Köppen–Geiger, Cfa, humid subtropical). The average mean temperature is ~17 °C and annual mean precipitation is ~630 mm.
The town is in a region with extensive opencut and underground coal mining activity. Two large coal fired power stations (Liddell—2000 MW, Bayswater—2640 MW) are located approximately 15 km SSE of the town. Liddell ceased operations in April 2023. Agricultural industries including grazing, dairying, equestrian and viticulture are also significant contributors to the local economy. Geologically, the Upper Hunter Valley is a sub region of the Sydney Basin, dominated by sandstone and Triassic shales. The Upper Hunter region features three major soil types; clay (from shales and volcanic rocks), alluvium along the Hunter River floodplain and sandy soils (which originate from the Hawkesbury sandstone) [43].
2.2. Study Period
The Chullora station has been used as a primary location for instrument intercomparison studies and acceptance testing within the NSW AQMN. Intercomparisons of multiple PM2.5 measurement techniques at Chullora commenced in 2010 and were completed in 2019. Our focus is on the 12-month period from 1 June 2011–31 May 2012, in which multiple BAMs logging radon data were operated during the PM2.5 comparison study. This period saw above-average temperatures and average or above-average rainfall [44,45].
The second comparison occurred at Muswellbrook. Here we report results from a 36-month period (1 September 2015 to 31 August 2018) in which a BAM PM2.5 intercomparison occurred. The period saw average to below-average rainfall and very much above-average temperatures [46,47].
2.3. Instrumentation
This is a comparison of convenience, building off data that was acquired during intercomparison studies of various PM2.5 measurement techniques and different BAM instruments. These comparisons were focussed on the assessment of the relative performance of the instruments in measuring PM2.5 and were not specifically designed for radon inter-comparisons.
The Chullora study compared several BAMs from different manufacturers, but not all instruments measure or log radon data. The three instruments that did acquire radon data are all from the same family of instruments from Thermo Fisher Scientific (Franklin, MA, USA). The Thermo Scientific BAMs (5014i, 5030 SHARP (Synchronized Hybrid Ambient Real-time Particulate), and FH62C14), each have similar sampling techniques, but with some minor variations (see below).
The Muswellbrook comparison was between the Thermo Scientific 5014i and 5030 SHARP monitors.
All instruments were configured to sample PM2.5. Inlet heights are about 4 m above ground level. For each instrument, sample air was drawn at a 16.7 L/min volumetric flow rate through a Very Sharp Cut Cyclone (VSCCTM) sampling head. The instruments were housed in temperature-controlled buildings (Figure 1c,d).
The beta attenuation measurement technique is common across all instruments. The technique measures the attenuation of beta radiation (14C source < 3.7 MBq) by solid particles collected on a filter tape. The amount of radiation attenuated is exponentially dependent on the particle mass alone [48]. However, the 14C source is not the only source of beta radiation within the sample system. 222Rn and its progeny can be attached to airborne particles and these particles continue to decompose when collected on the BAM sample filter, with the radiation released during decay interfering with the PM2.5 mass estimates.
To control for interferences from radon decay, Thermo BAMs incorporate a radon measurement estimate from a proportional X-ray α–β–ϒ detector (LND4335, LND Inc., New York, NY, USA). The detector estimates radon through changes in the proportion of α and β particles collected on the BAM filter tape. The α particles from 222Rn à 218Po à 214Pb are related to the β particles from the 214Pb à 214Bi à 214Po decay chain.
The activity concentration (CRn) of 222Rn is given by
where
- = detection efficiency of α particles
- = gross α particle count rate [s−1]
- = background α particle count rate (unloaded filter) [s−1]
- = air flow [m3 s−1]
- = 4550 s; equilibrium constant for 222Rn daughter nuclides
Equation (1) is applied by the instrument when radiological equilibrium of the 222Rn decay is reached. In the instrument manual (https://tools.thermofisher.com/content/sfs/manuals/EPM-Model5014i-Manual.pdf, accessed 1 November 2023), the manufacturer states it as ~90 min after a filter change. We note the stated equilibrium time (90 min, 5400 s) differs from the equilibrium constant of 4550 s in (1).
Each instrument was configured to meet United States Environmental Protection Agency (EPA) PM2.5 equivalence requirements (5014i: EQPM-1102-150, FH62C14: EQPM-1102-150, 5030: EQPM-0609-184). This requires the filter tape to advance every 8 h or if the filter becomes overloaded. Tape advances were set to occur at 0000 h, 0800 h and 1600 h local time at Chullora. At Muswellbrook the tape advance times for the 5030 SHARP were set as per Chullora, but the 5014i, they were set at 0400 h, 1200 h and 2000 h.
Temperature, humidity, flow and pressure sensors are calibrated at least quarterly. The proportional α/β detector is calibrated annually.
All BAMs use the same beta attenuation monitoring system design, but the 5030 SHARP integrates a nephelometer with the BAM measurement system. All instruments implement radon measurements and corrections as described above. However, the firmware of each instrument varies, and the logging and reporting of radon measurements differs between instruments. In the standard configuration, communications protocols for the FH62C14 and 5030 report radon as the “EEC activity concentration”, that is, the equilibrium equivalent concentration, together with the alpha activity from the G-M counter. The EEC for radon is defined as [49]
where
- = activity concentration of 218Po
- = activity concentration of 214Pb
- = activity concentration of 214Bi
We note that the instrument manufacturer does not state the details on the EEC calculations, nor any assumed equilibrium factors. It is inferred in the instrument manual that the proportional alpha-beta-gamma detector can discriminate between the activity of the sources of the radon daughter nuclides. The 5014i in standard configuration returns only one radon channel but can be configured to match the communications protocol of the FH62C14/5030. In this study, the 5014i communications were not configured to return the EEC radon activity concentration, and only returned the default radon measurement. Without further information from the manufacturer, we have assumed that the radon values returned are equivalent for each instrument, noting that the 5014i can be configured to return the EEC if the user chooses to do so.
Meteorological measurements included 10 m horizontal wind measured by sonic anemometer (MetOne 50.5, MetOne Inc., Grants Pass, OR, USA) and temperature and humidity using a platinum resistance thermometer and thin-film capacitance, respectively (Vaisala HMP45 or HMP155, Vaisala Oyj, Vantaa, Finland), housed in a non-aspirated radiation shield approx. 2.5 m above ground level.
2.4. Data Handling and Analysis
At Chullora, the study period covered 26 August 2010–8 June 2012, where all three instruments were in operation. However, during this time there were several periods where one or more instruments suffered faults. We therefore focus on the 12-month period (1 June 2011–31 May 2012) where the data return across all three instruments was maximised while giving a full year of data for analysis (Figure 2). At Muswellbrook, we focus on the data collected between 1 September 2015–31 August 2018, where the data recovery was greatest. This also delivers three complete years of data across all seasons.

Figure 2.
Time series data for the Chullora comparison.
We first compile a time series of hourly radon measurements, excluding all data that failed quality control checks and data flagged for removal due to scheduled maintenance and calibration activities. The resulting data recovery rates were 80–85% at Chullora and 81–86% at Muswellbrook (Table 1).

Table 1.
Details of the BAM instruments, their installation and removal, and raw data recovery rates for each study period, 1 June 2011–31 May 2012 at Chullora and 1 September 2015–31 August 2018 at Muswellbrook.
These “raw” data recovery rates exclude data immediately after the scheduled filter tape progression, which occurred every 8 h in accordance with US EPA requirements. After the filter tape advance and while the newly exposed tape reaches radiological equilibrium, radon data are considered invalid. Riley et al. (2023) [38] found that after a filter change radon data for the following hour were anomalous when compared to a high-quality ANSTO instrument. Here we follow their approach and fill the gaps due to these systematic sampling issues by excluding records for the hour of a filter tape advance and the hour following the tape advance and then infilling the excluded data points by cubic spline interpolation. Infilling greatly increases the availability of data for comparison (Table 1).
Hourly, diurnal, daily, weekly and monthly comparisons are made based on the hourly time series. Daily averages are only included where 75% or greater of the hourly measurements in the day are valid. Our analysis focusses on simple descriptive statistics with the assessment of the coefficients of determination (r, R2) and linear regression to infer correlations between instruments and goodness of fit for linear models.
3. Results
We analyse results from Chullora first, assessing mean concentrations and the distributions of data from the different instruments. Following this we examine diurnal and monthly variations between instruments and explore if there are any instrument specific variations due to environmental conditions (temperature, humidity and wind). The approach is repeated for the Muswellbrook data.
3.1. Annual and Monthly Mean Concentrations and Data Distributions—Chullora
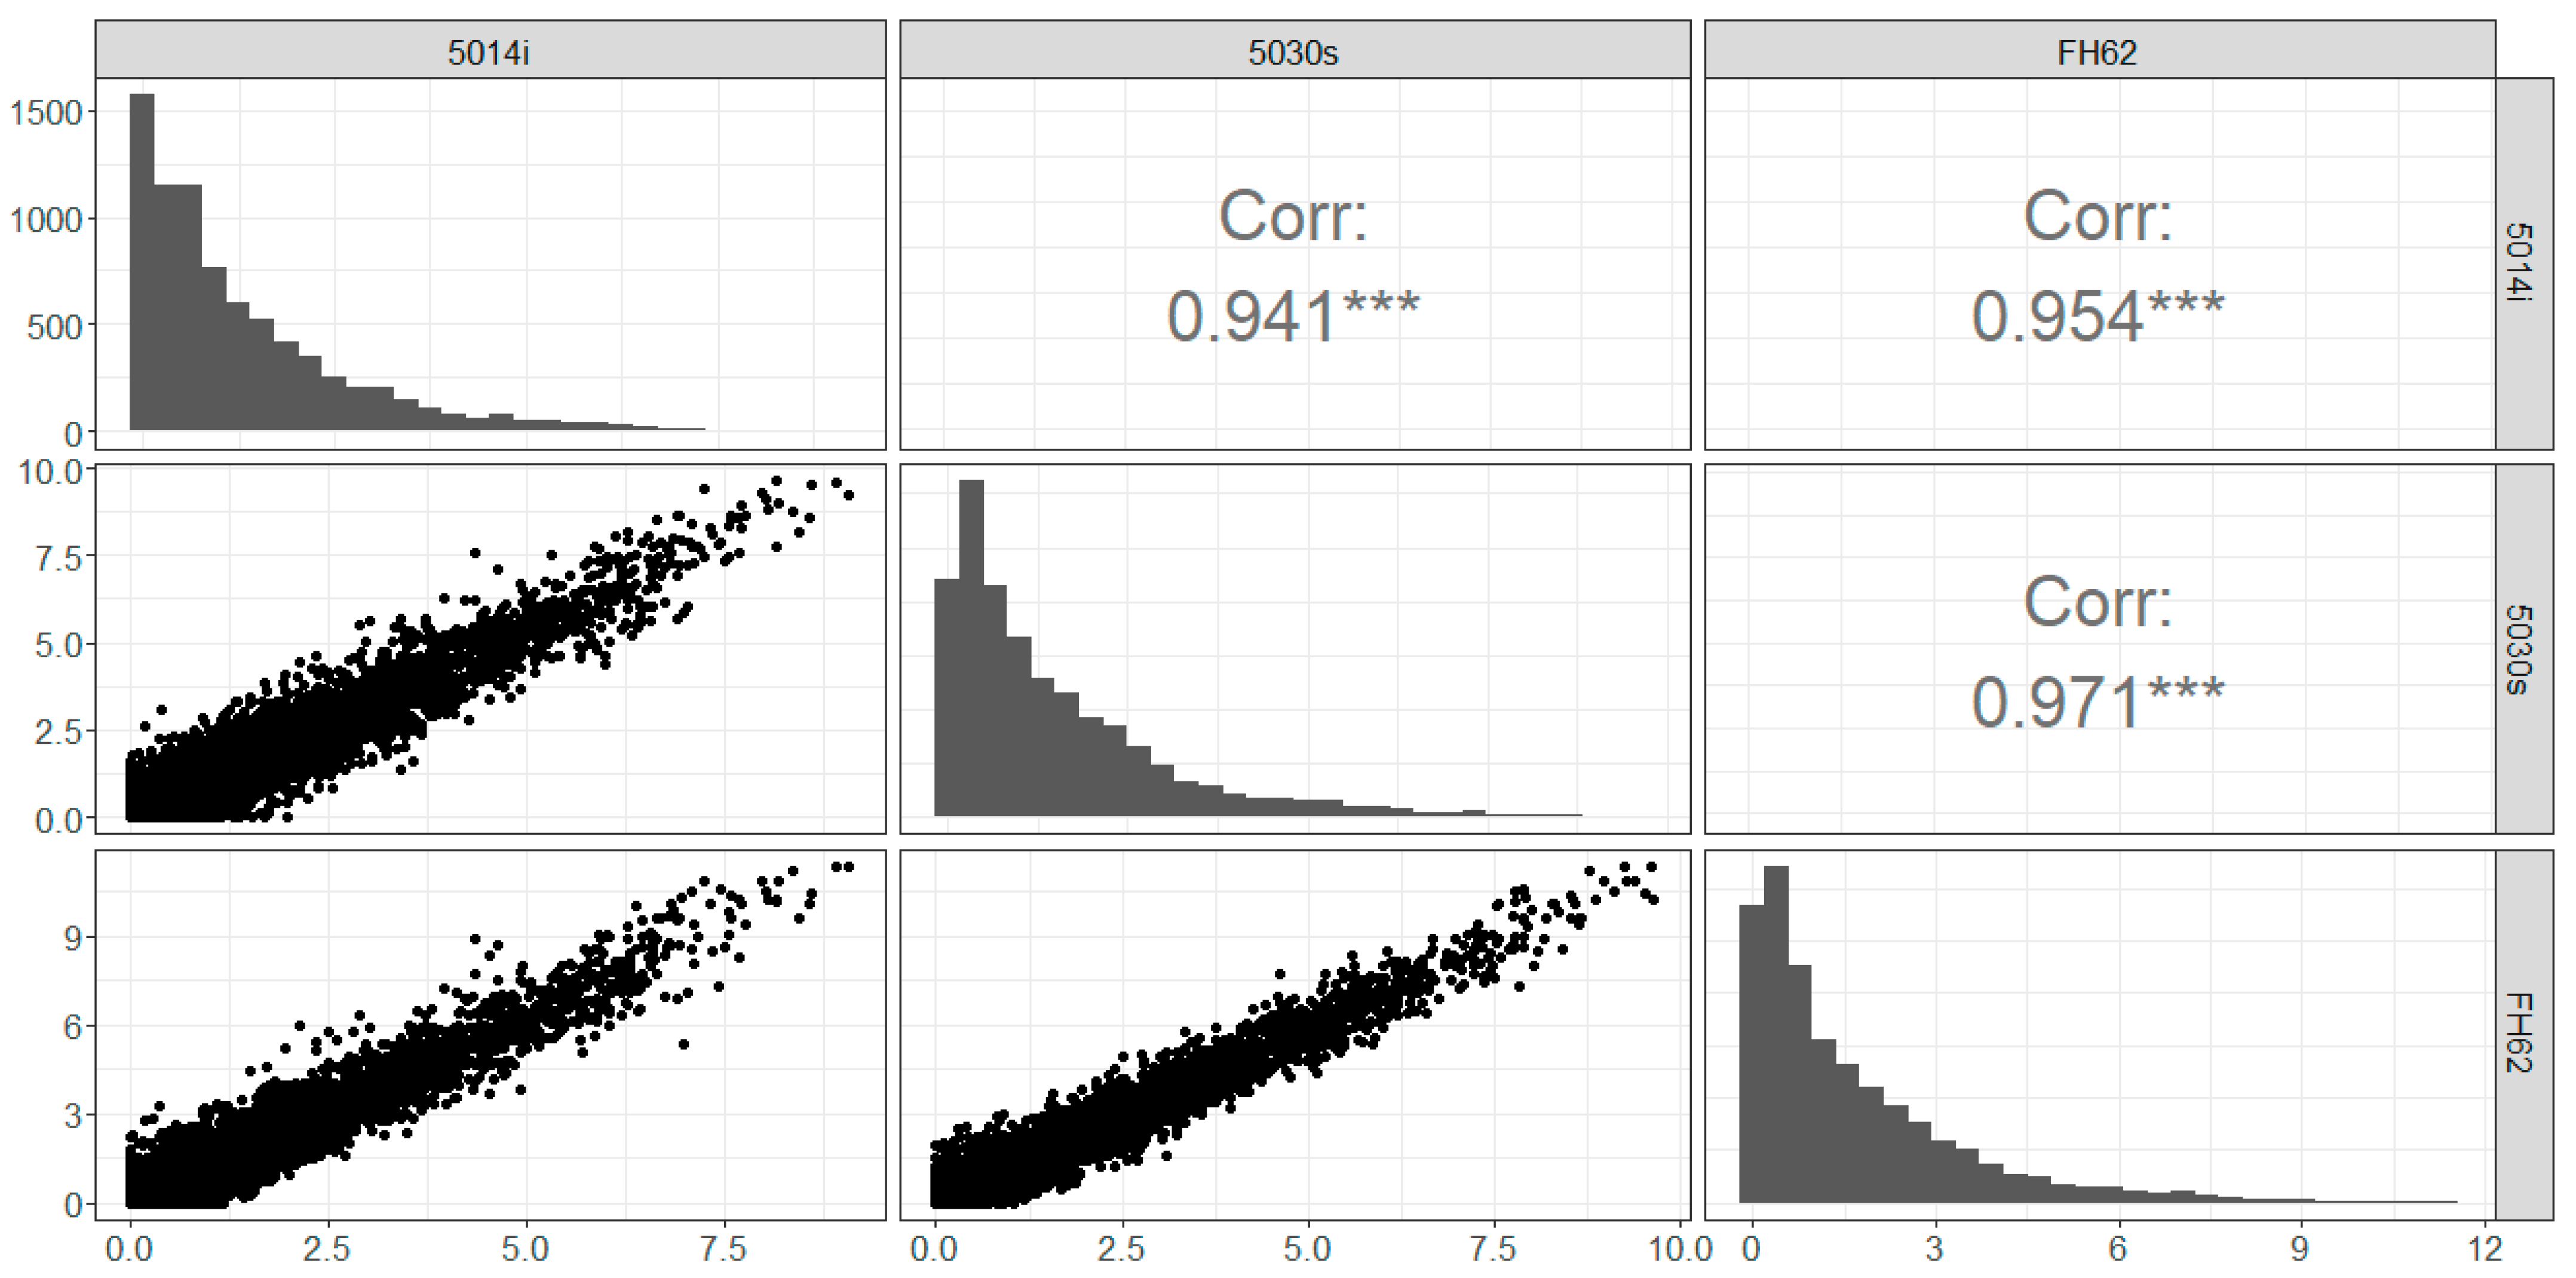
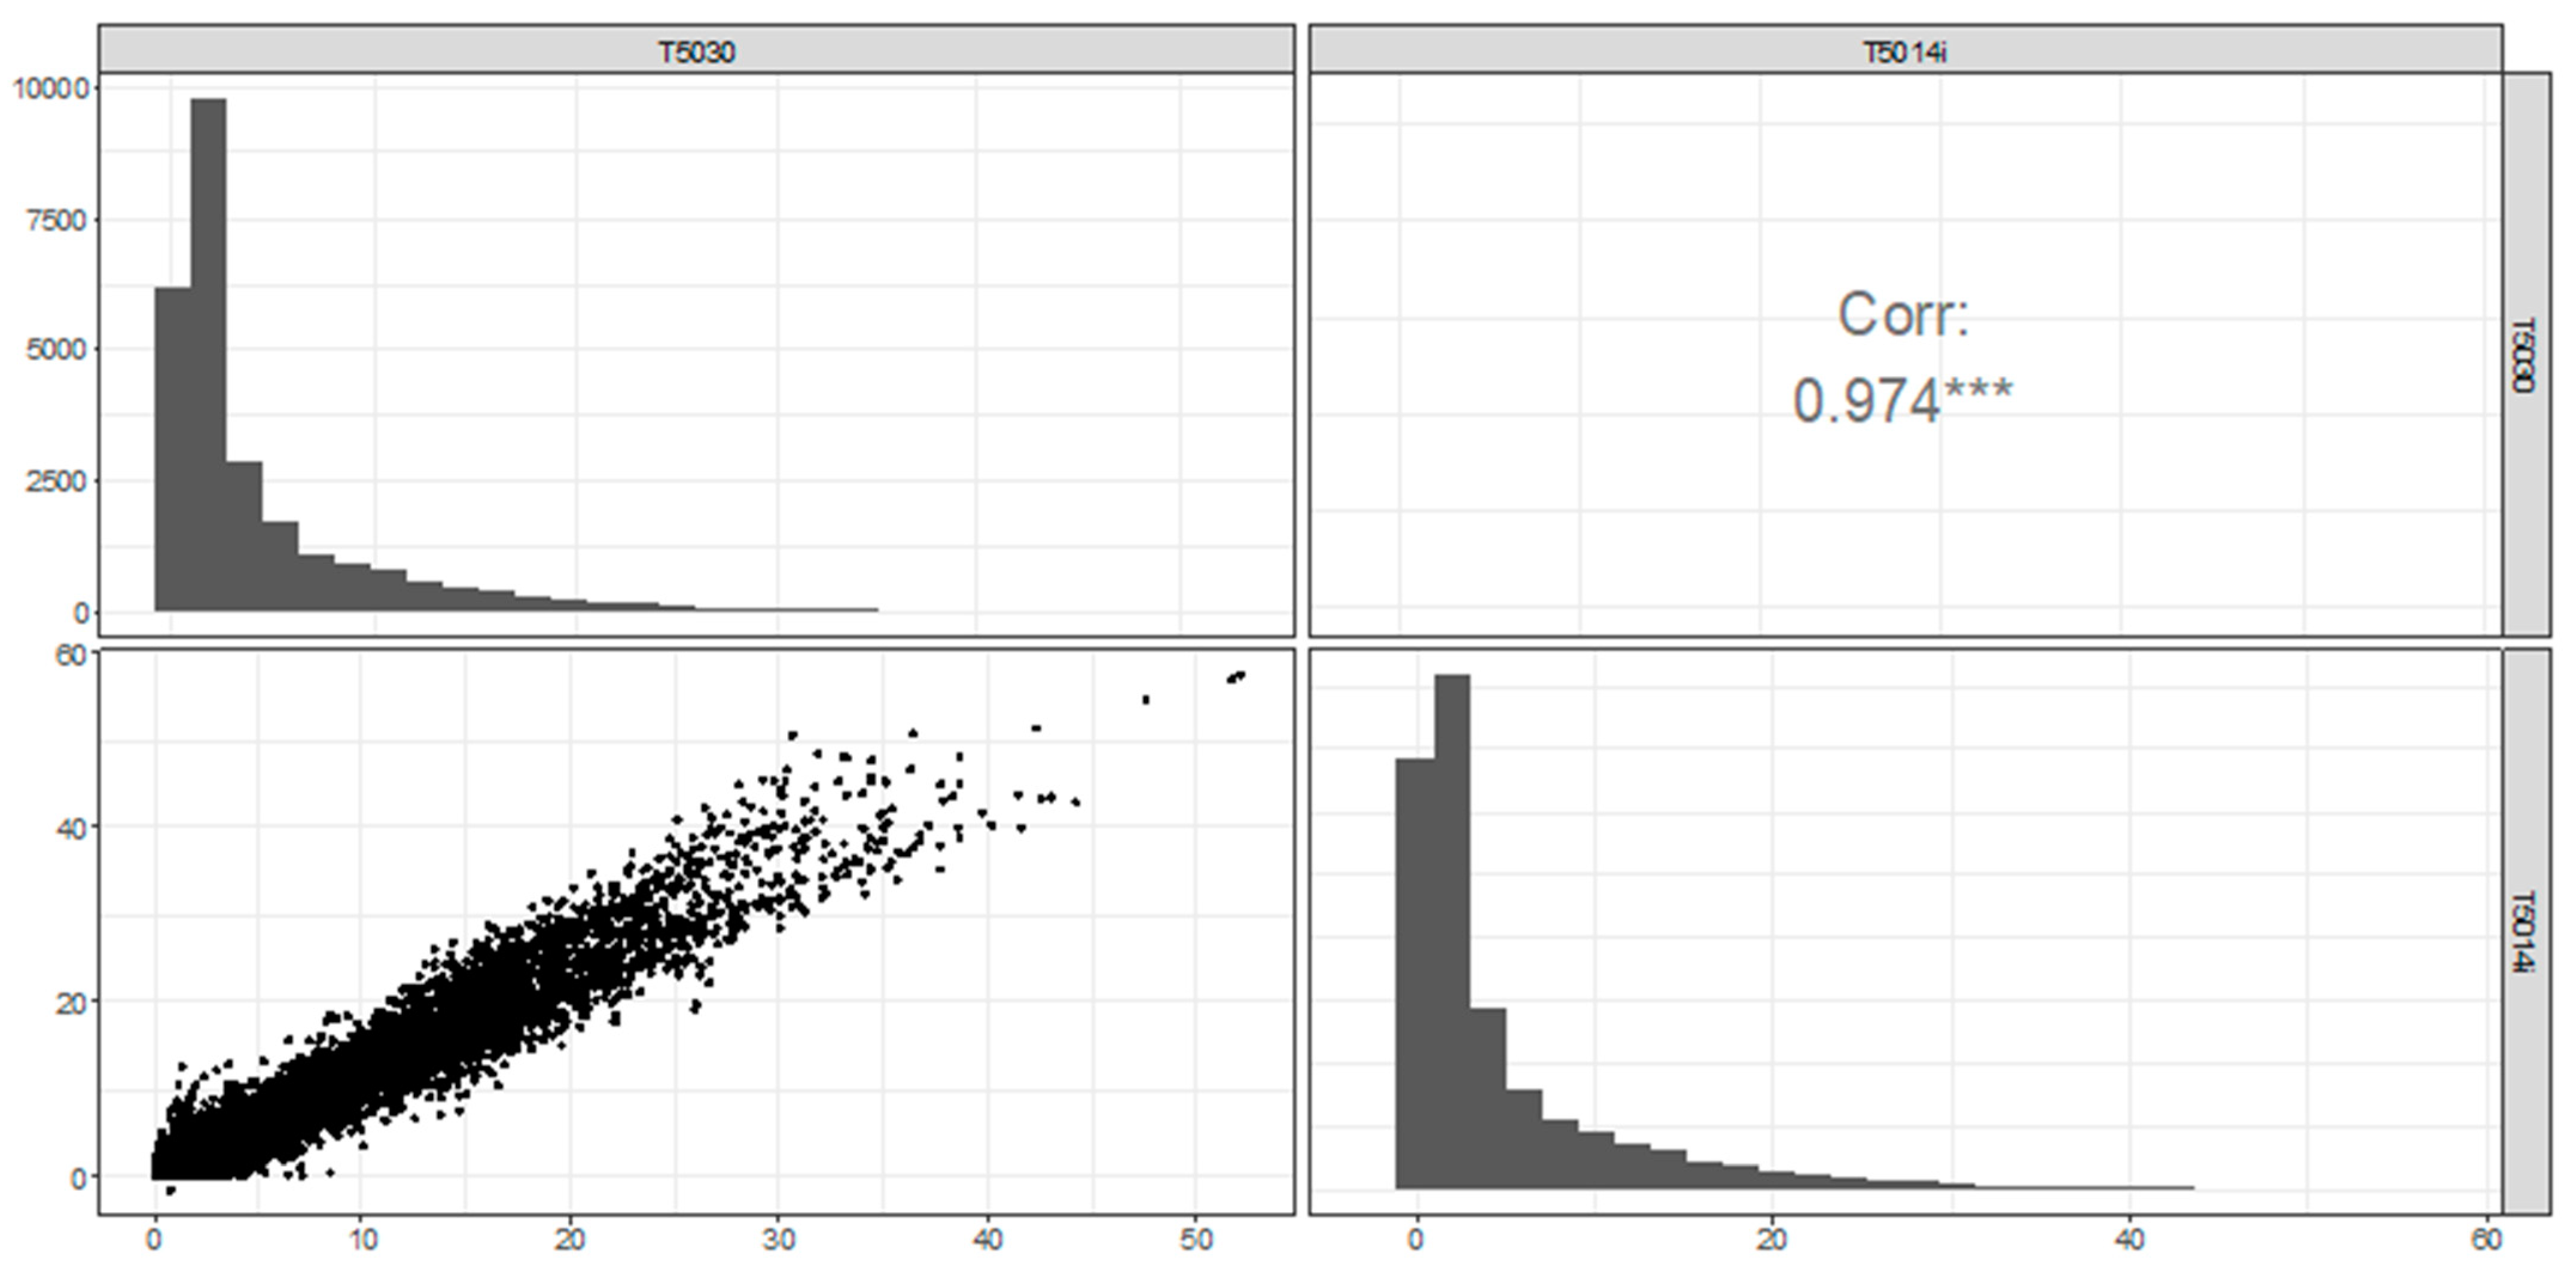
The data distributions (histograms) are similar between instruments, although the 5014i records significantly more observations near zero (Figure 3). All instruments return a high number of observations below 1 Bqm−3, which is likely an artifact of the relatively high minimum detection limit of the instruments. Overall, hourly observations infer clear linear relationships between the instruments, with strong correlations (r = 0.94–0.97).
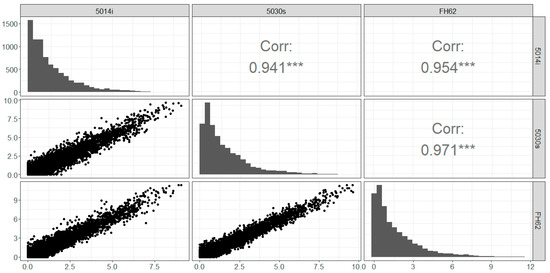
Figure 3.
Hourly radon observations (Bqm−3) Chullora: scatterplot, distributions and correlation (r). *** represents statistical significance at p < 0.001.
The data distribution for different instruments can be illustrated at the monthly level, with boxplots in Figure 4 and in terms of descriptive statistics in Table 2. The distributions of the hourly observations are also similar across all instrument’s individual months. Monthly means vary between 0.57 Bqm−3 (December, 5014i) to 3.47 Bqm−3 (May, FH62) with the 5014i returning values that are consistently lower than the other instruments (Table 2). Overall, the annual means range from 1.31 Bqm−3 (5014i) to 1.64 Bqm−3 (FH62) for the study period.

Figure 4.
Monthly radon box plots Chullora: 5014i (a), 5030 (b) and FH62 (c).

Table 2.
Summary statistics by month (Bqm−3).
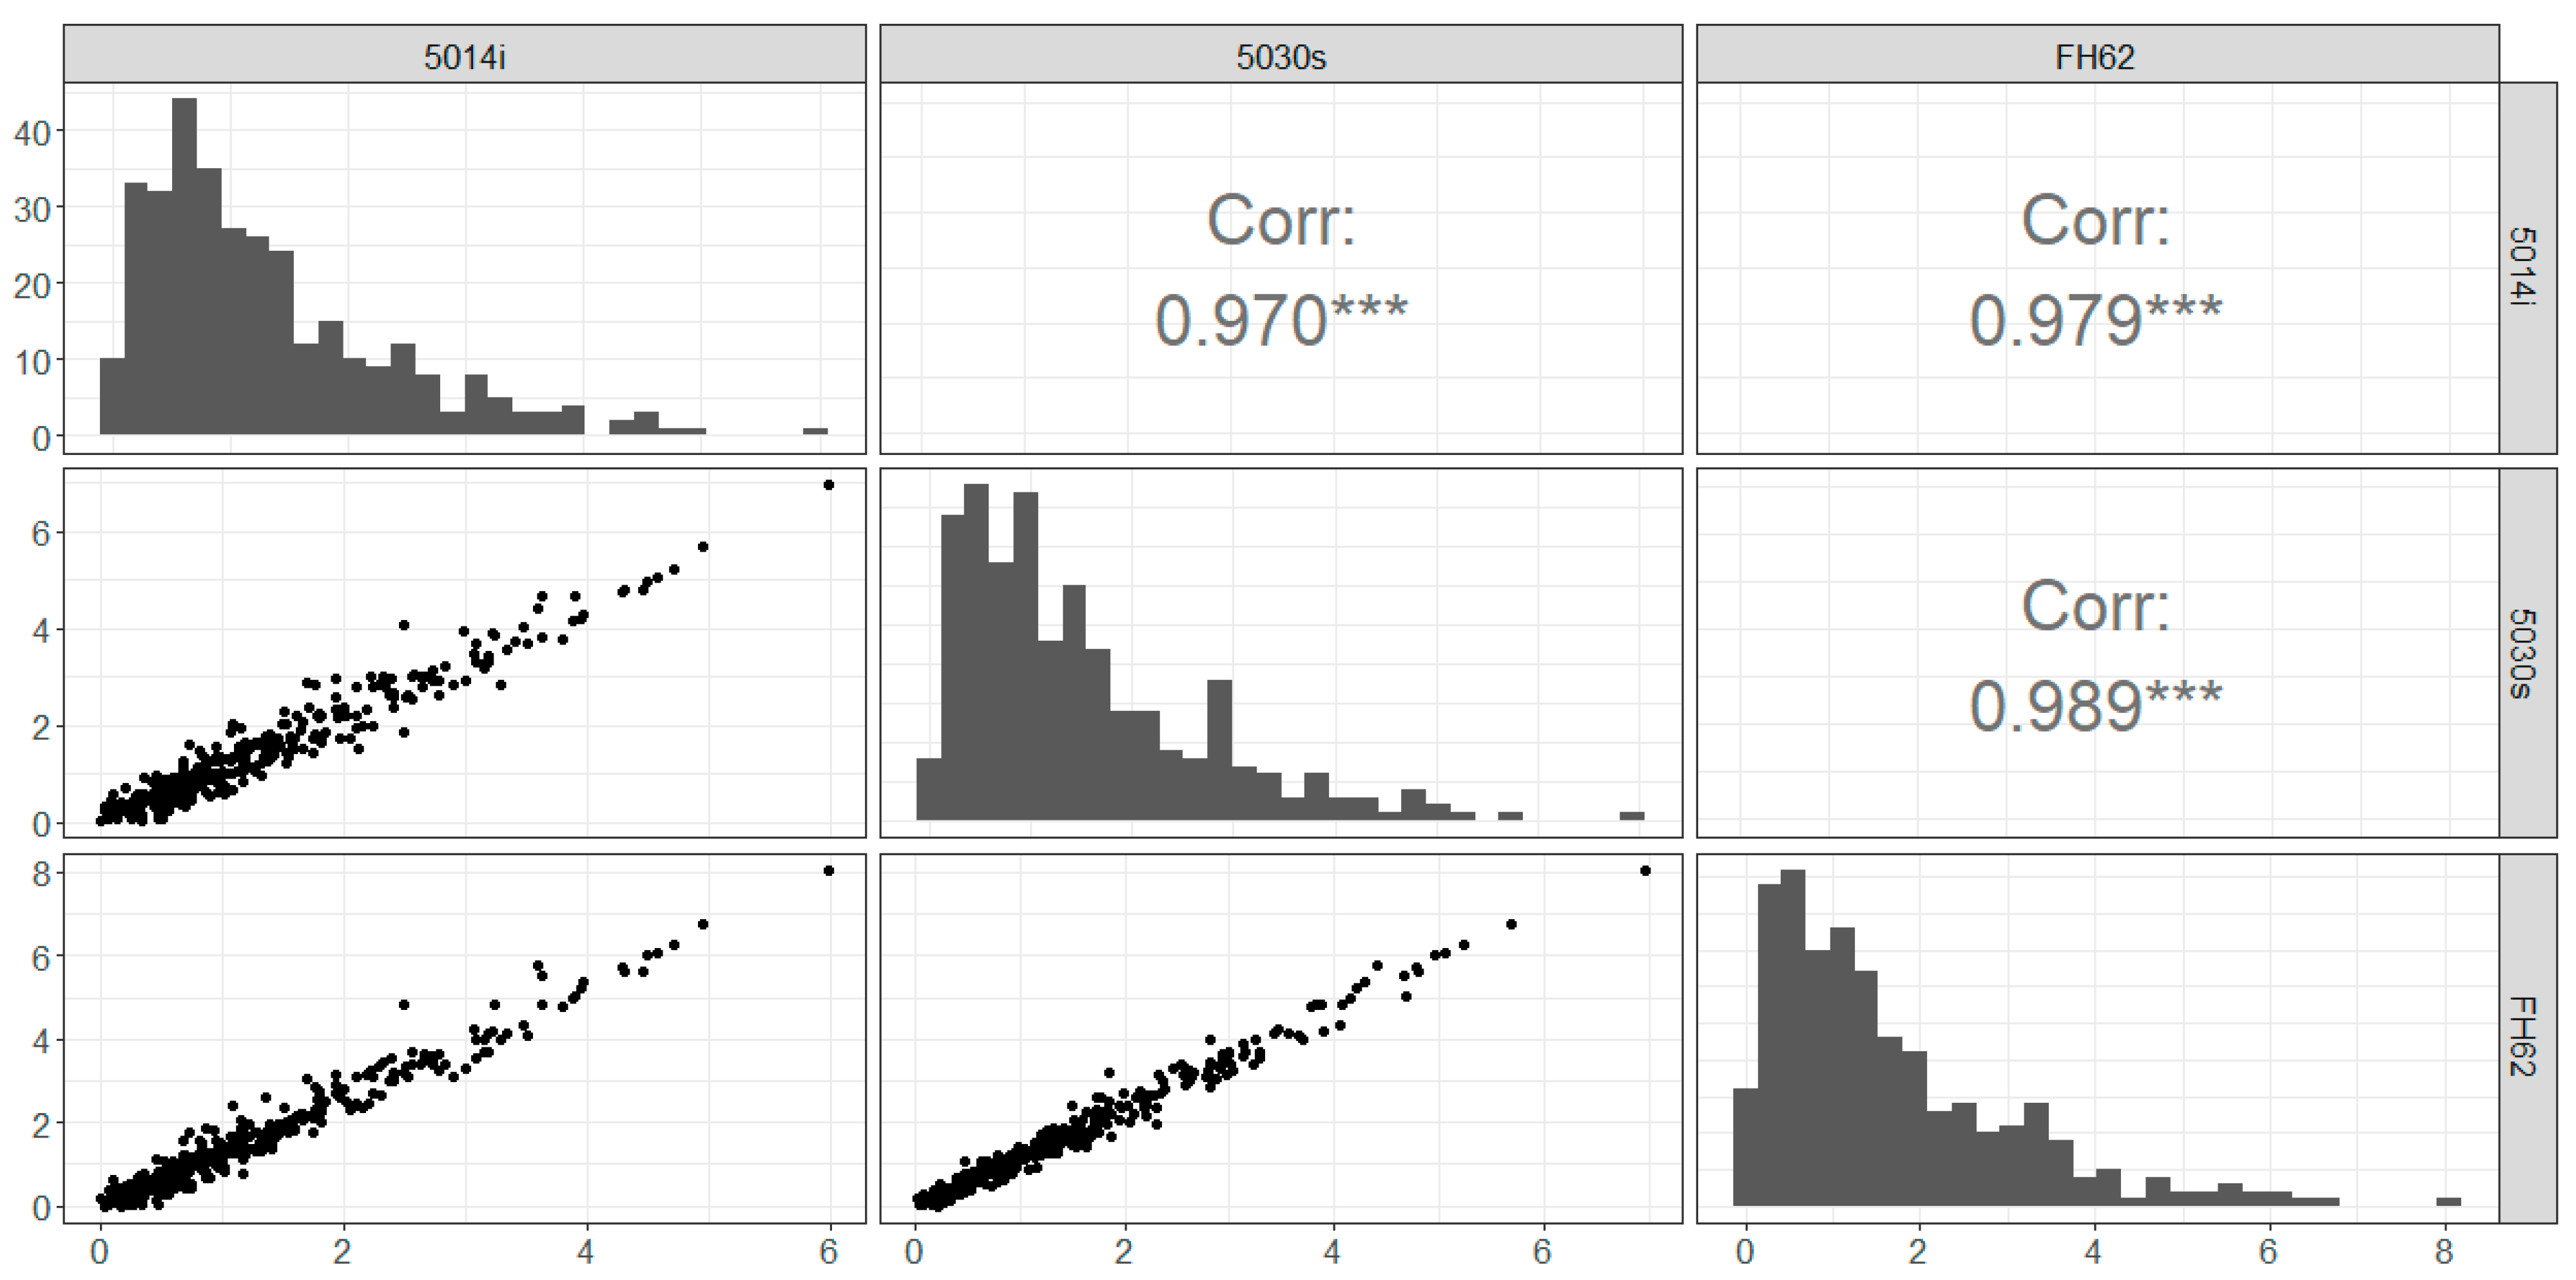
We also examined the distribution of the daily mean radon concentrations (derived from hourly data). Again, the overall data distributions (histograms) are similar across instruments, with strong correlations and linear relationships also observed (r = 0.97–0.99) (Figure 5).
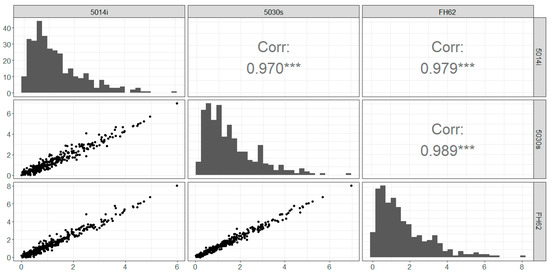
Figure 5.
Daily mean radon (Bqm−3) at Chullora: scatterplot, distributions and correlations (r). *** represents statistical significance at p < 0.001.
3.2. Diurnal, Weekday-Weekend and Monthly Variability Comparisons—Chullora
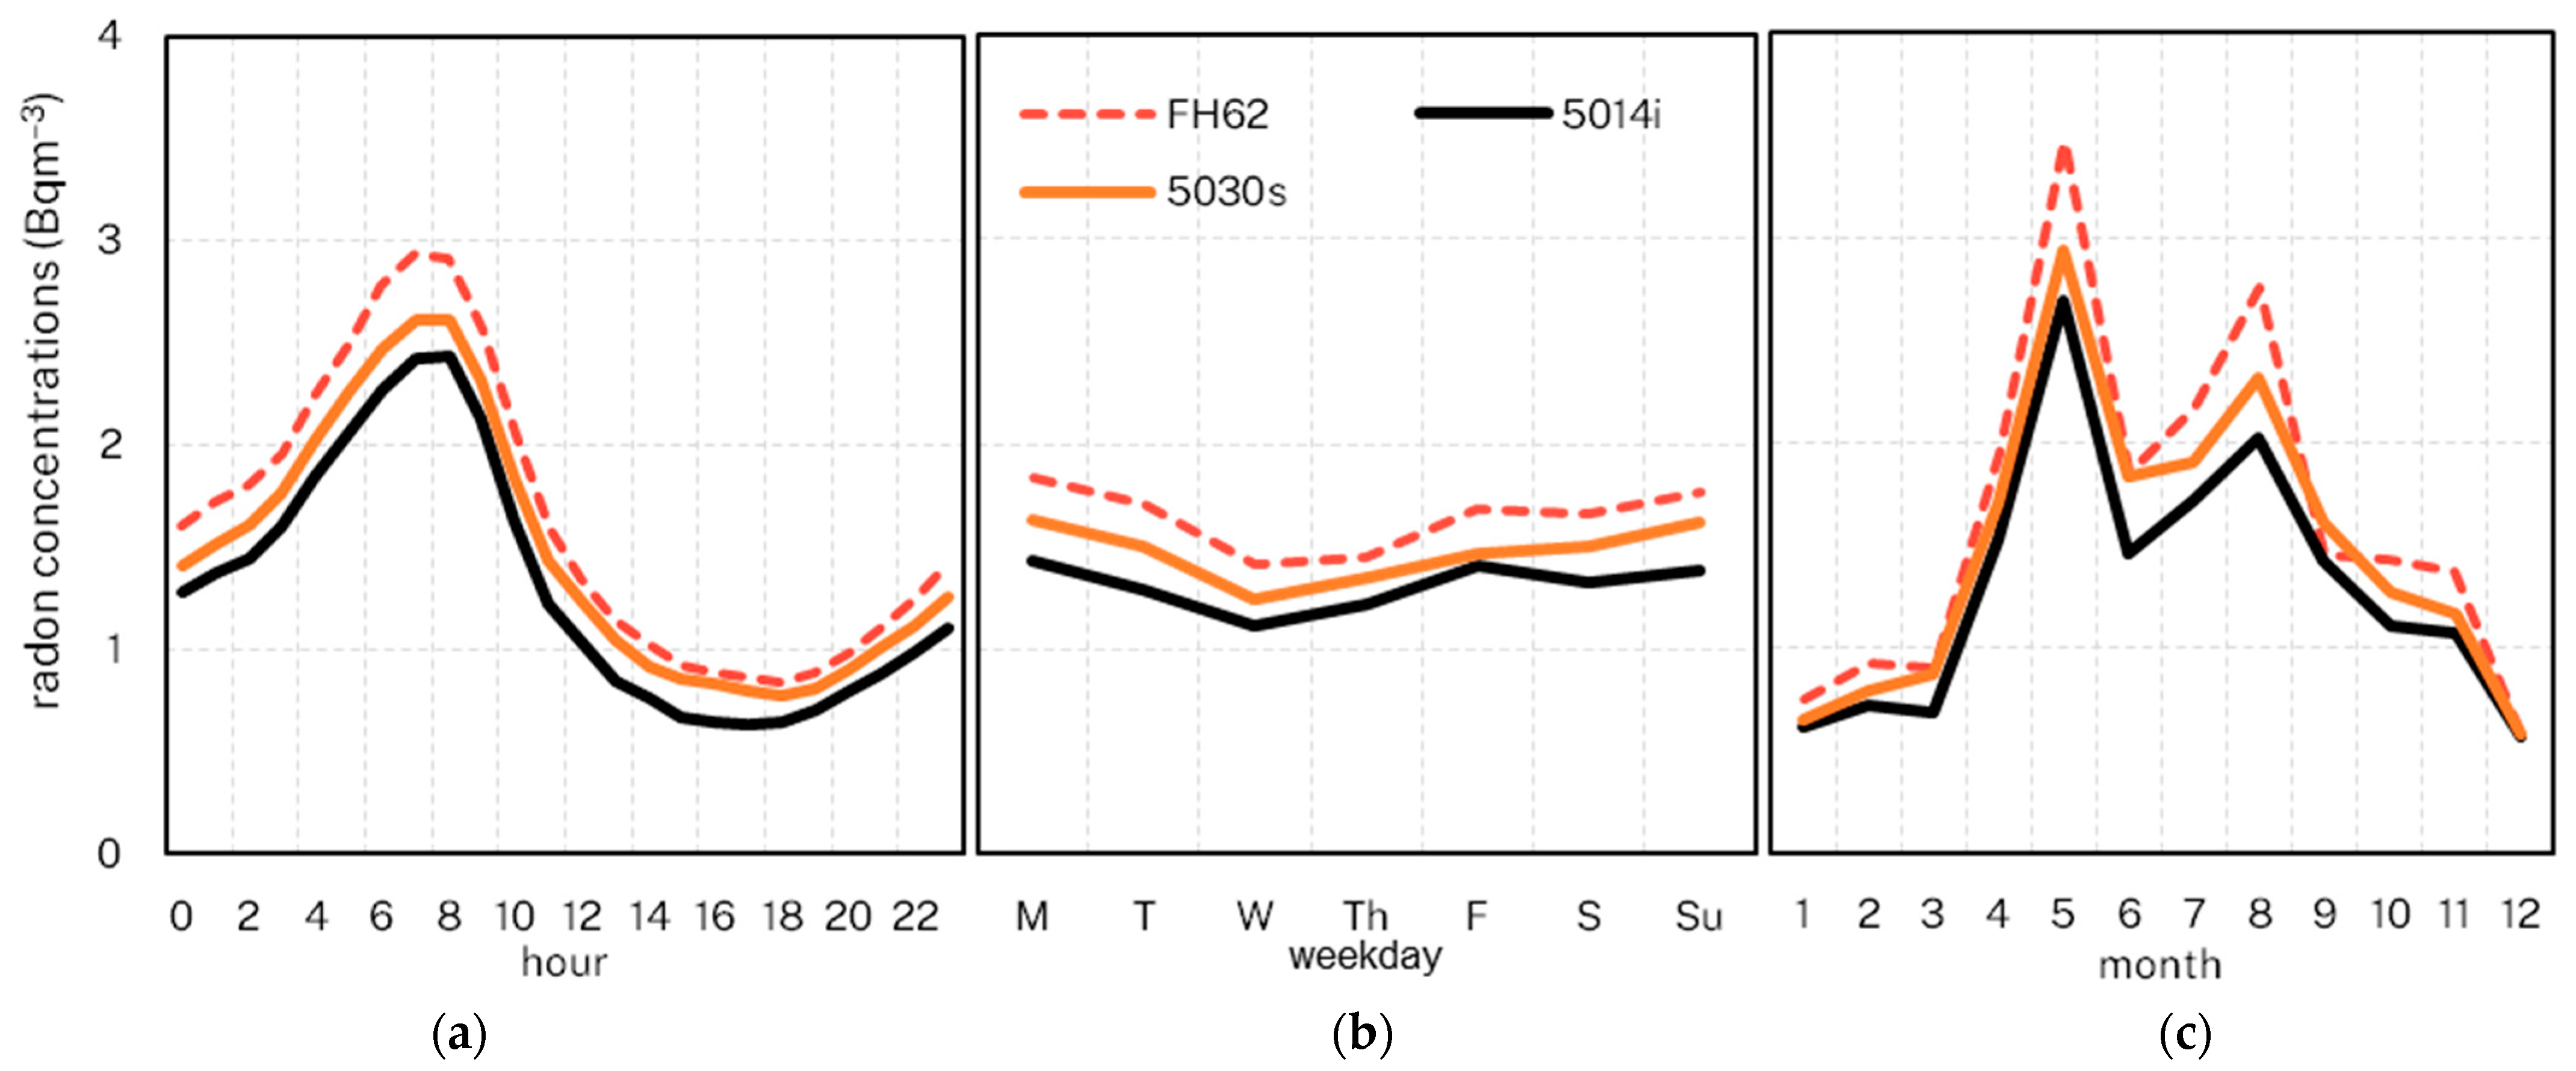
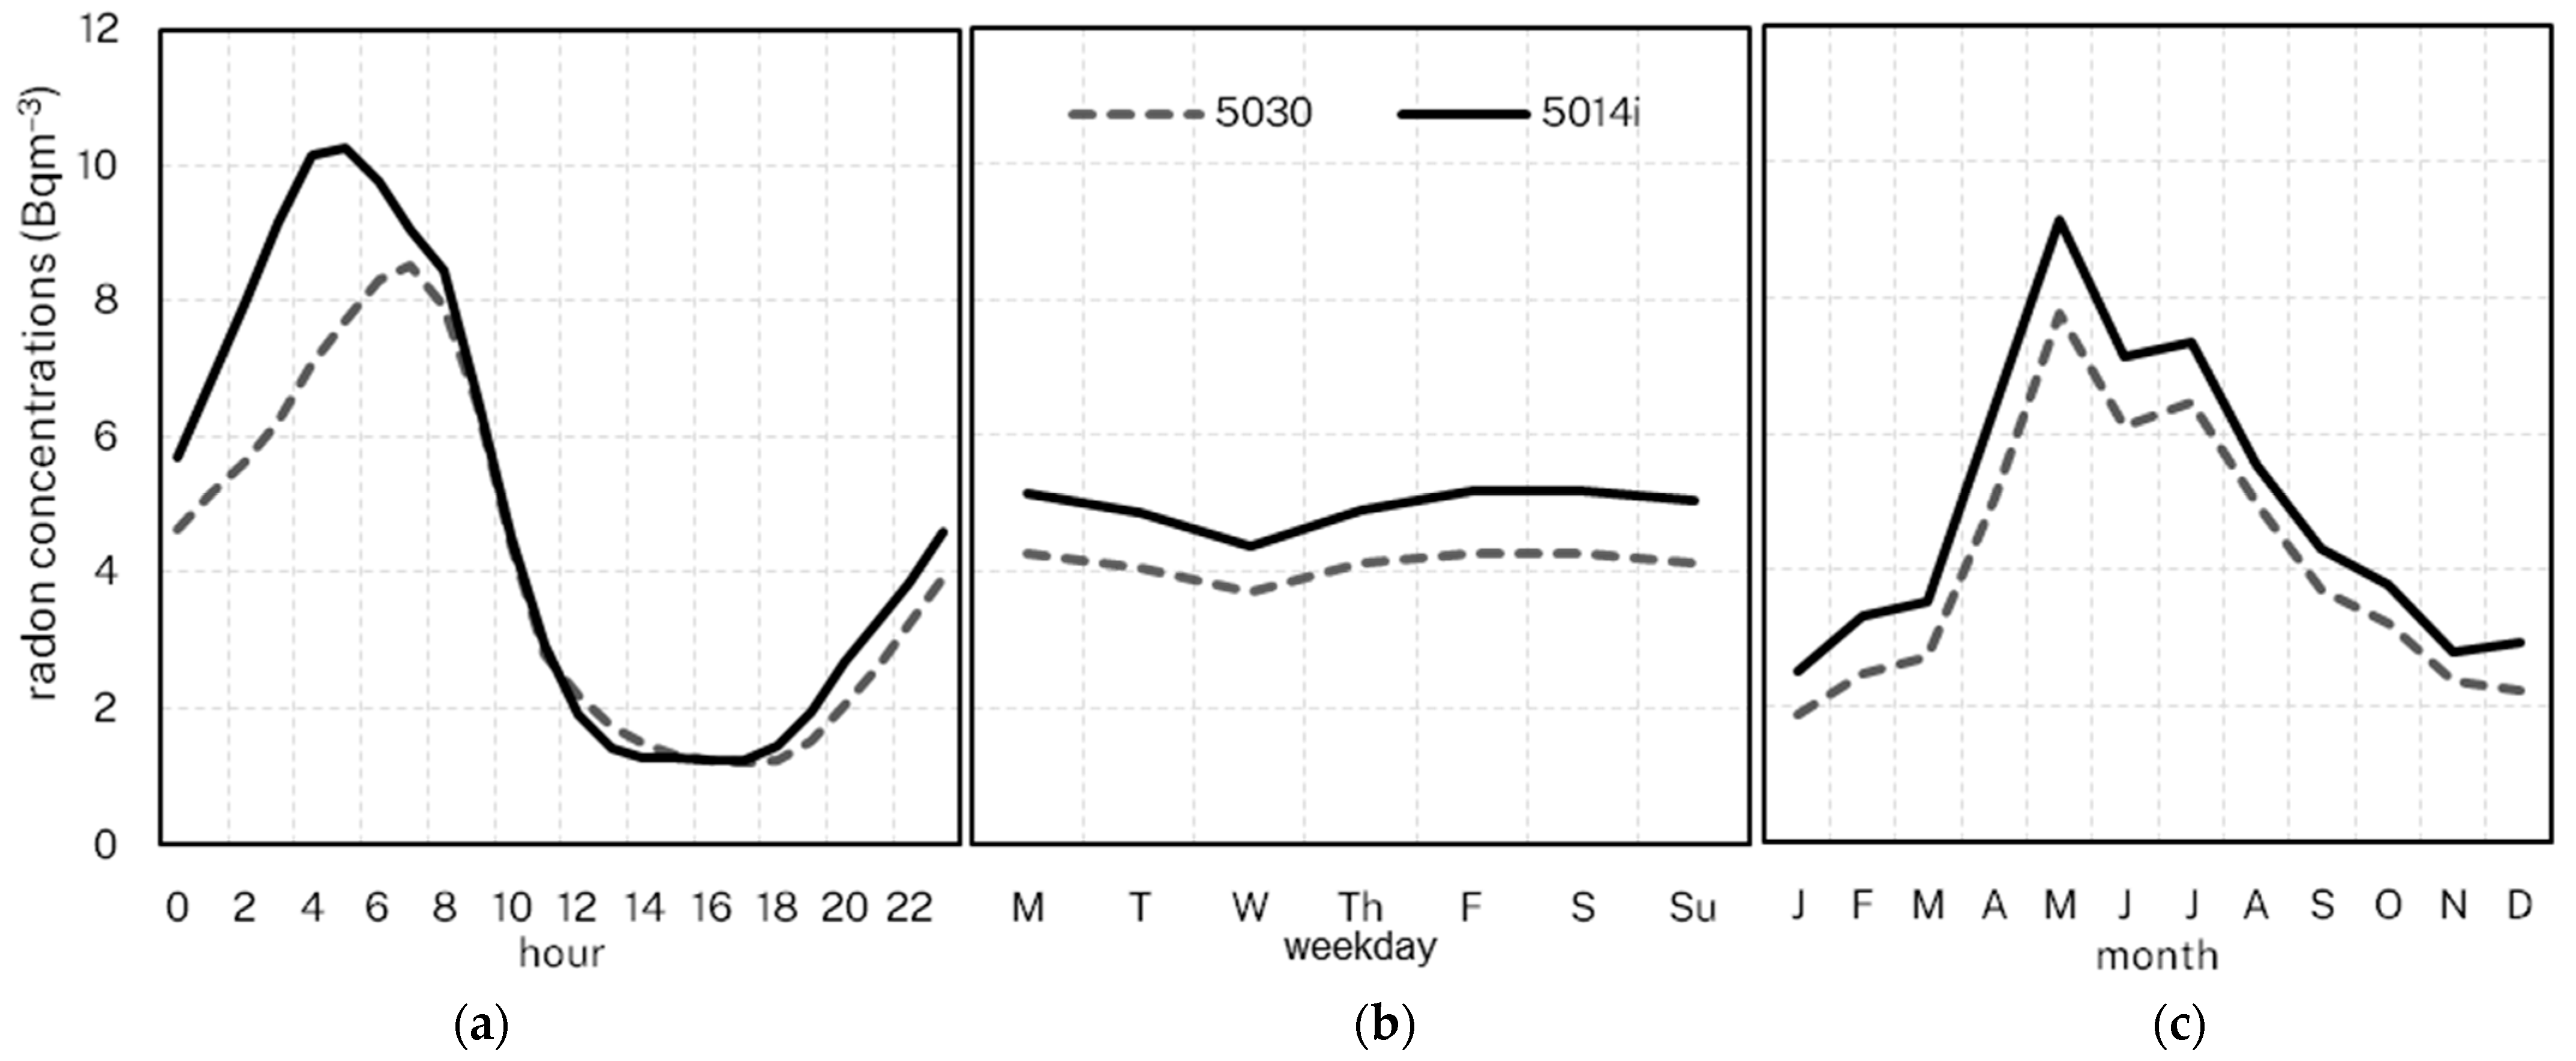
Radon levels vary throughout the day and across seasons (months) [12,38,48,50,51,52]. All three instruments at Chullora demonstrate similar responses to the natural diurnal and seasonal variability in radon concentrations (Figure 6). In general, higher radon levels are recorded for cooler months (April–September) and in the early morning. Studies elsewhere showed that the higher radon levels indicate lower mixing layer heights, as the stable conditions as well as constrained convective mixing during the cooler months and overnights reduce radon dispersion and therefore higher ground-level mixing ratios [50,51,52,53]. Over the diurnal scale, the radon concentrations are highest in the early morning, coinciding with a well-developed nocturnal stable boundary layer, and they are lowest in the late afternoon/early evening, when the convective mixed layer is at its greatest depth.
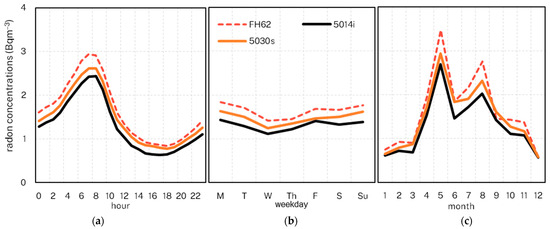
Figure 6.
Mean radon concentrations (Chullora) by hour (a), weekday (b) and month (c).
We note that the distinct maximum in May is also identified in other studies for Sydney [12,38,48], and is likely a result of longer fetch over land for air masses at this time [12], often associated with the transition of the sub-tropical ridge [14]. As expected, different instruments identified no apparent variations across days of the week (weekend vs. weekday).
We further examine the between-instrument correlations by performing linear regression analyses for each instrument pair by month and by hour of the day. Figure 7 shows the slope and the R-squared of the linear model fitted to each paired instrument comparison by month and by hour of the day. For the 5030 vs. FH62 comparison, the correlation remains very strong throughout the year (0.85 < R2 < 0.97, 0.92 < r < 0.98) with the poorest correlation in September. Comparisons with the 5014i are weaker; however, even the weakest correlation of R2 = 0.70 (r = 0.84) in February, is still a strong result.

Figure 7.
R-squared values of the linear regression models fitted for each pairwise comparison at Chullora by month (a) and by hour (b).
The strong linear correlations for measurements between instruments are further confirmed at the diurnal level, i.e., for each hour of the day (Figure 7). Again, the 5030 vs. FH62 comparison is strongest (0.84 < R2 < 0.96, 0.92 < r < 0.98), with the poorest correlation during the late afternoon. Like other results [38], comparisons with the 5014i are relatively weaker, with the weakest correlations of R2 = 0.67–0.75 (0.82 < r < 0.87), during the late afternoon and early evening (14:00–19:00 AEST).
3.3. Environmental Dependencies—Chullora
The strong correlations of the hourly measurements between instruments indicates that temperature, humidity or wind are unlikely to induce significant variation between the instruments. Nevertheless, given the variation in the correlations across hours of the day and months (Figure 7), we undertake linear regression analyses for hourly radon measurements on four meteorological variables—temperature, relative humidity, wind speed and sigma theta (the standard deviation of wind direction in an hour)—to explore if there are any systematic instrument variations due to these environmental factors (Table 3, Figures S1–S6). We assess the radon instruments’ response to each of these variables by assessing the correlations against each variable's decile ranks. This allows us to assess which (if any) environmental extremes may influence the radon measurements.

Table 3.
Correlations (r) between the hourly radon observations from three instruments at Chullora, segmented by the deciles of selected environmental variables.
The results show strong between-instrument correlations across the spectrum of observed temperatures (0.85 ≤ r ≤ 0.97) within all paired comparisons. The 5030 and FH62 show consistently strong correlations across all deciles (0.95 ≤ r ≤ 0.97), while the 5014i comparisons give relatively weaker (although still strong) correlations (0.85 ≤ r ≤ 0.96). Together these comparisons indicate that the relative performance of the instruments are not temperature-dependent.
Strong between-instrument correlations (0.83 ≤ r ≤ 0.98) are observed across deciles of relative humidity. Again, the 5030 and FH62 correlations are strongest (0.90 ≤ r ≤ 0.98), with the weakest correlations involving the 5014i for deciles 1–3 (0.83 ≤ r ≤ 0.91). Like the temperature analysis, this indicates that the responses of the instruments are not heavily influenced by humidity.
We note that the poorest (weakest) correlations are during the hottest and driest periods of the year. These conditions are often associated with strong insolation during the summer months where convective mixing is greatest and hence the radon mixing ratios are at or near their minima.
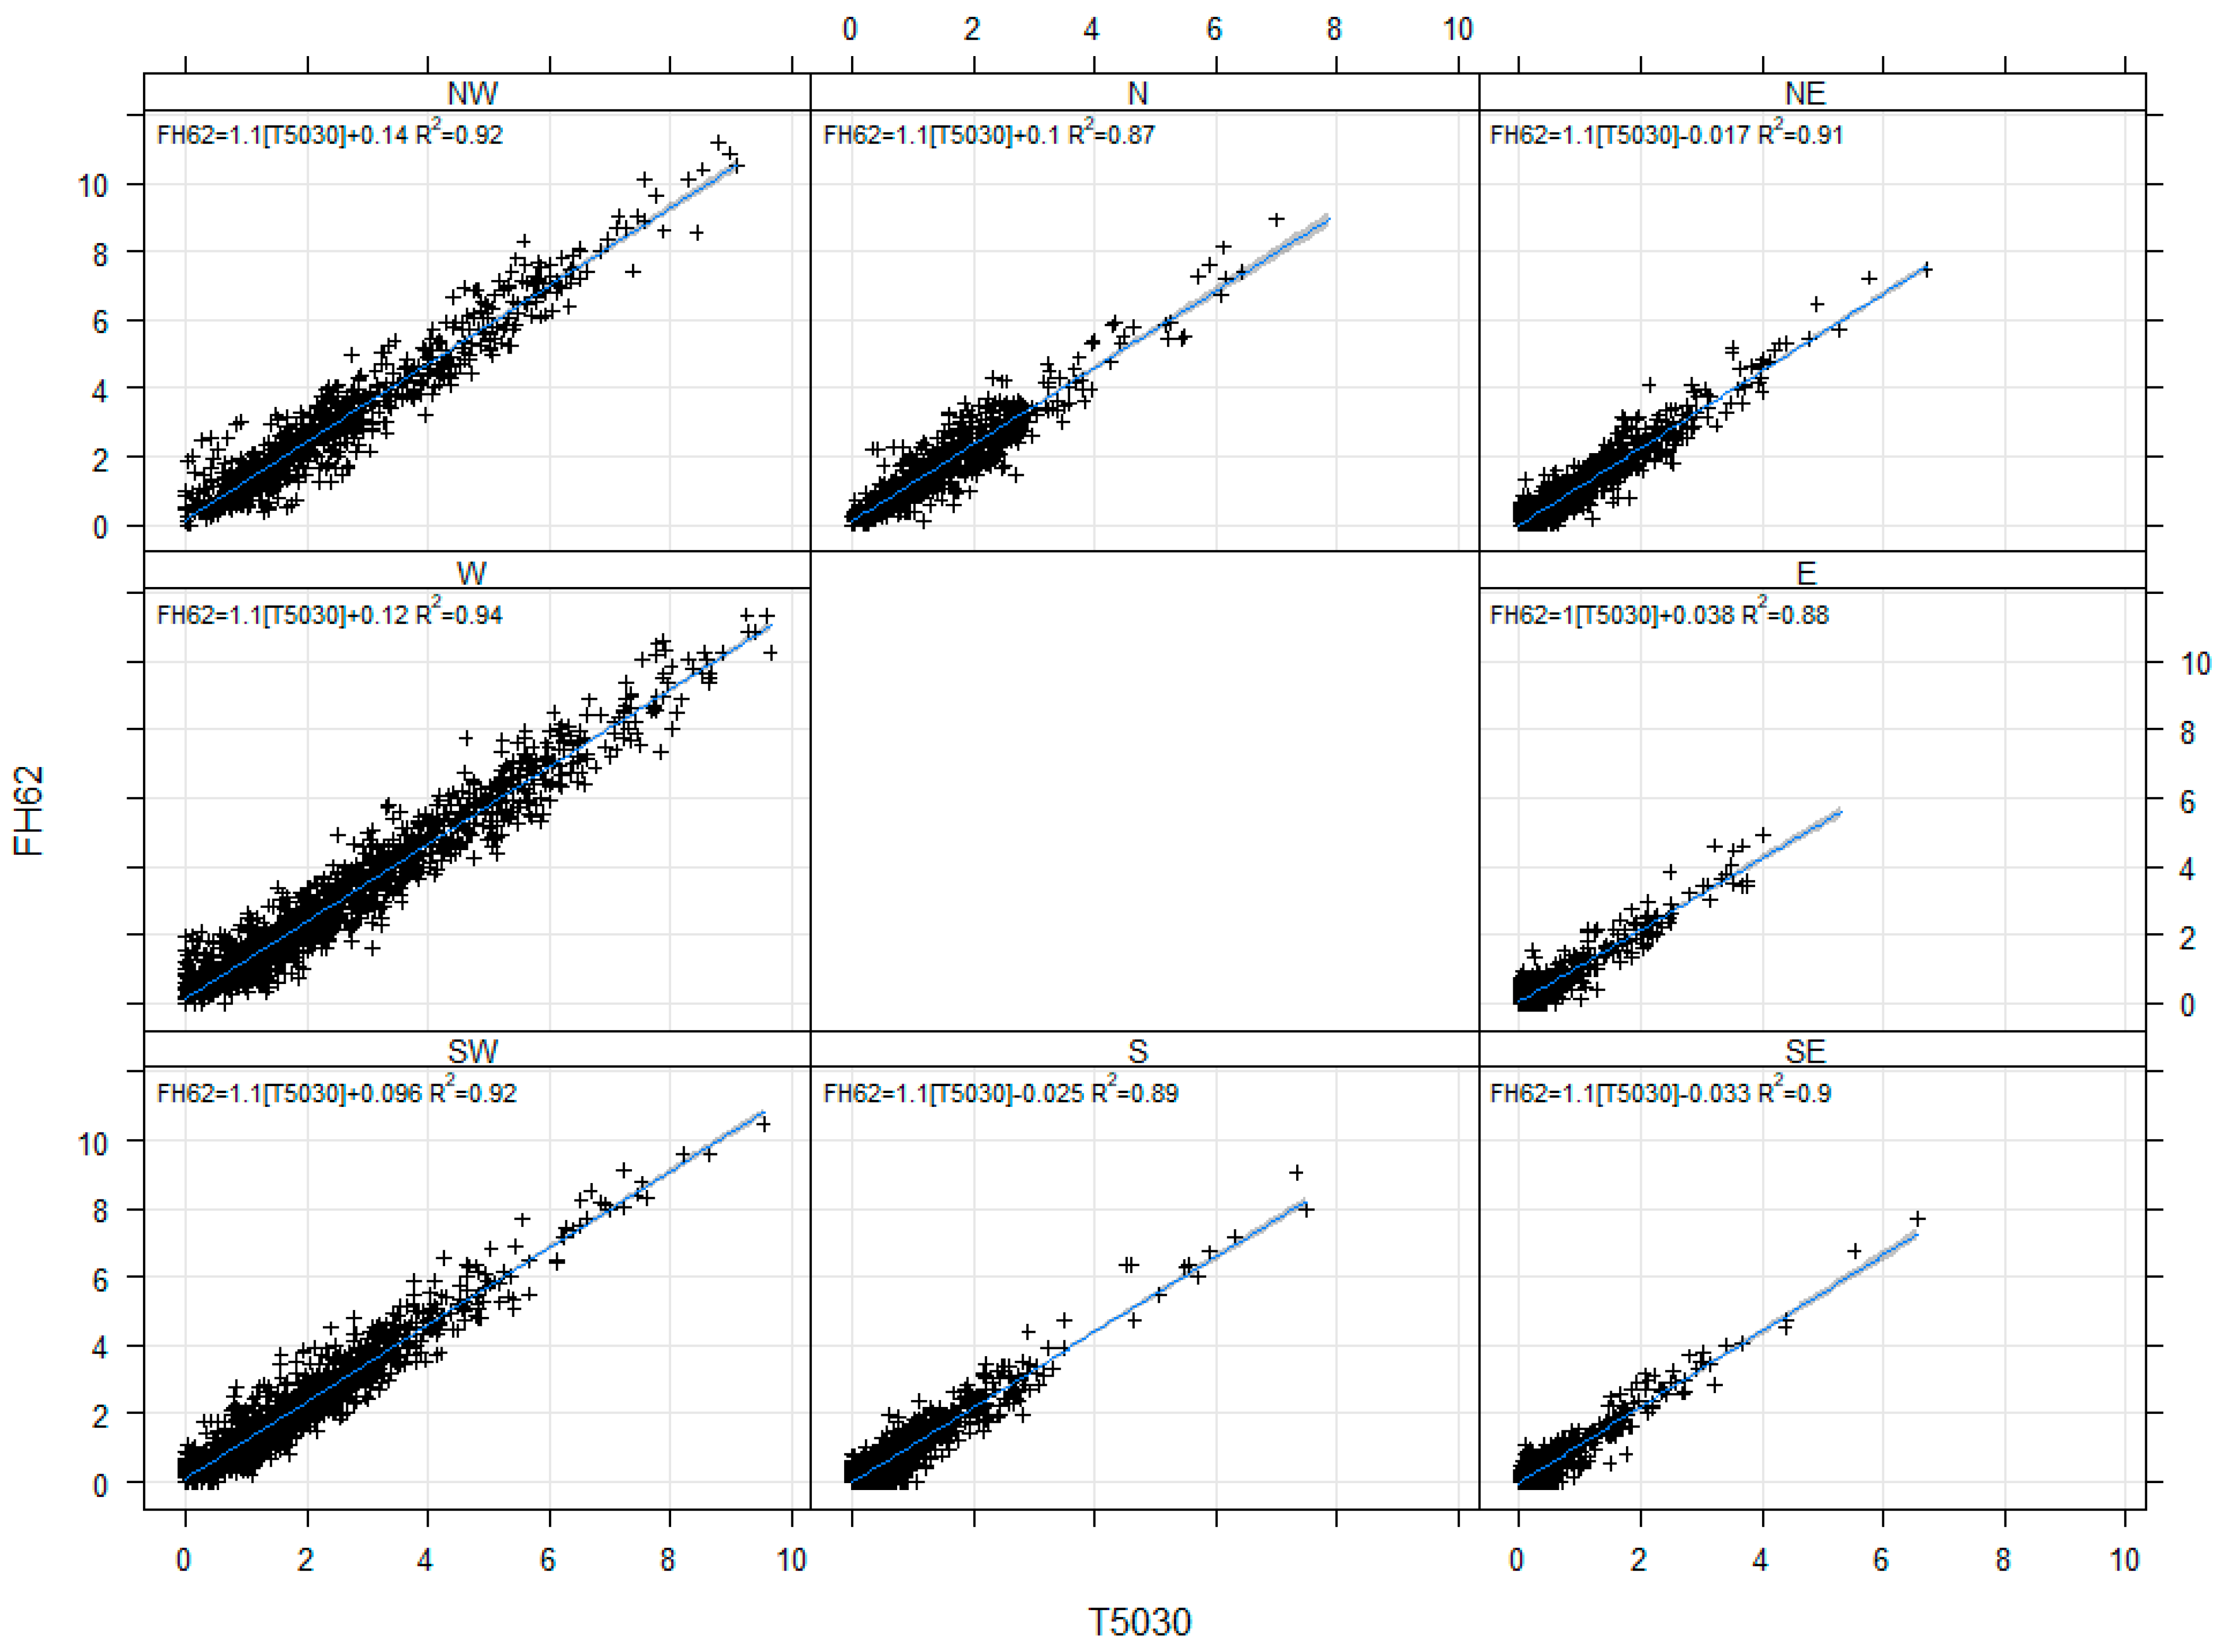
To investigate any potential wind induced variations, we assess the instrument responses against the hourly vector averaged wind speed and wind direction, and a measure of stability, the standard deviation of wind direction over the hour (sigma theta). We assess the correlations between instruments segmented by individual deciles for wind speed and sigma theta (Table 3, Supplementary Figures S7–S12) and segmented by cardinal points for wind direction (Figure 8, Supplementary Figures S13 and S14). The analysis shows that between-instrument correlations were strong across all wind directions (0.83 ≤ r ≤ 0.97, 0.69 ≤ R2 ≤ 0.94) and cases of sigma theta (0.94 ≤ r ≤ 0.96). Strong correlations are observed for all wind speed deciles (0.73 ≤ r ≤ 0.96), with slightly weaker correlations at higher wind speeds. Once again, we note that the 5030 and FH62 showed the strongest correlations across all wind parameters with the 5014i performing less robustly. In general, this analysis indicates that there is no systematic performance impact between the instruments due to wind.
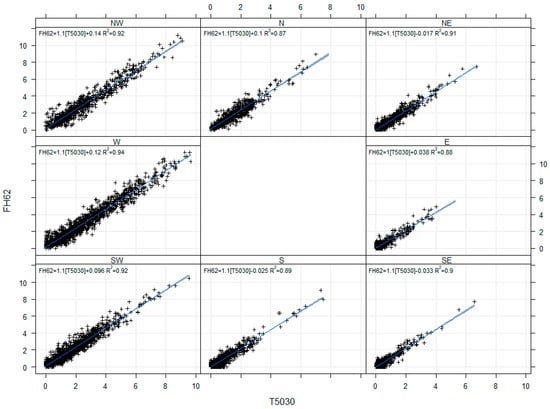
Figure 8.
Correlations between hourly radon measurements (+, Bqm−3) from the 5030 and FH62 at Chullora, segmented by wind direction.
3.4. Annual and Monthly Mean Concentrations and Data Distributions—Muswellbrook
At Muswellbrook, like Chullora, there was strong correlation between the 5030 and 5014i for hourly observations (r = 0.97). There was little variation from year-to-year, with correlations r = 0.97, 0.98, 0.98 for each year (2015/2016, 2016/2017, and 2017/2018), respectively.
The distributions of hourly observations are similar, although the 5014i records more observations near zero (Figure 9). Monthly means of the hourly observations are similar across all months (Figure 10), although the 5030 consistently records lower radon concentrations than the 5014i, which is the opposite of the comparison at Chullora. Monthly means vary between 1.9 Bqm−3 (January, 5030) and 9.2 Bqm−3 (May, 5014i). It is notable that the mean radon concentration at Muswellbrook is higher than at Chullora. This is due to a combination of the local geology and the location of Muswellbrook further inland than Chullora, hence being less influenced by air masses of maritime origin, which typically have a lower radon concentrations.
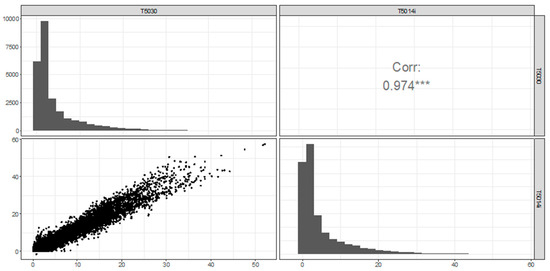
Figure 9.
Correlation and distributions of hourly observations between 5030 vs. 5014i at Muswellbrook. *** represents statistical significance at p < 0.001.
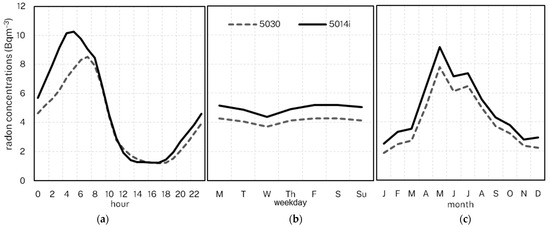
Figure 10.
Mean radon concentrations (Muswellbrook) by hour (a), weekday (b) and month (c).
3.5. Diurnal, Weekday-Weekend and Monthly Variability Comparisons—Muswellbrook
Overall, the mean radon levels show very similar variation patterns between the two instruments across hours of the day, days of the week and months, (Figure 10), albeit, with the means of the 5030 slightly but consistently lower than those of the 5014i. We note that there is some difference in the mean diurnal profiles between the instruments, with the maximum recorded by the 5030 occurring two hours after the peak recorded by the 5014i. We conducted a lag analysis (not shown) to explore if this was a detector lag issue and found no improvement in the correlations at lags of one and two hours.
Linear regression analyses for individual months and hours of the day also show similar results to those for the instruments at Chullora. There are strong correlations across all months (0.84 ≤ R2 ≤ 0.97, 0.92 < r < 0.96), with the weakest correlations in December and January (Figure 11 and Figure S15). The correlations across hours are similarly strong (0.65 ≤ R2 ≤ 0.98, 0.81 < r < 0.99), with very strong correlations of R2 ≥ 0.9 between the hours 2000–1100.

Figure 11.
R-squared values of the linear regression models fitted for each 5030 vs. 5014i comparison at Muswellbrook and Chullora by month (a) and by hour (b).
3.6. Environmental Dependencies—Muswellbrook
Like Chullora, the regression analyses of multi-year radon data from Muswellbrook are performed on selected meteorological variables to assess between-instrument variation due to environmental factors (Table 4, Figures S16–S20). The results show that there is no major variation in the correlations across relative humidity and sigma theta deciles (0.85 ≤ r ≤ 0.97). Strong correlations are observed across deciles 1–9 for temperature (0.86 ≤ r ≤ 0.97) and deciles 1–6 for wind speed (0.88 ≤ r ≤ 0.97). The temperature dependence is similar at Muswellbrook compared to Chullora and likely due to the increased number of observations at or near the radon MDL during the hottest hours, coinciding with the maximum mixed layer depths and hence the lowest radon mixing ratios. There is more variation in the correlations under high winds at Muswellbrook compared to Chullora. In summary, these findings suggest that there little systematic variation between instruments due to environmental factors.

Table 4.
Correlations (r) between the hourly radon observations from two instruments at Muswellbrook, segmented by the deciles of selected environmental variables.
4. Discussion
We have assessed the comparability of radon measurements from three commercially available BAMs (Thermo 5030 SHARP, Thermo 5014i and Thermo Andersen FH62C) over a 12-month period at a site in Sydney and the comparability of radon measurements from two of these instruments (Thermo 5014i and Thermo 5030 SHARP) over a three-year period at Muswellbrook. As far as we are aware, this is the first time that radon measurements from different commercially available BAMs have been compared in field conditions.
We have demonstrated that at these sites there is a high correlation between the instruments in the hourly observations (r = 0.94–0.97) and daily means (r = 0.97–0.99). We found some seasonal and diurnal variation in the correlations, with the diurnal correlations strongest in the early morning and weakest during the afternoon (1200–1900) when the radon levels are lower. The monthly correlations were also strong at both sites (r = 0.84–0.98), being weakest in the warmest months (December–February).
The weaker correlations during the afternoon and the warmest months are consistent with the results in Riley et al. (2023) [38] from a comparison between ANSTO and Thermo 5014i at Liverpool. Our results support their finding that the lower correlations are a consequence of the higher MDLs of the radon measurements by the BAM instruments. Riley et al. (2023) [38] also suggested that the poorer correlations may be due to their study site having a significant coastal influence and observing more airmasses with marine signatures. Here, we show that the correlations between instruments at Muswellbrook, a site with less (but still some) of a coastal influence and more of a continental influence, are similar to the correlations from sites closer to the coast during periods of lower radon concentrations. The correlations between instruments are stronger at Muswellbrook in conditions when the radon concentrations are higher (overnight and during the cooler months) compared to the correlations at Chullora at similar times. At continental sites with little to no coastal influence we might expect that the greater uncertainties and lack of precision in radon measurements due to the BAM’s MDL may be further reduced.
Other than biases from the BAM's MDL issues, like Riley et al. (2023) [38], we find no systematic biases in the BAM radon measurements due to environmental conditions. In other words, the results are not dependent on temperature, humidity or wind, other than the effects of these conditions on the actual ambient radon concentrations due to increased convective mixing or dilution and dispersion under strong winds.
Our study's weakness lies in the fact that is is an experiment of convenience rather than a conditioned intercomparison. While we have compared three different makes of instruments from the same family (and five distinct instruments in total), we have not assessed the variation between instruments of the same make and model. In a well-designed intercomparison, at least three instruments of the same make and model should be assessed in real-world conditions over a period of at least several months (and ideally a complete year). This would provide a more robust assessment of the precision of the instruments in a range of environmental conditions.
5. Conclusions
This study further demonstrates that BAM radon measurements are robust and precise above their MDLs. BAM instruments from the Thermo family provide precise radon measurements, particularly during periods of elevated radon concentrations. In typical use they possess no obvious systematic issues that affect their precision, and results from different instruments are comparable. Although the instruments are precise, they are not particularly accurate.
For uses where absolute (accurate) radon concentrations are critical, BAMs need to be adjusted to the appropriate standard measurements against, for example, the ANSTO twin-filter, dual loop monitor. The precision and linear response from the BAMs suggest that such adjustments (calibrations) are readily achievable and can be traceable to appropriate standard methods [54,55].
The precision of the Thermo BAM radon measurements implies that even without adjustment, the radon data from these instruments can be used “as-is” in studies where the temporal variation in radon is more important than its absolute value. These include studies focussed on boundary layer development, estimation of mixing height, meteorological model verification, and the radon tracer method of identifying and quantifying greenhouse gas emission sources.
Our results further support the utility of BAM radon measurements. We encourage air quality monitoring network operators to routinely log radon data from their BAM instruments.
Supplementary Materials
The following supporting information can be downloaded at https://www.mdpi.com/article/10.3390/atmos15010083/s1, Figures S1–S20: Correlations and linear regression modelling for different meteorological conditions.
Author Contributions
Conceptualization, M.L.R.; methodology, M.L.R.; validation, M.L.R., G.G. and S.T.; formal analysis, M.L.R.; data curation, M.L.R.; writing—original draft preparation, M.L.R. and N.J.; writing—review and editing, M.L.R., N.J., G.G. and S.T. All authors have read and agreed to the published version of the manuscript.
Funding
DPE air quality monitoring is partly funded by the NSW Climate Change Fund. The Muswellbrook air quality monitoring station is part of the Upper Hunter Air Quality Monitoring Network.
Data Availability Statement
The data presented in this study are available on request from the corresponding author. The data are not publicly available due to legal/licensing restrictions.
Conflicts of Interest
The authors declare that they have no conflict of interest.
References
- Pearson, J.E.; Jones, G.E. Soil concentrations of “emanating radium-226” and the emanation of radon-222 from soils and plants. Tellus 1966, 18, 655–662. [Google Scholar] [CrossRef]
- Fricke, R.G.; Schlegel, K. Julius Elster and Hans Geitel–Dioscuri of physics and pioneer investigators in atmospheric electricity. Hist. Geo-Space Sci. 2017, 8, 1–7. [Google Scholar] [CrossRef]
- Dörr, H.; Kromer, B.; Levin, I.; Münnich, K.; Volpp, H.J. CO2 and radon 222 as tracers for atmospheric transport. J. Geophys. Res. Oceans 1983, 88, 1309–1313. [Google Scholar] [CrossRef]
- Polian, G.; Lambert, G.; Ardouin, B.; Jegou, A. Long-range transport of continental radon in subantarctic and antarctic areas. Tellus B Chem. Phys. Meteorol. 1986, 38, 178–189. [Google Scholar] [CrossRef]
- Chambers, S.D.; Williams, A.G.; Conen, F.; Griffiths, A.D.; Reimann, S.; Steinbacher, M.; Krummel, P.B.; Steele, L.P.; van der Schoot, M.V.; Galbally, I.E.; et al. Towards a universal “baseline” characterisation of air masses for high- and low-altitude observing stations using Radon-222. Aero. Air Qual. Res. 2015, 16, 885–899. [Google Scholar] [CrossRef]
- Jacob, D.J.; Prather, M.J.; Rasch, P.J.; Shia, R.L.; Balkanski, Y.J.; Beagley, S.R.; Bergmann, D.J.; Blackshear, W.; Brown, M.; Chiba, M. Evaluation and intercomparison of global atmospheric transport models using 222Rn and other short-lived tracers. J. Geophys. Res. Atmos. 1997, 102, 5953–5970. [Google Scholar] [CrossRef]
- Zhang, K.; Wan, H.; Zhang, M.; Wang, B. Evaluation of the atmospheric transport in a GCM using radon measurements: Sensitivity to cumulus convection parameterization. Atmos. Chem. Phys. 2008, 8, 2811–2832. [Google Scholar] [CrossRef]
- Zhang, B.; Liu, H.; Crawford, J.H.; Chen, G.; Fairlie, T.D.; Chambers, S.; Kang, C.-H.; Williams, A.G.; Zhang, K.; Considine, D.B. Simulation of radon-222 with the GEOS-Chem global model: Emissions, seasonality, and convective transport. Atmos. Chem. Phys. 2021, 21, 1861–1887. [Google Scholar] [CrossRef]
- Chambers, S.D.; Guérette, E.-A.; Monk, K.; Griffiths, A.D.; Zhang, Y.; Duc, H.; Cope, M.; Emmerson, K.M.; Chang, L.T.; Silver, J.D. Skill-testing chemical transport models across contrasting atmospheric mixing states using Radon-222. Atmosphere 2019, 10, 25. [Google Scholar] [CrossRef]
- Williams, A.G.; Zahorowski, W.; Chambers, S.; Griffiths, A.; Hacker, J.M.; Element, A.; Werczynski, S. The vertical distribution of radon in clear and cloudy daytime terrestrial boundary layers. J. Atmos. Sci. 2011, 68, 155–174. [Google Scholar] [CrossRef]
- Williams, A.G.; Chambers, S.; Griffiths, A. Bulk Mixing and Decoupling of the Nocturnal Stable Boundary Layer Characterized Using a Ubiquitous Natural Tracer. Bound.-Layer Meteorol. 2013, 149, 381–402. [Google Scholar] [CrossRef]
- Chambers, S.; Williams, A.; Zahorowski, W.; Griffiths, A.; Crawford, J. Separating remote fetch and local mixing influences on vertical radon measurements in the lower atmosphere. Tellus B Chem. Phys. Meteorol. 2011, 63, 843–859. [Google Scholar] [CrossRef]
- Vecchi, R.; Piziali, F.; Valli, G.; Favaron, M.; Bernardoni, V. Radon-based estimates of equivalent mixing layer heights: A long-term assessment. Atmos. Environ. 2019, 197, 150–158. [Google Scholar] [CrossRef]
- Crawford, J.; Chambers, S.D.; Williams, A.G. Assessing the impact of synoptic weather systems on air quality in Sydney using Radon 222. Atmos. Environ. 2023, 295, 119537. [Google Scholar] [CrossRef]
- Williams, A.G.; Chambers, S.D.; Conen, F.; Reimann, S.; Hill, M.; Griffiths, A.D.; Crawford, J. Radon as a tracer of atmospheric influences on traffic-related air pollution in a small inland city. Tellus B Chem. Phys. Meteorol. 2016, 68, 30967. [Google Scholar] [CrossRef]
- Chambers, S.; Podstawczyńska, A.; Pawlak, W.; Fortuniak, K.; Williams, A.; Griffiths, A. Characterizing the state of the urban surface layer using radon-222. J. Geophys. Res. Atmos. 2019, 124, 770–788. [Google Scholar] [CrossRef]
- Kikaj, D.; Chambers, S.D.; Crawford, J.; Kobal, M.; Gregorič, A.; Vaupotič, J. Investigating the vertical and spatial extent of radon-based classification of the atmospheric mixing state and impacts on seasonal urban air quality. Sci. Total Environ. 2023, 872, 162126. [Google Scholar] [CrossRef] [PubMed]
- Levin, I.; Glatzel-Mattheier, H.; Marik, T.; Cuntz, M.; Schmidt, M.; Worthy, D.E. Verification of German methane emission inventories and their recent changes based on atmospheric observations. J. Geophys. Res. Atmos. 1999, 104, 3447–3456. [Google Scholar] [CrossRef]
- Vogel, F.; Ishizawa, M.; Chan, E.; Chan, D.; Hammer, S.; Levin, I.; Worthy, D. Regional non-CO2 greenhouse gas fluxes inferred from atmospheric measurements in Ontario, Canada. J. Integr. Environ. Sci. 2012, 9, 41–55. [Google Scholar] [CrossRef]
- Grossi, C.; Vogel, F.R.; Curcoll, R.; Àgueda, A.; Vargas, A.; Rodó, X.; Morguí, J.-A. Study of the daily and seasonal atmospheric CH4 mixing ratio variability in a rural Spanish region using 222 Rn tracer. Atmos. Chem. Phys. 2018, 18, 5847–5860. [Google Scholar] [CrossRef]
- Al-Zoughool, M.; Krewski, D. Health effects of radon: A review of the literature. Int. J. Radiat. Biol. 2009, 85, 57–69. [Google Scholar] [CrossRef] [PubMed]
- Riudavets, M.; Garcia de Herreros, M.; Besse, B.; Mezquita, L. Radon and lung cancer: Current trends and future perspectives. Cancers 2022, 14, 3142. [Google Scholar] [CrossRef] [PubMed]
- Blomberg, A.J.; Coull, B.A.; Jhun, I.; Vieira, C.L.; Zanobetti, A.; Garshick, E.; Schwartz, J.; Koutrakis, P. Effect modification of ambient particle mortality by radon: A time series analysis in 108 US cities. J. Air Waste Manag. Assoc. 2019, 69, 266–276. [Google Scholar] [CrossRef] [PubMed]
- World Meteorological Organization. GAW Report No. 172. WMO Global Atmosphere Watch (GAW) Strategic Plan: 2008–2015—A Contribution to the Implementation of the WMO Strategic Plan: 2008–2011; WMO: Geneva, Switzerland, 2007; 108p. [Google Scholar]
- Heiskanen, J.; Brümmer, C.; Buchmann, N.; Calfapietra, C.; Chen, H.; Gielen, B.; Gkritzalis, T.; Hammer, S.; Hartman, S.; Herbst, M. The integrated carbon observation system in Europe. Bull. Am. Meteorol. Soc. 2022, 103, E855–E872. [Google Scholar] [CrossRef]
- Čeliković, I.; Pantelić, G.; Vukanac, I.; Krneta Nikolić, J.; Živanović, M.; Cinelli, G.; Gruber, V.; Baumann, S.; Quindos Poncela, L.S.; Rabago, D. Outdoor radon as a tool to estimate radon priority areas—A literature overview. Int. J. Environ. Res. Public Health 2022, 19, 662. [Google Scholar] [CrossRef] [PubMed]
- Williams, A.; Chambers, S. A History of Radon Measurements at Cape Grim. Baseline Atmospheric Program (Australia) History and Recollections, In 40th Anniversary Special ed.; Bureau of Meteorology and CSIRO: Melbourne, Australia, 2016; pp. 131–146. [Google Scholar] [CrossRef]
- Levin, I.; Born, M.; Cuntz, M.; Langendörfer, U.; Mantsch, S.; Naegler, T.; Schmidt, M.; Varlagin, A.; Verclas, S.; Wagenbach, D. Observations of atmospheric variability and soil exhalation rate of radon-222 at a Russian forest site. Technical approach and deployment for boundary layer studies. Tellus B Chem. Phys. Meteorol. 2002, 54, 462–475. [Google Scholar] [CrossRef][Green Version]
- Wada, A.; Murayama, S.; Kondo, H.; Matsueda, H.; Sawa, Y.; Tsuboi, K. Development of a compact and sensitive electrostatic radon-222 measuring system for use in atmospheric observation. J. Meteorol. Soc. Japan. Ser. II 2010, 88, 123–134. [Google Scholar] [CrossRef]
- Grossi, C.; Vargas, A.; Camacho, A.; López-Coto, I.; Bolívar, J.; Xia, Y.; Conen, F. Inter-comparison of different direct and indirect methods to determine radon flux from soil. Radiat. Meas. 2011, 46, 112–118. [Google Scholar] [CrossRef]
- Whittlestone, S.; Zahorowski, W. Baseline radon detectors for shipboard use: Development and deployment in the First Aerosol Characterization Experiment (ACE 1). J. Geophys. Res. Atmos. 1998, 103, 16743–16751. [Google Scholar] [CrossRef]
- Griffiths, A.D.; Chambers, S.D.; Williams, A.G.; Werczynski, S. Increasing the accuracy and temporal resolution of two-filter radon–222 measurements by correcting for the instrument response. Atmos. Meas. Tech. 2016, 9, 2689–2707. [Google Scholar] [CrossRef]
- Chambers, S.D.; Preunkert, S.; Weller, R.; Hong, S.-B.; Humphries, R.S.; Tositti, L.; Angot, H.; Legrand, M.; Williams, A.G.; Griffiths, A.D. Characterizing atmospheric transport pathways to Antarctica and the remote Southern Ocean using radon-222. Front. Earth Sci. 2018, 6, 190. [Google Scholar] [CrossRef]
- Xia, Y.; Sartorius, H.; Schlosser, C.; Stöhlker, U.; Conen, F.; Zahorowski, W. Comparison of one-and two-filter detectors for atmospheric 222 Rn measurements under various meteorological conditions. Atmos. Meas. Tech. 2010, 3, 723–731. [Google Scholar] [CrossRef]
- Schmithüsen, D.; Chambers, S.; Fischer, B.; Gilge, S.; Hatakka, J.; Kazan, V.; Neubert, R.; Paatero, J.; Ramonet, M.; Schlosser, C. A European-wide 222 radon and 222 radon progeny comparison study. Atmos. Meas. Tech. 2017, 10, 1299–1312. [Google Scholar] [CrossRef]
- Grossi, C.; Chambers, S.D.; Llido, O.; Vogel, F.R.; Kazan, V.; Capuana, A.; Werczynski, S.; Curcoll, R.; Delmotte, M.; Vargas, A. Intercomparison study of atmospheric 222 Rn and 222 Rn progeny monitors. Atmos. Meas. Tech. 2020, 13, 2241–2255. [Google Scholar] [CrossRef]
- Macias, E.S.; Husar, R.B. Atmospheric particulate mass measurement with beta attenuation mass monitor. Environ. Sci. Technol. 1976, 10, 904–907. [Google Scholar] [CrossRef]
- Riley, M.L.; Chambers, S.D.; Williams, A.G. Inter-Comparison of Radon Measurements from a Commercial Beta-Attenuation Monitor and ANSTO Dual Flow Loop Monitor. Atmosphere 2023, 14, 1333. [Google Scholar] [CrossRef]
- Perrino, C.; Pietrodangelo, A.; Febo, A. An atmospheric stability index based on radon progeny measurements for the evaluation of primary urban pollution. Atmos. Environ. 2001, 35, 5235–5244. [Google Scholar] [CrossRef]
- Chambers, S.D.; Wang, F.; Williams, A.G.; Xiaodong, D.; Zhang, H.; Lonati, G.; Crawford, J.; Griffiths, A.D.; Ianniello, A.; Allegrini, I. Quantifying the influences of atmospheric stability on air pollution in Lanzhou, China, using a radon-based stability monitor. Atmos. Environ. 2015, 107, 233–243. [Google Scholar] [CrossRef]
- Wang, F.; Zhang, Z.; Chambers, S.D.; Tian, X.; Zhu, R.; Mei, M.; Huang, Z.; Allegrini, I. Quantifying influences of nocturnal mixing on air quality using an atmospheric radon measurement case study in the city of jinhua, China. Aerosol Air Qual. Res. 2020, 20, 620–629. [Google Scholar] [CrossRef]
- Riley, M.; Kirkwood, J.; Jiang, N.; Ross, G.; Scorgie, Y. Air quality monitoring in NSW: From long term trend monitoring to integrated urban services. Air Qual. Clim. Chang. 2020, 54, 44–51. [Google Scholar]
- Sahukar, R.; Gallery, C.; Smart, J.; Mitchell, P. The Bioregions of New South Wales: Their Biodiversity, Conservation and History; National Parks and Wildlife Service NSW: Dubbo, Australia, 2003. [Google Scholar]
- Bureau of Meteorology. Sydney in 2011: Warm, Wet Year for Sydney. Available online: http://www.bom.gov.au/climate/current/annual/nsw/archive/2011.sydney.shtml (accessed on 20 September 2023).
- Bureau of Meteorology. Sydney in 2012: Average Conditions Hide a Year of Two Halves. Available online: http://www.bom.gov.au/climate/current/annual/nsw/archive/2012.sydney.shtml (accessed on 20 September 2023).
- Bureau of Meteorology. Recent and Historical Rainfall Maps—Thirty-Six-Monthly Rainfall Deciles for New South Wales/ACT 01/09/2015–31/08/2018. Available online: http://www.bom.gov.au/climate/maps/rainfall/?variable=rainfall&map=decile&period=36month®ion=ns&year=2018&month=08&day=31 (accessed on 13 October 2023).
- Bureau of Meteorology. Archive—Twelve-Monthly Mean Temperature Decile for New South Wales/ACT. Available online: http://www.bom.gov.au/jsp/awap/temp/archive.jsp?colour=colour&map=meandecile&year=2018&month=8&period=12month&area=ns (accessed on 13 October 2023).
- Chambers, S.; Williams, A.; Crawford, J.; Griffiths, A. On the use of radon for quantifying the effects of atmospheric stability on urban emissions. Atmos. Chem. Phys. 2015, 15, 1175–1190. [Google Scholar] [CrossRef]
- International Commission on Radiological Protection (ICRP). Protection against radon-222 at home and at work (ICRP Publication 65). In Annals of the ICRP; International Commission on Radiological Protection: Ottawa, ON, Canada, 1993; Volume 23. [Google Scholar]
- Kataoka, T. Diurnal variation in radon concentration and mixing-layer depths. Bound.-Layer Meteorol. 1998, 89, 225–250. [Google Scholar] [CrossRef]
- Kataoka, T.; Yunoki, E.; Shimizu, M.; Mori, T.; Tsukamoto, O.; Ohashi, Y.; Sahashi, K.; Maitani, T.; Miyashita, K.I.; Iwata, T. A study of the atmospheric boundary layer using radon and air pollutants as tracers. Bound.-Layer Meteorol. 2001, 101, 131–156. [Google Scholar] [CrossRef]
- Dörr, H.; Münnich, K. Annual variation in soil respiration in selected areas of the temperate zone. Tellus B 1987, 39, 114–121. [Google Scholar] [CrossRef]
- Oke, T.R. Boundary Layer Climates, 2nd ed.; Routledge: London, UK; New York, NY, USA, 2002; pp. 20–27. [Google Scholar]
- Röttger, A.; Röttger, S.; Grossi, C.; Vargas, A.; Curcoll, R.; Otáhal, P.; Hernández-Ceballos, M.Á.; Cinelli, G.; Chambers, S.; Barbosa, S.A. New metrology for radon at the environmental level. Meas. Sci. Technol. 2021, 32, 124008. [Google Scholar] [CrossRef]
- Chambers, S.D.; Griffiths, A.D.; Williams, A.G.; Sisoutham, O.; Morosh, V.; Röttger, S.; Mertes, F.; Röttger, A. Portable two-filter dual-flow-loop 222 Rn detector: Stand-alone monitor and calibration transfer device. Adv. Geosci. 2022, 57, 63–80. [Google Scholar] [CrossRef]
Disclaimer/Publisher’s Note: The statements, opinions and data contained in all publications are solely those of the individual author(s) and contributor(s) and not of MDPI and/or the editor(s). MDPI and/or the editor(s) disclaim responsibility for any injury to people or property resulting from any ideas, methods, instructions or products referred to in the content. |
© 2024 by the authors. Licensee MDPI, Basel, Switzerland. This article is an open access article distributed under the terms and conditions of the Creative Commons Attribution (CC BY) license (https://creativecommons.org/licenses/by/4.0/).

