Article

Feasibility of Measuring Brake-Wear Particle Emissions from a Regenerative-Friction Brake Coordination System via Dynamometer Testing

Japan Automobile Research Institute (JARI), 2530 Karima, Tsukuba 305-0822, Ibaraki, Japan
Atmosphere 2024, 15(1), 75; https://doi.org/10.3390/atmos15010075
Submission received: 22 November 2023 / Revised: 4 January 2024 / Accepted: 5 January 2024 / Published: 7 January 2024
(This article belongs to the Special Issue Study of Brake Wear Particle Emission)

Abstract

:
Emissions of brake-wear particles are commonly associated with vehicular traffic. We investigated the feasibility of quantifying brake-wear particle emissions under realistic vehicle driving and braking conditions with a currently used regenerative friction brake coordination system. We used a braking system installed in commercially available plug-in hybrid electric vehicles and found that it reduced emissions by 85% for PM10, 78% for PM2.5, and 87% for particle numbers (PNs) compared with the system installed in vehicles with internal combustion engines. Brake friction work showed a linear relationship with PM10 and PM2.5. Nanoparticle PM emissions tended to increase slightly with regenerative braking but did not contribute significantly to the overall PM percentage. The emission events of high concentrations of nuclei-mode particles (<20 nm in diameter) in electric vehicle brake assemblies designed for regenerative braking use under high-temperature, high-load braking conditions with full-friction brakes. The nuclei-mode particles amplified the PN emissions and led to high variability. In strict regulatory certification tests where measurement reproducibility and stability are required, it is appropriate to measure PNs under brake conditions appropriate for the actual use of electric vehicles rather than under full-friction brake conditions or to remove particle measurements smaller than 20 nm.

1. Introduction

Emissions of particulate matter in the urban atmosphere are a concern from the standpoints of climate change and human health, and emissions associated with road traffic are one of the sources. Particulate matter emitted from road traffic consists of exhaust particles generated by incomplete combustion of fuels and evaporation of lubricant components, as well as non-exhaust particles that are either emitted from vehicles or resuspended into the air because they are present on the road surface and become agitated by moving vehicles [1,2]. Although emissions of particles from exhausts continue to decrease because of improvements in exhaust aftertreatment systems, emissions of non-exhaust particles from brake wear and tire wear are a growing focus of interest because of the electrification of vehicles. A review of the literature indicates that vehicle brakes account for a large proportion of traffic-related particle emissions. Particles associated with brake wear and other non-exhaust particles account for 21–50% of the particulate matter derived from vehicles in cities and urban hotspots, suggesting that non-exhaust emissions in the urban environment are important [3,4,5].
Vehicle exhausts have been regulated based on Particle Mass (PM) emission factors worldwide since the 1990s. The methodology involves collecting the PM from dilute exhaust gases on a filter and weighing it after testing [6]. This method of measurement achieved the limits of its sensitivity with the introduction of filters in aftertreatment systems, and the Particle Number (PN) method was introduced in 2011, first in Europe and then in Asia [7]. The PN emission factor measurement method was developed by the Particle Measurement Programme Informal Working Groupe (PMP-IWG), which started its work in the early 2000s.
Various values of brake wear PM emission factors have been published in the literature, depending on the measurement and calculation methods. Emission factors for PM10 have ranged from 1.0–8.0 mg/km per vehicle based on a review of the literature [3] to 2.2–9.5 mg/km per brake based on laboratory testing [8]. A considerable range of PN emission factors, between 109 and 1013 #/km per vehicle, has been reported in the literature [9,10].
In response to these findings, the Working Group on Energy and Pollution (GRPE) organized the PMP-IWG in 2021 to develop a global technical regulation (GTR24) for the sampling and measurement of brake-wear particles emitted from light-duty vehicles (LDVs) up to 3.5 t [11]. The EURO7 regulation planned for the future in Europe incorporates restrictions on tire wear and emissions of brake particles to ensure that vehicle emissions are at the lowest possible level and improve air quality [12]. These rules apply to all vehicles, including electric vehicles and vehicles powered by internal combustion engines. The rules have also been extended to include vehicles with regenerative brake systems. Friction brakes that share coefficients that depend on the electric vehicle type have been implemented in this method to allow third-party laboratories to perform tests based on the GTR24 procedure. Although this friction brake share coefficient was the first step in the study of brake wear particle emissions for vehicles with regenerative brake systems, the method does not represent actual regenerative braking characteristics and needs to be improved [13,14,15]. These previous studies have involved tests on European performance (ECE) braking systems [13,14,15], and there is a very limited body of empirical knowledge of brake-wear particle emissions from non-asbestos organic (NAO) pads designed primarily for the North American and Asian markets, e.g., [13].
Based on environmental policy-making processes in Japan [16], the Automotive Emissions Expert Committee of Japan has been discussing this issue and is in the process of developing the Future Measures to Reduce Automobile Emissions (Fifteenth Report). The Environmental Ministry of Japan has declared that it will actively participate in and contribute to the assessment of the world harmonization standards by using the findings obtained in the study of the impact of brake wear particle emission on the air quality to take into consideration the emission characteristics of brake-wear particles in the World Forum for Harmonization of Vehicle Regulations (WP.29) [17].
The aim of this study was to evaluate the feasibility of these test measurements made by a third-party laboratory with respect to brake particles emitted by currently used electrified vehicles. We used a commercially available regenerative-friction brake coordination system equipped with NAO pads to measure emissions of brake-wear particles as well as the friction brake share coefficient and the actual vehicle brake torque. We evaluated the emissions to test the hypothesis [11,13,14,15] that the regenerative potential of electrified vehicles could reduce emissions of brake-wear particles and mitigate secondary effects.

2. Materials and Methods
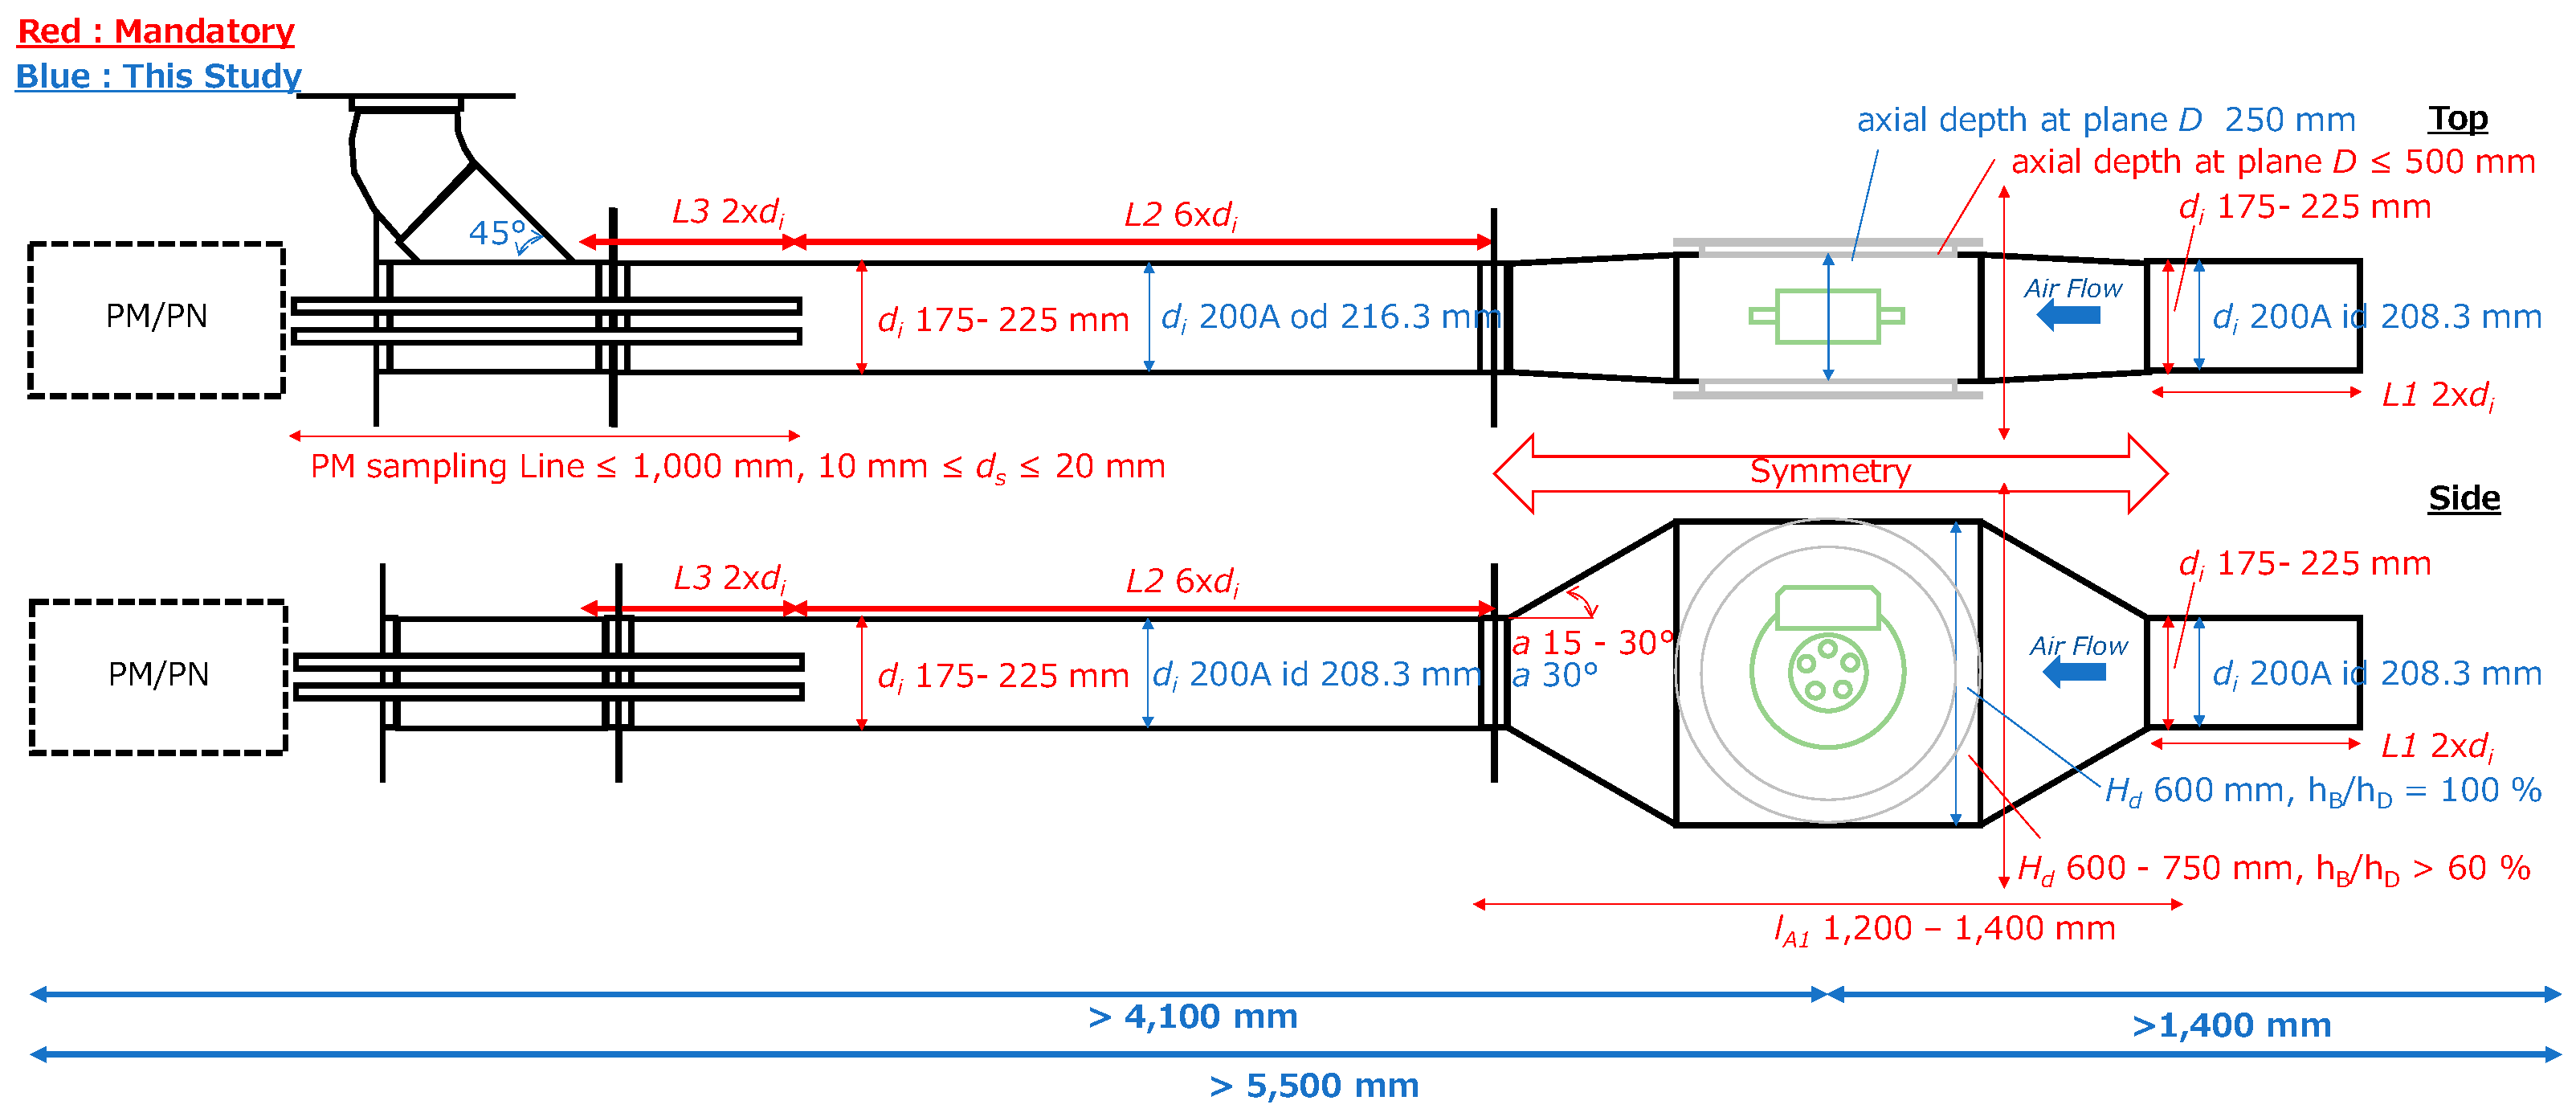
2.1. Brake System

A Plug-in Hybrid Electric Vehicle was chosen for the test brake system as an example of a passenger car with a regenerative coordinated braking system widely used in urban areas. The test vehicles were registered in model years 2012–2014. Because brake systems for vehicles differ by market region and model year, we selected a brake system that was widely used in Japan and North America after 2012. We used genuine Original Equipment Manufacturer (OEM) brake pads composed of non-steel (also known as non-asbestos organic [NAO]) friction material. The average vehicle lifespan in Japan in 2022 has been reported to be 13.84 years for passenger cars [18], i.e., the model year of passenger cars driven in 2024 would be approximately 2011. Despite the limited timeframe of the study, there is little doubt that we achieved our original objective of investigating the feasibility of measuring brake-wear particles emitted by currently used plug-in hybrid vehicles with regenerative braking systems.

2.2. Brake Dynamometer Testing

Our experiments were performed in December 2022, before the publication of GTR24 [11], as in previous studies, e.g., [13]. The repeatability of the measurements is discussed in Section 3.2.4, “Particle Number Size Distributions.” Brake-wear particles in this study were measured in a manner as compliant as possible with the proposed GTR24, using a single axle of the right front brake system of the test vehicle [11]. Briefly, we used a dynamometer to rotate the disc to match the vehicle speed defined by the 1-Hz schedule in the WLTP-Brake cycle, and the brake was controlled to correspond to the defined braking event time and inertia of the test vehicle. The dynamometer in this study was an AC 370 kw dynamometer (model FED-DNR, Meidensha Corp., Tokyo, Japan) that evaluated the transient operating performance of a diesel engine for strict acceleration and torque absorption. The dynamometer was fitted with a differential rig (reduction ratio 3.307:1) to control low speeds below several hundred rpm. An axial torque meter (model TMOS-3KNM, Meidensha Corp., Tokyo, Japan) monitored the disc torque (Nm) to comply with the inertia of the test vehicle, and the brake torque was controlled by a brake hydraulic pressure generator equipped with a dedicated master cylinder (model 19233, Shin Nippon Tokki Co. Ltd., Shizuoka, Japan). The brake temperature was measured with a thermocouple positioned 10 mm radially outward from the center of the friction path and at a depth of 0.5 ± 0.1 mm from the disc surface.
Table A1 shows the test schedule. The test was repeated three times under different brake friction work conditions after five bedding cycles. After these series of tests (Runs 21 and 22), a full-friction brake test was conducted twice more to confirm reproducibility.

2.3. Brake Full-Friction Work

The brake friction work (i.e., inertia) defined in this study was obtained from the nominal test inertia (54.9 kg·m2) based on a test vehicle mass of 1533 kg, a tire dynamic load radius of 305 mm, and a brake force distribution of 77% front to rear. The applied inertia (47.8 kg·m2) during a full-friction brake test (i.e., FFB = 1.00, hereafter referred to as FFB) without regenerative coordinated brake control was obtained by multiplying this value by the parasitic loss reduction ratio of 0.87.
In the 303 brake event periods defined by the WLTP-Brake Cycle, the brakes were controlled based on the inertia of the friction brake work multiplied by the respective coefficients (i.e., the FFB was set to 1.00, and the target brake torque (Nm) was multiplied by a constant coefficient).
Because the speed, deceleration, and brake torque based on the driving mode used to conduct the tests in this study varied as a function of the test vehicle mass and brake distribution, they were determined based on the passenger car specifications used in this study and the WLTP-Brake Cycle Profile, as well as by the General Rules for Automobile Brake Test Methods (JIS D 0210 2022 (1)) [19] based on the passenger car specifications used in this study and the WLTP-Brake Cycle Profile. The target brake torque obtained from the inertia moment during the test was as follows.
T′ = I′ × bi/r,
Here,
  • T′: target brake torque (Nm)
  • bi: deceleration (m/s2)
  • r: tire dynamic load radius (305 mm) (m)
  • I′: applied test inertia (kg·m2) = I × 0.87 (i.e., the inertia moment considering 13% parasitic loss of rolling resistance), where I is the nominal test inertia (kg·m2) defined as
I = 1/2 × m × r2 × α/100,
  • m: test vehicle mass (1533 kg) (kg)
  • α: brake force distribution (0.77 = 77%) (-)

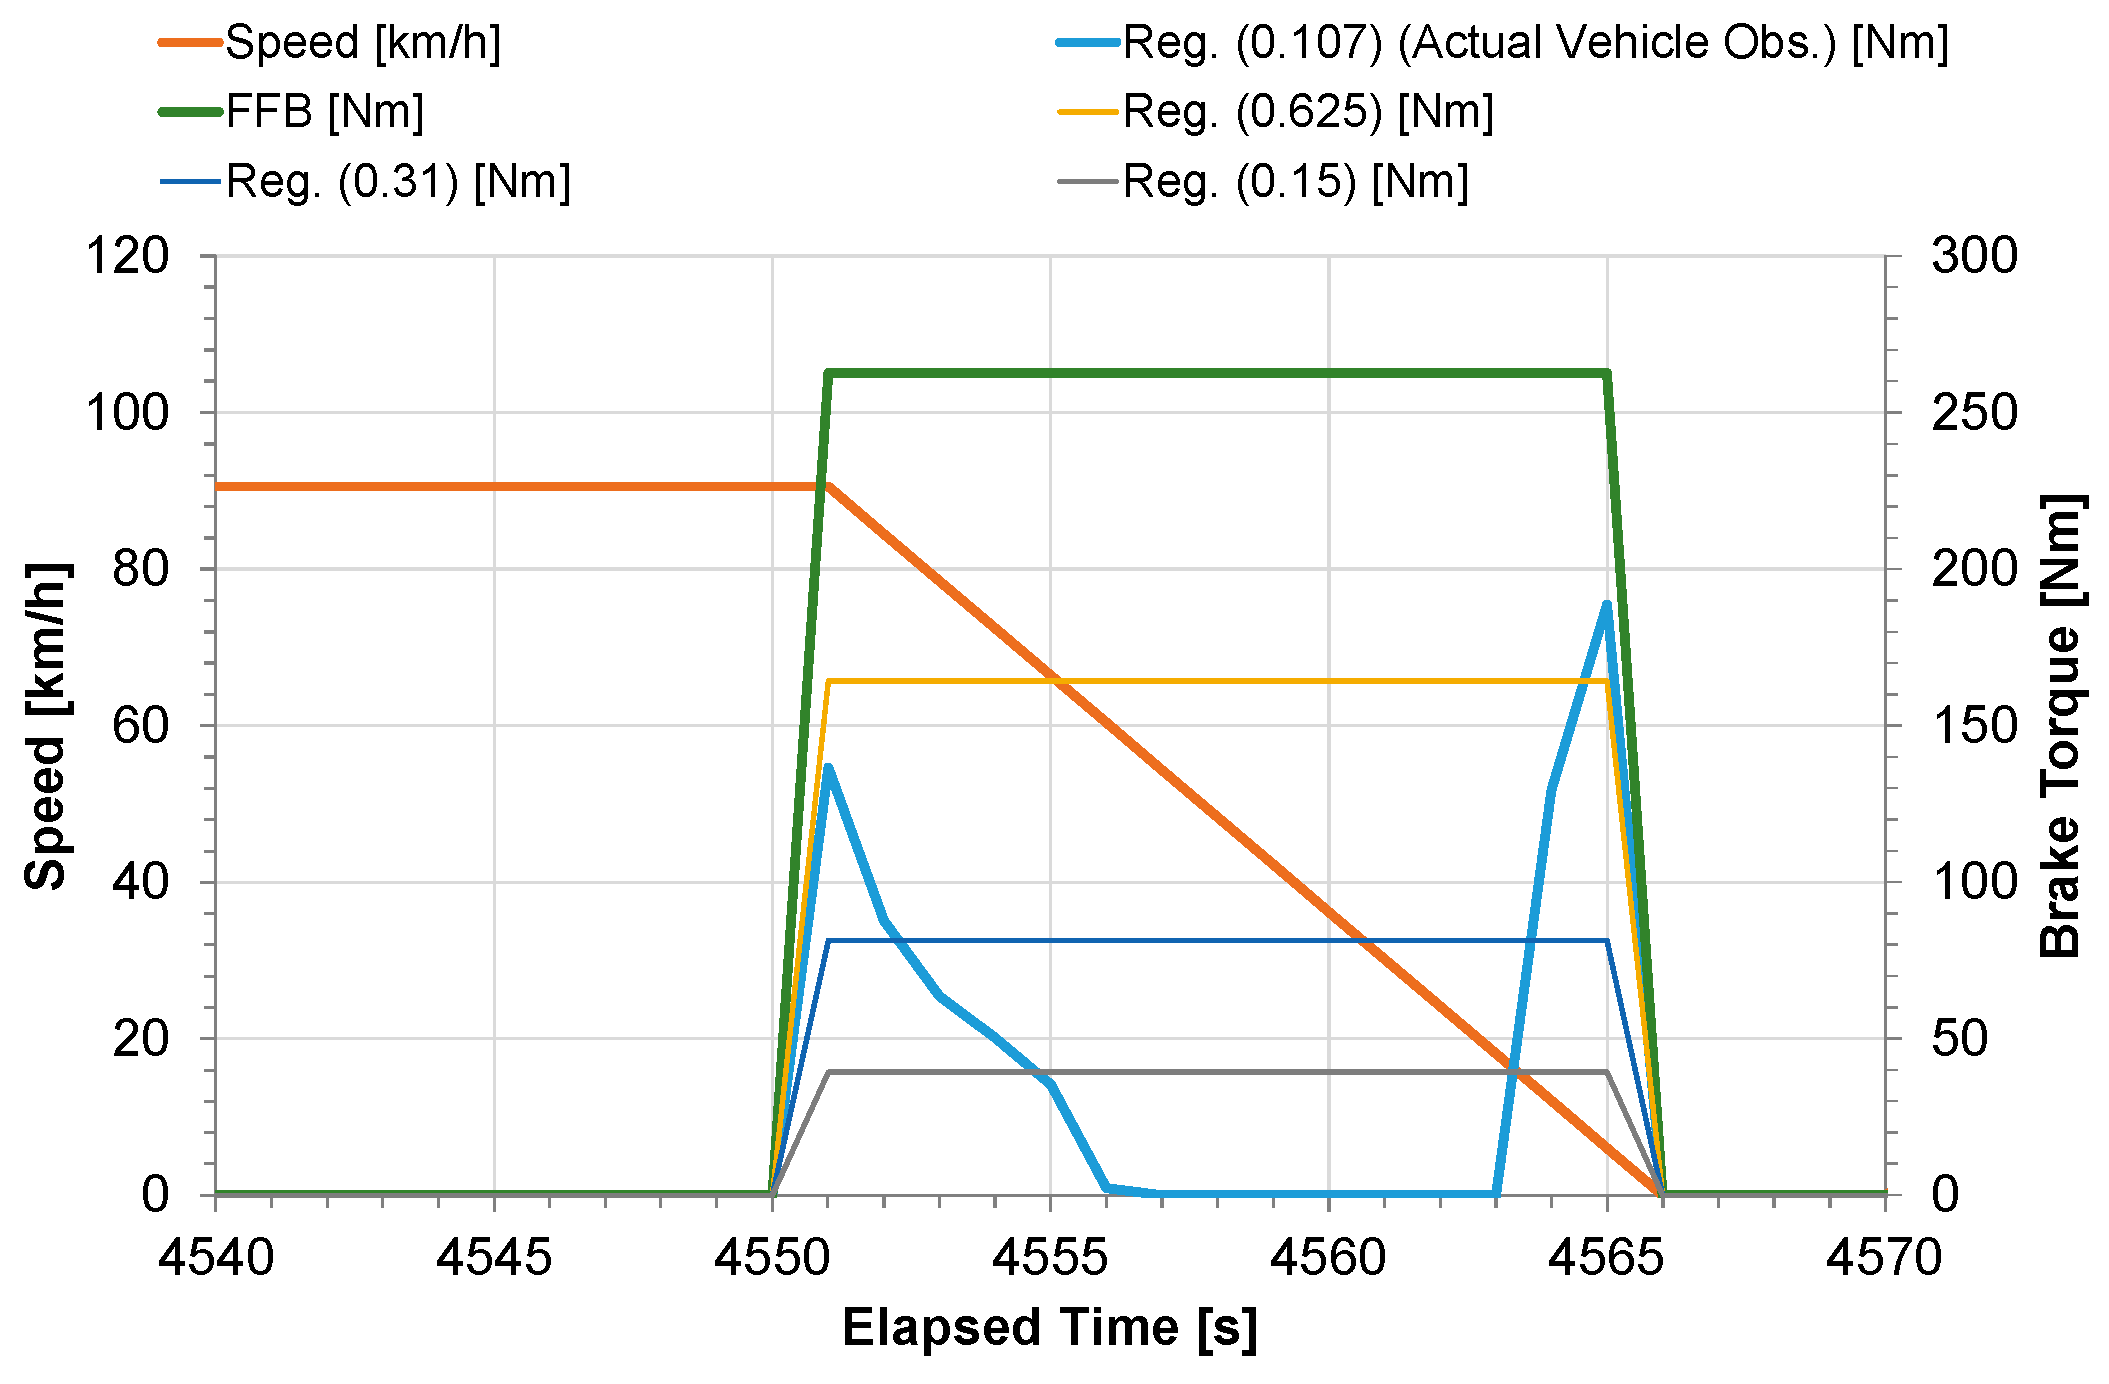
2.4. Regenerative-Friction Brake Work Distribution

The friction brake work distribution for the regenerative, cooperative braking control was set to 0.625 (29.9 kg·m2 applied inertia) (hereafter referred to as Reg. (0.625)), corresponding to Not off-vehicle charging hybrid electric vehicle Category 1 (NOVC-HEV Cat. 1); 0.31 (14.8 kg·m2 applied inertia) (hereafter referred to as Reg. (0.31)), corresponding to Off-vehicle charging hybrid electric vehicle (OVC-HEV); and 0.15 (7.17 kg·m2 applied inertia) (hereafter referred to as Reg. (0.15)), corresponding to a pure electric vehicle (PEV). These vehicle types and friction brake share coefficients were being discussed in the PMP-IWG at the time of the experiment.
The actual friction brake distribution profile of the test vehicle changes instantaneously as a function of the driving conditions. Therefore, as shown in Section 2.5, a friction brake distribution profile with 1-Hz resolution was created, the friction brake control of the test vehicle was reproduced on a brake dynamometer, and brake wear particles were measured.

2.5. Measurement of Regenerative-Friction Brake Work Distribution during Vehicle Test

The friction brake distribution with regenerative coordinated braking in the test vehicle depends on the system design and operating conditions (e.g., vehicle mass, deceleration, kinetic energy level, and battery capacity). The friction brake distribution in the regenerative, cooperative braking system was therefore measured by running the test vehicle at a vehicle speed based on the WLTP-Brake Cycle on a chassis dynamometer. In this study, an automatic driving robot (ADS-7000, HORIBA, Ltd., Kyoto, Japan) was used as a driver to obtain data on braking control so that the test results could be reproduced. Ideal regenerative-friction brake coordination aims to maximize the use of regenerative brakes; however, it is subject to charging limitations related to the maximum torque that can be supplied by the electric motor, the state of charge (SOC) of the battery, and the vehicle speed. For this reason, the charge was met under the conditions based on the design of the vehicle during the soak time that ended Trip 1 to Trip 9 of the WLTP-Brake Cycle. For battery safety, the batteries were designed not to be charged up to 100% SOC (e.g., Ni batteries were not charged above 80% SOC to prevent overheating due to overcharging).
The friction brake distribution was recorded from the Controller Area Network (CAN) signal generated by the On-Board Diagnostics (OBD) inside the Electronic Control Unit (ECU). These signals were used to create friction brake distribution profiles for each 1-Hz resolution, and the test brake was controlled so that the applications of the friction brakes were synchronized at a resolution of one Hertz. The implication was that the brake torque at time t was given a friction brake distribution obtained from the vehicle data, and the brake torque was controlled so that it followed the brake torque profile for each Hertz.
T′t = T′ × (TVehicle,Total,t − TVehicle,Regenerative,t)/TVehiclet,Total,t,
Here,
  • T′t: target brake torque at test time t (Nm)
  • TVehicle, Total Front Torque, t: total brake torque of front axle of vehicle at test time t (Nm)
  • TVehicle, Front Regenerative Torque, t: regenerative brake torque of front axle of vehicle at test time t (Nm)
The friction brake distribution of the regenerative coordinated braking control for OVC-HEVs averaged 0.107 (5.1 kg·m2 inertia value) (hereafter referred to as Reg. (0.107)).

2.6. Brake Wear Particle Measurements

Sampling of brake wear particles was carried out in accordance with the GTR24 as far as possible and is described briefly here. HEPA-filtered air was introduced from the upstream side into the enclosure containing the brake system at a controlled temperature of 20 °C, a relative humidity of 50%, and a constant flow rate, and samples were taken from the downstream sampling tunnel through four sampling probes fitted with constant velocity suction nozzles. The flow rate was measured at the brake temperature of GTR24. The flow rate was set to 4.1 m3/min (246 m3/h, 20 °C standard condition) in this experiment to keep the brake temperature within the GTR24 range. The differences between the method used in this study and the latest GTR24 proposal were twofold: first, the cross-sectional width of the enclosure was narrowed to 250 mm to allow for effective cooling compared with the default size of 400–500 mm based on the current GTR24 for Plane D of the enclosure (Figure A1). Second, the brake torque resolution for brake control and friction brake workload measurement was smaller than that of the GTR24. The resolution of the brake torque is a feedback control with a period of more than 250 Hz in the control, whereas data recording is carried out at 10 Hz.
Brake-wear particle measurements are described here in brief (see Appendix B for details). The total mass loss of the friction partners (pads and discs) was determined (unit: mg), and the quotient of the wear factor divided by the total test mileage (unit: km) was derived to allow comparison with the airborne particle emission factors. Mass loss of the friction partner was measured before and after the test. The mass loss measurement was performed only for the FFB tests of Runs #1–8 in Table A1, and measurements were taken within one hour after the test.
PM10 and PM2.5 particles were collected on Teflon filters using a cyclone and weighed on an electronic balance. A Low-Pressure Impactor (LPI) (LP-20, Tokyo Dylec Corp., Tokyo, Japan) was used to measure the distribution of the masses of aerodynamic particles with sizes in the range 0.05–11 mm. PN was measured using a Condensation Particle Counter (CPC) (model 3750, TSI Inc., Shoreview, MN, USA), which is a total particle counting method (TPN10) with a cut-off particle size of 10 nm without any pre-treatment such as heating, and a cyclone for CPC (model 1031558, TIS Inc.) to remove particles larger than 2.5 µm at a 50% cut-off particle size. A Fast Mobility Particle Sizer (FMPS 3091, TSI Inc., Shoreview, MN, USA) was used to measure the particle distribution from 5.6 to 560 nm in diameter. The size distribution of coarse particles was measured using an Aerodynamic Particle Sizer (APS 3321, TSI Inc., Shoreview, MN, USA) for aerodynamic sizes of 0.5–20 µm (light-scattering intensity of 0.37–20 µm).

3. Results and Discussion

3.1. Friction Brake on Regenerative-Friction Brake Coordination System

3.1.1. Friction Brake Distribution
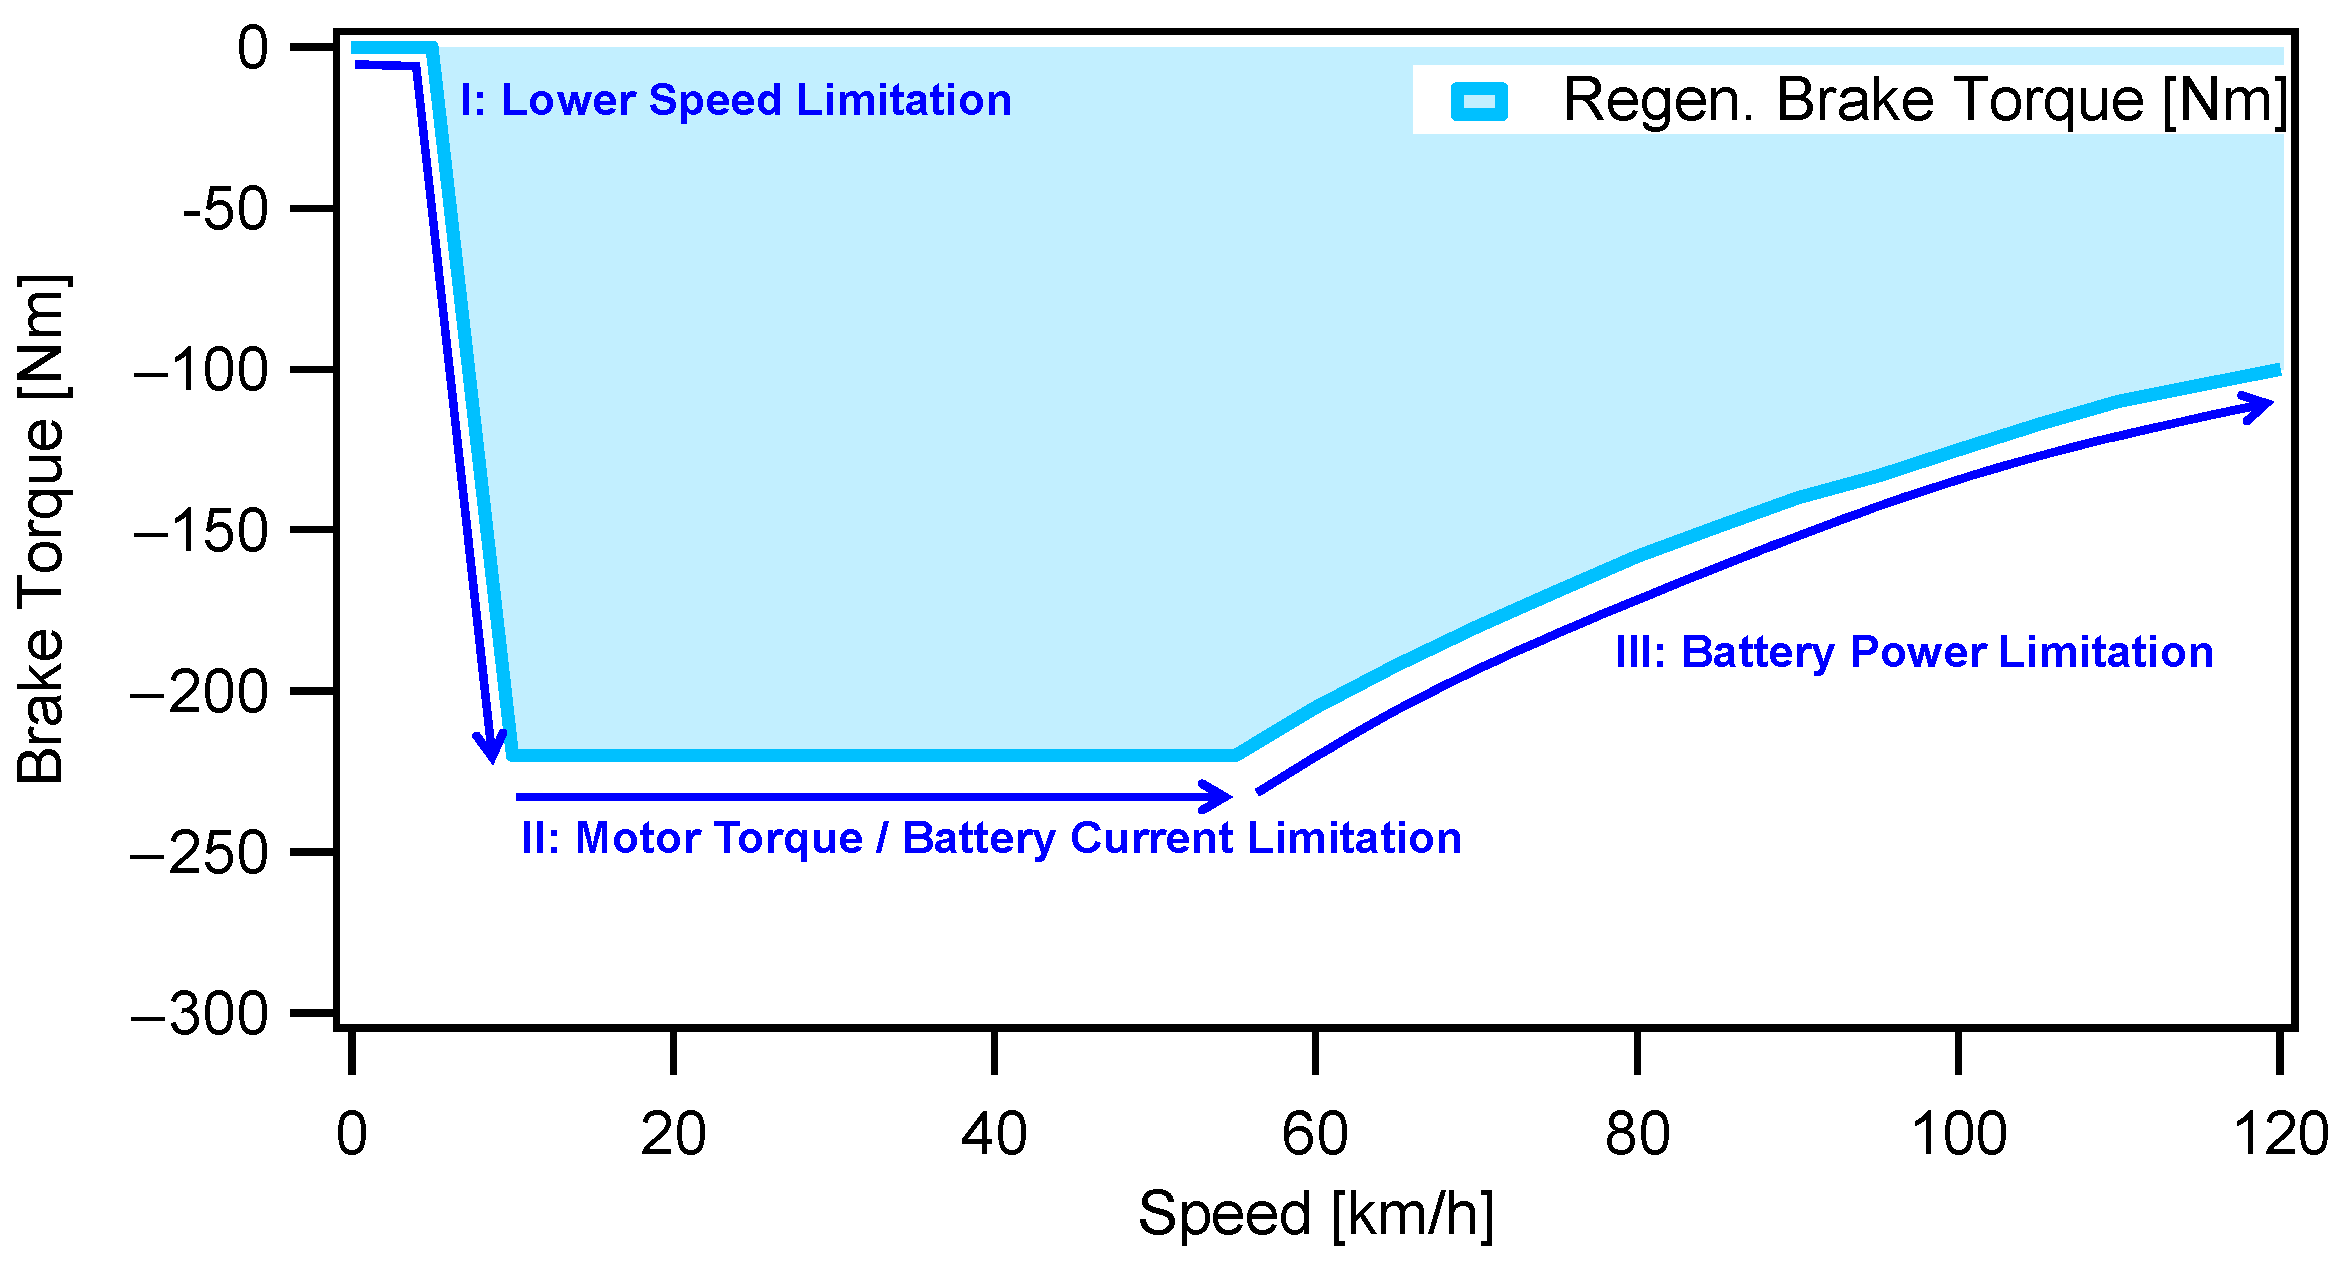
The distribution of regenerative and friction braking in regenerative-friction coordinated brake control generates the brake force required by the driver through coordination between regenerative braking, which is decelerated by the driving motor, and friction braking, which presses the brake pads against the disc rotating with the wheels. The distribution of regenerative and friction braking in regenerative-friction coordinated brake control generates the brake force required by the driver through coordination between regenerative braking, which is decelerated by the driving motor, and friction braking, which presses the brake pads against the disc rotating with the wheels. Ideal regenerative coordinated brake control aims to maximize the use of a regenerative brake; however, there are limitations in relation to the maximum torque the electric motor can deliver, the state of charge (SOC) of the battery, and the vehicle speed, as shown in Figure 1 and described below [20,21,22].
I:
At relatively low speeds, the regenerative energy is small because the rotational energy is low, and the braking force is therefore insufficient to stop the vehicle. As a result, the distribution of the regenerative brake is reduced because of braking inefficiency and poor performance, and the friction brake distribution is mainly used. The range of limits depends on the design of the vehicle, such as the diameter of the tire, and it varies with the power generation efficiency at low speeds.
II:
The maximum torque available to the driving motor limits the maximum torque for the regenerative brake. The excess torque required by the driver over the maximum torque is allocated to the friction brake.
III:
At higher speeds, the regenerative power is greater and is limited by the regenerative power output (kW) because of battery-charging constraints. The regenerative brake is also limited by the state of the SOC of the vehicle battery and the corresponding maximum available capacity for energy regeneration. There is also a temperature-based limit, with a peak limit that can only be maintained for short periods of time because of thermal constraints and a nominal limit that can be maintained in continuous operation.
Furthermore, a delay of several milliseconds is provided for the response time of the vehicle’s friction brake. Once deceleration starts, the fact that the regenerative torque drops faster than the friction torque affects the driver’s impression of the braking action, so the distribution of the regenerative torque is adjusted. Algorithms based on the above principles are varied because the types of models are diverse.
Figure 2 shows the time profile of friction brake torque in regenerative-friction coordinated brake control using friction brake torque and an actual vehicle, with #104 extracted as an example of a braking event that resulted in a complete stop. In regenerative, cooperative braking control, based on the torque/speed profile shown in Figure 2, the friction and regenerative brakes are allocated in the initial brake phase, the vehicle is decelerated only by the regenerative brake in the middle phase of braking, and finally the regenerative brake cannot regenerate power because of the low vehicle speed around the safe stop. The friction brake is therefore allocated to the final phase of the brake. Reg. (0.107) was carried out by defining brake events #1 to 303 as the frictional brake torque per second obtained from the actual vehicle friction brake torque.

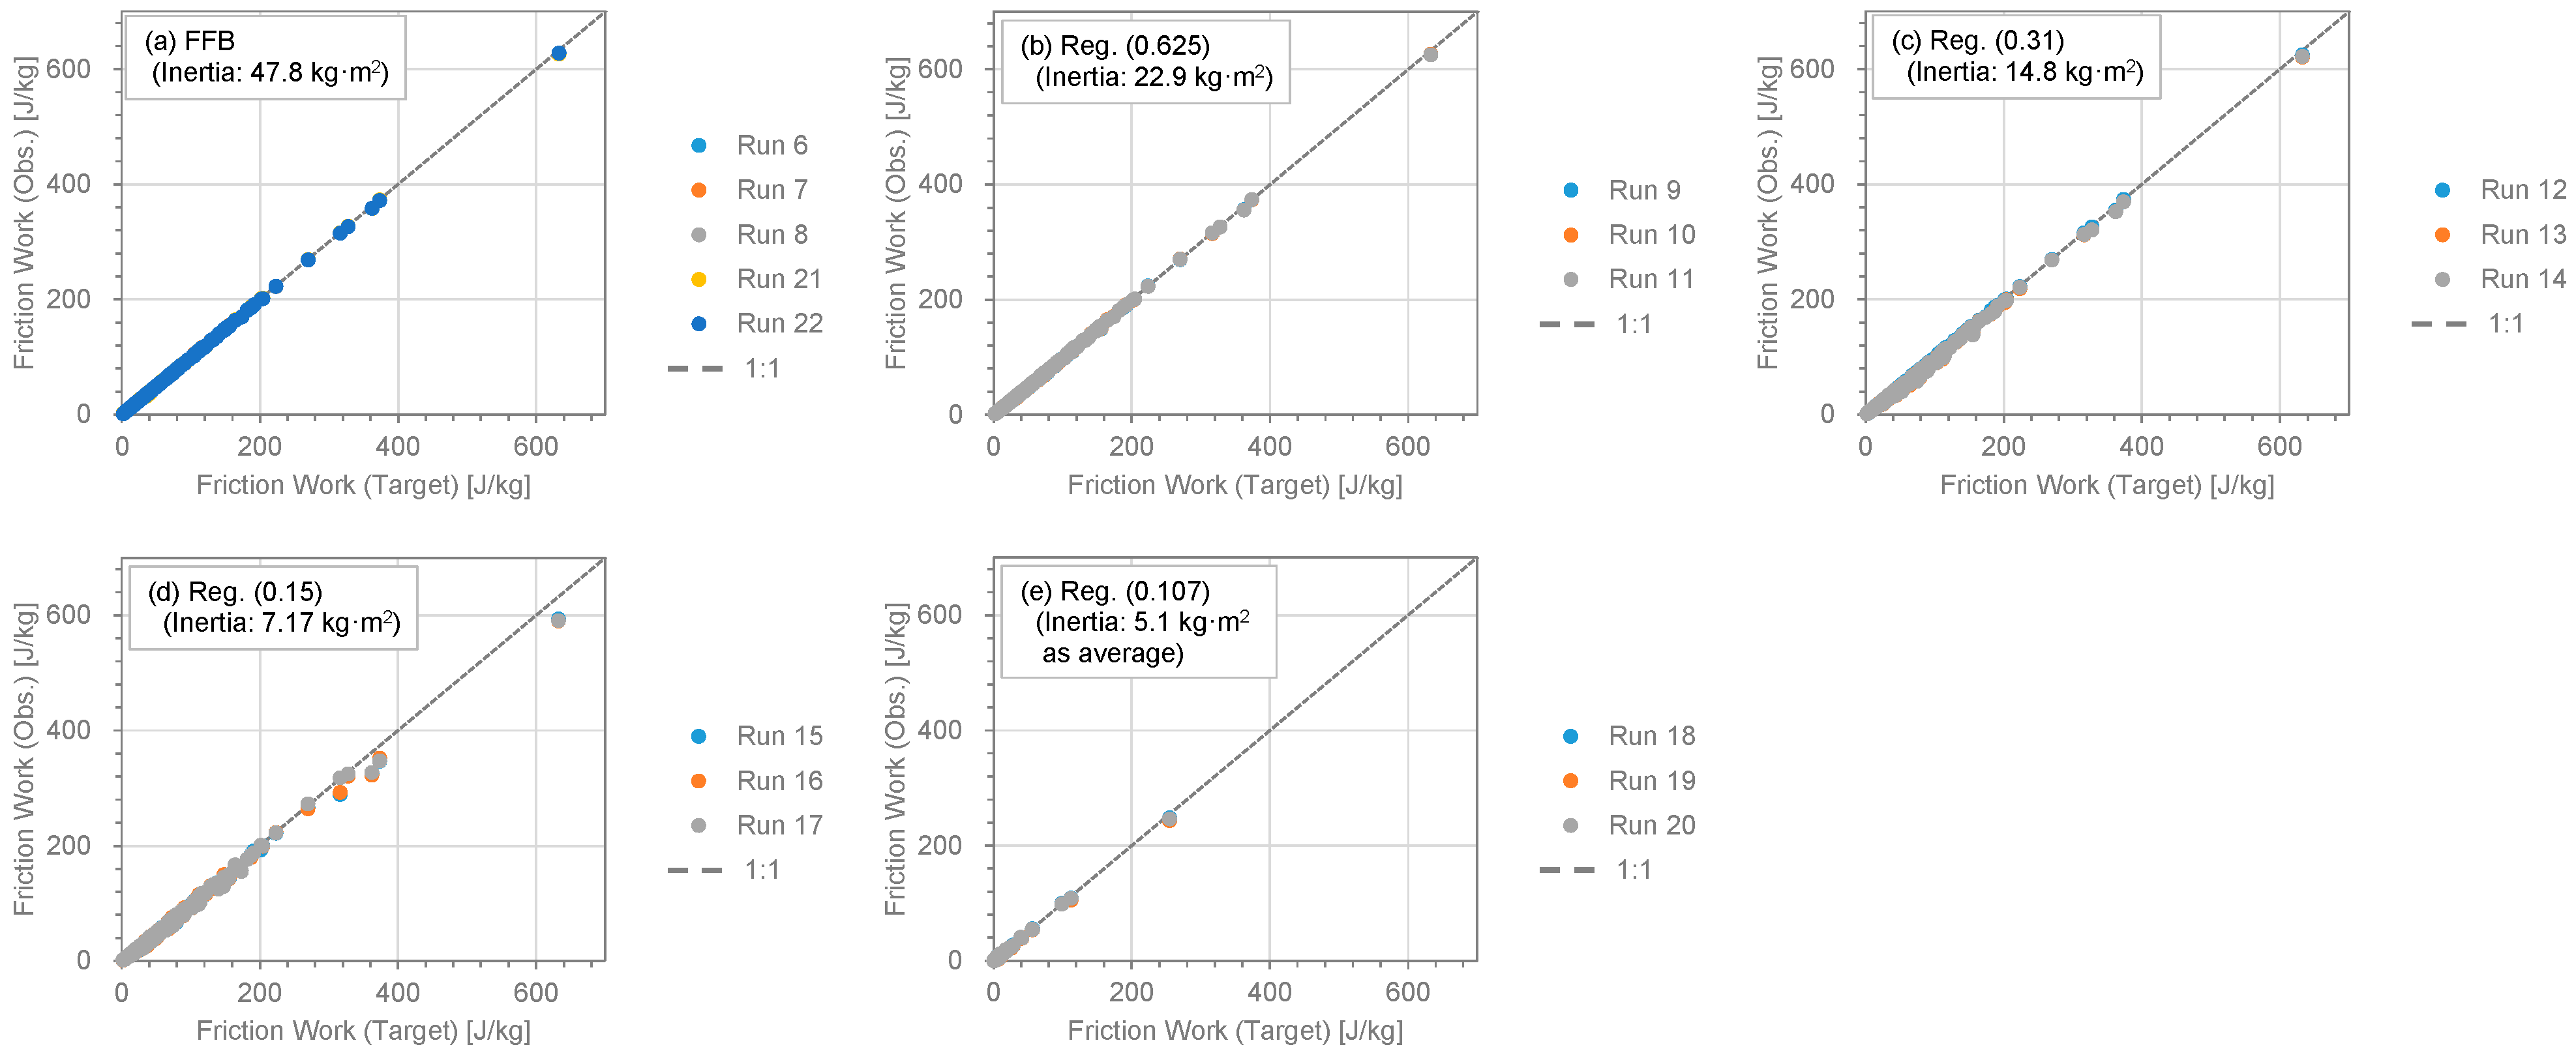
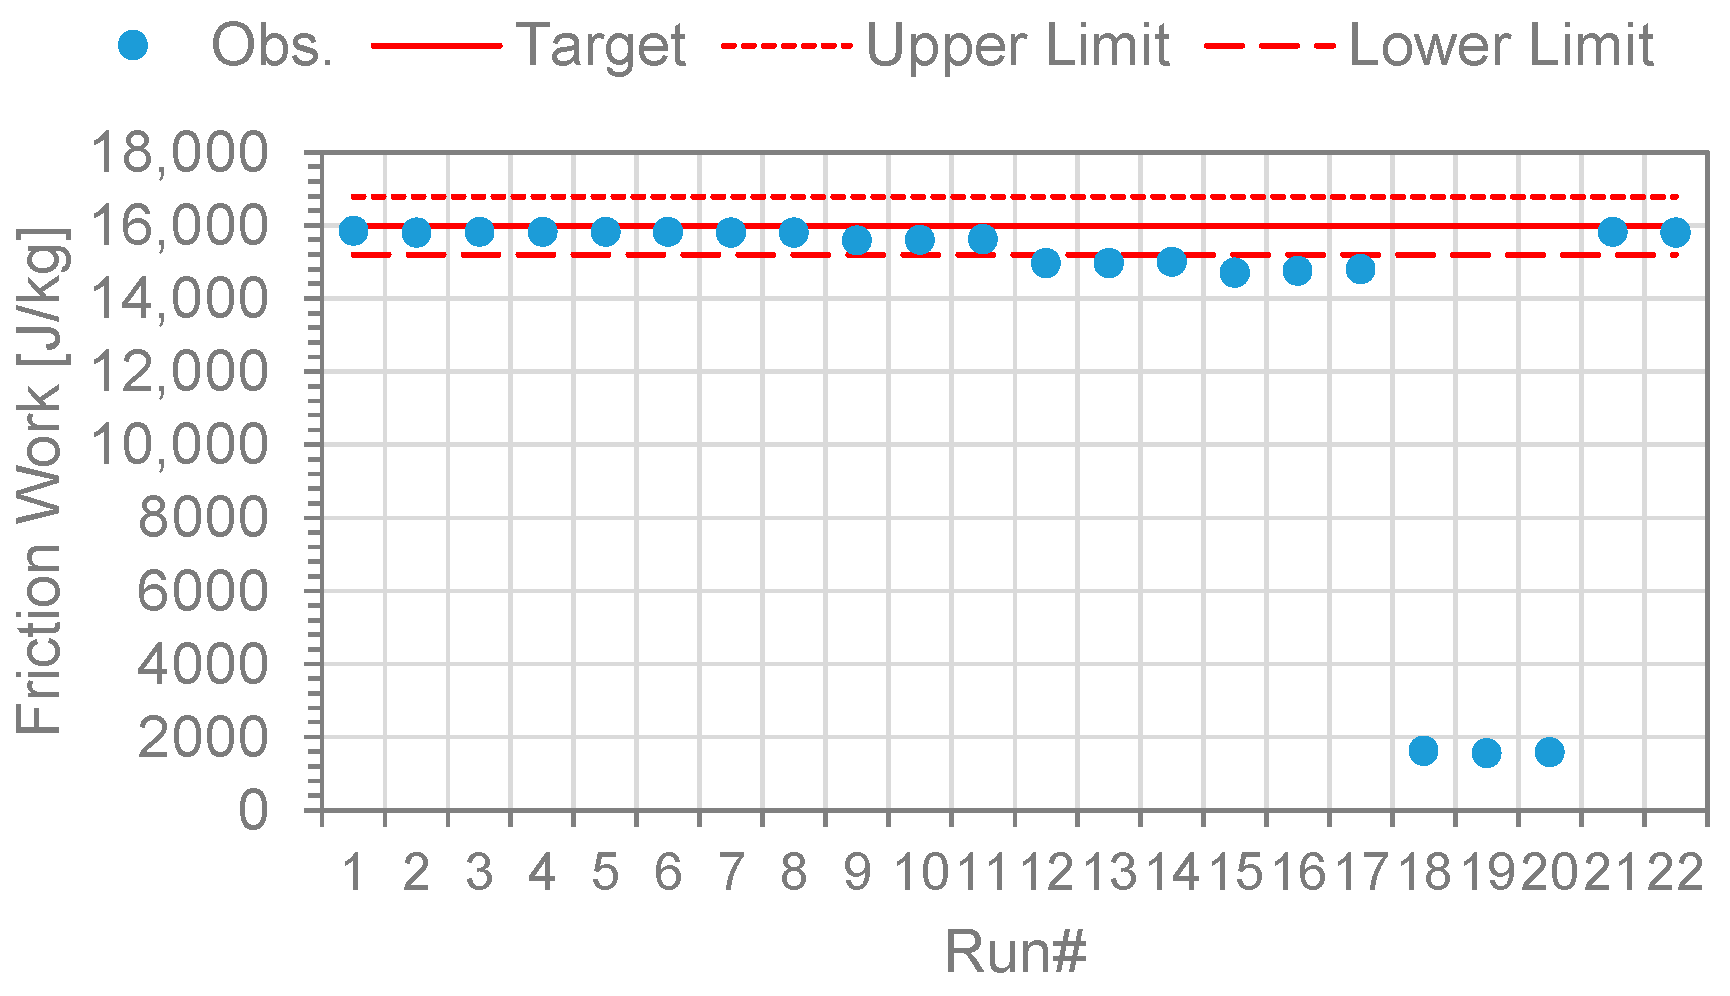
3.1.2. Friction Work

As a quality standard for the simulation of the friction work (J/kg) recovery on brake dynamometers, we plotted the friction work measured for brake events #1–303 against the target value in Figure 3. Both controls plot near a 1:1 straight line and reach the target friction work. The results show that the test brake in this study was able to very reproducibly control the friction work of the target under all conditions. The total friction work (J/kg) shown in Figure 4 was achieved with an FFE of 1% against the GTR24 target. Under regenerative brake conditions, the observed percentage was slightly lower than the target of 5%: 2% at Reg. (0.625), 6% at Reg. (0.31), and 7% at Reg. (0.15). The 6% and 7% of the target pattern below the lower limit were due to the ability associated with low inertia of the feedback control of the dynamometer rotation and brake torque. Reg. (107) differed from the braking time in the WLTP-brake profile because of the absorption of torque by regenerative braking (there was time without friction braking). The total frictional work (J/kg) of Reg. (107) was 90% lower than the WLTP-Brake profile of the GTR24.

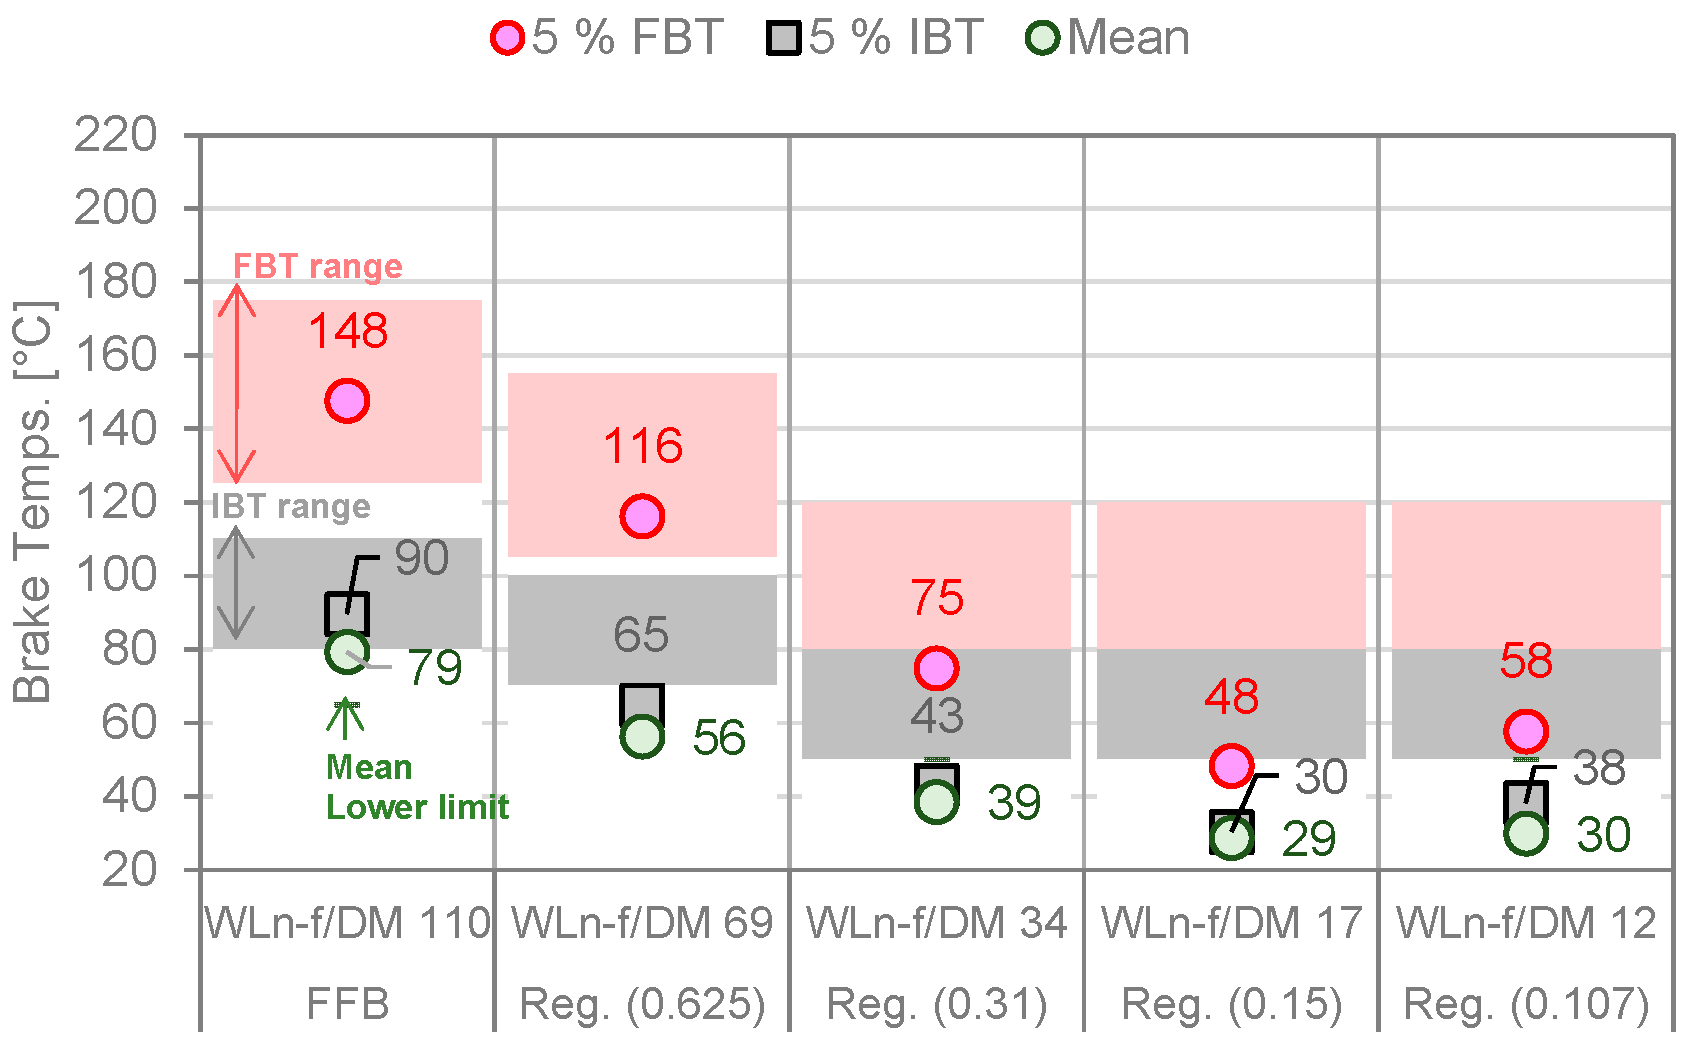
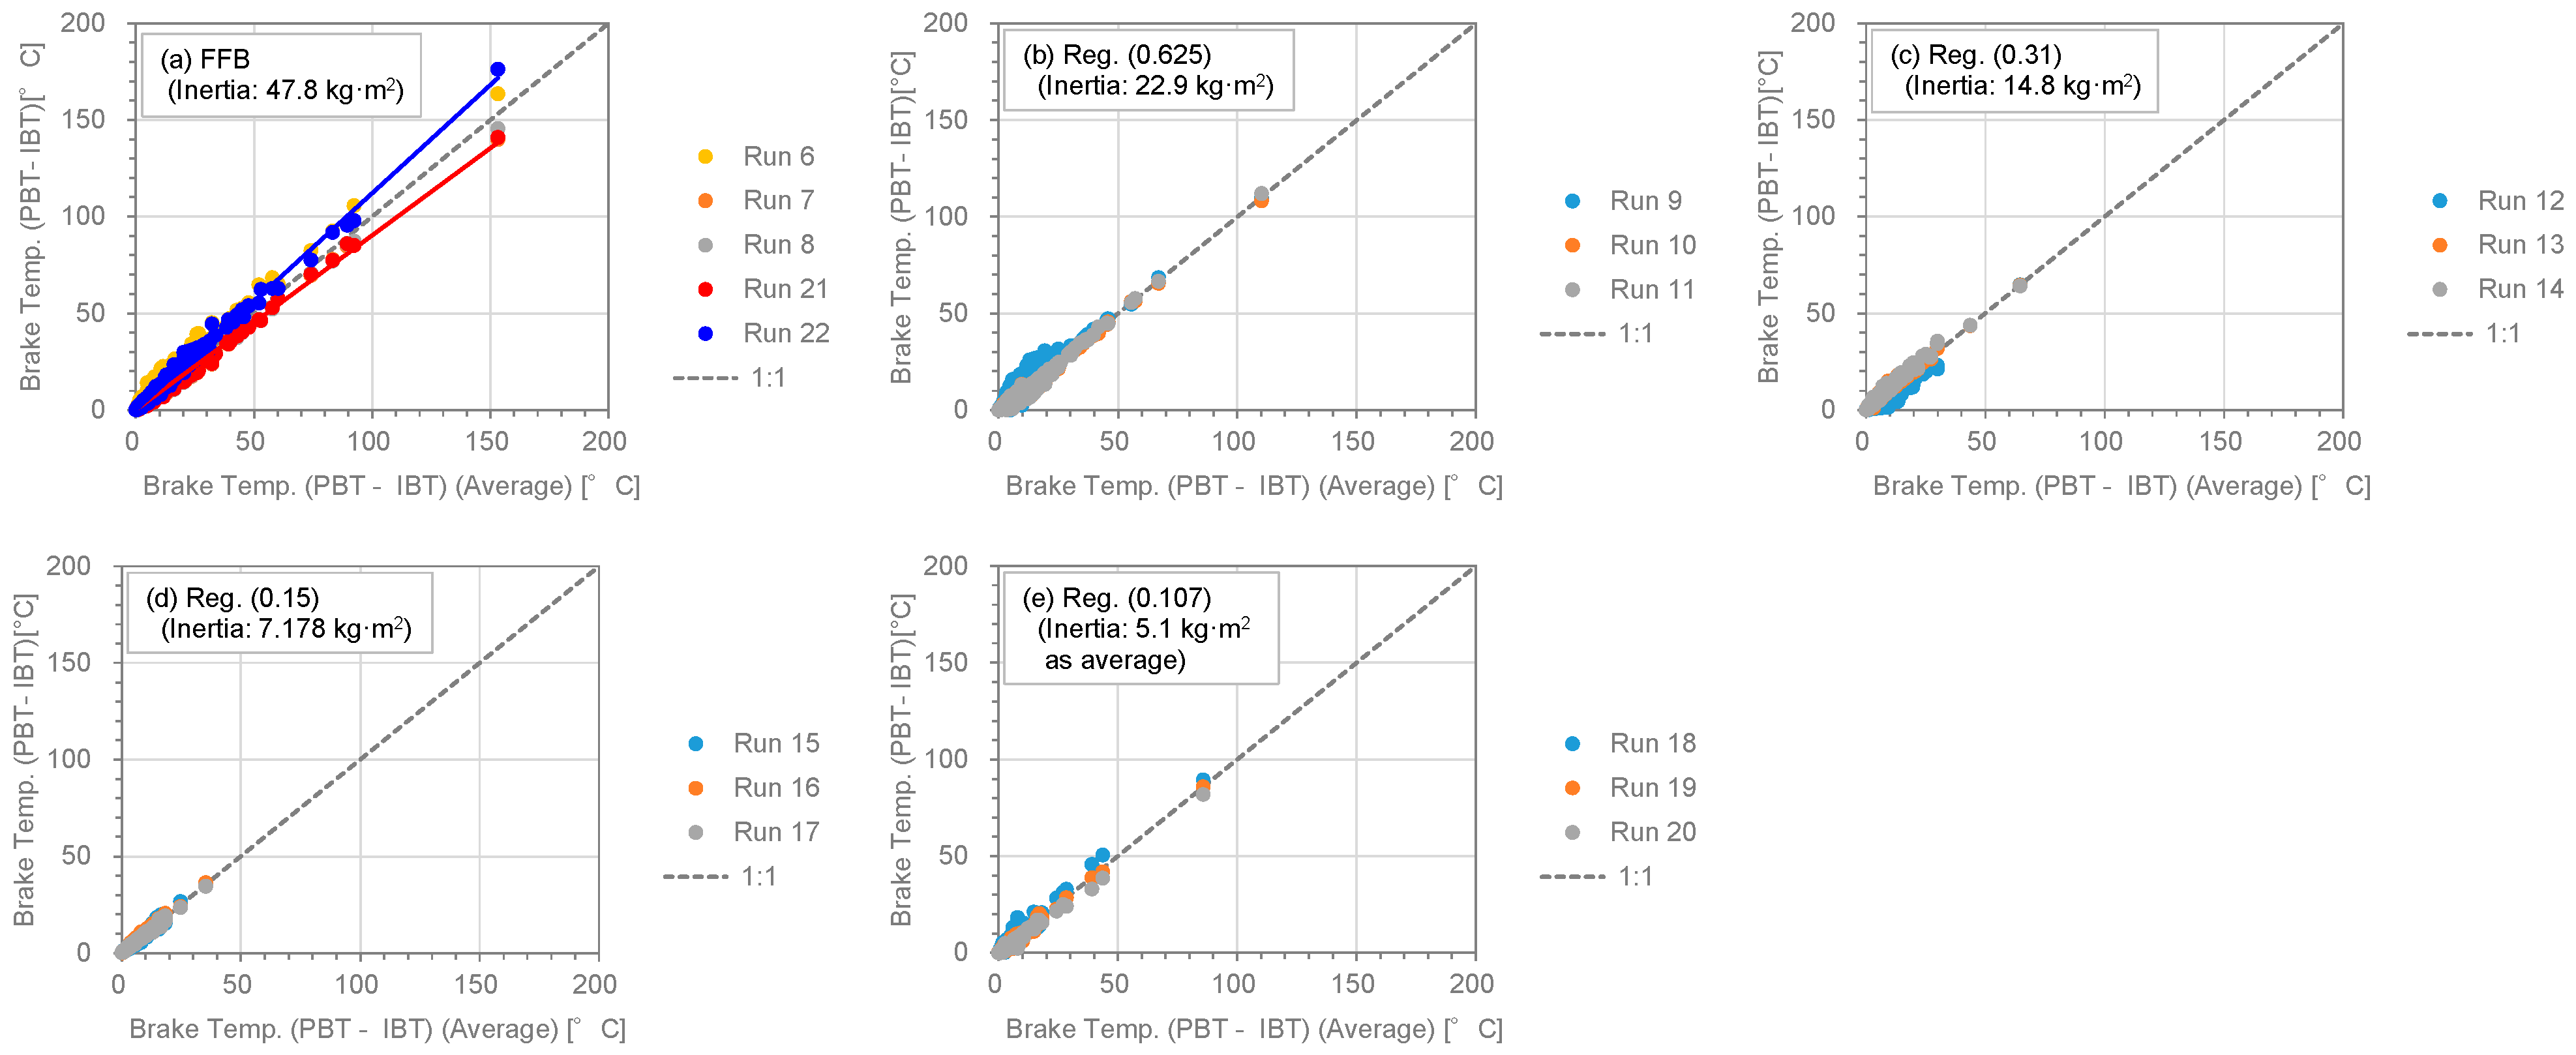
3.1.3. Brake Temperatures

Disc brakes are used to decelerate a vehicle. The pads press against the disc to reduce its rotation. During this process, it is generally known that the friction brake applies a friction force to convert the kinetic energy of the vehicle into thermal energy, which then dissipates into the atmosphere. Because the kinetic energy applied to the friction brake (friction work) is correlated with the brake temperature, the friction work and brake temperature were strictly defined during the development of the GTR24. Furthermore, because brake wear particle emissions are sensitive to brake temperature in some brakes [23], a method has been proposed to adjust the rate of air flow to keep the brake temperature at the time of testing within a specified temperature range based on the brake temperature (disc temperature) calculated from actual measurements by the actual vehicle so that similar measurements can be obtained at different installations. In this study, the nominal front Wheel Load/Disc Mass (WLn-f/DM) ratio was 110 for FFB, the average Trip 10 temperature was 79 °C, the Averaged Initial Brake Temperature (IBT) was 90 °C, and the Averaged Final Brake Temperature (FBT) was 148 °C as shown in Figure 5. These temperatures were within the respective specified values (Trip 10 Average ≥65 °C, IBT 95 ± 25 °C, FBT 150 ± 35 °C). Reg. (0.625) assumes a regenerative-friction coordinated brake and therefore WL/DM 69, which is in the brake temperature range specified by WL/DM 65–85 of the FFB. Reg. (0.31) is WL/DM = 34, Reg. (0.15) is WL/DM = 17, and Reg. (0.107) is WL/DM = 12, all of which are below the brake temperature specified by WL/DM ≤ 45 of the FFB. Because there is no definition of the brake temperature for small vehicles with WL/DM ≤ 45 in the GTR24, the rate of air flow of 4.1 m3/min (246 m3/h), the air flow rate set in this study, must be reduced to achieve a higher brake temperature.
As a quality criterion for brake temperature reproducibility against brake work controlled by the brake dynamometer, Figure 6 plots the brake temperatures measured in brake events #1–303 against the average temperature for each condition. The temperature difference between peak braking (PBT) and initial braking (IBT) confirmed that the brake temperature increased with the energy given to the brake. The fact that both controls plotted around a 1:1 straight line indicated that the brake temperature was highly reproducible. In contrast to the very small variation in the Friction Work shown in Figure 3, a maximum difference of 35 °C was observed for the FFB shown in Figure 6. Even if friction work can be strictly controlled, this study showed that it is difficult to strictly reduce the variation in brake temperature.

3.2. Particle Emissions

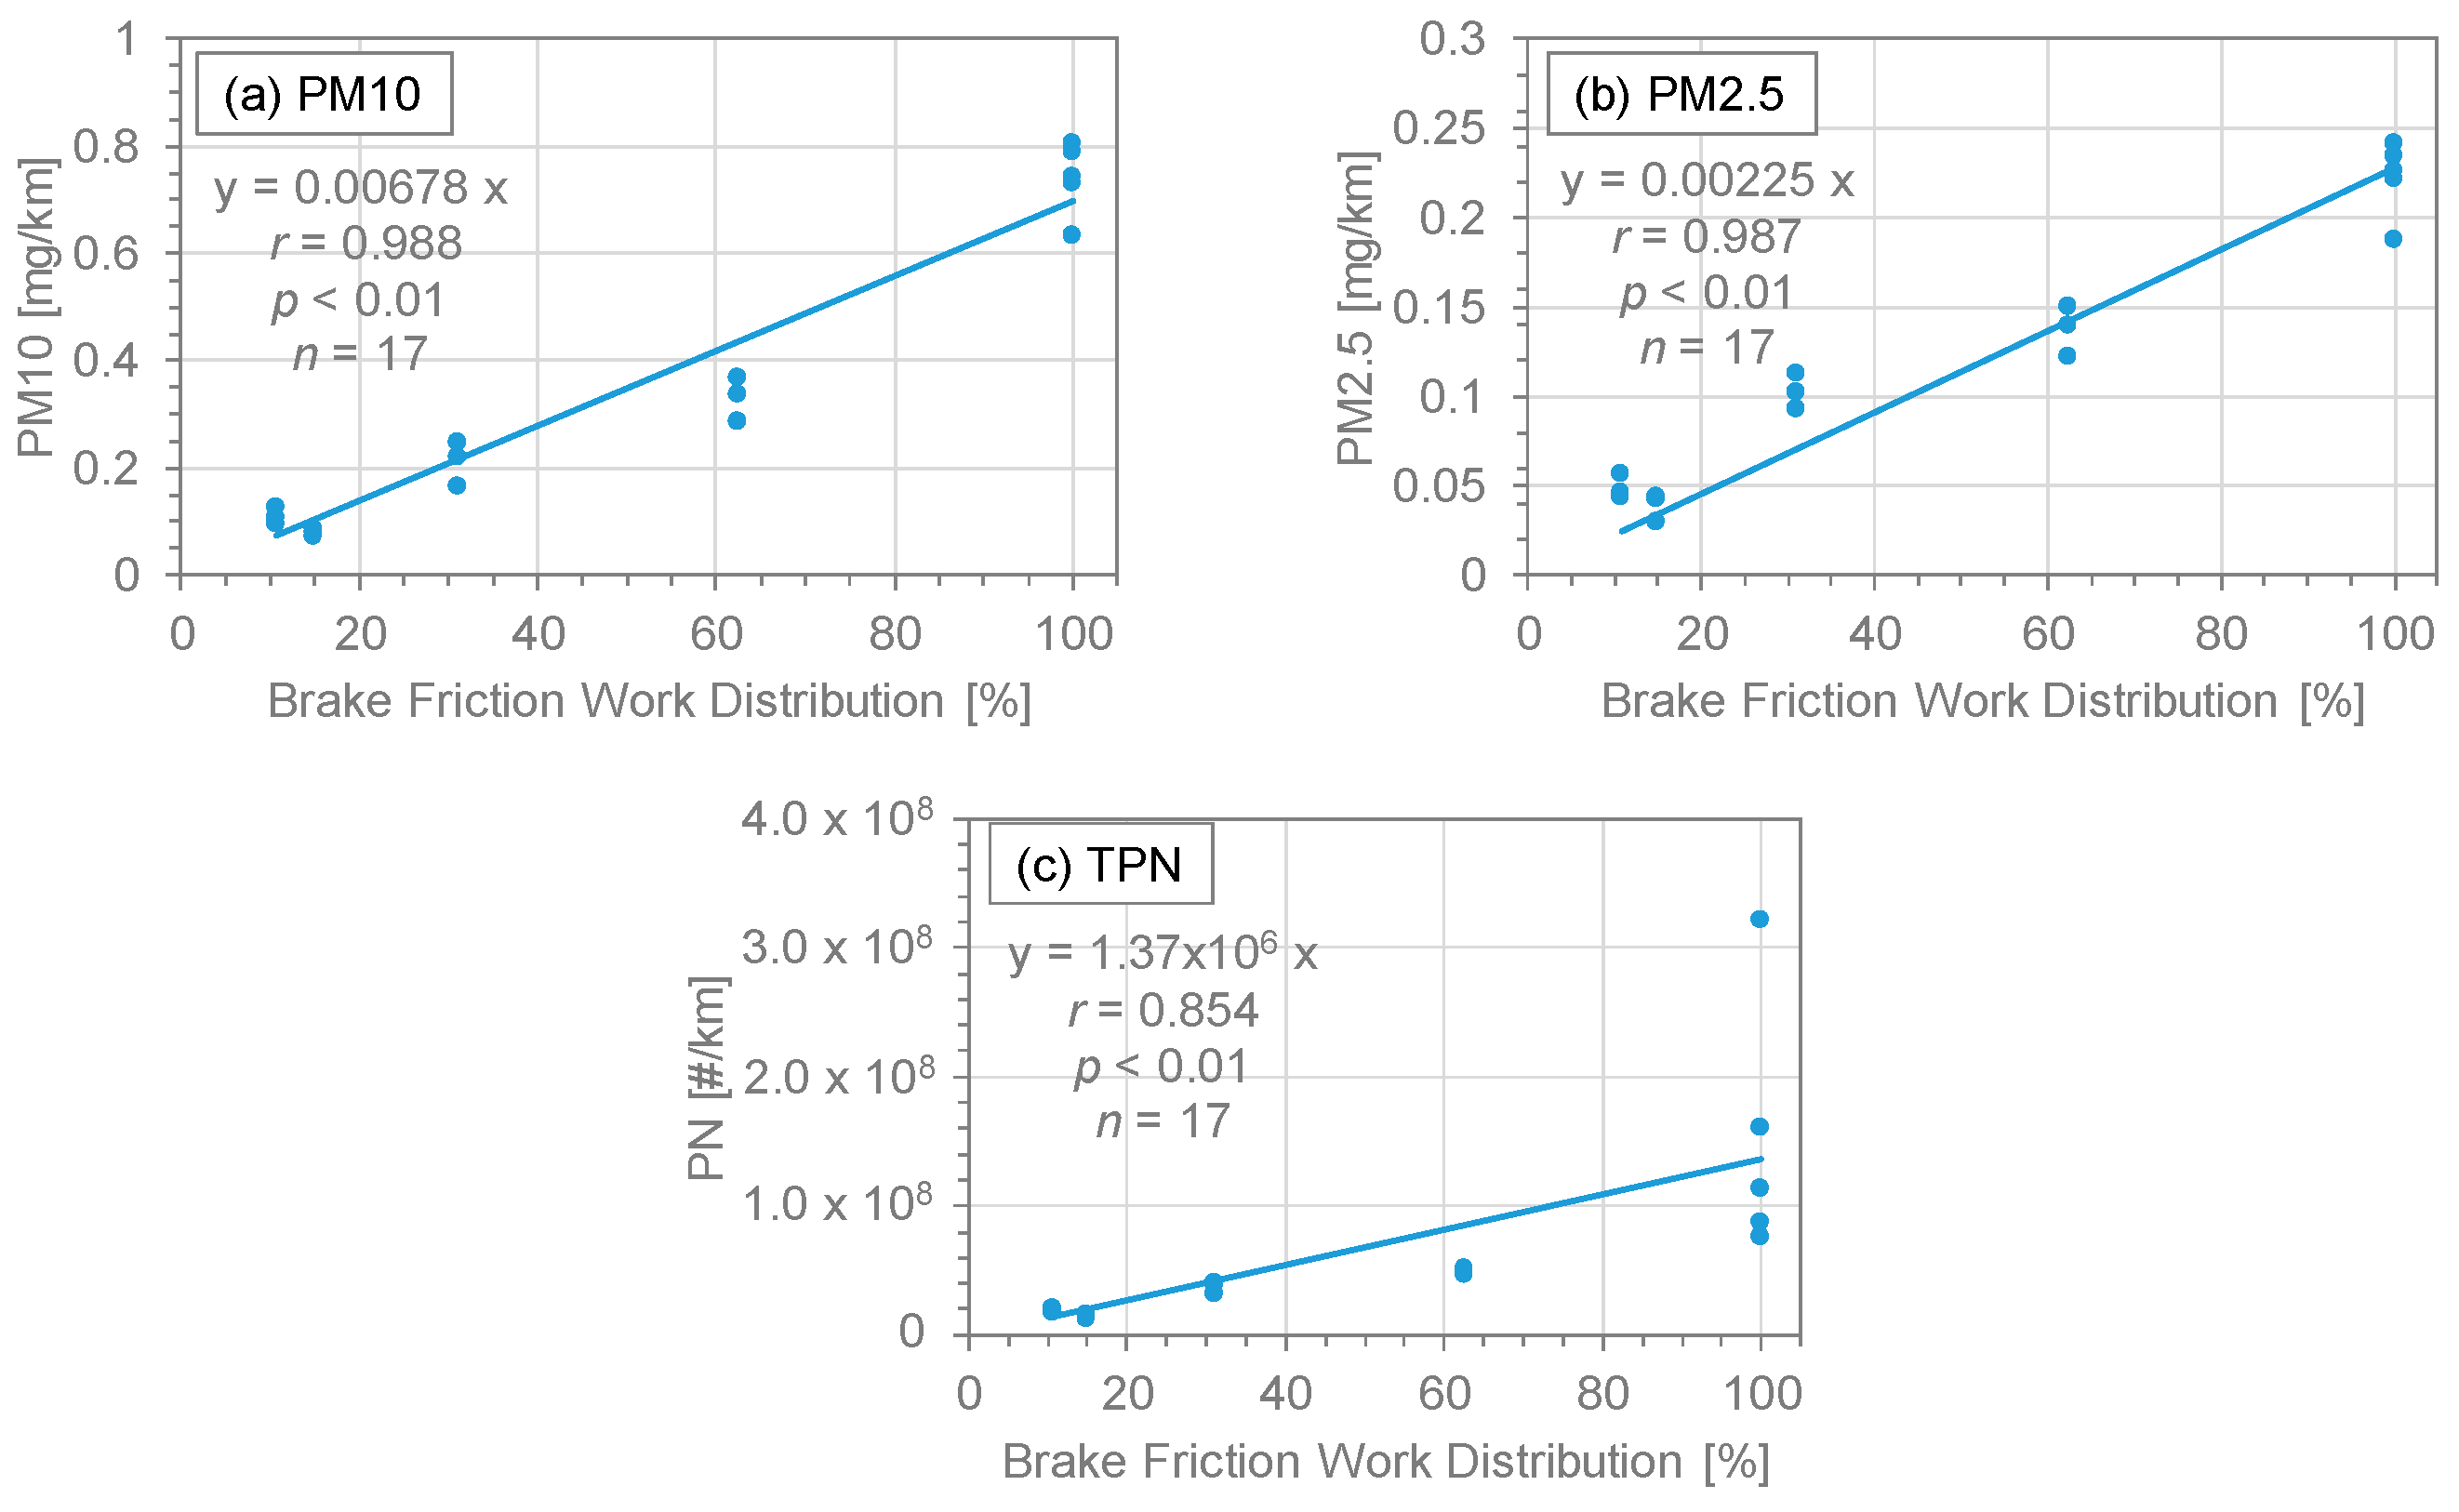
3.2.1. PM10, PM2.5, and TPN

Higher inertia due to increased wheel load during braking, not including regeneratively coordinated braking, requires a higher braking force, which also affects particle emissions. These brake wear particle emissions were investigated based on a stock component consisting of a cast iron brake disc and NAO brake pads. The emission behavior of an all-friction actuated NAO friction pairing (FFB) was compared against three regenerative-friction coordinated brakes of the same type (NOVC-HEV Cat. 1 (Reg. (0.625)), OVC-HEV (Reg. (0.31)), PEV (Reg. (0.15)), and friction torque distribution obtained from a real OVC-HEV vehicle (Reg. (0.107))). The emission factors of the front axle brake for PM10, PM2.5, and TPN are shown in Table A2.
Based on the GTR at the time of this experiment, we calculated the brake wear particle emission factor for electrified vehicles from the emission factor of FFB vehicles using the so-called friction brake share coefficients [11]. A coefficient of 0.63 is specified for hybrid electric vehicles (HEVs, NOVC-HEV Cat. 1), 0.3 for plug-in hybrid electric vehicles (PHEVs, OVC-HEV), and 0.15 for fully electrified vehicles (PEV). Scatter plots of the PM10, PM2.5, and TPN emission factors versus the distribution of brake friction work, measured for each regenerative braking condition in this experiment, are shown in Figure 7. In this experiment, although there was little variation in the frictional work (Figure 3) and brake temperature (Figure 6) measured for each distribution of brake friction work, there was a linear correlation for PM10 and PM2.5 and a curvilinear correlation for PN. For PM10, the brake wear particle emission factor for electrified vehicles according to GTR, calculated from the emission factor for FFB vehicles using the friction brake sharing coefficient, seemed to provide reasonable results. However, in the FFB conditions of the TPN, there was much variation because of the unstable condition of the pad surfaces of the electric vehicle brakes (which were not designed for high braking temperatures) measured under FFB conditions or because of insufficient bedding, which resulted in unstable measurements.
When we compared the results (average of n = 3) measured for PHEVs (OVC-HEVs) using the real-time friction brake share (Reg. 0.107) and GTR24 vehicle-specific friction brake share coefficients (Reg. 0.31) based on actual vehicles, we found that PM10 (0.11 mg/km and 0.21 mg/km), PM2.5 (0.05 mg/km and 0.1 mg/km), and TPN (1.9 × 10⁷ #/km and 3.7 × 10⁷ #/km) all had lower friction brake share factors (Reg. 0.107) based on actual vehicles. These results indicate the need for vehicle-specific friction brake share coefficients, a conclusion consistent with a previous study [13]. Using electrified vehicle brakes as FFBs and a single coefficient for each group does not allow for fair brake-wear particle measurements, especially fair PN measurements. In other words, the PN measurement may significantly overestimate emissions if conducted purely on the basis of friction braking. The appropriate approach is therefore to determine the actual emission factors using the vehicle-specific factors being developed for the GTR24 update.
As discussed above, it is possible that the results of the measurement of particle emissions from the brakes of electrified vehicles under FFB conditions are an overestimation. Nevertheless, the reduction rate of brake wear particles due to the effect of regenerative braking was evaluated as in previous studies [13,14,15] for reference purposes.
For the HEVs, PHEVs, PEVs, and vehicle-based friction brake PHEVs simulated in the series of evaluations in this study, the PM10 emission factors compared with FFB were about 55% (HEVs, Reg. (0.625)), about 72% (PHEVs, Reg. (0.31)), about 89% (PEVs, Reg. (0.15)), and approximately 85% (vehicle-based PHEV, Reg. (0.107)). The PM2.5 emission factors compared with FFB were reduced by approximately 38% (HEV, Reg. 0.625), 54% (PHEV, Reg. 0.31), 83% (PEV, Reg. 0.15), and 78% (vehicle-based PHEV, Reg. 0.107). Results of previous studies have shown in Table 1 that under WLTP braking cycle conditions, PHEV regeneration reduces PM10 by about 62%, and BEV regeneration reduces PM10 by up to 79% [13]. Because these percentages are comparable in magnitude, our results imply that a reduction in friction brake work leads to a reduction in brake-wear PMs.
To explain our experimental results, we have compared in Table 1 the experimentally measured emission factors of brake-wear particle mass for only regenerative coordinated braking. Although we used the same test brake assembly used in a previous study [24] and although the driving cycle was very different from the WLTP brake cycle, the PM10 emission factors per vehicle compared with FFB were comparable in the present study and the previous study, 1.92 mg/km per vehicle and 2 mg/km, respectively. A comparison of the rates of reduction of PM10 and PM2.5 shown in Table 1 with regenerative-friction brake coordination systems revealed that the rate of reduction of PM10 was higher than that of PM2.5 in both the previous study [13] and our results. This difference could be due to the reduction of friction brake work, which would lead to less abrasive wear and therefore fewer coarse particles.
The TPN emission factors compared with FFB were reduced by about 67% (HEV, Reg. 0.625), 76% (PHEV, Reg. 0.31), 91% (PEV, Reg. 0.15), and 87% (vehicle-based PHEV, Reg. 0.107). When PEV vehicles are driven on real roads, the results have shown that a brake friction work reduction of 87.7% compared with FFB can be achieved, with an 89.8% reduction of PN with particle sizes of 4 nm to 3 mm [14]. A comparison of brake particle emissions on an indoor chassis dynamometer using HEV and PEV vehicles has shown that PEVs have the potential to reduce brake-wear particle emissions by 50% in terms of PN (PN > 23 nm) [15]. The results measured using these vehicles also support the expectation that a reduction in brake friction work reduces PN emissions.
For electric vehicles other than those described above, for a wide variety of brake sizes and friction materials, a definitive clarification—a map of friction torque and emissions over the entire WLTP-Brake driving conditions—has not yet been reached and needs to be clarified by future research.

3.2.2. Mass Loss

Mass Loss measurements were carried out using a comparable procedure wherein the Interlaboratory Study (ILS) results could be benchmarked only in FFB conditions to allow a sufficient measurement of wear mass. Bedding was performed with five WLTP-Brake Cycles to homogenize the surface of the new brake pads and three WLTP-Brake Cycles for brake-wear particle measurements, for a total of eight WLTP-Brake Cycle results. The observed Mass Loss was 1.6286 g for the pad (Inner), 1.6165 g for the pad (Outer), and 1.329 g for the disc, for a total of 4.574 g. Brake wear particles are known to originate from disc wear as well as brake pads, and in this study, disc wear contributed 29% to the overall wear. Mass Loss as a coefficient of wear was 2.98 mg/km per brake. A comparison of the results of this study with the benchmark of the previous ILS study revealed higher emissions for the NAO brake (6.5 ± 0.9 mg/km per brake) [8] than we obtained in this study. The NAO was developed to optimize comfort (reduced noise and rim contamination), and this study and previous studies [8,13] have found a common result: less brake disc wear compared with ECE brake pads. However, this study found that NAOs with a higher coefficient of wear also exist, although this comparison is based on different test vehicle masses and brake assemblies (this study: 47.8 kg·m2 applied inertia, tire dynamic load radius of 305 mm; ILS: 49.3 kg·m2 applied inertia, tire dynamic load radius of 315 mm). Further systematic research studies might help to explain the significant differences in the wear factors between NAOs.
We observed a PM10-to-Mass Loss ratio of 25% with the sampling method that we used in this study. In contrast to that result, a comparison of the results of the previous studies by the author, who both used the same friction material, showed that the PM10 of Vehicle II was 29% [25] comparable to the 25% observed in this study, although the test vehicle (mass 1240 kg, tire dynamic rolling radius 298 mm, 80% brake front-rear distribution), braking system, and driving conditions (JC08) were very different. However, these results showed a slightly lower detection than those of ILS [8], which reported that the average PM10 to Mass Loss ratio for disc brake systems was 35–49%. The fact that the average PM10/Mass Loss ratio for disc brake systems in the ILS [8] ranged from 35% to 49% suggested that the brake systems used in this study were lost for other reasons, such as adhesion to the calipers or scrub remaining on the pad surface during adhesive wear. It is therefore reasonable to assume that the PM10 to Mass Loss is not 100% and that the ratio varies as a function of the friction material, disc material and structure, and caliper structure.

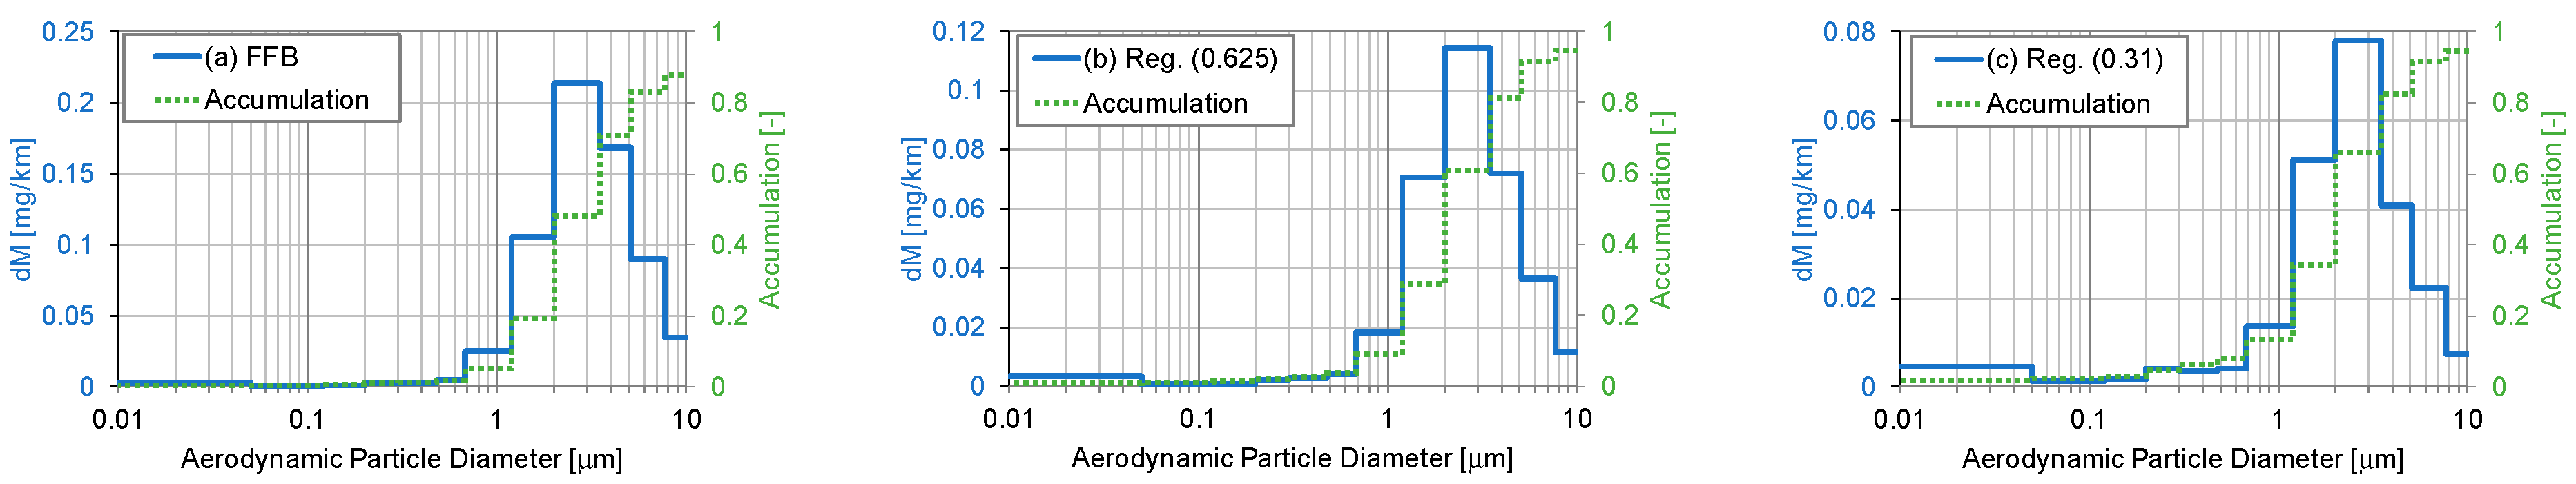
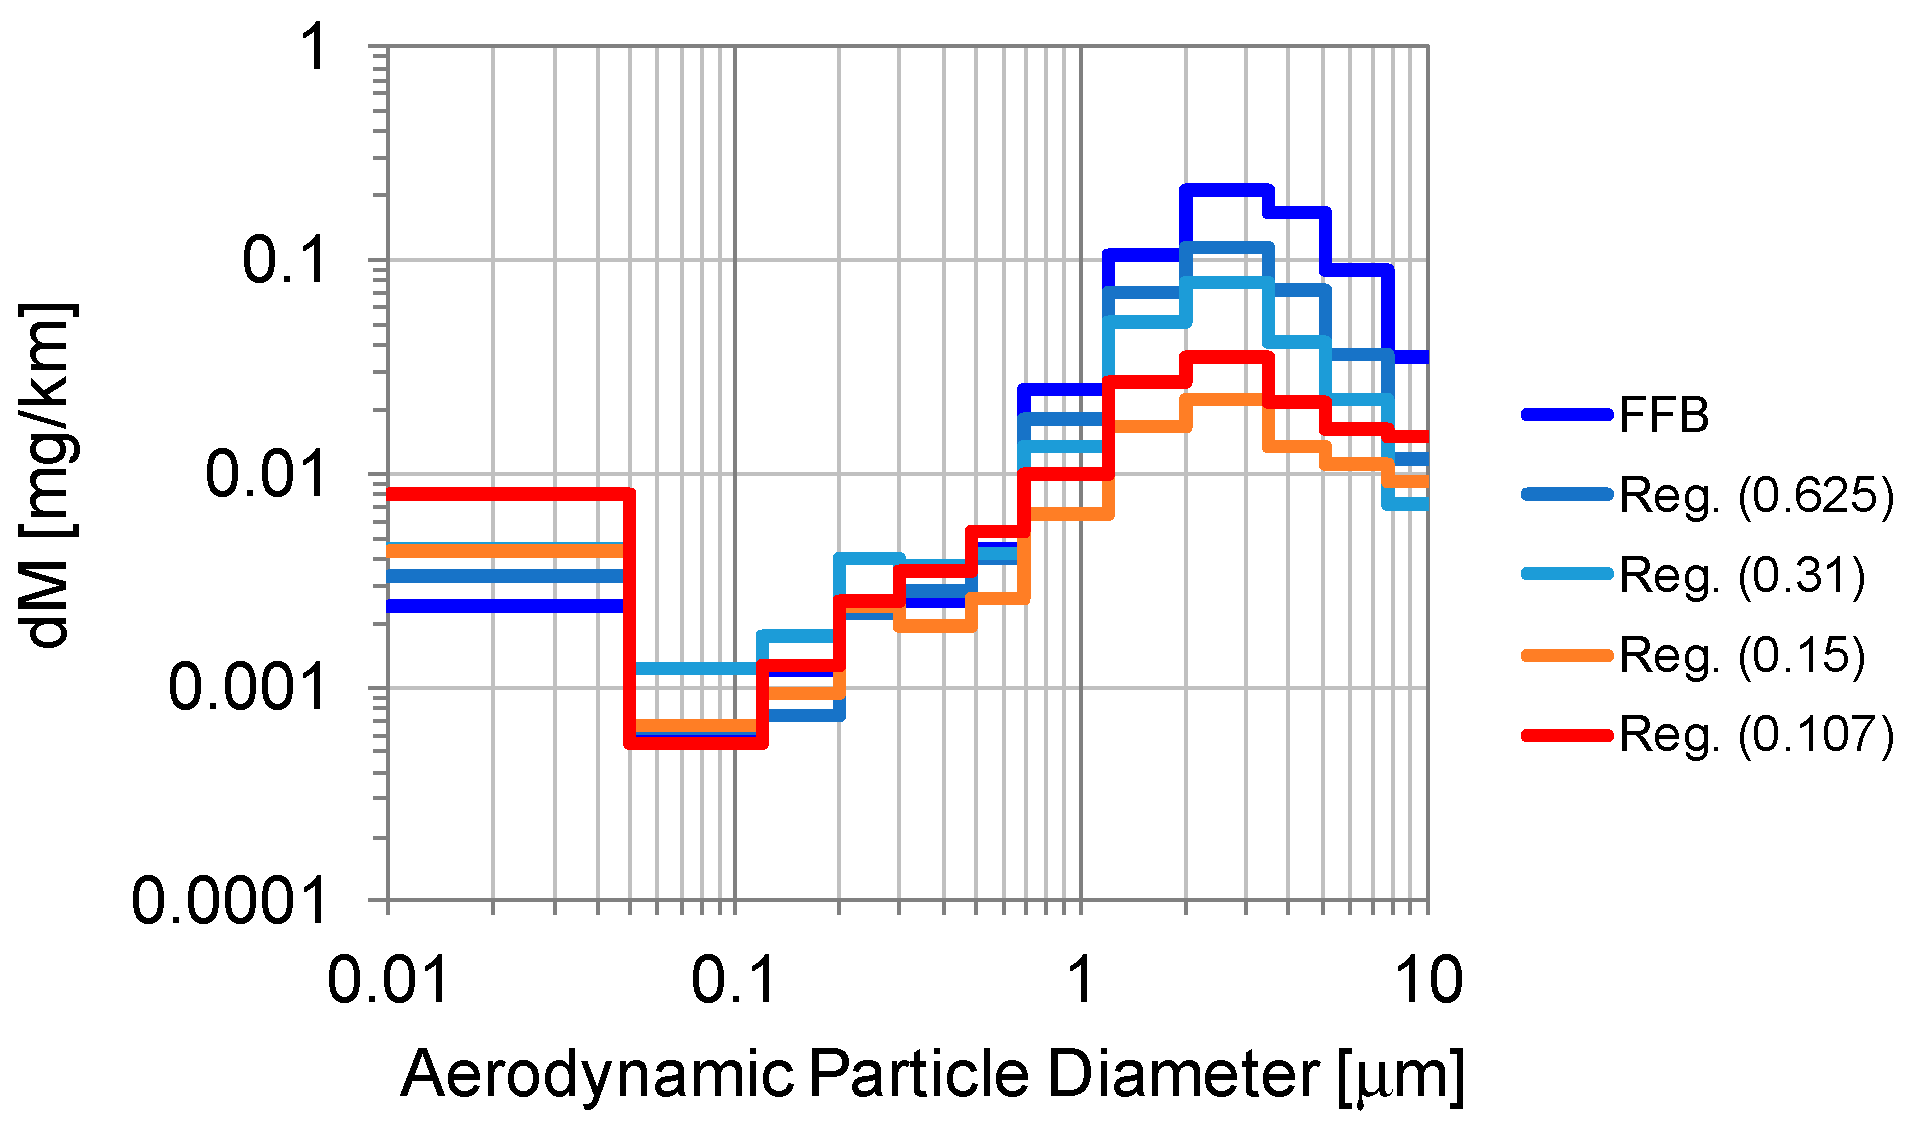
3.2.3. Masses versus Sizes of Aerodynamic Particles

It is important to have an insight into the distribution of emitted particle sizes in terms of emissions to the atmosphere as well as in terms of health effects. In this study, we measured the emissions of particle masses according to their aerodynamic particle diameters by LPI, and the results are shown in Figure 8 and Figure A2. The emissions were distributed in the mode diameter of 2–3 mm under all conditions. This means that there is uncertainty in the PM2.5 measurement because of the sharpness of the separation characteristic curve when measuring PM2.5. In this study, PM2.5 was measured using cyclones based on GTR24 and a sharp-cut cyclone, which have been evaluated as equivalent methods to the WINDS impactor in terms of PM2.5 separation characteristics [26].
The PM2.5 and PM10 emission ratios provided some understanding of the distribution of PM emissions from different brakes with respect to the fine and coarse particulate fractions and implied possible measurement uncertainties [8]. We therefore compared the emission ratios (PM2.5/PM10) measured by cyclones in this study. The PM2.5/PM10 emission ratios measured by cyclones were 30% for FFB, 42% for Reg. (0.625), 49% for Reg. (0.31), 48% for Reg. (0.15), and 48% for Reg. (0.107). The PM2/PM11 emission ratios based on LPI specifications were 22% for FFB, 30% for Reg. (0.625), 36% for Reg. (0.31), 39% for Reg. (0.15), and 40% for Reg. (0.107). The similarities between the cyclone and LPI ratios were consistent with the trend towards lower PM2.5/PM10 ratios with regenerative braking control. The PM2.5/PM10 ratios of 37–45% for the disc brake under FFB conditions in the ILS [8] were slightly higher than the ratios in this study (30% for FFB condition). The suggestion was that more coarse particles were observed in this study, or that the measurement was more efficient and that there were fewer coarse particles during collection.
The effect of regenerative braking control on the change in particle size, based on the PM2.5/PM10 emission ratio, was likely due to a decrease in coarse-particle emissions because of reduced abrasive wear. The remaining emission of fine particles led to an increase in the ratio. A comparison of the finer nanoparticles (PM0.12 based on LPI specifications) against PM11 showed that the emission ratio was 0.5% (0.003 mg/km) for FFB, 1.2% (0.004 mg/km) for Reg. (0.625), 2.5% (0.006 mg/km) for Reg. (0.31), and 5.4% (0.005 mg/km) for Reg. (0.15) and 5.8% (0.008 mg/km) for Reg. (107). For the brakes investigated in this study, the contributions of nanoparticles to the overall PM emissions were small. However, this study observed that the contributions of nanoparticle emissions remained or increased slightly as the friction brake ratio was reduced because of regenerative braking control. We considered that this was due to a reduction in the number of large particles, which could be due to abrasive wear, the suppression of nanoparticle agglomeration, or the fact that fine scrub particles remain on the surface layer and lose their effectiveness in cleaning the pad and disc surfaces as they wear away.

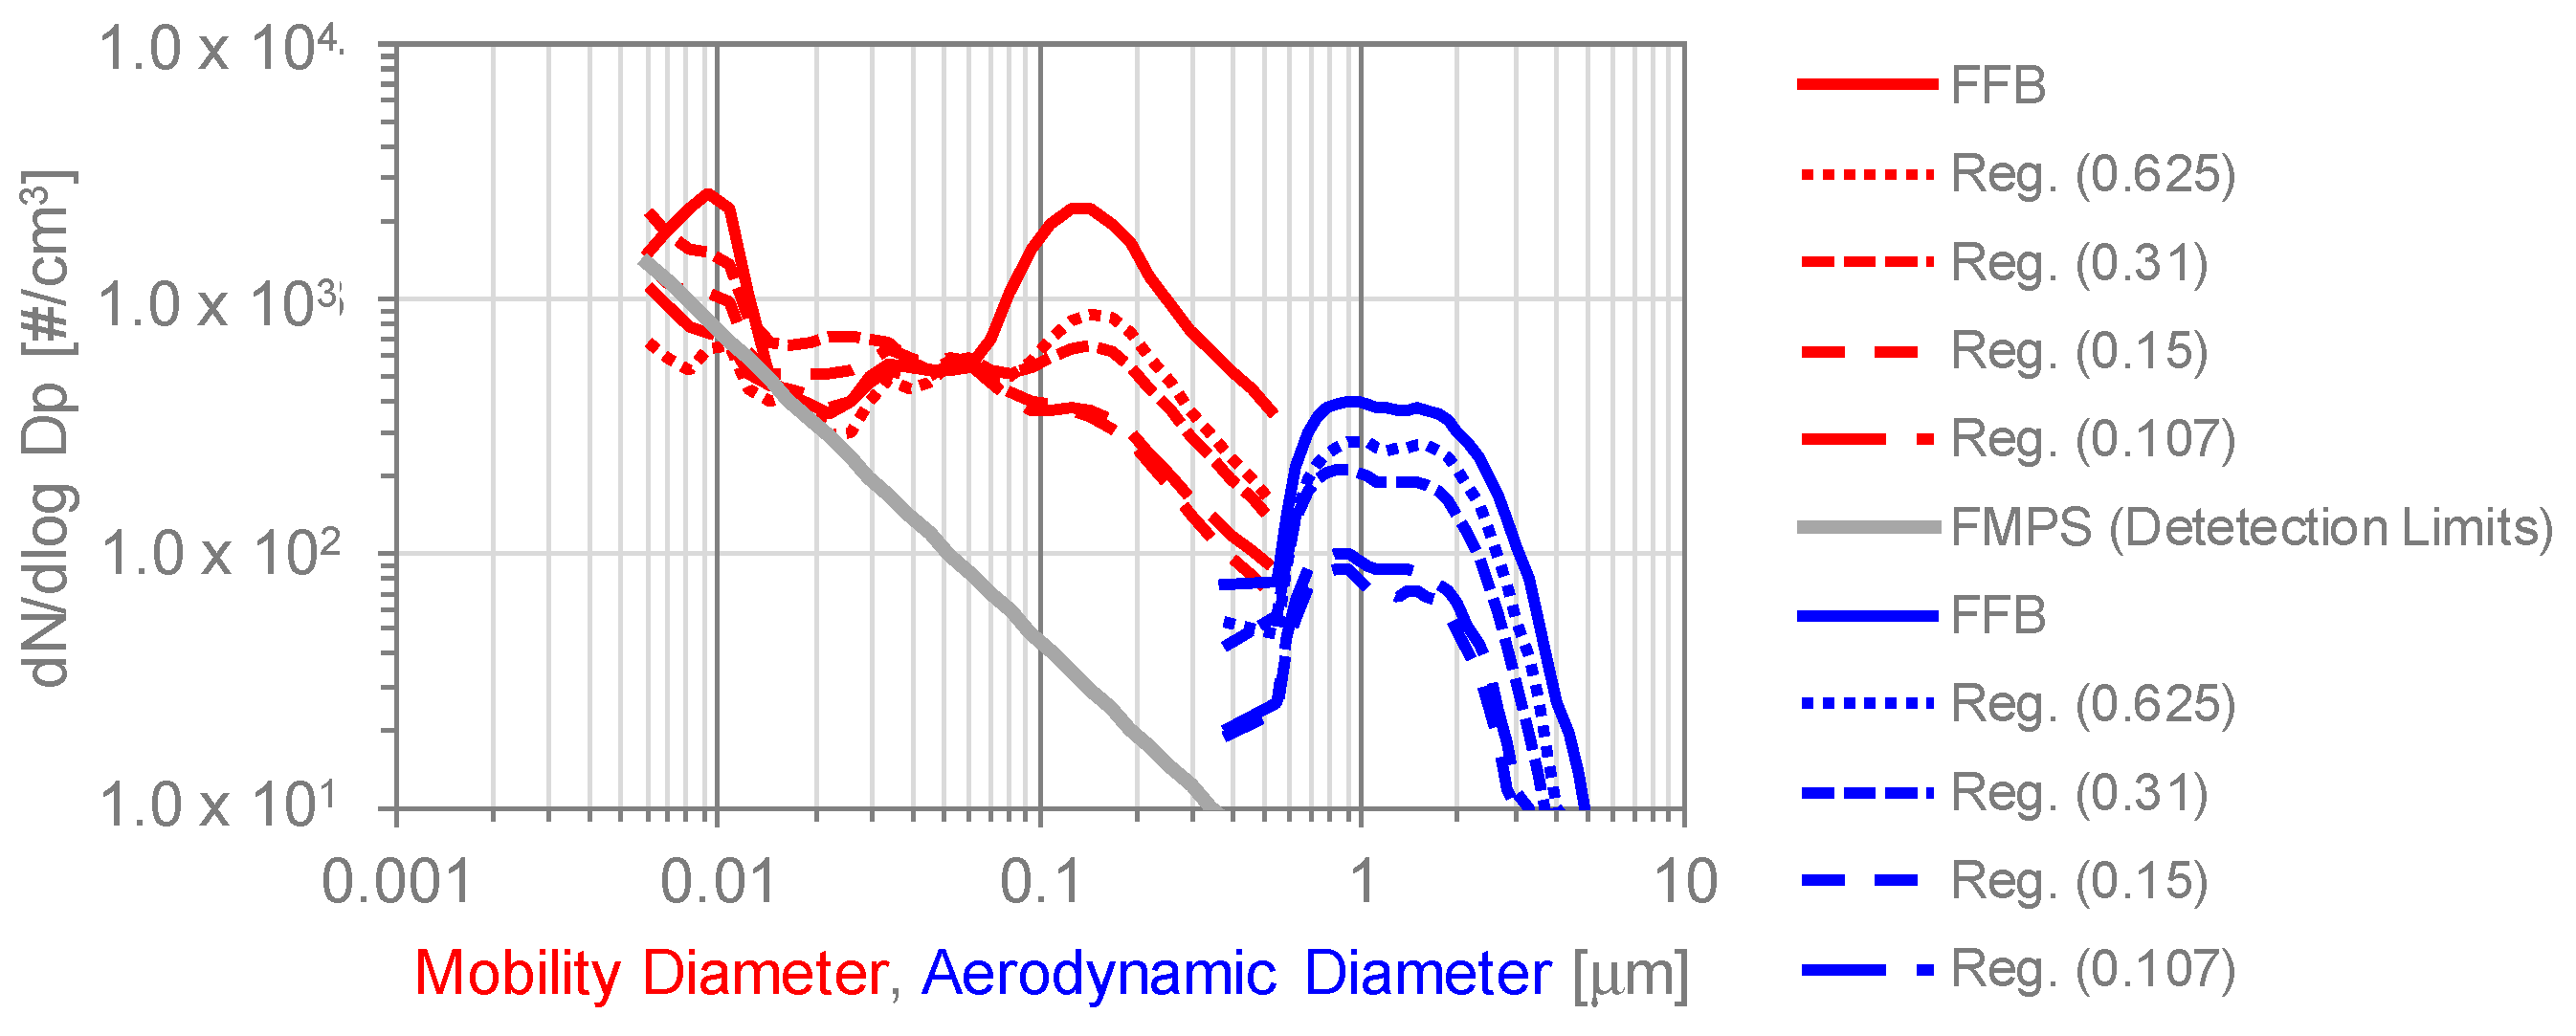
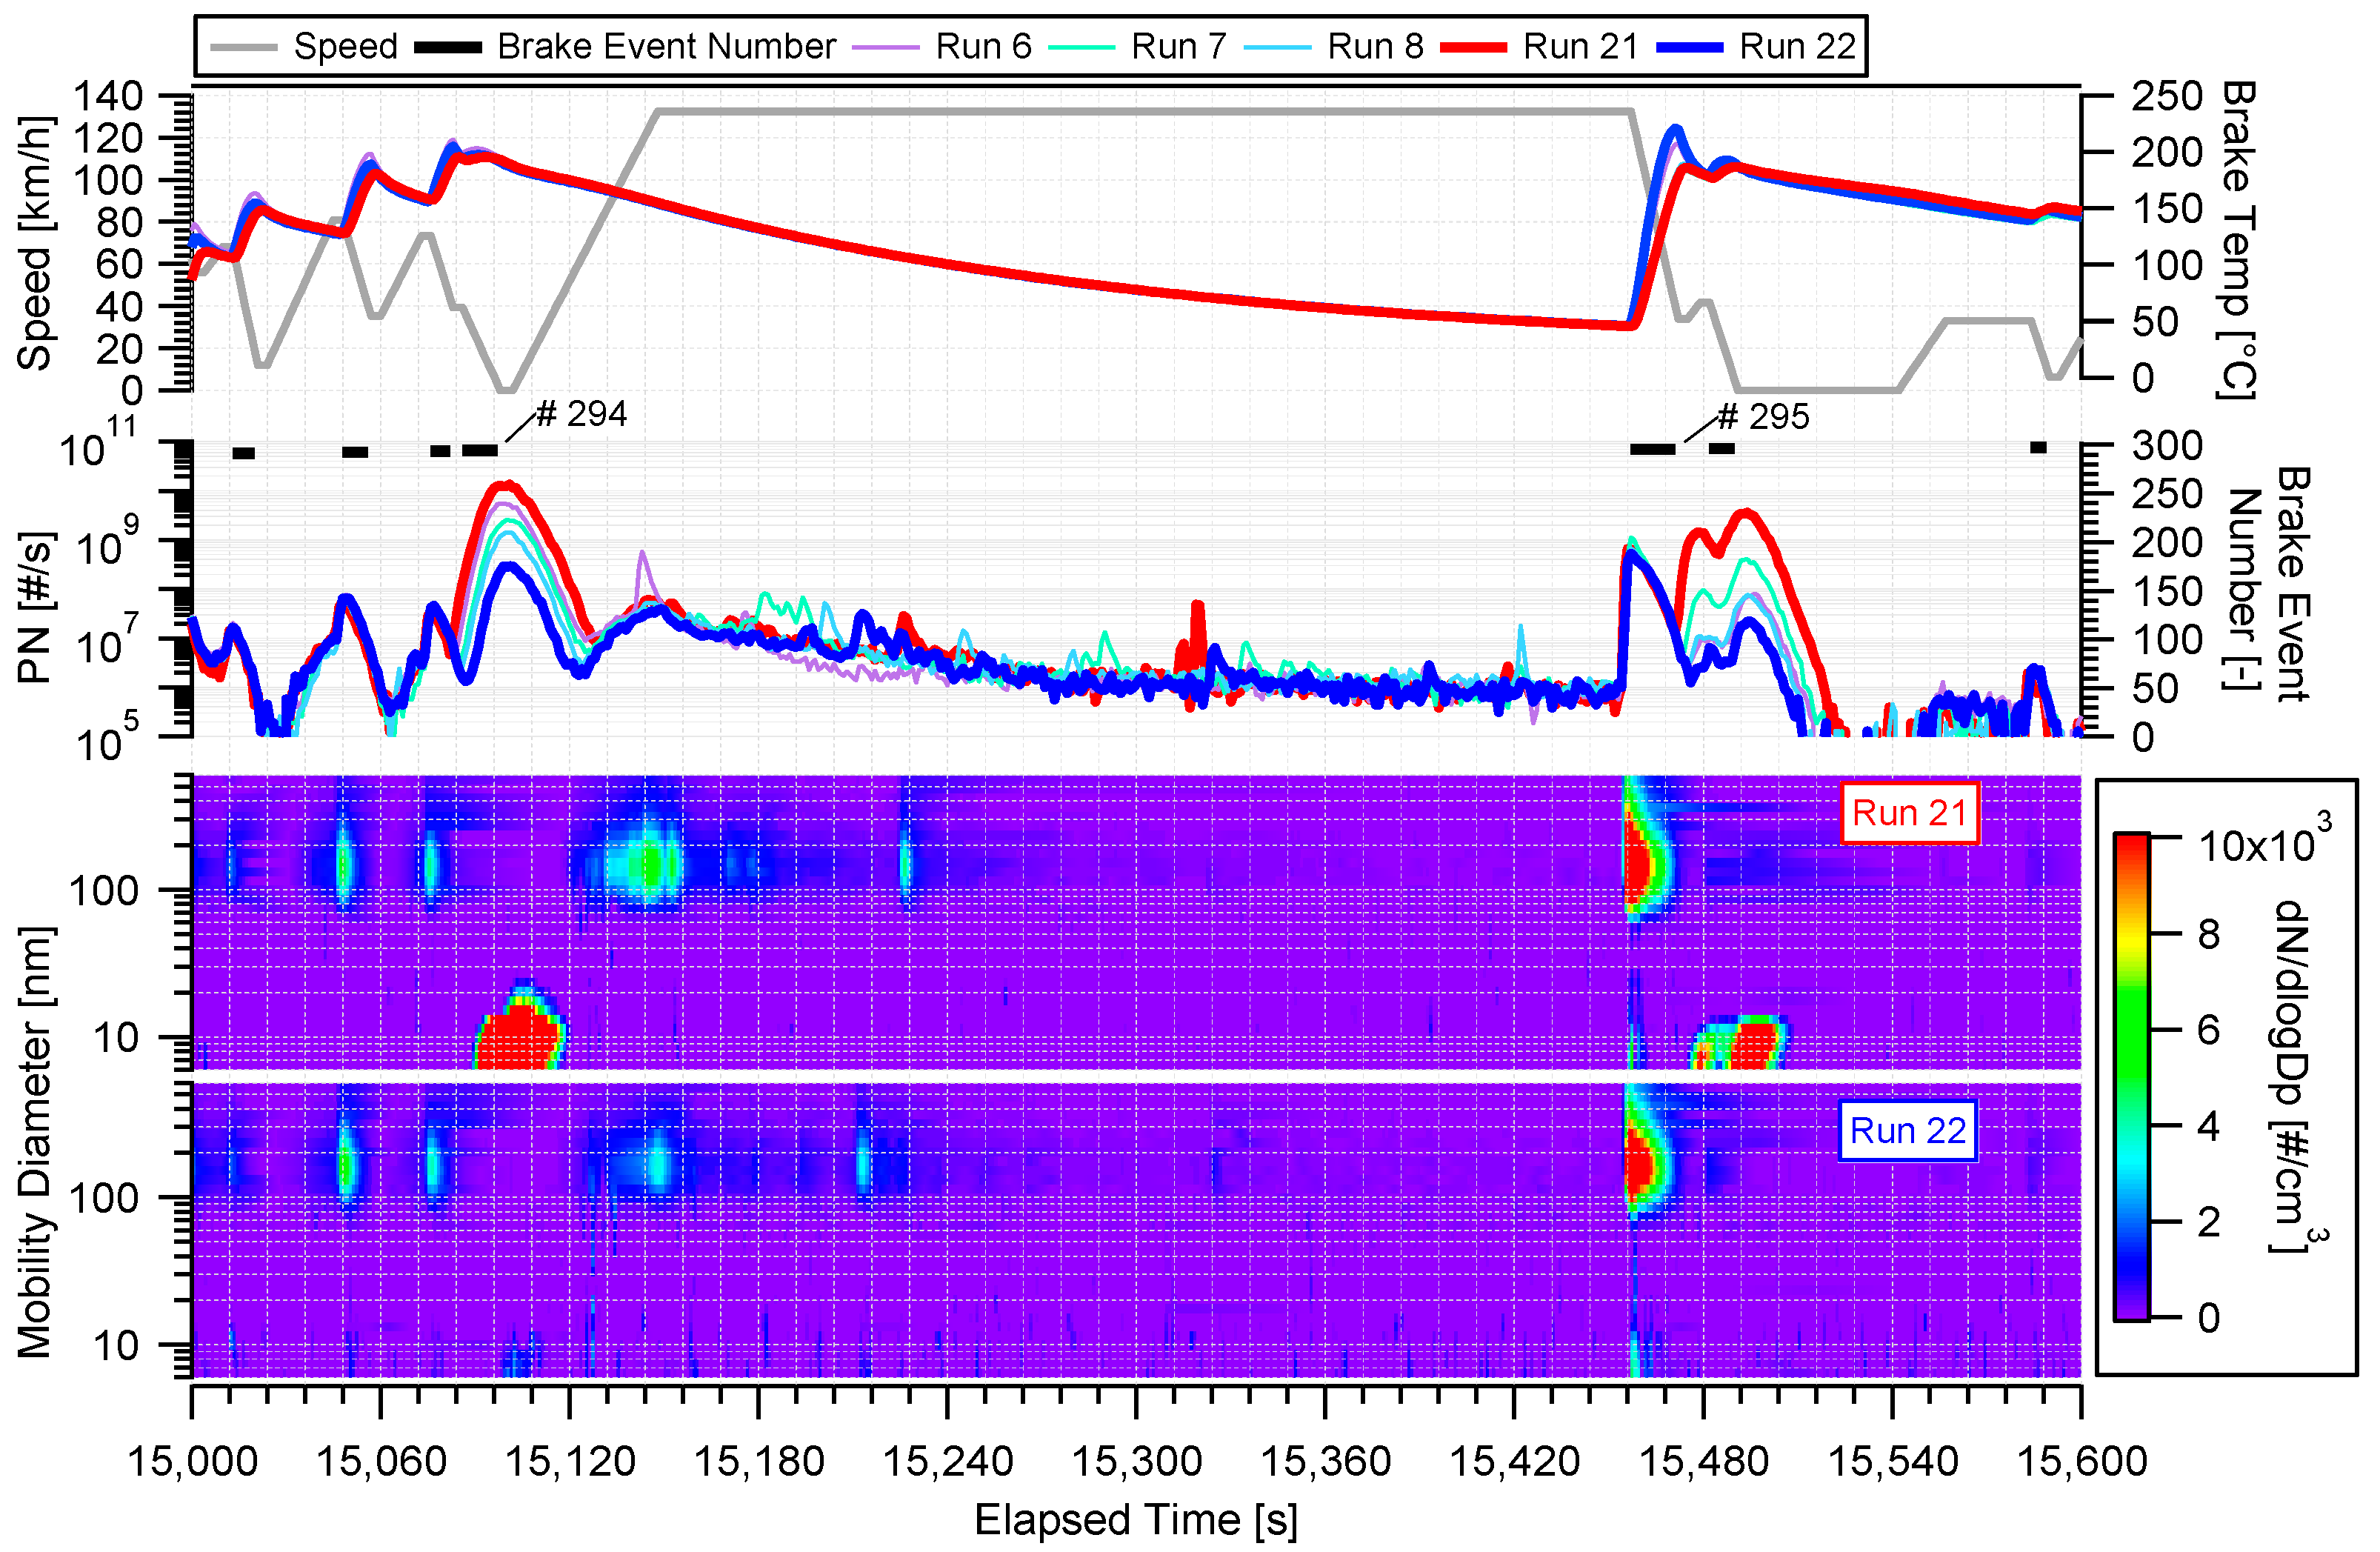
3.2.4. Particle Number–Size Distributions

In urban environments, the concentrations of PN particles characterized as ultrafine particles with a particle size of 100 nm or less are emitted mainly from combustion burning processes and the formation of new particles. The formation of new particles in the atmosphere results in high particle-number concentrations in the nucleation and Aitken modes (0–20 nm and 20–100 nm). This process is particularly important in areas with advanced photochemical smog (urban, industrial, and rural areas) [27]. Although there is considerable evidence that ultrafine particles contribute to the health effects of PM, data on concentration-response functions for ultrafine particles (measured by numbers of particles) are scarce and insufficient to evaluate and recommend air quality guidelines. It is noteworthy that current efforts to reduce the number of ultrafine particles in exhausts should be continued, and given the potential health impacts, their effectiveness should be assessed [27,28]. Based on this background, this study characterized the particle number–size distribution.
Figure 9 and Figure A3 show the average distribution of nanoparticle sizes for brake events as a function of their mobility particle diameter (particle size range 0.006–0.5 μm) and coarse particles as a function of their aerodynamic particle diameter (particle size range 0.3 to 20 μm). The mode diameter was ~120 nm for the mobility particle diameter and 1–2 μm for the aerodynamic particle diameter, regardless of the test conditions. It is apparent that the brake-wear particles contained fine particles. In general, detectors that sense charged particles based on the values of electrical currents are called electrometers in FMPS and other instruments, and they are generally known to be quantitative when they detect concentrations of 103 #/cm3 or higher. If the particle size is above the line of the minimum signal value that the FMPS 3091 instrument is capable of detecting, then the particle is considered to be detected. For the FFB condition in Figure A3, nuclei-mode particles with diameters of 20 nm or less were detected. Compared with regenerative-friction cooperative brake conditions (Figure A3), the smaller friction brake distribution tended to shift the particle concentration slightly toward smaller particle sizes, with fewer numbers of particles near 120 nm in the mobility particle size range. However, it was difficult to determine whether nuclei-mode particles were detected because of their low concentrations. To clarify the particle size distribution for emissions of brake-wear particles at low concentrations, continuous research on measurement methods is needed, such as comparative measurements using CPCs with different minimum measurable particle sizes (i.e., cut-off diameter) or direct measurements to verify the sample concentration.
Figure 10 shows the time profiles of the particle size distribution measured by FMPS for Run 21 and Run 22 as contour plots in order to investigate the emission pattern of particles in the nuclei-mode particle emissions in more detail. Run 21 had the highest PN emission, and Run 22 had the lowest PN emission among the FFB conditions (Runs 6, 7, 8, 21, and 22). Figure 10 shows the interval from 15,000 s to 15,600 s, which includes the brake event # with the highest emissions in the WLTP-Brake Cycle. High concentrations of nuclei-mode particles were emitted in brake events #294 (15,086 s) and #295 (15,457 s). The highest PN emissions in the entire WLTP-Brake were in Run 21; lower concentrations of nuclei-mode particles were observed in Run 22. We compared the brake temperatures because it is well known that higher brake temperatures lead to higher PN emissions. The brake temperatures of Runs 6, 7, 8, 21, and 22 were comparable. There was no significant difference in brake temperatures in this study, and the brake temperature in brake event #295 (15,457 s), where nuclei-mode particles were detected, was slightly lower for Run 21. Higher brake temperatures were observed for Run 22, for which there were fewer emissions. The fact that the time profile of PN was also in good agreement for Runs 6, 7, 8, 21, and 22 indicated that the PN concentration was amplified by the braking events in which nuclei-mode particles were detected. Friction film with adhesive properties on the pad surface and transfer film covering the disc surface were formed between the brake pad and disc. These compounds peeled off or underwent thermal decomposition because of the increasing temperature. This process caused the condensation of gaseous compounds, which likely resulted in the emission of nuclei-mode particles.
Because brake assemblies for electric vehicles are designed for the use of regenerative brakes, it is likely that nuclei-mode particles are emitted under high-temperature and high-load-braking conditions with FFB, as was the case in this study. The implication is that small-nuclei-mode particle emission events can amplify the PN measurements and thereby lead to reduced reproducibility of the number measurements. Relative standard deviations were observed under FFB conditions of 9% for PM10, 9% for PM2.5, and 66% for PN, reducing the reproducibility of the particle number measurements. In strict regulatory certification tests where measurement reproducibility and stability are required, it may be appropriate to measure PN under brake conditions that match the actual use of electric vehicles rather than under FFB conditions, or to select a measurement method that eliminates PN smaller than 20 nm [7], as is done in emissions measurements.

4. Conclusions

In this study, we investigated the emission of brake-wear particles from regenerative-friction brake coordination systems using dynamometer testing. The emission behavior of an all-friction actuated NAO friction pairing (FFB) was compared against four regenerative-friction coordinated brakes of the same type (NOVC-HEV Cat. 1 (0.625 of friction share coefficient), OVC-HEV (0.31), PEV (0.15), and friction torque distribution with 1-Hz resolution obtained from a real OVC-HEV vehicle (0.107 as average). The conclusions of this study were as follows.
  • As a quality criterion for the simulation of frictional work recovery on the brake dynamometer, we found that the frictional work measured in brake event #1-303 plotted near a 1:1 straight line for both controls against a target value, which was reached in this study.
  • Even if friction work can be strictly controlled, this study showed that it is difficult to strictly reduce the variation in brake temperature.
  • In the relationship between brake friction work and brake wear particle emissions, we observed that there was a linear correlation for PM10 and PM2.5 and a curvilinear correlation for PN.
  • Results based on laboratory experiments in this study, as well as results measured in several vehicle tests, support the hypothesis that reducing brake friction work reduces emissions of brake-wear particles. This study observed that the commercially available PHEVs investigated in this study reduced emissions by 85% for PM10, 78% for PM2.5, and 87% for PN, compared with internal combustion engine vehicles.
  • Aerodynamic particle mass size distributions were around 1–3 mm in mode diameter, with no significant differences due to friction brake distribution or to regenerative brake systems.
  • Nanoparticles did not contribute significantly to overall PM emissions for the brakes investigated in this study; they ranged from 0.6 to 6.1% as PM0.12. However, the reduction of the friction brake distribution with the regenerative brake tended to reduce coarse particles in the micrometer size range due to abrasive wear, but nanoparticles tended to remain and slightly increase in that fraction.
  • Emissions of nuclei-mode particles (<20 nm), which have been observed in electric vehicle brake assemblies designed for regenerative braking use under high-temperature and high-load-braking conditions with full-friction brake conditions, were also observed in this study.
The quantification of emissions of brake-wear particles from a regenerative-friction brake coordination system equipped with NAO brake pads in this study can serve as an example of how to measure emissions of brake-wear particles and identify their sources in atmospheric simulations and thereby facilitate similar studies in the future.

Funding

This work was supported by the Japan Society for the Promotion of Science (JSPS) KAKENHI Grant Number JP 22K03895.

Institutional Review Board Statement

Not applicable.

Informed Consent Statement

Not applicable.

Data Availability Statement

All data presented in this study are available on request from the corresponding author. The data are not publicly available due to a confidentiality agreement with the part providers.

Acknowledgments

The author would like to thank Takashi Matsuzaki and co-workers who supported the set-up and operation of the dynamometer and the measurements. In addition, the author would like to thank Akiyoshi Ito for their proofreading support during the preparation of the draft manuscript.

Conflicts of Interest

The author declares no conflicts of interest.

Appendix A. Experimental Conditions

Table A1. Experimental Conditions *1.
Run #ConditionsVehicle Types *2Brake Friction Work CoefficientInertia
(kg·m2)
1BeddingICE1.0047.8
2
3
4
5
6FFB
7
8
9Reg. (0.625)NOVC-HEV Cat. 10.62529.9
10
11
12Reg. (0.31)OVC-HEV0.3114.8
13
14
15Reg. (0.15)PEV0.157.17
16
17
18Reg. (0.107)OVC-HEV *30.107
on average *4
5.1
on average *4
19
20
21FFBICE1.0047.8
22
*1 The same brake assembly was used in a series of experiments. *2 The category defined at that time had been proposed at the time of draft GTR formulation [11]. *3 The vehicle types actually used in this study. *4 The average value of the entire WLTP-Brake Cycle for brake torque that changes every second.

Appendix B. Brake-Wear Particle Measurement

Figure A1. Enclosure design used in this study.
Atmosphere 15 00075 g0a1
The total mass loss of the friction partners (pads and discs) was determined (unit: mg), and the wear factor divided by the total test mileage (unit: km) was derived to allow comparison with the airborne particle emission factors. Mass loss of the friction partner was measured before and after a test in the laboratory at a temperature of 20 °C and a relative humidity of 50%. We used an electronic balance for brake pads (XPR404SV, resolution 0.0001 g, Mettler-Toledo International Inc., Columbus, OH, USA) and mass comparator brake discs (XPR10003SC, resolution 0.001 g, Mettler-Toledo International Inc., Columbus, OH, USA), respectively. The mass loss measurement was only performed for the FFB tests of Runs #1–8 in Table A1, and measurements were taken within 1 h immediately after the test.
PM10 and PM2.5 were measured using a cyclone for PM10 (URG-2000-30ET, URG Corp., NC, USA) and a cyclone for PM2.5 (PM2.5 Very Sharp Cut Cyclone (VSCC), Mesa Laboratories, Inc., Lakewood, CO, USA), respectively. Samples were collected by a suction pump with a mass flow controller (MQV0050, Azbil Corp., Tokyo, Japan) at a flow rate of 16.7 L/min according to the cyclone design and controlled at 20 °C standard conditions. Particle mass was collected through one test on a Teflon filter with support ring (PT47, 47 φ, Measurement Technology Laboratory, Bloomington, MN, USA) installed downstream of the cyclone. Within one hour after the test, in a thermostatic chamber in a clean room (room temperature 22 ± 3 °C, relative humidity 45 ± 8%), an electronic balance (XPR2UV, resolution 0.1 mg, Mettler-Toledo International Inc., Columbus, OH, USA) was used immediately after neutralizing the filter with an ionizer. The mass of the filter was measured. It is known that it is difficult to ensure membrane flatness in the PTFE filter with a polymethyl pentene support ring because of distortion of the support ring and that fluoropolymer-coated glass fiber filters are smooth but have a high surface area because of the fiber structure, which leads to an overestimation of gaseous substances being adsorbed. For these reasons, as well as to enable future toxicity testing and analysis of chemical composition, PT47 filters with PTFE support rings were selected for this study.
Two light-scattering particle mass measuring instruments (Dust Track II 8530, TSI Inc., Shoreview, MN, USA) were used to measure particles every second. The particles used during the calibration of the measuring device by the light-scattering method were Arizona Test Dust (ISO Test Dust 12103-1, AC-Fine). PM10 and PM2.5 were measured by the light-scattering method, and the mass concentration conversion factor (k-factor) was corrected to match the emission factor measured by the filter method with the emission factor measured by the dust track using FFB to obtain values equivalent to those obtained by the filter method.
A Low-Pressure Impactor (LP-20, Tokyo Dylec Corp., Tokyo, Japan) was used to measure the distribution of mass particle sizes of aerodynamic particles with sizes in the range 0.05–11 mm. The particles were collected and sampled through the WLTP-Brake Cycle three times. Samples were collected by a mass flow controller (MQV0050, Azbil Corp., Tokyo, Japan) at a flow rate of 23.8 L/min at 20 °C standard conditions according to the LPI design. The flow rate was controlled at ≤0.05, 0.12, 0.2, 0.3, 0.48, 0.68, 1.2, 2, 3.5, 5. 1, 7.7, and ≥11 mm collected on a Teflon filter (Fluoropore FP-500-100, 80 φ, Sumitomo Electric Fine Polymer Corp., Osaka, Japan).

Appendix C. Wear and Emission Factors

Table A2. Wear coefficient of mass loss and emission factors of PM10, PM2.5, and PN for the front axle brake.
Run #ConditionsMass LossPM10PM2.5TPN
Inner PadOuter PadDiscTotal
mg/km per Brake#/km per Brake
1Bedding1.061.050.872.981.86 *10.61 *15.84 × 109
21.31 *10.43 *14.13 × 109
30.99 *10.31 *13.00 × 109
41.00 *10.31 *12.38 × 109
51.07 *10.34 *15.52 × 108
6FFB0.800.241.60 × 108
70.790.231.13 × 108
80.740.228.80 × 107
9Reg. (0.625)------------0.370.155.16 × 107
100.290.124.64 × 107
110.330.145.15 × 107
12Reg. (0.31)0.220.104.02 × 107
130.160.093.16 × 107
140.250.113.83 × 107
15Reg. (0.15)0.090.041.52 × 107
160.080.041.40 × 107
170.070.031.31 × 107
18Reg. (0.107)0.100.051.70 × 107
190.120.062.02 × 107
200.100.041.98 × 107
21FFB0.730.233.22 × 108
220.630.197.53 × 107
*1 PM10 and PM2.5 were measured by dust track, and the mass concentration conversion factor (k-factor) was corrected to match the emission factor measured by the filter method with the emission factor measured by the dust track using FFB to obtain equivalent values to the filter method.

Appendix D. Masses versus Sizes of Aerodynamic Particles

In this study, we measured the emissions of brake wear particle masses according to their aerodynamic particle diameters measured with an LPI. Figure 2 shows the results. Generally, the height of each particle size interval is affected by the width of that interval. The result is a distortion of the shape of the fraction. We therefore used a histogram for the vertical axis, in which the particle mass of each fraction was divided by the width of that fraction (dM/dlogDp), and the particle size distribution was normalized by the particle size intervals. However, because in this study, the height of each particle size fraction was expressed as the emission factor of the particle mass measured in each fraction, the vertical axis of the graph was used as dM.
Figure A2. Emissions of masses of brake-wear particles from the front brake axles versus sizes of aerodynamic particles in each experiment.
Atmosphere 15 00075 g0a2aAtmosphere 15 00075 g0a2b

Appendix E. Particle Number Size Distributions

Figure A3. Particle mass size and accumulation distribution as a function of aerodynamic diameter in each experiment.
Atmosphere 15 00075 g0a3

References

  1. Maricq, M.M. Engine, Aftertreatment, Fuel Quality and Non-tailpipe Achievements to Lower Gasoline Vehicle PM Emissions: Literature Review and Future Prospects. Sci. Total Environ. 2023, 866, 161225. [Google Scholar] [CrossRef] [PubMed]
  2. Fussell, J.C.; Franklin, M.; Green, D.C.; Gustafsson, M.; Harrison, R.M.; Hicks, W.; Kelly, F.J.; Kishta, F.; Miller, M.R.; Mudway, I.S.; et al. A Review of Road Traffic-Derived Non-Exhaust Particles: Emissions, Physicochemical Characteristics, Health Risks, and Mitigation Measures. Environ. Sci. Technol. 2022, 56, 6813–6835. [Google Scholar] [CrossRef] [PubMed]
  3. Grigoratos, T.; Martini, G. Brake Wear Particle Emissions: A Review. Environ. Sci. Pollut. Res. 2014, 22, 2491–2504. [Google Scholar] [CrossRef] [PubMed]
  4. Grange, S.K.; Fischer, A.; Zellweger, C.; Alastuey, A.; Querol, X.; Jaffrezo, J.-L.; Weber, S.; Uzu, G.; Hueglin, C. Switzerland’s PM10 and PM2.5 Environmental Increments show the Importance of Non-Exhaust Emissions. Atmos. Environ. X 2021, 12, 100145. [Google Scholar] [CrossRef]
  5. Piscitello, A.; Bianco, C.; Casasso, A.; Sethi, R. Non-Exhaust Traffic Emissions: Sources, Characterization, and Mitigation Measures. Sci. Total Environ. 2021, 766, 144440. [Google Scholar] [CrossRef] [PubMed]
  6. Giechaskiel, B.; Maricq, M.; Ntziachristos, L.; Dardiotis, C.; Wang, X.; Axmann, H.; Bergmann, A.; Schindler, W. Review of Motor Vehicle Particulate Emissions Sampling and Measurement: From Smoke and Filter Mass to Particle Number. J. Aerosol. Sci. 2014, 67, 48–86. [Google Scholar] [CrossRef]
  7. Giechaskiel, B.; Melas, A.; Martini, G.; Dilara, P. Overview of Vehicle Exhaust Particle Number Regulations. Processes 2021, 9, 2216. [Google Scholar] [CrossRef]
  8. Grigoratos, T.; Mathissen, M.; Vedula, R.; Mamakos, A.; Agudelo, C.; Gramstat, S.; Giechaskiel, B. Interlaboratory Study on Brake Particle Emissions—Part I: Particulate Matter Mass Emissions. Atmosphere 2023, 14, 498. [Google Scholar] [CrossRef]
  9. Farwick zum Hagen, F.H.; Mathissen, M.; Grabiec, T.; Hennicke, T.; Rettig, M.; Grochowicz, J.; Vogt, R.; Benter, T. On-Road Vehicle Measurements of Brake Wear Particle Emissions. Atmos. Environ. 2019, 217, 116943. [Google Scholar] [CrossRef]
  10. Mathissen, M.; Grigoratos, T.; Gramstat, S.; Mamakos, A.; Vedula, R.; Agudelo, C.; Grochowicz, J.; Giechaskiel, B. Interlaboratory Study on Brake Particle Emissions Part II: Particle Number Emissions. Atmosphere 2023, 14, 424. [Google Scholar] [CrossRef]
  11. Proposal for a New UN GTR on Laboratory Measurement of Brake Emissions for Light-Duty Vehicles. GRPE-2023-4e Rev.V6. Clean-(PMP) Proposal to Amend ECE/TRANS/WP.29/GRPE/2023/4. Available online: https://wiki.unece.org/download/attachments/172852339/GRPE-2023-4e%20Rev.V6.docx?api=v2 (accessed on 4 January 2024).
  12. Mellios, G.; Ntziachristos, L. Non-Exhaust Emissions: Evaporation & Brake Wear Control. 2021. Available online: https://circabc.europa.eu/sd/a/1c0efc15-8507-4797-9647-97c12d82fa28/AGVES-2021-04-08-EVAP_Non-Exh.pdf (accessed on 4 January 2024).
  13. Storch, L.; Hamatschek, C.; Hesse, D.; Feist, F.; Bachmann, T.; Eichler, P.; Grigoratos, T. Comprehensive Analysis of Current Primary Measures to Mitigate Brake Wear Particle Emissions from Light-Duty Vehicles. Atmosphere 2023, 14, 712. [Google Scholar] [CrossRef]
  14. Bondorf, L.; Köhler, L.; Grein, T.; Epple, F.; Philipps, F.; Aigner, M.; Schripp, T. Airborne Brake Wear Emissions from a Battery Electric Vehicle. Atmosphere 2023, 14, 488. [Google Scholar] [CrossRef]
  15. Dimopoulos Eggenschwiler, P.; Schreiber, D.; Habersatter, J. Brake Particle PN and PM Emissions of a Hybrid Light Duty Vehicle Measured on the Chassis Dynamometer. Atmosphere 2023, 14, 784. [Google Scholar] [CrossRef]
  16. Shibata, Y.; Morikawa, T. Review of the JCAP/JATOP Air Quality Model Study in Japan. Atmosphere 2021, 12, 943. [Google Scholar] [CrossRef]
  17. Kasai, A. Measures to Reduce Emissions of Particulate Matter from Motor Vehicles. J. Jpn. Soc. Atmos. Environ. 2017, 52, A91–A96. (In Japanese) [Google Scholar] [CrossRef]
  18. Japan Automobile Manufacturers Association, Inc. The Motor Industry of Japan. 2023. Available online: https://www.jama.or.jp/english/reports/docs/MIoJ2023_e.pdf (accessed on 4 January 2024).
  19. JIS D 0210; General Rules of Brake Test Method of Automobiles and Motor Cycles. Japanese Standards Association: Tokyo, Japan; Society of Automotive Engineers of Japan (JSAE): Tokyo, Japan, 2022.
  20. Lu, D.; Ouyang, M.; Gu, J.; Li, J. Instantaneous Optimal Regenerative Braking Control for a Permanent-Magnet Synchronous Motor in a Four-Wheel-Drive Electric Vehicle. Proc. Inst. Mech. Eng. Pt. D J. Automob. Eng. 2014, 228, 894–908. [Google Scholar] [CrossRef]
  21. Aksjonov, A.; Vodovozov, V.; Augsburg, K.; Petlenkov, E. Design of Regenerative Anti-Lock Braking System Controller for 4 In-Wheel-Motor Drive Electric Vehicle with Road Surface Estimation. Int. J. Automot. Technol. 2018, 19, 727–742. [Google Scholar] [CrossRef]
  22. Koch, A.; Brauer, J.; Falkenstein, J. Drivability Optimization of Electric Vehicle Drivetrains for Brake Blending Maneuvers. World Electr. Veh. J. 2022, 13, 209. [Google Scholar] [CrossRef]
  23. Farwick zum Hagen, F.H.; Mathissen, M.; Grabiec, T.; Hennicke, T.; Rettig, M.; Grochowicz, J.; Vogt, R.; Benter, T. Study of Brake Wear Particle Emissions: Impact of Braking and Cruising Conditions. Environ. Sci. Technol. 2019, 53, 5143–5150. [Google Scholar] [CrossRef]
  24. Agudelo, C.; Vedula, R.; Collier, S.; Stanard, A. Brake Particulate Matter Emissions Measurements for Six Light-Duty Vehicles Using Inertia Dynamometer Testing. SAE Int. J. Adv. Curr. Prac. Mobil. 2021, 3, 994–1019. [Google Scholar] [CrossRef]
  25. Hagino, H.; Oyama, M.; Sasaki, S. Laboratory Testing of Airborne Brake Wear Particle Emissions using A Dynamometer System Under Urban City Driving Cycles. Atmos. Environ. 2016, 131, 269–278. [Google Scholar] [CrossRef]
  26. Kenny, L.C.; Gussman, R.; Meyer, M. Development of a Sharp-Cut Cyclone for Ambient Aerosol Monitoring Applications. Aerosol. Sic. Technol. 2000, 32, 338–358. [Google Scholar] [CrossRef]
  27. Cassee, F.R.; Héroux, M.-E.; Gerlofs-Nijland, E.E.; Kelly, F.J. Particulate Matter Beyond Mass: Recent Health Evidence on the Role of Fractions, Chemical Constituents and Sources of Emission. Inhal. Toxicol. 2013, 25, 802–812. [Google Scholar] [CrossRef] [PubMed]
  28. WHO Regional Office for Europe. Review of Evidence on Health Aspects of Air Pollution—REVIHAAP Project, Technical Report. Copenhagen: WHO Regional Office for Europe. 2013. Available online: https://iris.who.int/bitstream/handle/10665/341712/WHO-EURO-2013-4101-43860-61757-eng.pdf?sequence=1 (accessed on 4 January 2024).
Figure 1. Example of torque/speed characteristics of regenerative braking in regenerative-friction brake coordination control.
Atmosphere 15 00075 g001
Figure 2. Example of time profile of friction brake torque (FFB: Full-Friction Brake, Reg. (0.625), Reg. (0.31), and Reg. (0.15)) and friction brake torque in regenerative cooperative braking control with data from an actual vehicle (Reg. (0.107)) (Example of Full Stop Braking Event #104).
Atmosphere 15 00075 g002
Figure 3. Comparison of friction work targets and observations for brake events #1–303.
Atmosphere 15 00075 g003
Figure 4. Comparison of total friction work for each run.
Atmosphere 15 00075 g004
Figure 5. Brake temperatures for ventilated disc during trip #10 of the WLTP brake cycle (IBT = initial brake temperature; FBT = final brake temperature).
Atmosphere 15 00075 g005
Figure 6. Comparison of average brake temperatures for each inertial condition and each Run for brake events #1–303.
Atmosphere 15 00075 g006
Figure 7. Brake-wear particle emissions for the front axle brake versus the distribution of brake friction work.
Atmosphere 15 00075 g007
Figure 8. Emissions of masses of brake-wear particles from the front brake axles versus sizes of aerodynamic particles.
Atmosphere 15 00075 g008
Figure 9. Average distribution of particle sizes during braking events according to mobility and aerodynamic diameter.
Atmosphere 15 00075 g009
Figure 10. Comparison of distributions of numbers of airborne particle sizes measured in Runs 21 and 22 in FMPS during brake events #294 (15,086 s) and #295 (15,457 s) of the WLTP-Brake Cycle.
Atmosphere 15 00075 g010
Table 1. Comparison of brake-wear particle mass emission factors and reduction ratios from passenger cars equipped with regenerative-friction brake coordination systems measured experimentally in this study and in previous studies.
Vehicle TypesExperimental ConditionsFull Friction
Braking
with Regenerative BrakingReduction RatioReferences
PM10PM2.5PM10PM2.5PM10PM2.5
mg/km per Vehicle%
PHEVWLTP brake cycle
Brake dynamometer
Vehicle: 1659 kg, ECE pad
5.32.82.01.26257[13]
BEV1.10.87971
BEVWLTC *1, WLTP brake cycle Part 10, and real driving cycle
Chassis dynamometer
Vehicle: 1228 kg, ECE pad
--- *2---------−15–68 *3---[14]
HEVWLTC
Chassis dynamometer
Vehicle test mass: 1500 kg, ECE pad
11.13 *44.74------50 *550 *5[15]
HEVCBDC *6 brake cycle
Brake dynamometer
Vehicle test mass: 1592 kg, NAO pad
2 *70.9 *7------------[24]
PHEVWLTP brake cycle
Brake dynamometer
Vehicle test mass: 1533 kg, NAO pad
1.92 *80.58 *80.28 *80.13 *88578This Study
*1 Worldwide harmonized light-duty driving test cycle (WLTC). *2 Not reported. *3 Coarse particle number concentrations with diameters between 300 nm and 10 μm measured using an optical particle sizer. *4 Measured as PM12 (<12 mm). *5 Estimated from the correlation between brake torque and emissions quantified by the number of particles. *6 California Brake Dynamometer Cycle (CBDC). *7 Based on the graph in reference [24]. The emission factor per vehicle was calculated from the emission factor per front brake and per rear brake. *8 Based on reference [25]. The emission factor per vehicle was roughly calculated using the emission factor per front axle brake, the number of tires, and the front-rear distribution of brakes.
Disclaimer/Publisher’s Note: The statements, opinions and data contained in all publications are solely those of the individual author(s) and contributor(s) and not of MDPI and/or the editor(s). MDPI and/or the editor(s) disclaim responsibility for any injury to people or property resulting from any ideas, methods, instructions or products referred to in the content.

