Article

Influences of Summer Precipitation Occurrence Time on Raindrop Spectrum Characteristics over the Northeastern Tibetan Plateau

1
Meteorological Disaster Prevention Technology Center in Qinghai Province, Xining 810001, China
2
Key Laboratory for Disaster Prevention and Mitigation in Qinghai Province, Xining 810001, China
*
Author to whom correspondence should be addressed.
Atmosphere 2024, 15(1), 41; https://doi.org/10.3390/atmos15010041
Submission received: 24 November 2023 / Revised: 22 December 2023 / Accepted: 26 December 2023 / Published: 29 December 2023

Abstract

:
The impact of unique terrain on the microphysics of nighttime precipitation on the Tibetan Plateau (TP) has not been fully appreciated, due to a lack of observation. In this study, we used three raindrop spectrometers deployed in the northeastern TP to analyze the characteristics of the raindrop spectrum during two types of summer precipitation. These two types are classified according to their occurrence times: one starting in the daytime and lasting into the night (DP), while the other started at night and continuing into the daytime (NP). The results show that precipitation with a rain rate ranging from 1.0 to 5.0 mm h−1 contributes the most to the total precipitation, with this contribution rate being higher in the NP than in the DP. All the raindrop spectra follow a single-peak distribution pattern, and the logarithm of the generalized intercept parameter (lgNw) rises with the rain rate. The spectral widths of the DP-n (the nighttime part of the DP) are broader than those of the DP-d (the daytime part of the DP). Moreover, the average l g N w and mass-weighted mean diameter ( D m ) over the northeastern TP were 2.65 mm−1 mm−3 and 1.04 mm, respectively, both of which are smaller than their equivalents in the plains. In addition, the gamma distribution can better fit the raindrop size distributions of the two types of precipitation. It is found that precipitation is more likely to occur over the TP at night. The characteristics of NP are reflected in two aspects. First, the sample size of the precipitation at the rain rate of 1.0–5.0 mm h−1 is higher in the NP-n (the nighttime part of the NP), and the precipitation at this rain rate contributes the most to the total precipitation. Second, for the same rain rate, the precipitation particles in the NP-n are larger.

1. Introduction

The convective activity over the Tibetan Plateau (TP) is a main heat source in the Asian monsoon region [1,2]. The unique atmospheric thermodynamic processes over the TP greatly influence the weather and climate in its surroundings and even around the globe. In particular, the convections over the TP in summer present remarkable diurnal variations [3,4,5]. Significant thermal and dynamic features coupled with low vortexes, shear lines, and low-frequency oscillations promote the formation of highly active convections over the TP under certain large-scale circulation conditions. As a consequence, disastrous weather events including hail and thunderstorms occur much more frequently over the TP than on the plains at the same latitudes [6,7,8]. Many previous studies have found that convective clouds frequently form over the TP in summer and present a pronounced diurnal variation, which is mainly observed between late afternoon and midnight [9,10,11].
During the summer monsoon season, the TP is intruded on by a warm humid southerly airflow, which may induce active moist convection over the TP [12,13,14,15]. The formation and development of convective clouds and the diurnal cycle of convection are strongly influenced by the topography of the TP [16,17]. Shimizu et al. (2001) [18] observed significant diurnal variations of convective clouds and precipitation in the central TP using Doppler radar, suggesting that the energy exchange between the boundary layer and the free atmosphere is important for the formation of general circulation patterns over the TP and its surrounding areas. Tsuyoshi et al.(1983) [19] found that the upward motion and heat sources exhibit more obvious diurnal variations in the eastern TP, and moreover, greater upward motion and more intense heat sources are found in the late afternoon than in the early morning. Liu et al. (2002) [20] analyzed the relationship between the diurnal variation of summer precipitation and thermal parameters over the TP by using precipitation data and radar data. They concluded that the precipitation during the rainy period over the TP rapidly increases in the afternoon and reaches its peak in the evening, with the maximum precipitation occurring at around 01:00 local time. Using the cloud cover data from the Geostationary Meteorological Satellite every 3 h, Fujinami et al. (2005) [12] discovered that the cloud activity peaked at 18:00 local time. Based on reanalysis data, Ueno et al. (2009) [17] suggested that the obvious enhancement of nocturnal precipitation over the TP is partly due to the increasing convective instability caused by nocturnal low-level wetting at night. Hence, studying the diurnal variation characteristics of precipitation over the TP can help reveal the physical mechanisms involved.
The characteristics of raindrop spectra are essential for studying precipitation features. Droplet spectroscopy can reveal the interrelationship between rain-forming processes, cloud dynamics, and microphysical processes in clouds [21,22]. This is of great significance and value for understanding the physics of natural precipitation processes, the mechanisms of cloud and rain formation, and improving the accuracy of quantitative precipitation estimates by radar and satellite [23,24,25]. Many studies have shown that there are local differences in raindrop spectra, even across precipitation types [26,27,28].
From the aspect of raindrop spectra, previous studies usually classified the precipitation into the stratiform/convective type, or into the daytime/nighttime type. The characteristics of raindrop spectra under the special topography of the TP have also been receiving increasing attention [29]. Chen et al. (2017) [30] analyzed the raindrop spectra of different precipitation types at the Nagqu station on the TP. It was found that the diurnal variations of raindrop spectra are not significant for stratiform precipitation, but are obvious for convective precipitation. By analyzing the raindrop size distribution (DSD) characteristics in Lhasa (3600 m above sea level) and Linzhi (3300 m above sea level) on the TP, Porcù et al. (2014) [31] suggested that the collisional breakup can occur at relatively lower rain rates with relatively small maximum drop diameters. Wang et al. (2020) [32] investigated the DSD differences between stratiform and convective precipitation at different rain rates in Daocheng County in the eastern TP. The raindrop number concentrations of both precipitation types in Daocheng are higher than those in central China.
In this study, the characteristics of raindrop spectra in summer precipitation over the northeastern TP were investigated using raindrop spectrometers at three stations. The differences between daytime and nighttime precipitation over the TP were further analyzed. On this basis, two types of precipitation events, classified based on their occurrence times, are chosen as the study object: one starting from daytime and lasting into the nighttime (DP) and the other initiating at nighttime and continuing into the daytime (NP). These two types were selected for the following two reasons. Firstly, the TP is an area where anomalously active convective precipitation occurs frequently, showing greater uncertainty. Secondly, precipitation events with long durations are frequently found based on research data by removing short duration precipitation, which usually lasts more than 3 h from daytime to nighttime. We further categorize the two types of precipitation as follows. The daytime period of the DP (NP) is termed as DP-d (NP-d), and the nighttime period is termed as DP-n (NP-n). Note that the DP and NP are classified according to the local sunset and sunrise times.
The remainder of this paper is organized as follows. Section 2 introduces the data, observation instruments, and methods. In Section 3, the DSD characteristics of different types of precipitation over the TP are analyzed. The summary and conclusions are presented in Section 4.

2. Data and Methods

2.1. Data and Observation Instruments

A Parsivel laser raindrop spectrometer (OTT Parsivel Co., Berlin, Germany) was used to observe the size of precipitation particles and measure their velocity through the blocking of the laser band by particles during the falling processes. This instrument has 32 particle scale channels of 0.2–25 mm and 32 particle velocity channels of 0.2–20 m s−1, with a sampling area of 54 cm2 and a sampling time of 60 s [33].
The three raindrop spectrometers were deployed in Zeku (35.02° N, 101.28° E), Dari (33.26° N, 99.39° E), and Yushu (33.00° N, 96.96° E) in the northeastern TP (Figure 1), with an average elevation of nearly 3700 m. The annual precipitation at the three stations is about 360 mm on average. The observation period was from May to October, which is the main rainy season of the study region. The Zeku observation station is situated in an area with a highland continental monsoon climate. This area experiences a warm wet climate throughout the year, and the numerous pastures around the site are suitable for grazing. The Dari observation station is located in the Bayankara Mountains of the TP, with most of the area between 4500 and 6000 m above sea level. This mountain range has complex terrain, and is the watershed between the Yangtze River and the Yellow River. The Yushu observation station is more southerly than the other two, and there are 951 high mountains with the altitudes peaking above 5000 m in the surrounding area. As an area with abundant precipitation, it serves as the headstream of the three major rivers in China, namely the Yangtze River, the Yellow River, and the Lancang River.

2.2. Terminologies and Methods

As mentioned above, two types of precipitation events are selected as the study object, namely the DP and NP. Both types have a duration of no less than 4 h. The selected precipitation events under the above conditions are generally stratiform events, or events transforming from convective precipitation in the early stage to stratiform precipitation in later stages.
As shown in Table 1, the total number of samples used in the study is 11,451. Among them, 47% of the total are the DP samples (5365), and the rest (53%) are NP samples (6086). The introduction discussed the observation sample’s meticulous selection process. The Tibetan Plateau experiences a greater quantity of convective weather. One the one hand, our selection process can eliminate the impact of intense precipitation and convection on the properties of the raindrop spectrum. On the other hand, the sample selection technique can lessen the noise brought on by various rain spectral features caused by various precipitation start times.
The laser raindrop spectrometer can only measure the raindrop size in the horizontal direction, which may lead to overestimation. Therefore, the method proposed by Battaglia et al. (2010) [34] is used to correct for raindrop deformation (Equation (1)).
D = D p a r                                                                 D p a r 1.0   m m 1.075 0.075 D p a r D p a r                                         1.00   m m < D p a r < 5.00   m m 0.7 D p a r                                                         D p a r > 5.00   m m
where D denotes the corrected equivalent spherical diameter of raindrops and D p a r indicates the measured raindrop diameter.
The Parsivel observation provides the number of raindrops passing through the sampling area during the sampling time. The raindrop number concentration is calculated as follows (Equation (2)).
N D i = j = 1 32 n i j A · t · V j · D i
where N ( D i ) (mm−1 m−3) represents the number concentration of raindrops with the diameters in the interval between D i and D i + D i . n i j represents the number of raindrops at the i th size class and the j th velocity class. V j (m s−1) represents the measured falling speed at the velocity class j . A (m2) represents the effective sampling area at the i th size class, and t represents the sampling time interval.
In this study, the DSD-related physical quantities, including rain rate ( R ; mm h−1), rainwater content ( W ; mg m−3), mass-weighted mean diameter ( D m ; mm), and the generalized intercept parameter ( N w ; mm−1 m−3), are calculated directly from the n th-order weighted moments of the measured DSD. Details of the algorithm are given in Bringi et al. (2003) [21] and Chen et al. (2017) [30]. As is known, the two most popular methods for fitting the raindrop spectra are the M-P distribution [35] (Marshall and Palmer, 1948) and the gamma distribution. In this study, the gamma distribution model is applied to rain DSD, and the three control parameters of the gamma model refer to the M246-truncated moment fitting method [36].

3. Results

3.1. Raindrop Size Distribution Characteristics

Similar to Chen et al. (2017) [30], the precipitation dataset is classified into five rain-rate classes, namely R1 ( R 0.1 mm h−1), R2 ( 0.1 < R 1 mm h−1), R3 ( 1 < R 5 mm h−1), R4 ( 5 < R 10 mm h−1), and R5 ( R > 10 mm h−1). Figure 2 shows the precipitation frequencies of the DP and NP at different rain rates for the three stations and their accumulated contributions to the total precipitation.
Overall, the accumulated duration of R2 and R3 in the NP is higher than that in the DP. However, the occurrence of rain with R > 5 mm h−1 in the DP-d is higher. The rainfall amount of R3 contributes the most to the total amount (Figure 2), with an average contribution rate of 62%, and the contribution rate in the NP is about 18% higher than that in the DP. For R4 and R5, the percentage contributions to the total duration and precipitation amount in the DP are higher than in the NP, and the precipitation occurrences of these two classes are mainly concentrated in the DP-d period. The accumulated duration of R1 accounts for an average of 18% of the total duration, but its contribution to the total rainfall amount is less than 1% in both types. The results are consistent with conclusions drawn by Chen et al. (2017) in a raindrop spectrum study at Naqu station in the southern TP. They also concluded that the two classes of R2 and R3 are the largest two contributors to the total duration.
The average values of the four DSD-related physical parameters for different events are given in Table 2. As can be seen, the four parameters do not change with the increasing station altitude. Compared with the DP, the NP has greater values of R , N ( D ) , and D . The average value of R in the northeastern TP is 1.10 mm h−1. The value of W remains around 0.07 mg m−3 on the TP and the average D m is 3.45 mm in the northeastern TP. The above result coincides well with the conclusions of previous studies. For example, Wang et al. (2020) [32] revealed that the average R for stratiform precipitation in summer is 0.94 mm h−1 at the Daocheng station (situated at a lower latitude than the three stations in this study) in the eastern TP. Li et al. (2022) [29] showed an average R of 0.91 mm h−1 for summer DSD at the Dari station.
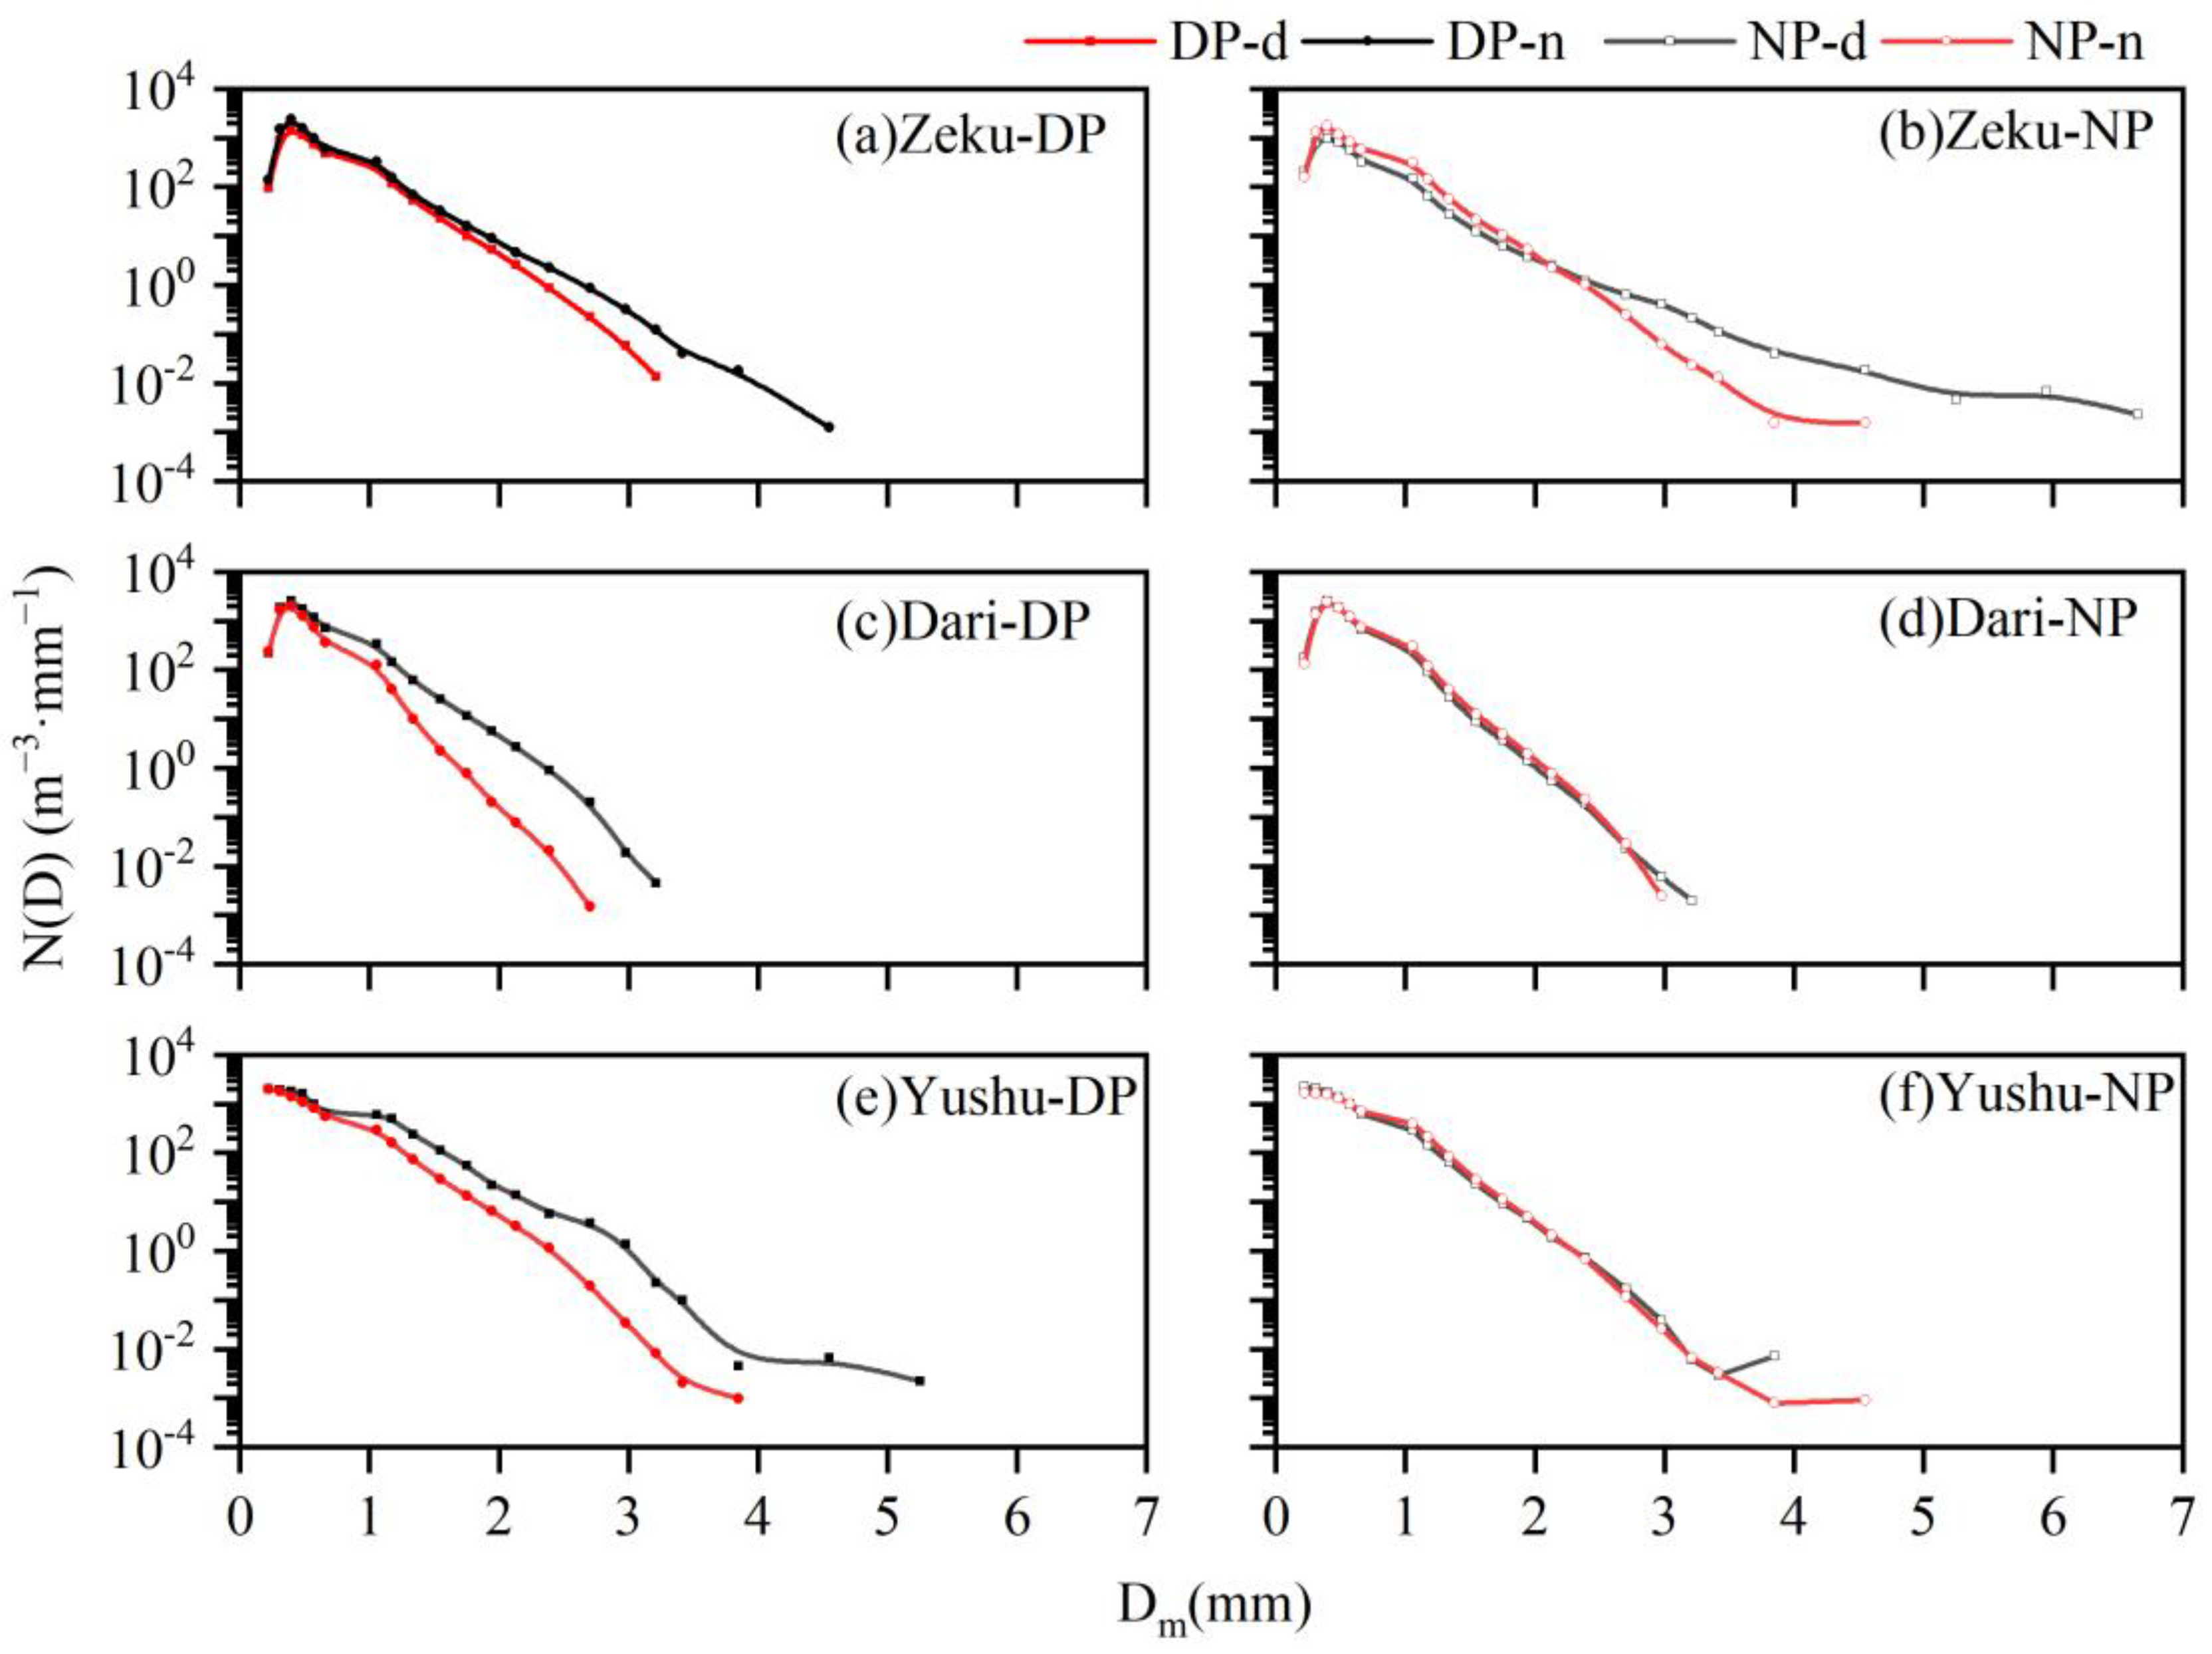
Figure 3 shows the comparisons of DSD-related parameters between DP and NP at the three stations. The values of maximum N ( D ) are all about 103 m−3 mm−1 at the three stations. The droplet size spectra show a single peak, with the peak particle sizes being the same in the DP and NP for all three stations. The spectral widths for all the DP-n values are higher than those for the DP-d at the same station, and the N ( D ) values of the DP-n are higher than the DP-d when D m > 1.5 mm. Conversely, Chen et al. (2017) [30] suggested that the concentration and spectral widths in the DP-d are higher than those in the DP-n over the southern TP. The main reason is that the precipitation events selected in this study are mainly stratiform precipitation with longer durations. As is known, the DSD exhibits remarkable spatial differences. In our study, the DSD distributions are quite different at the three stations, and the differences are more remarkable over the NP.
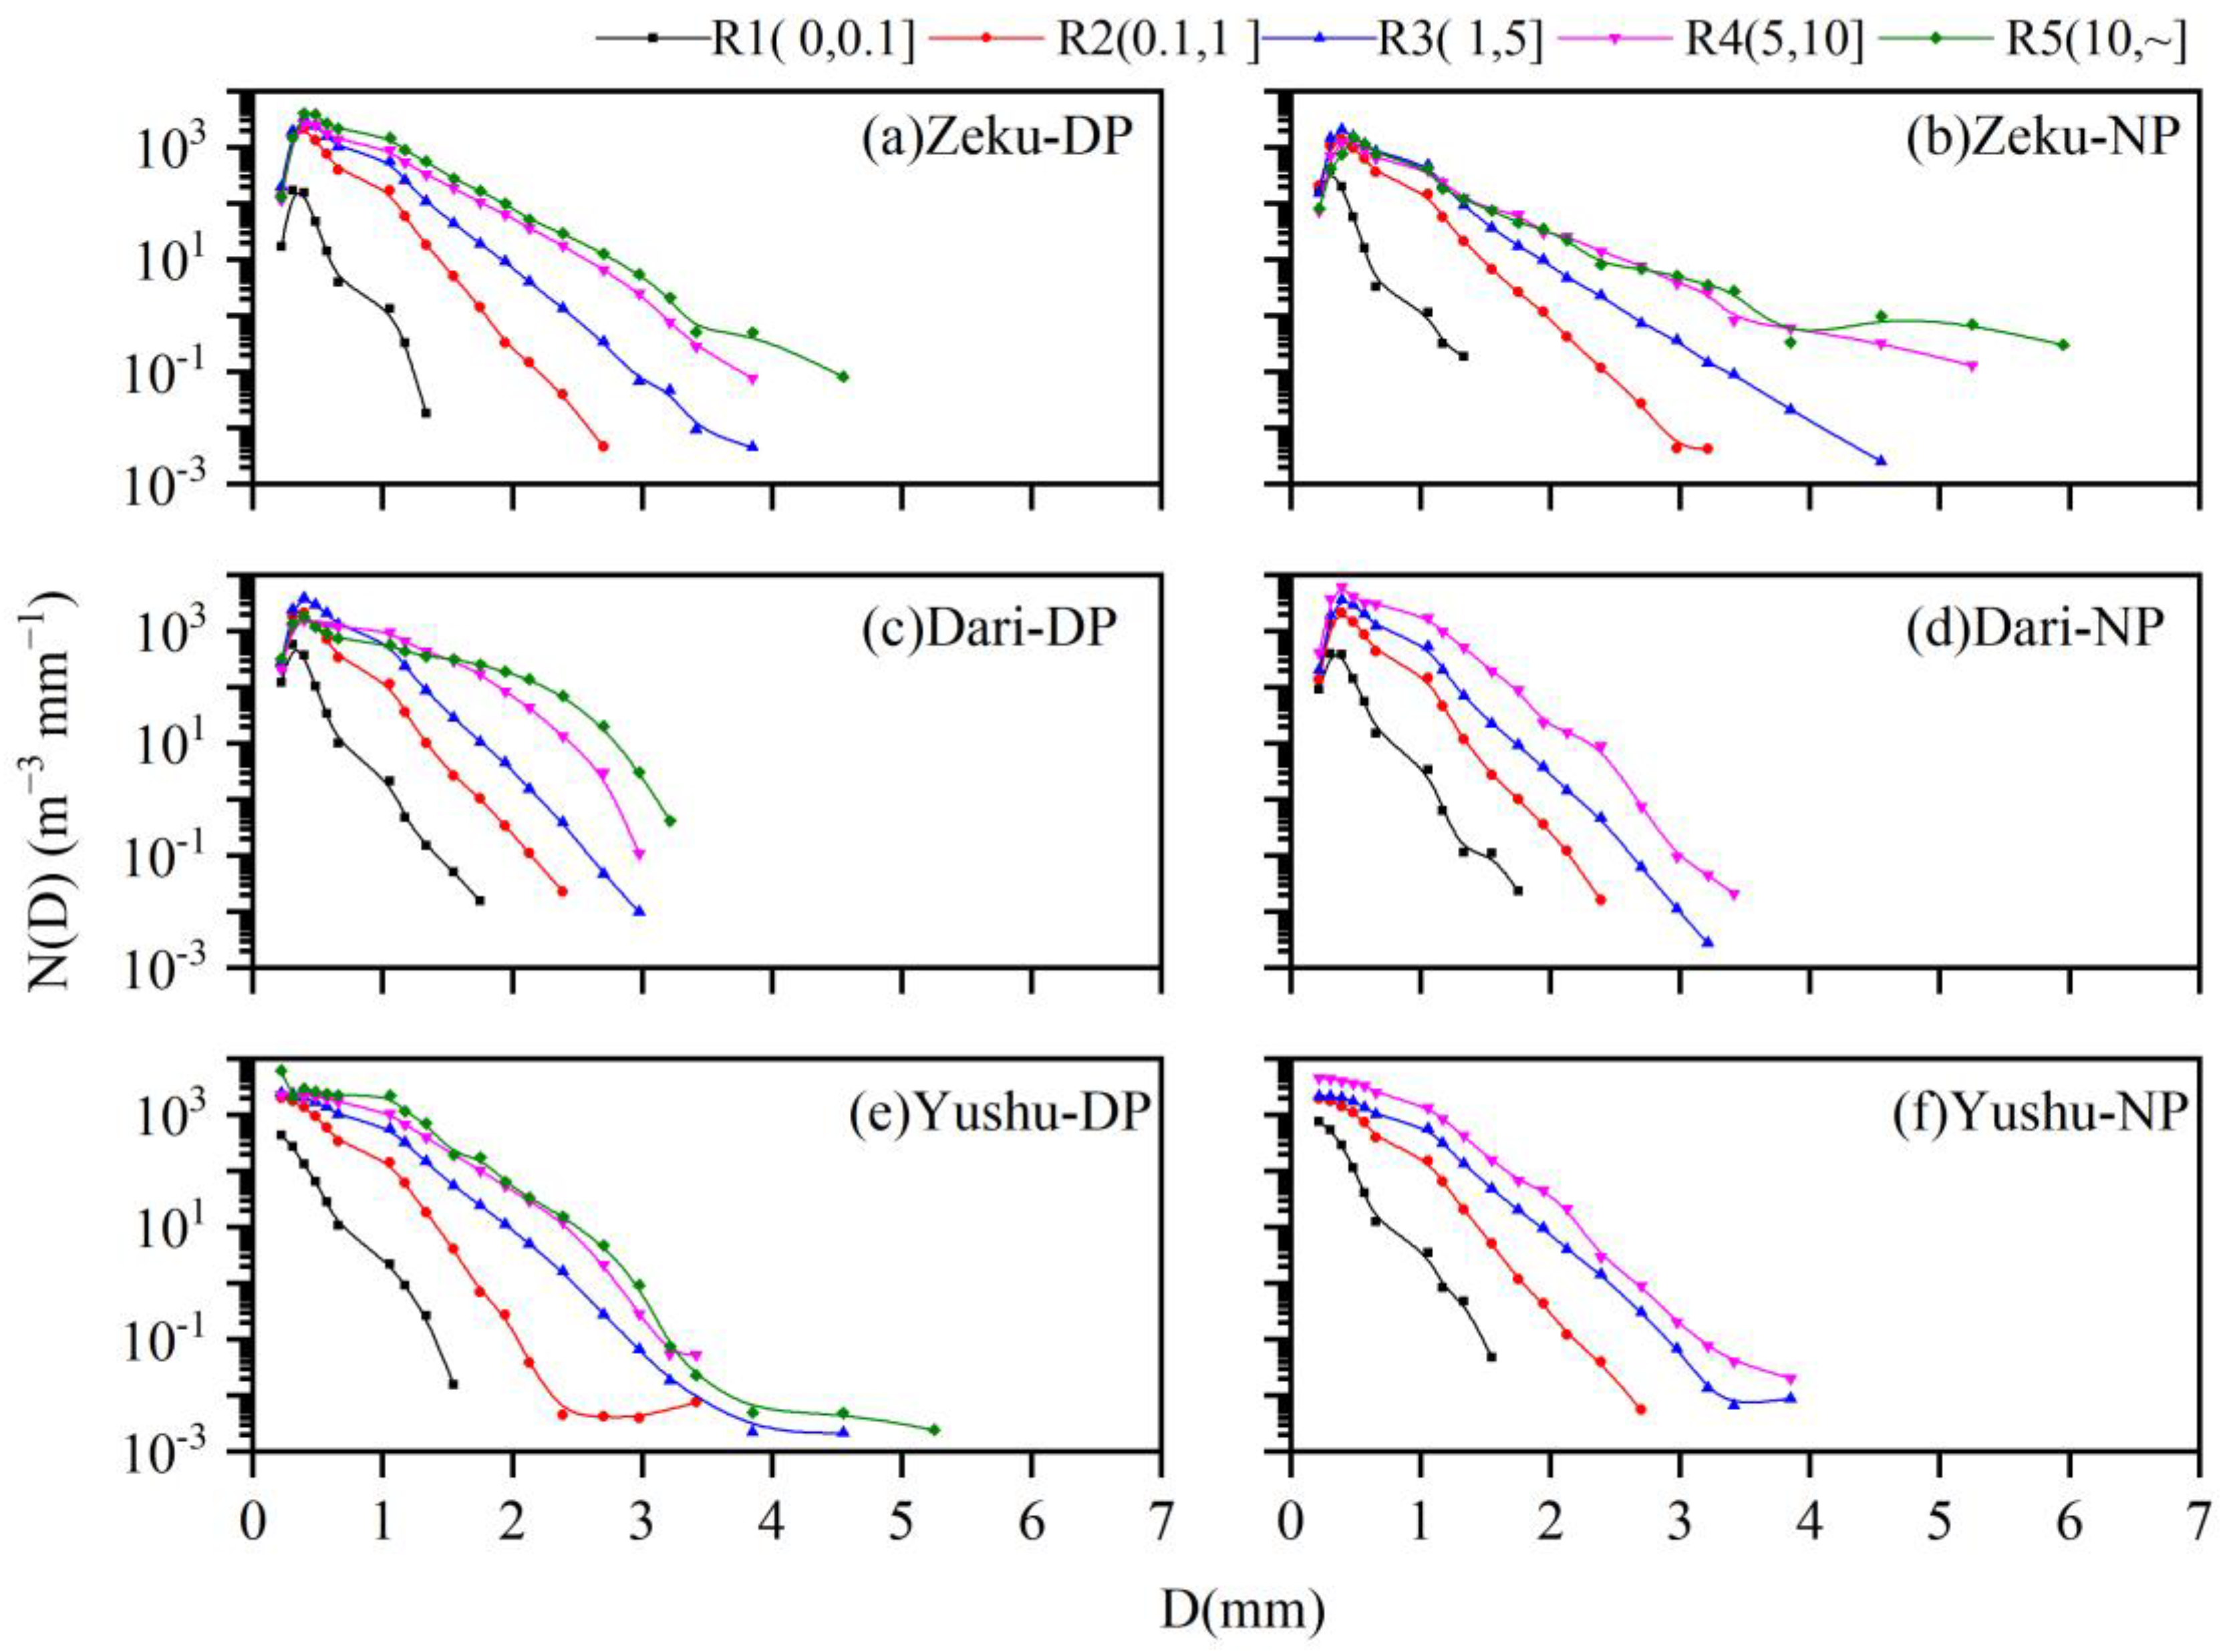
Figure 4 shows the variations of DSD-related parameters in the DP and NP at different rain rates. For all five rain rate classes, the parameters are all single peaked. The raindrop spectral width broadens as R increases. For the same station, the DP and NP have the same magnitude of lg N ( D ) for each precipitation type, but this does not apply to the spectral widths. When R < 0.1 mm h−1, the peak particle sizes at the Zeku and Dari stations are both 0.31 mm, and the peak concentration and spectral width are small. When R > 0.1 mm h−1, the peak particle size increases to 0.39 mm. The peak particle size for the five rain rates at Yushu is 0.22 mm, and the raindrop spectral width for R > 1 mm h−1 at the Yushu station is wider in the DP than in the NP.

3.2. Distribution Parameters

Marshall and Palmer (1948) first applied the exponential distribution function to DSD, namely the M-P distribution. Ulbrich (1983) [37] suggested that the gamma distribution would describe the spectral density distribution of raindrops in observed precipitation more accurately. In this study, the M-P and gamma distribution functions are used to fit the raindrop spectra at the three stations. Both functions can well fit the raindrop spectra of the two precipitation types (Figure 5), with correlation coefficients being no less than 0.97and reaching 0.98 for the gamma distribution function. The slope parameter λ directly reflecting the slope of the fitting curve of DSD is also analyzed. Figure 3 indicates that the number concentration of raindrop particles decreases with the increasing raindrop diameter. In the eastern TP, the λ in the DP is larger than that in the NP for both distribution functions at the same station, suggesting that the raindrop spectrum is narrower in the DP than in the NP.
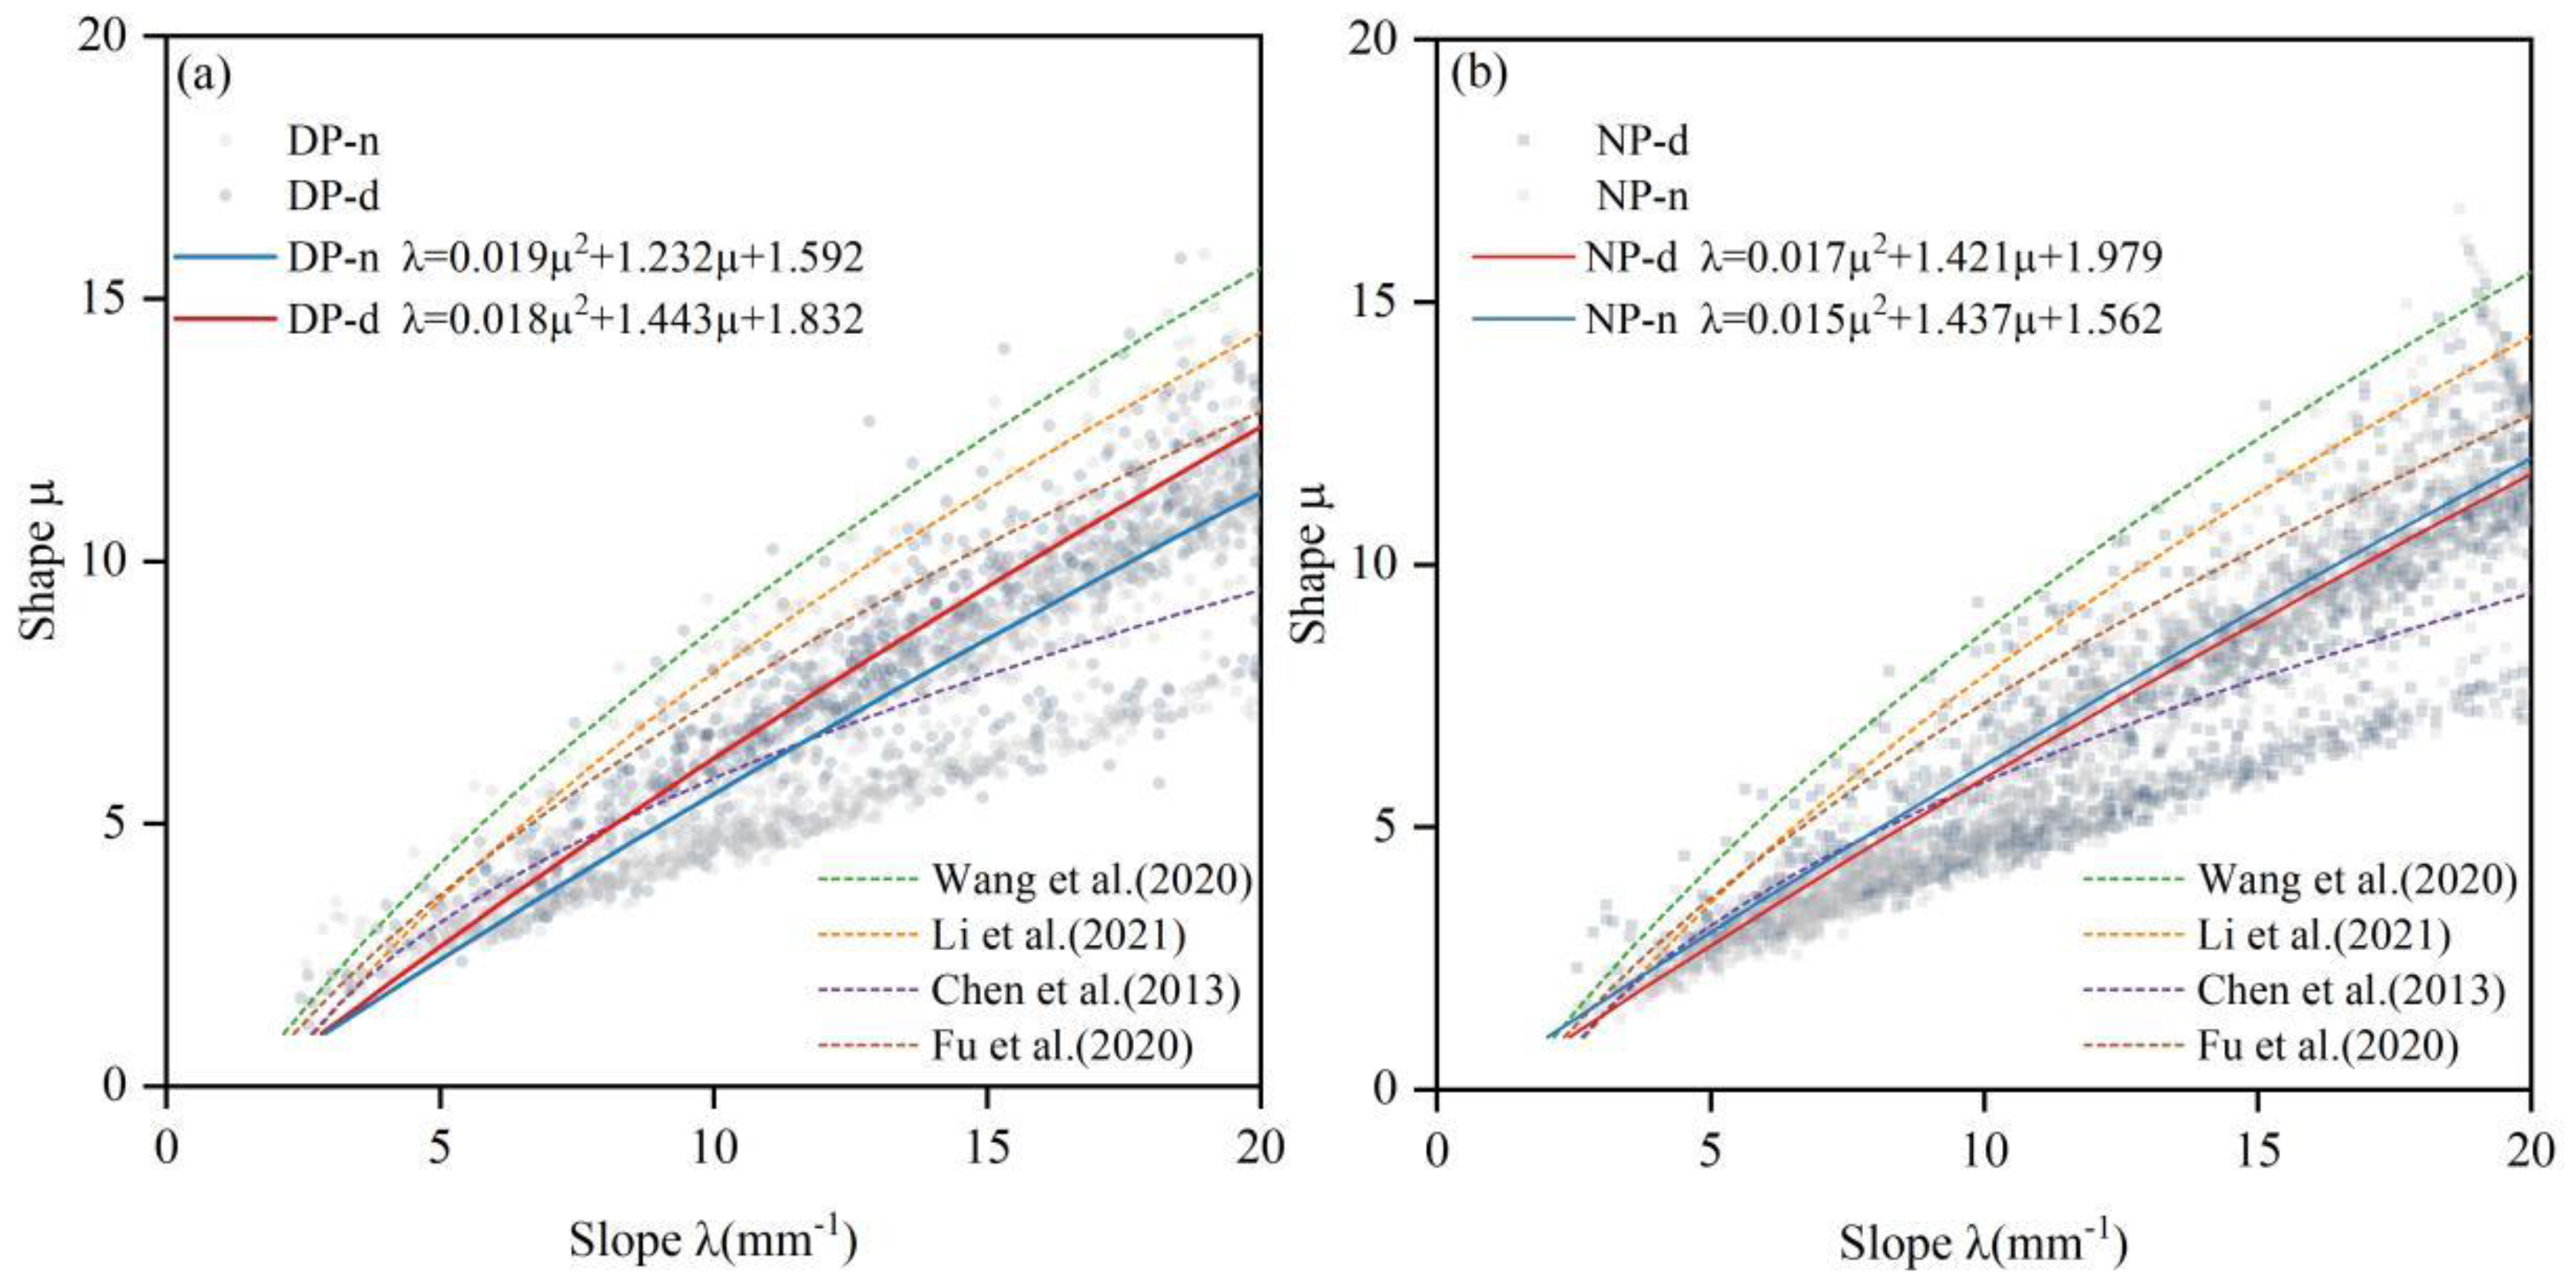
The parameters of the gamma distribution ( μ and λ ) are better suited to capture the inherent properties of the raindrop spectrum in various geographical and climatic contexts. A second-order polynomial equation is used to describe the μ - λ relation, offering insights into the DSD characteristics and simplifying the polarization variables in the retrieval of DSD from the dual-polarization radar [38]. By using the μ - λ relation, Figure 6 compares the four types of precipitation (DP-d, DP-n, NP-d, and NP-n) over the northern TP [32], the northeastern TP [29], eastern China [30], and central China [10]. As shown in Figure 5, the λ value ranges from 0 to 20 according to the principle that values greater than 20 are mainly caused by measurement error [25]. The findings from the fitting of four different types of precipitation using a second-order polynomial equation are as follows:
λ = 0.019 μ 2 + 1.232 μ + 1.592 ,   DP-d
λ = 0.018 μ 2 + 1.443 μ + 1.832 ,   DP-n
λ = 0.017 μ 2 + 1.421 μ + 1.979 ,   NP-d
λ = 0.015 μ 2 + 1.437 μ + 1.562 ,   NP-n
The μ - λ relation in the northern TP [32] is λ = 0.0302 μ 2 + 0.724 μ + 1.139, and the μ - λ relation in the northeastern TP [22] is λ = 0.0365 μ 2 + 0.735 μ + 1.935 . Due to variations in observation means, observation objects, and statistical techniques, the μ - λ relation varies in different TP areas.

3.3. Distributions of lgNw and Dm

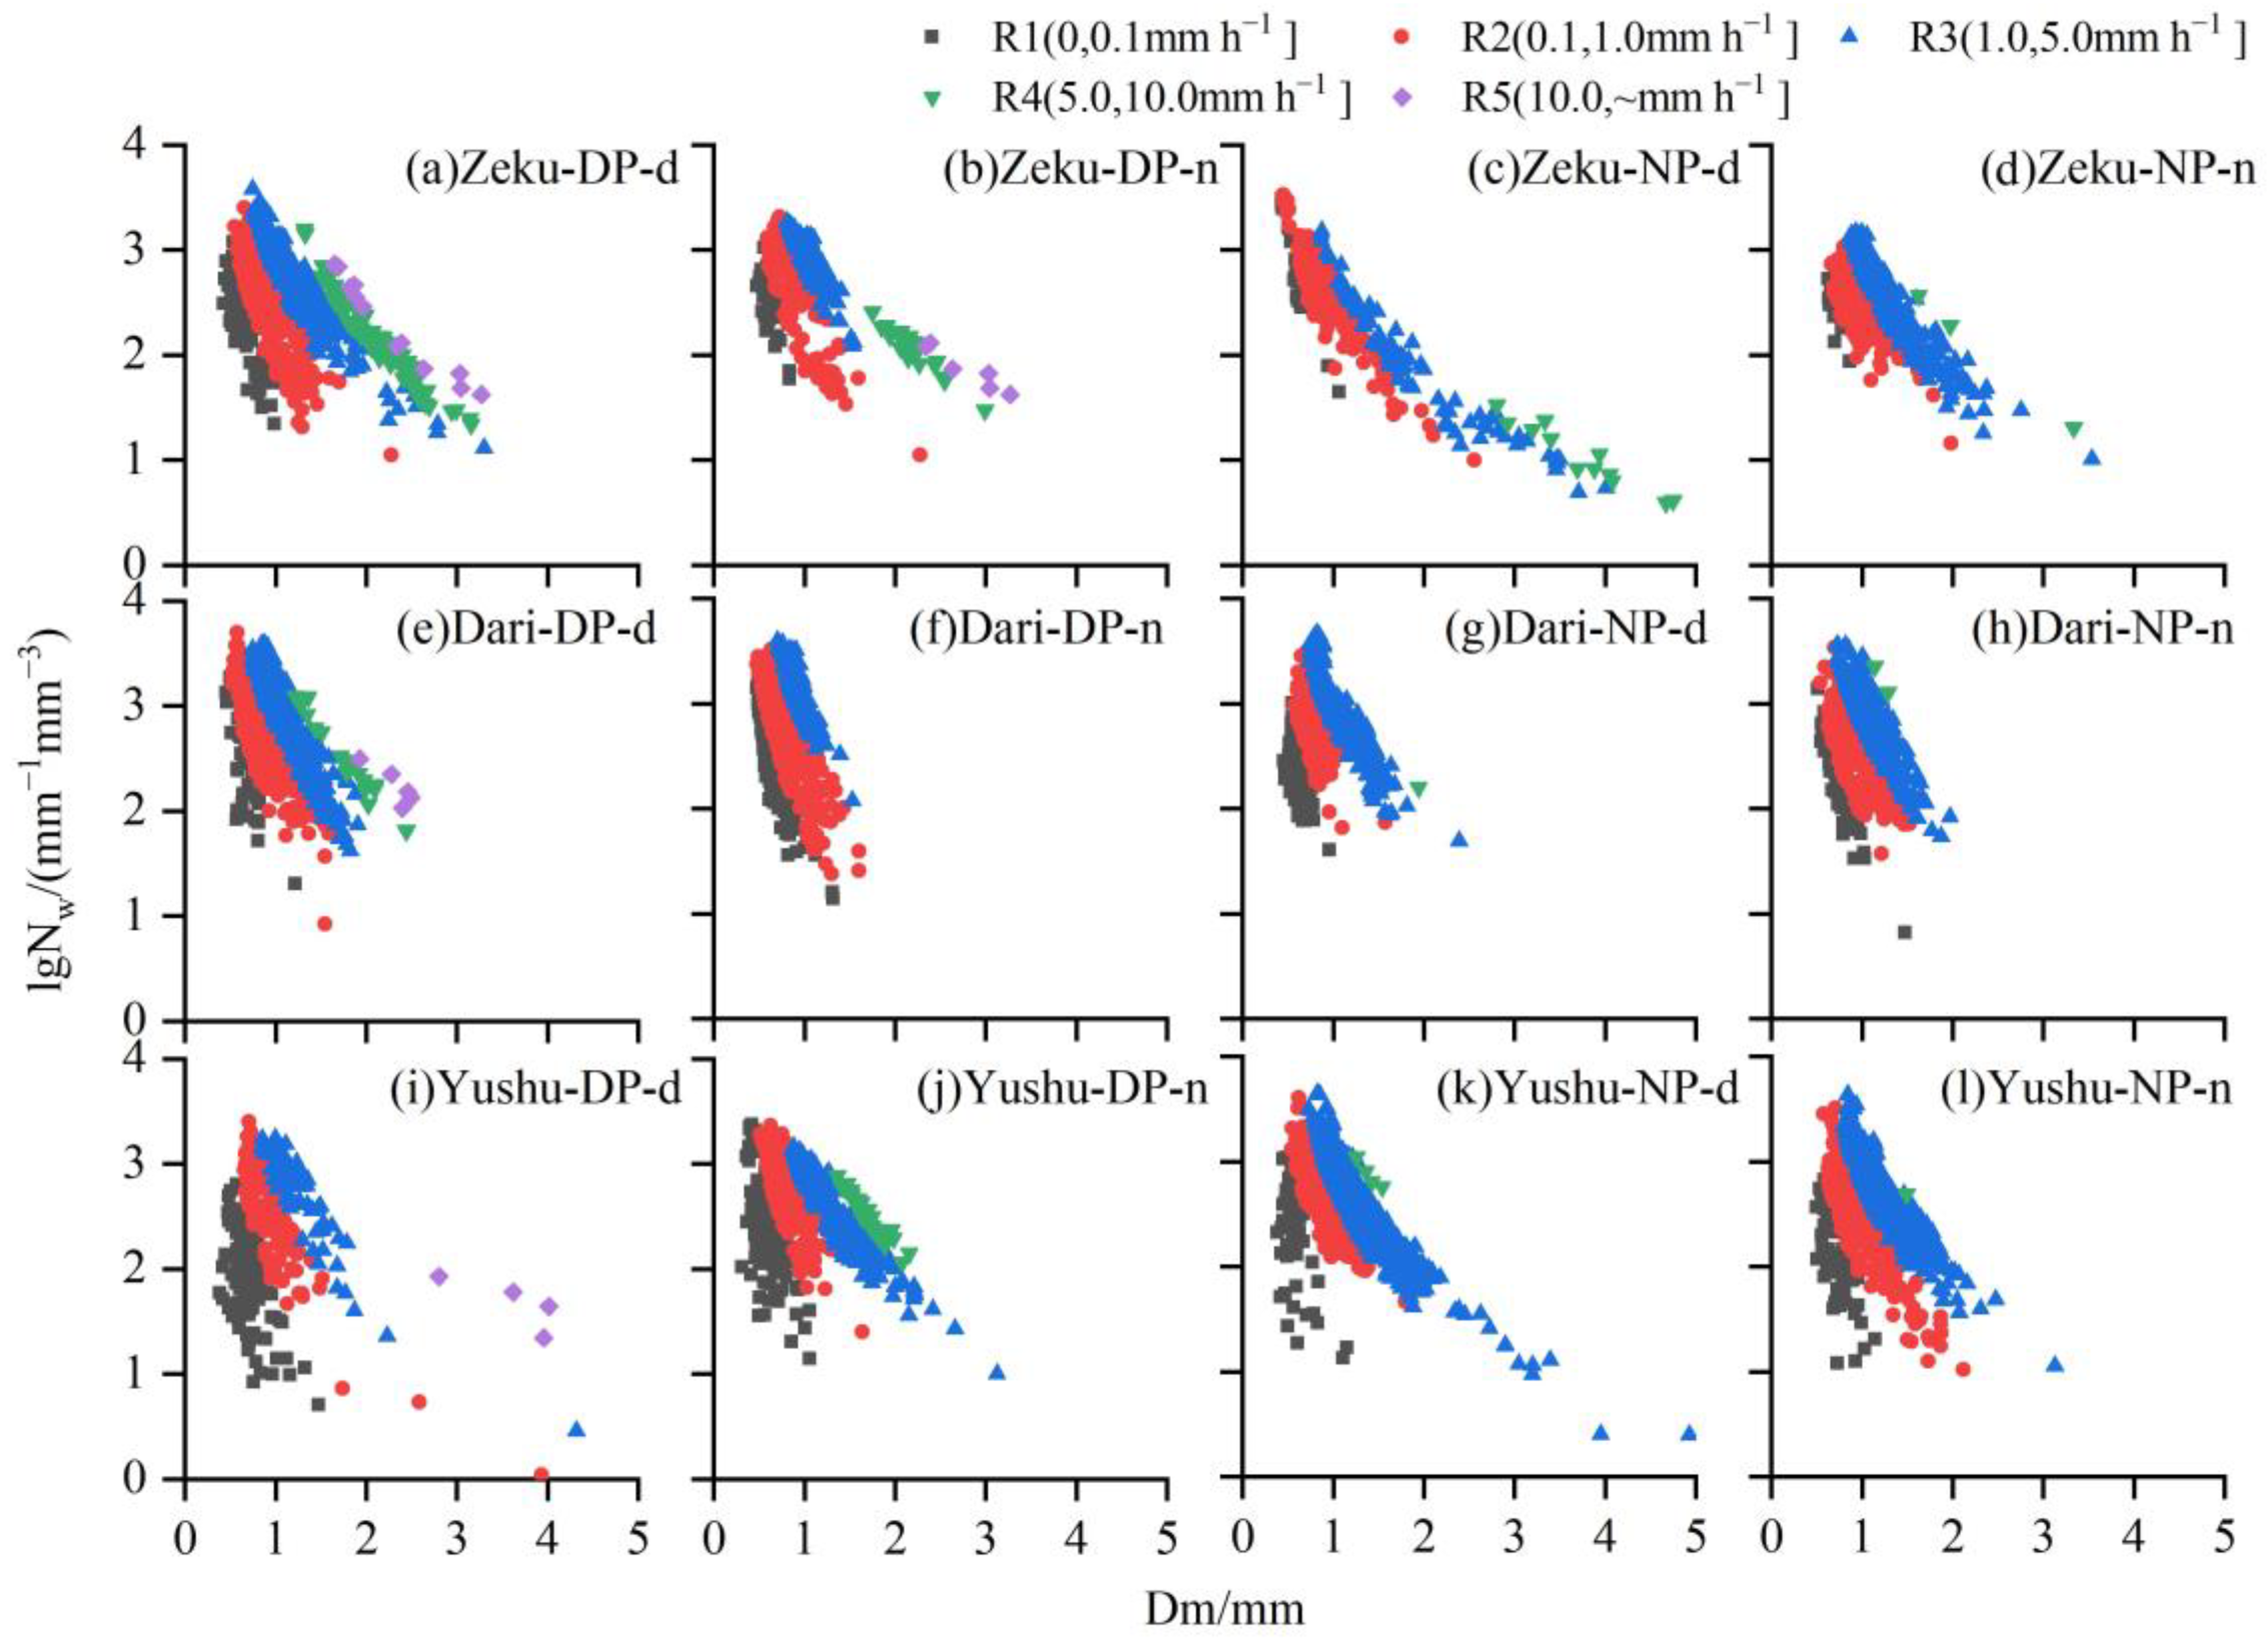
Figure 7 shows the scatter plots of the logarithm of the generalized intercept parameter ( l g N w ) and D m for different rain rates at the three stations. The two parameters can also reflect the mechanisms for precipitation formation and evolution [19,21]. The scatter plot displays a tendency of “downward to the right” as the rain rate increases. The rain-rate class of R5 predominates in the DP-d and DP-n. In the Zeku and Yushu stations, the NP-d has greater D m values in classes of R3 and R4 than the DP-d.
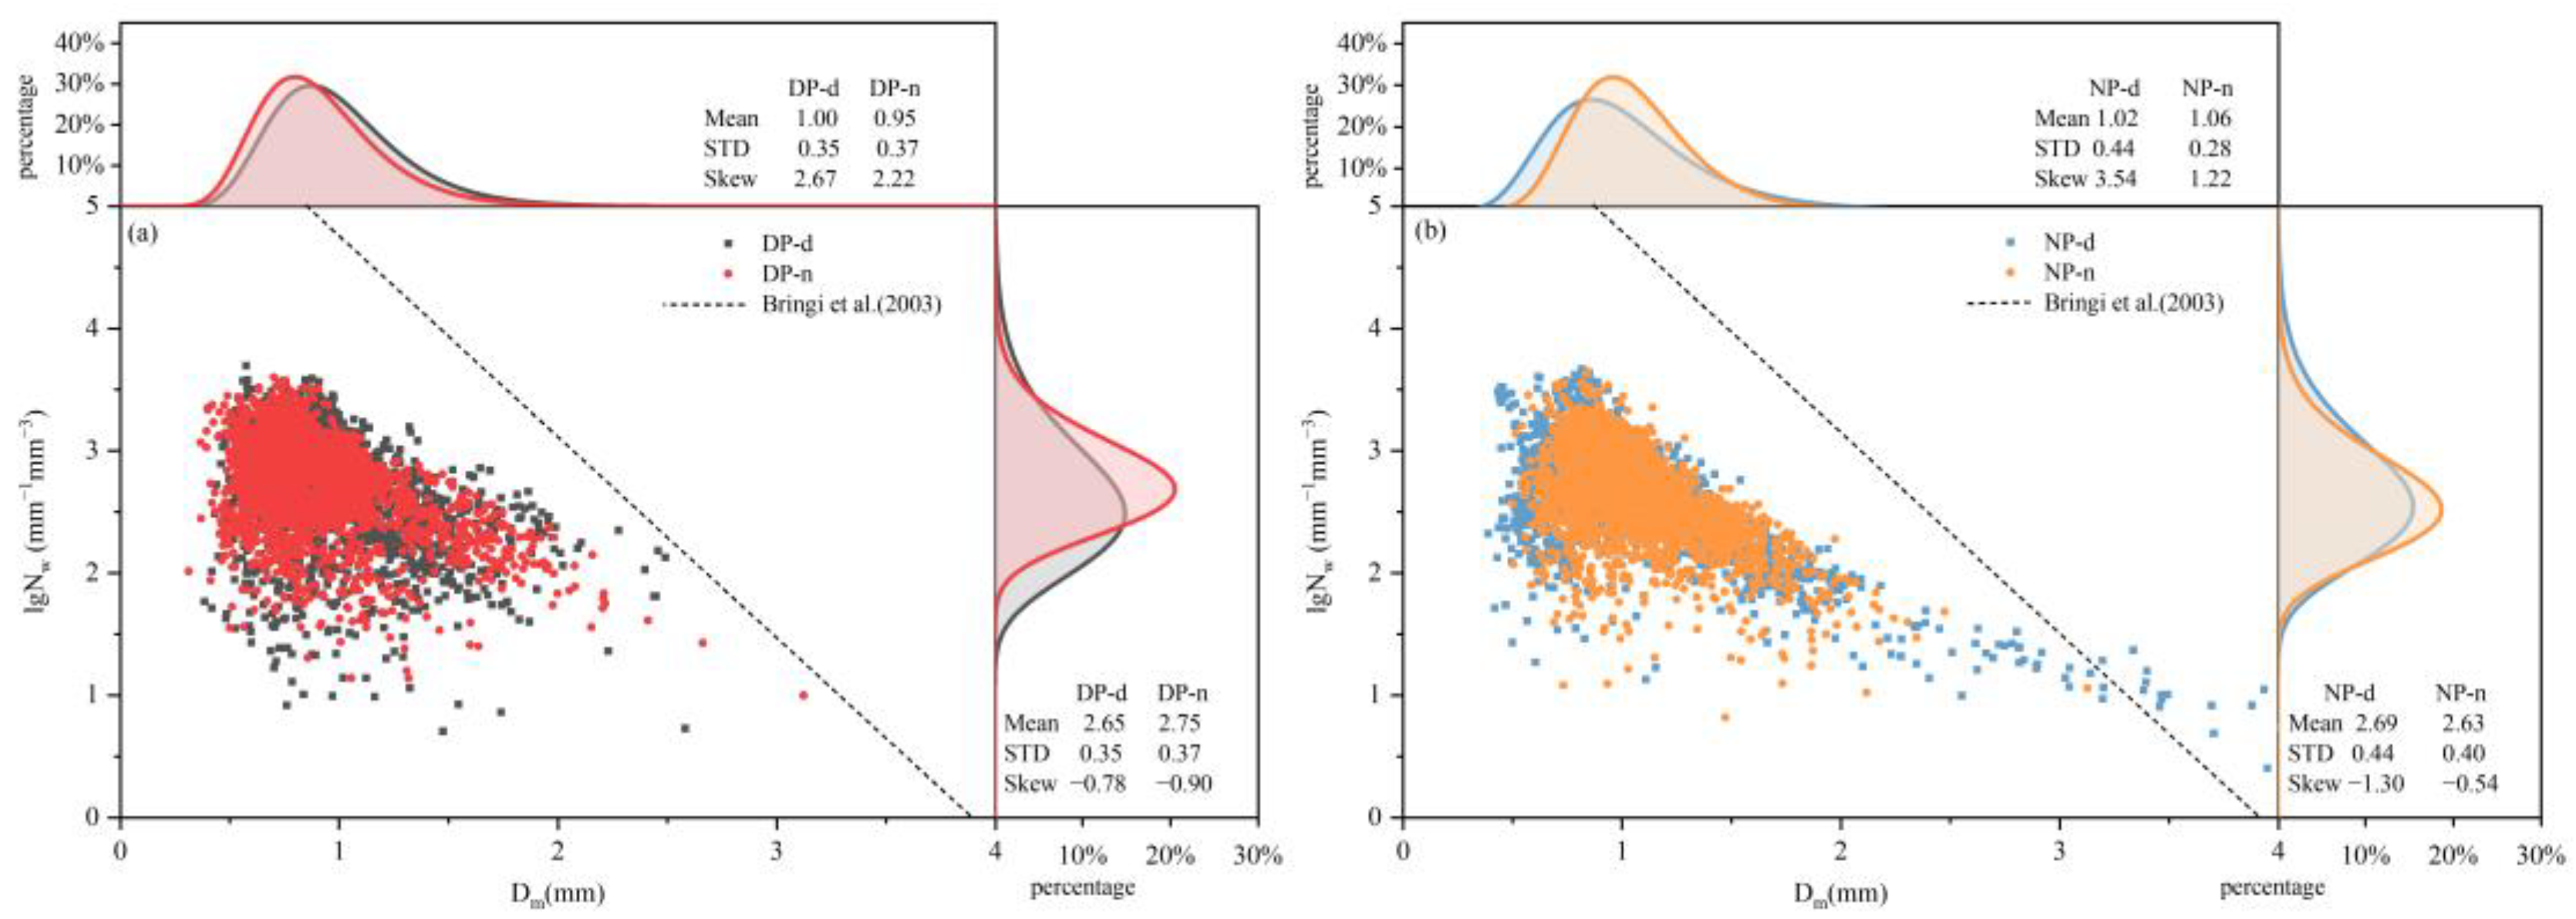
In this study, the mean value is 2.65 mm−1 mm−3 for l g N w and 1.04 mm for D m . Figure 8 shows the scatter plots of l g N w and D m for the four types of precipitation. Compared with the DP-d and DP-n, the D m values in the NP-d and NP-n appear in larger numerical regions. The degree of asymmetry in a distribution is expressed numerically as skewness. A positive (negative) skewness indicates the distribution is skewed to the right (left); that is, the distribution has a long tail on the right (left) side. A larger absolute value of skewness indicates greater deviation from the normal distribution.
The distribution of D m has a positive skewness, but that of l g N w has a negative skewness in the four types of precipitation. The skewness of the l g N w distribution in the NP-d is the largest. Figure 8b shows that the partial value in the NP-d is higher than that in Bringi et al. (2003) [21] for stratiform precipitation (blue rectangle). The standard deviations of D m and l g N w in the DP-n and NP-d are relatively larger, indicating that both D m and l g N w exhibit higher variability in the later stages of precipitation events.
For the D m - l g N w relation, a comparison has been made with previous studies. Figure 9 shows the scatter plots between D m and l g N w for different precipitation types. The average D m and l g N w of all six types (DP, NP, DP-d, DP-n, NP-n, and NP-d) are around the lower left side of the “stratiform line” given by Bringi et al. (2003) [21]. The findings of Han et al. (2023) [41] in the northeastern TP (red box) are consistent with our conclusions, but the value of l g N w in our study is lower than that on the eastern slope of the TP [32], the middle TP [30], and the northeastern TP [29]. Moreover, Wen et al. (2019) [25] showed that the average values of l g N w and D m for stratiform precipitation in eastern China are 3.78 mm−1 mm−3 and 1.16 mm, respectively. In our study, the two values are smaller than those in the plains areas of China.

3.4. Distributions of Dm and R

Figure 10 shows the scatter plots between D m and R , as well as the power–law relationships obtained by using the linear least squares fitting. The indexes of D m and R are all positive, indicating that the values of D m and R are larger at larger rain rates than at smaller rain rates. This can be attributed to more efficient merging and breaking mechanisms [30]. The indexes and coefficients in the NP are higher than those in the DP. The D m value in the NP is higher than that in the DP for a certain rain rate, which means that the raindrop diameter of night precipitation is larger at the same rain rate. The variation rate of indexes in the DP gradually decreased as R continued to increase. This result indicates that the breaking and merging of raindrops reach an equilibrium state when R increases to a certain extent, and under this state the increase in R is related to the number concentration of raindrops [21,42]. Additionally, both the DP and NP exhibit higher precipitation indexes and coefficients at night.
Wang et al. (2020) [32] studied the summer raindrop spectra at the Daocheng station in the eastern TP. Their results showed that after D m - R fitting, D m was 1.133 (1.038) and R was 0.2098 (0.1389) for convective (stratiform) precipitation. It can be seen that the indexes for convective (stratiform) precipitation at the Daocheng station are larger (smaller) than those in our study. There are two possible reasons. First, the Daocheng station has a lower latitude (3800 m asl) and is closer to the southeastern TP, where water vapor from the Indian Ocean has a greater influence on the target station and the water vapor conditions are more favorable [43]. Second, the two precipitation types selected in this study are more similar to stratiform precipitation.

3.5. Pre-Precipitation Characteristics

To examine the differences of precipitation characteristics at the initial and final stages of the two types of precipitation processes, the percentages of the R sample number and their contributions to the total amount in the first hour and last hour of the two types of precipitation processes are analyzed (Figure 11). It should be noted that the first hour and last hour of the precipitation process for the DP and NP are referred to as DP-d, DP-n, NP-n, and NP-d, respectively. Note that they do not include all data samples from the DP-d, DP-n, NP-n, and NP-d.
In the previous analysis, the raindrop spectrum was localized at three observation stations, and some common characteristics were detected in the initial and final stages of the precipitation processes, as illustrated in Figure 11. For NP precipitation, when the precipitation sample size exceeded 80%, the precipitation intensity distribution in the two periods (the beginning hour of precipitation and the end hour of precipitation) gradually tends to be consistent, and there are more heavy rain intensity samples in the beginning period of precipitation. For DP precipitation, when the sample proportion is 50–55%, the sample proportion line of the beginning hour of precipitation and the end hour of precipitation (Figure 11) has an intersection point, and both are at R = 0.83 ± 0.01mm h−1.
The DP-N and NP-N are both in the nighttime, with more precipitation samples exceeding 1 mm h−1. This is consistent with our findings that the percentages of R2 and R3 (0.1–1.0 mm h−1 and 1.0–5.0 mm h−1) in the NP are higher than those in the DP (Figure 2). The contribution rate of R3 to the total precipitation duration is the largest (Figure 2b), accounting for 62%, and this contribution rate is higher than those in the NP and DP.
The heat, updraft, and lower atmospheric instability are stronger in the daytime over the TP, promoting the formation of more intense precipitation and even hail. Similar to Figure 10, the proportion and contribution rate of the two types of precipitation (DP and NP) in the total sample number are shown in Figure S1 in the Supplementary Materials, and the conclusion is consistent with Figure 2.

4. Conclusions

In this study, the differences between DP and NP over the northeastern TP are revealed from the perspective of the spectral characteristics of raindrops. The precipitation samples with longer durations were selected. Observations from three raindrop spectrometers were used to analyze the DSD, rainfall intensity, and raindrop spectral width during the DP and NP at five rain-rate classes over the northeastern TP in summer. The objective was to reveal the possible reasons for stronger nighttime precipitation in this region.
The rainfall amount of 1.0–5.0 mm h−1 contributes the most to total amount, with an average contribution rate of 62%, and the contribution rate in the NP is about 18% higher than that in the DP. The overall precipitation amount was larger at night, while the precipitation was more extreme in the daytime. The raindrop spectra of all five rain-rate classes were all single peaked, and l g N w increased with increasing D m . All spectral widths were higher in the DP-n than in the DP-d for the same rain rate, and the N ( D ) in the DP-n was higher than that in the DP-d when D > 1.5 mm. For a given rain rate, the NP has higher D m values than the DP.
The power–law relationship between D m and R was obtained through linear least square fitting. The D m - R indexes were all positive, indicating that the D m and N w values were higher at larger rain rates than those at smaller rain rates, which is caused by more efficient merging and breaking mechanisms. The Gamma distribution function performs a better fitting effect than the M-P distribution function for the two types of precipitation.
A second-order polynomial equation was used to describe the μ - λ relation. The average D m and l g N w of the six types (DP, NP, DP-d, DP-n, NP-n, and NP-d) were around the lower left side of the “stratiform line” given by Bringi et al. (2003) [21]. The values of l g N w and D m over the northeastern TP in this study are smaller than those in the plains areas of China according to the conclusions of previous studies. Different precipitation starting times also affect raindrop characteristics. For a given rain rate, the D m value in the NP was higher than that in the DP, indicating that the raindrop diameter in the NP was larger and the raindrop spectrum was wider at the same rain rate.
By comparing the NP and DP, as well as their respective daytime and nighttime parts, it was found that the NP over the TP is stronger, reflected in the following two aspects. First, the sample size of the rain rate within 1.0–5.0 mm h−1 is larger in the NP, and rainfall amount at this rain rate contributes the most to the total amount. For both types, relatively larger rain rates are found in the nighttime period of some rainfall samples, even during the middle and late stages of the NP. Second, the raindrop particles in the nighttime period are larger at the same rain rate.
It was also found that the characteristics of the raindrop spectrum in the NP are more localized over the TP, but there are still some common characteristics. More precipitable water vapor is found at night due to the thermal effect between the TP and the Hindustan Plain [44]. The nighttime radiation cooling of cloud tops causes the condensation of a large amount of water vapor, thereby producing nighttime precipitation [45] and causing high relative humidity in the NP. Different sample selection techniques are suggested in this study compared to previous research. The results are still not fully resolved because of the small number of data samples. However, we aim to be able to offer another way for other researchers to choose raindrop spectrum observation data samples. This study mainly focuses on the NP characteristics in the northeastern TP from the perspective of the raindrop spectrum, but the precipitation characteristics and formation mechanisms over the whole TP need to be further explored using more observations and methodologies, which will be the task in our next study.

Supplementary Materials

The following supporting information can be downloaded at: https://www.mdpi.com/article/10.3390/atmos15010041/s1, Figure S1. Histogram and cumulative frequency curves of all precipitation intensity distributions for the two types of precipitation (DP and NP).

Author Contributions

Conceptualization and methodology, H.H.; writing—original draft preparation, Y.Z. and H.H.; writing—review and editing, Y.Z., H.H., B.Z. and Y.H. All authors have read and agreed to the published version of the manuscript.

Funding

This study is jointly sponsored by the Second Tibetan Plateau Atmospheric Sciences Experiment (STEP) (Grant NO. 2019QZKK010406) and the Science and Technology Program of Qinghai, China (Grant No. 2021-ZJ-745). The authors gratefully thank the reviewers for their precise and constructive remarks, which significantly helped improve the manuscript.

Institutional Review Board Statement

Not applicable.

Informed Consent Statement

Not applicable.

Data Availability Statement

The data presented in this study are available on request from the corresponding author ([email protected]). The data are not publicly available due to legal/ethical.

Conflicts of Interest

The authors declare no conflicts of interest.

References

  1. Yanai, M.; Li, C. Mechanism of heating and the boundary layer over the Tibetan Plateau. Mon. Wea. Rev. 1994, 122, 305–323. [Google Scholar]
  2. Ueno, K.; Fujii, H.; Yamada, H.; Liu, L. Weak and frequent monsoon precipitation over the Tibetan Plateau. J. Meteorol. Soc. Japan. Ser. II 2001, 79, 419–434. [Google Scholar] [CrossRef]
  3. Cheng, Q.; Gao, L.; Zuo, X.; Zhong, F. Statistical analyses of spatial and temporal variabilities in total, daytime, and nighttime precipitation indices and of extreme dry/wet association with large-scale circulations of southwest China, 1961–2016. Atmos. Res. 2019, 219, 166–182. [Google Scholar] [CrossRef]
  4. Fujinami, H.; Yasunari, T. The seasonal and intraseasonal variability of diurnal cloud activity over the Tibetan Plateau. J. Meteorol. Soc. Japan. Ser. II 2001, 79, 1207–1227. [Google Scholar] [CrossRef]
  5. Zhou, C.; Wang, K. Contrasting daytime and nighttime precipitation variability between observations and eight reanalysis products from 1979 to 2014 in China. J. Clim. 2017, 30, 6443–6464. [Google Scholar] [CrossRef]
  6. Feng, S.; Fu, Y.; Xiao, Q. Is the tropopause higher over the Tibetan Plateau? observational evidence from constellation observing system for meteorology, ionosphere, and climate (cosmic) data. J. Geophys. Res. Atmos. 2011, 116, D21121. [Google Scholar] [CrossRef]
  7. Yu, R.; Zhou, T.; Xiong, A.; Zhu, Y.; Li, J. Diurnal variations of summer precipitation over contiguous China. Geophys. Res. Lett. 2007, 34. [Google Scholar] [CrossRef]
  8. Sugimoto, S.; Ueno, K. Formation of mesoscale convective systems over the eastern Tibetan Plateau affected by plateau-scale heating contrasts. J. Geophys. Res. Atmos. 2010, 115, D16. [Google Scholar] [CrossRef]
  9. Barros, A.P.; Kim, G.; Williams, E.; Nesbitt, S.W. Probing orographic controls in the Himalayas during the monsoon using satellite imagery. Nat. Hazards Earth Syst. Sci. 2004, 4, 29–51. [Google Scholar] [CrossRef]
  10. Fu, Y.; Liu, G.; Wu, G.; Yu, R.; Xu, Y.; Wang, Y.; Li, R.; Liu, Q. Tower mast of precipitation over the central Tibetan Plateau summer. Geophys. Res. Let. 2006, 33, L05802. [Google Scholar] [CrossRef]
  11. Uyeda, H.; Yamada, H.; Horikomi, J.; Shirooka, R.; Shimizu, S.; Liping, L.; Ueno, K.; Fujii, H.; Koike, T. Characteristics of convective clouds observed by a doppler radar at Naqu on Tibetan Plateau during the GAME-Tibet IOP. J. Meteorol. Soc. Japan. Ser. II 2001, 79, 463–474. [Google Scholar] [CrossRef]
  12. Fujinami, H.; Nomura, S.; Yasunari, T. Characteristics of Diurnal Variations in Convection and Precipitation over the Southern Tibetan Plateau during Summer. SOLA 2005, 1, 49–52. [Google Scholar] [CrossRef]
  13. You, Q.; Kang, S.; Aguilar, E.; Yan, Y. Changes in daily climate extremes in the eastern and central Tibetan Plateau during 1961–2005. J. Geophys. Res. Atmos. 2008, 113, D7. [Google Scholar] [CrossRef]
  14. Zeng, C.; Zhang, F.; Wang, L.; Chen, D. Summer precipitation characteristics on the southern Tibetan Plateau. Int. J. Climatol. 2021, 41, E3160–E3177. [Google Scholar] [CrossRef]
  15. Sugimoto, S.; Ueno, K.; Sha, W. Transportation of water vapor into the Tibetan Plateau in the case of a passing synoptic-scale trough. J. Meteorol. Soc. Japan. Ser. II 2008, 86, 935–949. [Google Scholar] [CrossRef]
  16. Li, Y.; Yu, R.; Xu, Y.; Zhang, X. Spatial distribution and seasonal variation of cloud over china based on isccp data and surface observations. J. Meteorol. Soc. Japan. Ser. II 2004, 82, 761–773. [Google Scholar] [CrossRef]
  17. Ueno, K.; Takano, S.; Kusaka, H. Nighttime precipitation induced by a synoptic-scale convergence in the central Tibetan Plateau. J. Meteorol. Soc. Japan. Ser. II 2009, 87, 459–472. [Google Scholar] [CrossRef]
  18. Shimizu, S.; Ueno, K.; Fujii, H.; Yamada, H.; Shirooka, R.; Liu, L. Mesoscale characteristics and structures of stratiform precipitation on the Tibetan Plateau. J. Meteorol. Soc. Japan. Ser. II 2001, 79, 435–461. [Google Scholar] [CrossRef]
  19. Nitta, T. Observational Study of Heat Sources Over the Eastern Tibetan Plateau during the Summer Monsoon. J. Meteorol. Soc. Japan. Ser. II 1983, 61, 590–605. [Google Scholar] [CrossRef]
  20. Liu, L.P.; Feng, J.M.; Rong, Z.C.; Yun, J.Z.; Ueno, K. The diurnal variation of precipitation in monsoon season in the Tibetan Plateau. Adv. Atmos. Sci. 2002, 19, 365–378. [Google Scholar]
  21. Bringi, V.N.; Chandrasekar, V.; Hubbert, J.; Gorgucci, E.; Randeu, W.L.; Schoenhuber, M. Raindrop size distribution in different climatic regimes from disdrometer and dual-polarized radar analysis. J. Atmos. Sci. 2003, 60, 354–365. [Google Scholar] [CrossRef]
  22. Jia, X.; Liu, Y.; Ding, D.; Ma, X.; Chen, Y.; Bi, K.; Tian, P.; Lu, C.; Quan, J. Combining disdrometer, microscopic photography, and cloud radar to study distributions of hydrometeor types, size and fall velocity. Atmos. Res. 2019, 228, 176–185. [Google Scholar] [CrossRef]
  23. Miriovsky, B.J.; Bradley, A.A.; Eichinger, W.E.; Krajewski, W.F.; Kruger, A.; Nelson, B.R.; Creutin, J.D.; Lapetite, J.M.; Lee, W.G.; Zawadzkj, T.; et al. An Experimental Study of Small-Scale Variability of Radar Reflectivity Using Disdrometer Observations. J. App. Meteorol. 2004, 43, 106–118. [Google Scholar] [CrossRef]
  24. Lyu, J.J.; Xiao, H.W.; Du, Y.C.; Sha, L.; Deng, Y.Q.; Jia, W.K.; Niu, S.J.; Zhou, Y.; Pang, G.Q. Variations of raindrop size distribution and radar retrieval in outer rainbands of Typhoon Mangkhut (2018). J. Meteor. Res. 2022, 36, 500–519. [Google Scholar] [CrossRef]
  25. Wen, L.; Zhao, K.; Wang, M.; Zhang, G. Seasonal Variations of Observed Raindrop Size Distribution in East China. Adv. Atmos. Sci. 2019, 36, 346–362. [Google Scholar] [CrossRef]
  26. Tang, Q.; Xiao, H.; Guo, C.; Feng, L. Characteristics of the raindrop size distributions and their retrieved polarimetric radar parameters in northern and southern China. Atmos. Res. 2014, 135–136, 59–75. [Google Scholar] [CrossRef]
  27. Niu, S.; Jia, X.; Sang, J.; Liu, X.; Lu, C.; Liu, Y. Distributions of Raindrop Sizes and Fall Velocities in a Semiarid Plateau Climate: Convective versus Stratiform Rains. J. Appl. Meteorol. Climatol. 2010, 49, 632–645. [Google Scholar] [CrossRef]
  28. Wu, Z.; Zhang, Y.; Zhang, L.; Lei, H.; Xie, Y.; Wen, L.; Yang, J. Characteristics of summer season raindrop size distribution in three typical regions of western Pacific. J. Geophys. Res. Atmos. 2019, 124, 4054–4073. [Google Scholar] [CrossRef]
  29. Li, Q.; Wei, J.; Yin, J.; Qiao, Z.; Cao, J.; Shi, Y. Microphysical characteristics of raindrop size distribution and implications for radar rainfall estimation over the northeastern Tibetan Plateau. J. Geophys. Res. Atmos. 2022, 127, e2021JD035575. [Google Scholar] [CrossRef]
  30. Chen, B.; Hu, Z.; Liu, L.; Zhang, G. Raindrop Size Distribution Measurements at 4500 m on the Tibetan Plateau During TIPEX-III. J. Geophys. Res. Atmos. 2017, 122, 11,092–11,106. [Google Scholar] [CrossRef]
  31. Porcù, F.; D’ Adderio, L.P.; Prodi, F.; Caracciolo, C. Rain drop size distribution over the Tibetan Plateau. Atmos. Res. 2014, 150, 21–30. [Google Scholar] [CrossRef]
  32. Wang, Y.; Zheng, J.; Cheng, Z.; Wang, B. Characteristics of raindrop size distribution on the eastern slope of the Tibetan Plateau in summer. Atmosphere 2020, 11, 562. [Google Scholar] [CrossRef]
  33. Yuter, S.E.; Kingsmill, D.E.; Nance, L.B.; Löffler-Mang, M. Observations of Precipitation Size and Fall Speed Characteristics within Coexisting Rain and Wet Snow. J. App. Meteorol. Clim. 2006, 45, 1450–1464. [Google Scholar] [CrossRef]
  34. Battaglia, A.; Rustemeier, E.; Tokay, A.; Blahak, U.; Simmer, C. Parsivel snow observations: A critical assessment. Atmos. Ocean. Technol. 2010, 27, 333–344. [Google Scholar] [CrossRef]
  35. Marshall, J.S.; Palmer, W.M. The distribution of rain drops with size. J. Meteorol. 1948, 5, 165–166. [Google Scholar] [CrossRef]
  36. Vivekanandan, J.; Zhang, G.; Brandes, E. Polarimetric Radar Estimators Based on a Constrained Gamma Drop Size Distribution Model. J. Appl. Meteorol. Climatol. 2004, 43, 217–230. [Google Scholar] [CrossRef]
  37. Ulbrich, C.W. Natural Variations in the Analytical Form of the Raindrop Size Distribution. J. Clim. Appl. Meteorol. 1983, 22, 1764–1775. [Google Scholar] [CrossRef]
  38. Lü, J.J.; Zhou, Y.; Fu, Z.K.; Lu, C.S.; Huang, Q.; Sun, J.; Zhao, Y.; Niu, S.J. Variability of raindrop size distribution during a regional freezing rain event in the Jianghan Plain of central China. Adv. Atmos. Sci. 2023, 40, 725–742. [Google Scholar] [CrossRef]
  39. Chen, B.; Yang, J.; Pu, J. Statistical Characteristics of Raindrop Size Distribution in the Meiyu Season Observed in Eastern China. J. Meteorol. Soc. Japan. Ser. II 2013, 91, 215–227. [Google Scholar] [CrossRef]
  40. Fu, Z.; Dong, X.; Zhou, L.; Cui, W.; Wang, J.; Wan, R.; Liang, L.; Xi, B. Statistical Characteristics of Raindrop Size Distributions and Parameters in Central China During the Meiyu Seasons. J. Geophys. Res. Atmos. 2020, 125, e2019JD031954. [Google Scholar] [CrossRef]
  41. Han, H.B.; Zhang, Y.X.; Tian, J.B.; Kang, X.Y. Raindrop size distribution measurements at high altitudes in the Northeastern Tibetan Plateau during summer. Adv. Atmos. Sci. 2023, 40, 1244–1256. [Google Scholar] [CrossRef]
  42. Hu, Z.; Srivastava, R.C. Evolution of Raindrop Size Distribution by Coalescence, Breakup, and Evaporation: Theory and Observations. J. Atmos. Sci. 1995, 52, 1761–1783. [Google Scholar] [CrossRef]
  43. Feng, L.; Zhou, T. Water vapor transport for summer precipitation over the Tibetan Plateau: Multidata set analysis. J. Geophys. Res. Atmos. 2012, 117, D20114. [Google Scholar] [CrossRef]
  44. Taichi Sasaki, T.; Wu, P.; Kimura, F.; Yoshikane, T.; Liu, J. Drastic Evening Increase in Precipitable Water Vapor over the Southeastern Tibetan Plateau. J. Meteorol. Soc. Japan. Ser. II 2003, 81, 1273–1281. [Google Scholar] [CrossRef]
  45. Lin, X.; Randall, D.A.; Fowler, L.D. Diurnal Variability of the Hydrologic Cycle and Radiative Fluxes: Comparisons between Observations and a GCM. J. Clim. 2000, 13, 4159–4179. [Google Scholar] [CrossRef]
Figure 1. Geographical locations of the observation stations.
Atmosphere 15 00041 g001
Figure 2. (a,c,e) Accumulated durations and (b,d,f) rainfall amounts for the five rain-rate classes. The percentages indicate the contributions of each rain rate class to the total duration and rainfall amount.
Atmosphere 15 00041 g002
Figure 3. Variations of the average number concentration of raindrops with the raindrop diameter in precipitation events lasting from daytime to nighttime (DP) and precipitation events lasting from nighttime to daytime (NP).
Atmosphere 15 00041 g003
Figure 4. Variations of the average number concentration of raindrops with the raindrop diameters at different rain rates.
Atmosphere 15 00041 g004
Figure 5. Observed (black lines) and fitting (blue lines indicate the fitting curve using the gamma distribution, and red lines using the M-P distribution) curves for raindrop spectra at the three observation stations.
Atmosphere 15 00041 g005
Figure 6. The μ - λ relations in (a) the daytime part of the DP (DP-d) and the nighttime part of the DP (DP-n), and (b) the daytime part of the NP (NP-d) and the nighttime part of the NP (NP-n). The gray dots are the filtered data sets. The red and blue lines are the μ - λ relations in this paper. The dotted green line represents the relation in the northern TP proposed by Wang et al. (2020) [32], λ = 0.0302 μ 2 + 0.724 μ + 1.139 . The dotted orange line is the relation in the northeastern TP proposed by Li et al. (2021) [29], λ = 0.0365 μ 2 + 0.735 μ + 1.935 . The dotted brown line is the relation in eastern China proposed by Chen et al. (2013) [39], λ = 0.0149 μ 2 + 0.491 μ + 2.015 . The purple dotted line is the relation in central China proposed by Fu et al. (2020) [40], λ = 0.052 μ 2 + 0.771 μ + 1.504 .
Atmosphere 15 00041 g006
Figure 7. Scatter plots of the logarithm of the generalized intercept parameter ( l g N w ) and the mass-weighted mean diameter ( D m ) at different rain rates at the three stations. D m represents the average diameter of all raindrops in a certain period, and N w denotes the number concentration of all raindrops.
Atmosphere 15 00041 g007
Figure 8. Scatter plots between l g N w and D m in (a) DP-d and DP-n, and (b) NP-d and NP-n. The black dashed line is the stratiform line proposed by Bringi et al. (2003) [21].
Atmosphere 15 00041 g008
Figure 9. Scatter plots between D m and l g N w . The six dots represent the six types (DP, NP, DP-d, DP-n, NP-n, and NP-d). The blue rectangle represents the mean values of D m and l g N w over the northeastern Tibetan Plateau (TP) in summer, as reported by Han et al. (2023) [41]. The two gray rectangles correspond to the maritime and continental convective clusters, respectively, as reported by Bringi et al. (2003) [21]. The black dashed line is the stratiform line by Bringi et al. (2003) [21]. The gray dashed line is the Marshall–Palmer value of l g N w (3.9) for the exponential shape. The red rectangle, blue cross, green triangle, and purple inverted triangle represent the results obtained in other regions, respectively, namely, along the eastern slope of TP by Wang et al. (2021) [32], the middle TP by Chen et al. (2017) [30], the northeastern TP by Li et al. (2022) [29], and eastern China by Wen et al. (2019) [25].
Atmosphere 15 00041 g009
Figure 10. (a,b) Scatter plots of D m and R . The gray line is the result after linear least squares fitting.
Atmosphere 15 00041 g010
Figure 11. Histograms of rainfall intensity distribution and the cumulative frequency curves in the first hour and last hour of the DP (a,c,e), and NP (b,d,f). In (a,c,e), the gray dashed lines show the intersection of the first and last hour of the DP events.
Atmosphere 15 00041 g011
Table 1. General features of raindrop spectral samples.
LocationAltitude (m)DateDPNP
Number of SamplesNumber of Samples
Zeku3663August 2019–October 2019,
May 2020–June 2020
14141505
Dari3967June 2018–October 201825001964
Yushu4290May 2014–September 201414512617
Table 2. Microphysical parameters of raindrop spectra for different rainfall events. R denotes the rain rate (mm h−1); N ( D ) denotes the number concentration of raindrops (m−3 mm−1); D m denotes the mass-weighted mean diameter of the particles (mm), and W denotes the rainwater content (mg m−3).
LocationRain TypeR (mm·h−1)N(D) (m−3·mm−1)Dm (mm)W (mg·m−3)
ZekuDP1.292233.70 3.06 0.08
NP1.342810.30 3.64 0.06
DariDP0.772442.90 3.52 0.06
NP0.922763.60 3.67 0.07
YushuDP1.062366.00 3.12 0.07
NP1.183029.50 3.690.08
Total1.10 2607.67 3.45 0.07
Disclaimer/Publisher’s Note: The statements, opinions and data contained in all publications are solely those of the individual author(s) and contributor(s) and not of MDPI and/or the editor(s). MDPI and/or the editor(s) disclaim responsibility for any injury to people or property resulting from any ideas, methods, instructions or products referred to in the content.