Article

Interdecadal Change in the Covariability of the Tibetan Plateau and Indian Summer Precipitation and Associated Circulation Anomalies

1
State Key Laboratory of Severe Weather, and Institute of Tibetan Plateau Meteorology, Chinese Academy of Meteorological Sciences, Beijing 100081, China
2
Collaborative Innovation Centre on Forecast and Evaluation of Meteorological Disasters, Nanjing University of Information Science and Technology, Nanjing 210044, China
*
Author to whom correspondence should be addressed.
Atmosphere 2024, 15(1), 117; https://doi.org/10.3390/atmos15010117
Submission received: 18 December 2023 / Revised: 13 January 2024 / Accepted: 16 January 2024 / Published: 19 January 2024

Abstract

:
This study investigates the interdecadal change in the covariability between the Tibetan Plateau (TP) east–west dipole precipitation and Indian precipitation during summer and primarily explores the modulation of atmospheric circulation anomalies on the covariability. The results reveal that the western TP precipitation (WTPP), eastern TP precipitation (ETPP), and northwestern Indian precipitation (NWIP) have covariability, with an in-phase variation between the WTPP and NWIP and an out-of-phase variation between the WTPP and ETPP. Moreover, this covariability was unclear during 1981–2004 and became significant during 2005–2019, showing a clear interdecadal change. During 2005–2019, a thick geopotential height anomaly, which tilted slightly northward, governed the TP, forming upper- and lower-level coupled circulation anomalies (i.e., anomalous upper-level westerlies over the TP and lower-level southeasterlies and northeasterlies around the southern flank of the TP). As such, the upper- and lower-tropospheric circulation anomalies synergistically modulate the summer WTPP, ETPP, and NWIP, causing the covariability of summer precipitation over the TP and India during 2005–2019. The upper- or lower-level circulation anomalies cannot independently result in significant precipitation covariability. During 1981–2004, the upper- and lower-level circulation anomalies were not strongly coupled, which caused precipitation non-covariability. The sea surface temperature anomalies (SSTAs) in the western North Pacific (WNP) and tropical Atlantic (TA) may synergistically modulate the upper- and lower-level coupled circulation anomalies, contributing to the covariability of the WTPP, ETPP, and NWIP during 2005–2019. The modulation of the WNP and TA SSTs on the coupled circulation anomalies was weaker during 1981–2004, which was therefore not conducive to this precipitation covariability. This study may provide valuable insights into the characteristics and mechanisms of spatiotemporal variation in summer precipitation over the TP and its adjacent regions, thus offering scientific support for local water resource management, ecological environment protection, and social and economic development.

1. Introduction

The Tibetan Plateau (TP), located in the subtropics of the eastern Afro-Eurasian continent, is the highest plateau in the world, with an average elevation exceeding 4500 m and an area of approximately 2.5 million square kilometers [1]. The TP is also a source region of several major rivers in Asia, such as the Yangtze River, Yellow River, Mekong River, Indus, and Ganges, providing water resources for agriculture, industry, the ecological environment, and billions of people in Asia [2,3,4,5,6,7]. In addition, the summer thermal anomaly of the TP affects local and adjacent atmospheric circulation and associated climate variability [8,9] and remotely modulates climate variability over East Asia, the Pacific, Europe, and Africa [10,11,12,13,14,15,16,17,18]. The atmospheric thermal anomaly is generally linked with precipitation-related latent heat release. As such, anomalous precipitation patterns over the TP and adjacent regions may play a crucial role in modulating climate variability over local and broader areas through changing the pattern of thermal anomalies over the TP and surrounding areas. Therefore, it is of great importance to investigate the variation in summer precipitation patterns over the TP and adjacent areas and its causes.
Numerous studies have revealed that summer precipitation over the TP shows different patterns on different timescales [19,20,21,22,23,24]. For example, Liu et al. [21] found a north–south out-of-phase pattern, with more precipitation in the northern TP and less precipitation in the southern TP during 1961–2010, and revealed that this TP precipitation pattern is associated with the North Atlantic Oscillation (NAO). There is a clear southeast–northwest gradient in seasonal and annual precipitation and extreme daily precipitation over the TP [24]. Yu et al. [25] further indicated that the north–south dipole pattern of precipitation over the TP and surrounding highlands can be detected on various (diurnal, interannual, and interdecadal) timescales during 1966–2015. In addition to the north–south dipole pattern, the out-of-phase variation between summer precipitation over the eastern TP (ETP) and that over the western TP (WTP) is a dominant pattern on interannual timescales [26]. On interannual timescales, summer precipitation over the ETP negatively correlates with that over the WTP during 1981–2019, showing an east–west dipole pattern of TP precipitation [27]. Recently, Li et al. [28] reported that a similar east–west dipole pattern also appeared in the TP during the late summer (July and August) of 2022. Furthermore, the variation in summer precipitation over the TP is closely connected with that over the Indian continent, since anomalous condensation associated with TP precipitation is an important heat source driving Indian and East Asian summer monsoons [29,30,31], and the Indian summer monsoon can, in turn, affect precipitation over the TP [32,33]. Jiang and Ting [34] also confirmed that summer precipitation over the TP is negatively correlated with that over the Indian subcontinent, showing a dipole pattern between the TP and northern India.
Atmospheric circulation anomalies modulate precipitation anomalies in different regions around the TP and adjacent areas. The intensification and westward extension of the western North Pacific anticyclone can induce more water vapor into the southeastern TP and thus increase precipitation in summer [35]. The South Asian summer monsoon season brings water vapor into the TP and dominates summer precipitation over the southeast TP [5]. The India–Burma monsoon trough is strengthened when El Niño develops in summer, which prevents water vapor from entering the southwestern TP and thus decreases precipitation in the region [26]. Moreover, an upper-level anomalous cyclone to the west of the TP and the associated anomalous southwesterly contribute to the anomalous zonal dry air advection over the TP, which also suppresses precipitation over the southwestern TP [26]. During the eastern Pacific ENSOs, the southward-shifted South Asia high and subtropical westerlies cause an anomalous sinking motion and less precipitation over the southwestern TP [36]. An anomalous cyclone to the north of the TP and an anomalous anticyclone to the south of the TP contribute to the variability in the TP east–west dipole precipitation pattern during summer [27]. An “up-and-over” moist transport mechanism has been proposed to explain the close relationship between summer precipitation over the southwestern TP and that over central–eastern India [37]. Anomalous anticyclones over the Indian subcontinent and the Bay of Bengal favor more precipitation over the southeast TP by transporting more water vapor and suppress precipitation over the northern Indian subcontinent by reducing water vapor entering this region, thus causing a dipole pattern of TP and Indian summer precipitation [34].
Previous studies have revealed that TP summer precipitation shows two dominant patterns (i.e., the north–south and east–west dipole patterns). A few studies have also explored the relationship between summer precipitation in the TP and India. However, it remains unclear whether the TP precipitation patterns (especially the east–west dipole pattern) are closely connected with Indian precipitation and whether there are interdecadal changes in the connection between the TP east–west dipole pattern and Indian precipitation. The present study attempts to deeply understand the interdecadal change in the covariability between the TP east–west dipole pattern and Indian precipitation and to explore the modulation of circulation anomalies on the covariability.
The remainder of this paper is organized as follows. In Section 2, the data and methods are described. Section 3 analyzes the characteristics of the covariability of the TP and Indian summer precipitation and indicates an interdecadal difference in the covariability between the two periods 1981–2004 and 2005–2019. Section 4 explores the dominant circulation anomalies responsible for the covariability during 2005–2019 and explains the reason for non-covariability during 1981–2014. A discussion of the potential effect of sea surface temperatures (SSTs) in different oceans is given in Section 4. Finally, the conclusions are presented in Section 5.

2. Materials and Methods

The study area is the TP and its adjacent areas, as shown in Figure 1, in which the elevation was obtained from 2-minute gridded elevation data (ETOPO2) from the National Geophysical Data Center (NGDC), the National Oceanic and Atmosphere Administration (NOAA) [38]. Owing to the lack of meteorological stations in the TP (especially in the WTP), most precipitation products have poor reliability in this region. Therefore, we compared the consistency of several precipitation products with observational precipitation at three stations (Shiquanhe, Gaize, and Pulan) in the western TP. The observational precipitation data were obtained from the China National Meteorological Information Center. The other precipitation data include monthly precipitation version 2020 on 1.0° × 1.0° grids from the Global Precipitation Climatology Centre (GPCC) [39], monthly precipitation on 1.0° × 1.0° grids from the Global Precipitation Climatology Project (GPCP) version 2.3 [40], the Climate Research Unit’s (CRU) monthly precipitation on 0.5° × 0.5° grids [41], and the monthly precipitation on 0.25° × 0.25° grids from the ERA5 reanalysis [42]. The above precipitation data were extracted for the period from 1981 to 2019.
The comparison results indicate that the area-mean summer GPCC precipitation over the western TP (32–36° N, 78–86° E) has the most consistent variation with the observational station-mean precipitation, with a correlation coefficient of 0.94 (significant at the 99.9% confidence level) during 1981–2019. This correlation coefficient is much higher than that between CRU and observational precipitation (0.63), that between GPCP and observational precipitation (0.70), and that between ERA5 and observational precipitation (0.81). Clearly, of these precipitation products, GPCC precipitation is the most reliable over the western TP. Therefore, we mainly used GPCC precipitation in the following study. Monthly geopotential height and U- and V-wind datasets on 0.25° × 0.25° grids from the ERA5 reanalysis were used in this study [42], which is suitable for analyzing atmospheric circulation anomalies responsible for the precipitation pattern in the TP and its surroundings in a more nuanced manner. In addition, this study used the National Oceanic and Atmospheric Administration (NOAA) Extended Reconstructed SST (version 5), which is on 2.0° × 2.0° grids [43].
A linear fitting method can be applied to show the independent contribution of one factor after removing the variation in the other factor [44,45,46,47]. We used two running correlations to identify interdecadal changes in the relationship between two variables. One is the running correlation on constant 15-year windows. In this way, 1981 on the abscissa corresponds to the correlations during 1981–1995 (i.e., the 15-year window), 1982 on the abscissa corresponds to the correlations during 1982–2016 (i.e., the 15-year window), and so on. The other is the running correlation on reducing windows (i.e., from the period 1981–2019 to the period 2005–2019, with the window reducing year by year). Specifically, 1981 on the abscissa corresponds to the correlations during 1981–2019 (i.e., the 39-year window), 1982 on the abscissa corresponds to the correlations during 1982–2019 (i.e., the 38-year window), and so on. Finally, 2005 on the abscissa corresponds to the correlations during 2005–2019 (i.e., the 15-year window). The window for the running correlation decreases each year. Correspondingly, the dashed lines denoting the 95% confidence level gradually change with decreasing degrees of freedom. The running correlation on reducing windows can further identify the periods of interdecadal changes in the relationship between the two variables. Correlation and regression analyses were also used in this study. Unless otherwise stated, statistical significance was evaluated using the Student’s t test.

3. Results

3.1. Interdecadal Change in Covariability of TP and Indian Summer Precipitation

The area-mean precipitation averaged over the WTP (32–36° N, 78–86° E) was defined as the WTP precipitation (WTPP) index, which can be conveniently used to test the east–west dipole pattern of summer precipitation over the TP. The correlation between the summer WTPP index and simultaneous precipitation shows a significantly positive correlation over the WTP and a significantly negative correlation over the ETP, manifesting an east–west dipole pattern over the TP (Figure 2a). In addition, a small significantly positive correlation appears over northwestern India (NWI), around 28° N, 72° E (Figure 2a). We further performed correlation analyses for different periods. The results reveal that the area of significantly negative correlation in the ETP was small and negligible during 1981–2004 (Figure 2b), implying that the east–west dipole pattern was weaker during this period. The significantly positive correlation over NWI disappeared during 1981–2004 (Figure 2b).
In contrast, a larger and more significant negative correlation appeared over the ETP during 2005–2019 (Figure 2c), which indicates that the summer precipitation over the WTP and ETP shows more obvious out-of-phase changes and thus forms a clearer east–west dipole pattern during this period. Moreover, a larger and more significant positive correlation appeared over NWI during 2005–2019 (Figure 2c). This result signifies that the variation in precipitation over NWI is also coupled with the TP dipole precipitation pattern during 2005–2019. In other words, the summer precipitation over the three regions (the WTP, the ETP, and NWI) varied synergistically, showing a clear covariability during 2005–2019.
Next, we performed running correlation analyses to further verify the interdecadal change in the covariability of summer precipitation over the three regions. First, the area-mean precipitation averaged over the ETP (33–36° N, 89–101° E) and that over NWI (24–32° N, 71–76° E) were defined as the ETP precipitation (ETPP) and NWI precipitation (NWIP) indices, respectively. Figure 3a presents the running correlation coefficients on 15-year windows between the WTPP and ETPP indices (the black curve), which shows that the correlation coefficients remained around −0.30 (insignificant) before the mid-1990s. The negative correlation coefficients gradually decreased since the late 1990s and were maintained above −0.75 from 2002–2016 to 2005–2019, exceeding the 99% confidence level (the black curve in Figure 3a). The running correlation coefficients between the WTPP and NWIP indices showed drastic changes and did not reach the 95% confidence level until 2002 (the red curve in Figure 3a). After 2002, the WTPP and NWIP showed a stable and significant positive correlation, reaching the highest value from 2005 to 2019 (the red curve in Figure 3a).
Figure 3b shows the running correlation coefficients for the reducing windows. We can detect that the correlation coefficients between the WTPP and ETTP indices were only around −0.20 during 1981–2019, began to exceed the 95% confidence level from the mid-1990s to 2019, and reached the highest negative correlation coefficient during 2005–2019 (the black curve in Figure 3b). Similarly, the positive correlations between the WTPP and NWIP indices began to stably exceed the 95% confidence level from the mid-1990s to 2019 and reached the highest positive value during 2005–2019 (the red curve in Figure 3b).
The above two running correlation analyses both indicate that the covariability of summer precipitation over the WTP, ETP, and NWI was most remarkable during 2005–2019 and unclear during 1981–2004. This can also be visually seen in the time series of the normalized WTPP, ETPP, and NWIP indices for the two periods (Figure 4). For the period 2005–2019, the WTPP and ETPP indices clearly show out-of-phase variation (Figure 4a), with a correlation coefficient of −0.75 (significant at the 99% confidence level), and the WTPP and NWIP indices evidently show in-phase variation (Figure 4b), with a correlation coefficient of 0.85 (significant at the 99.9% confidence level). This result further reveals that the summer WTPP, ETPP, and NWIP formed a strong coupling pattern during 2005–2019. However, summer precipitation over the WTP, ETP, and NWI showed non-covariability during 1981–2004 (Figure 4c,d). For this period, the correlation coefficient between the WTPP and ETPP indices is only −0.18 (Figure 4c) and that between the WTPP and NWIP is approximately 0 (Figure 4d), both insignificant.

3.2. Reasons for Covariability and Non-Covariability

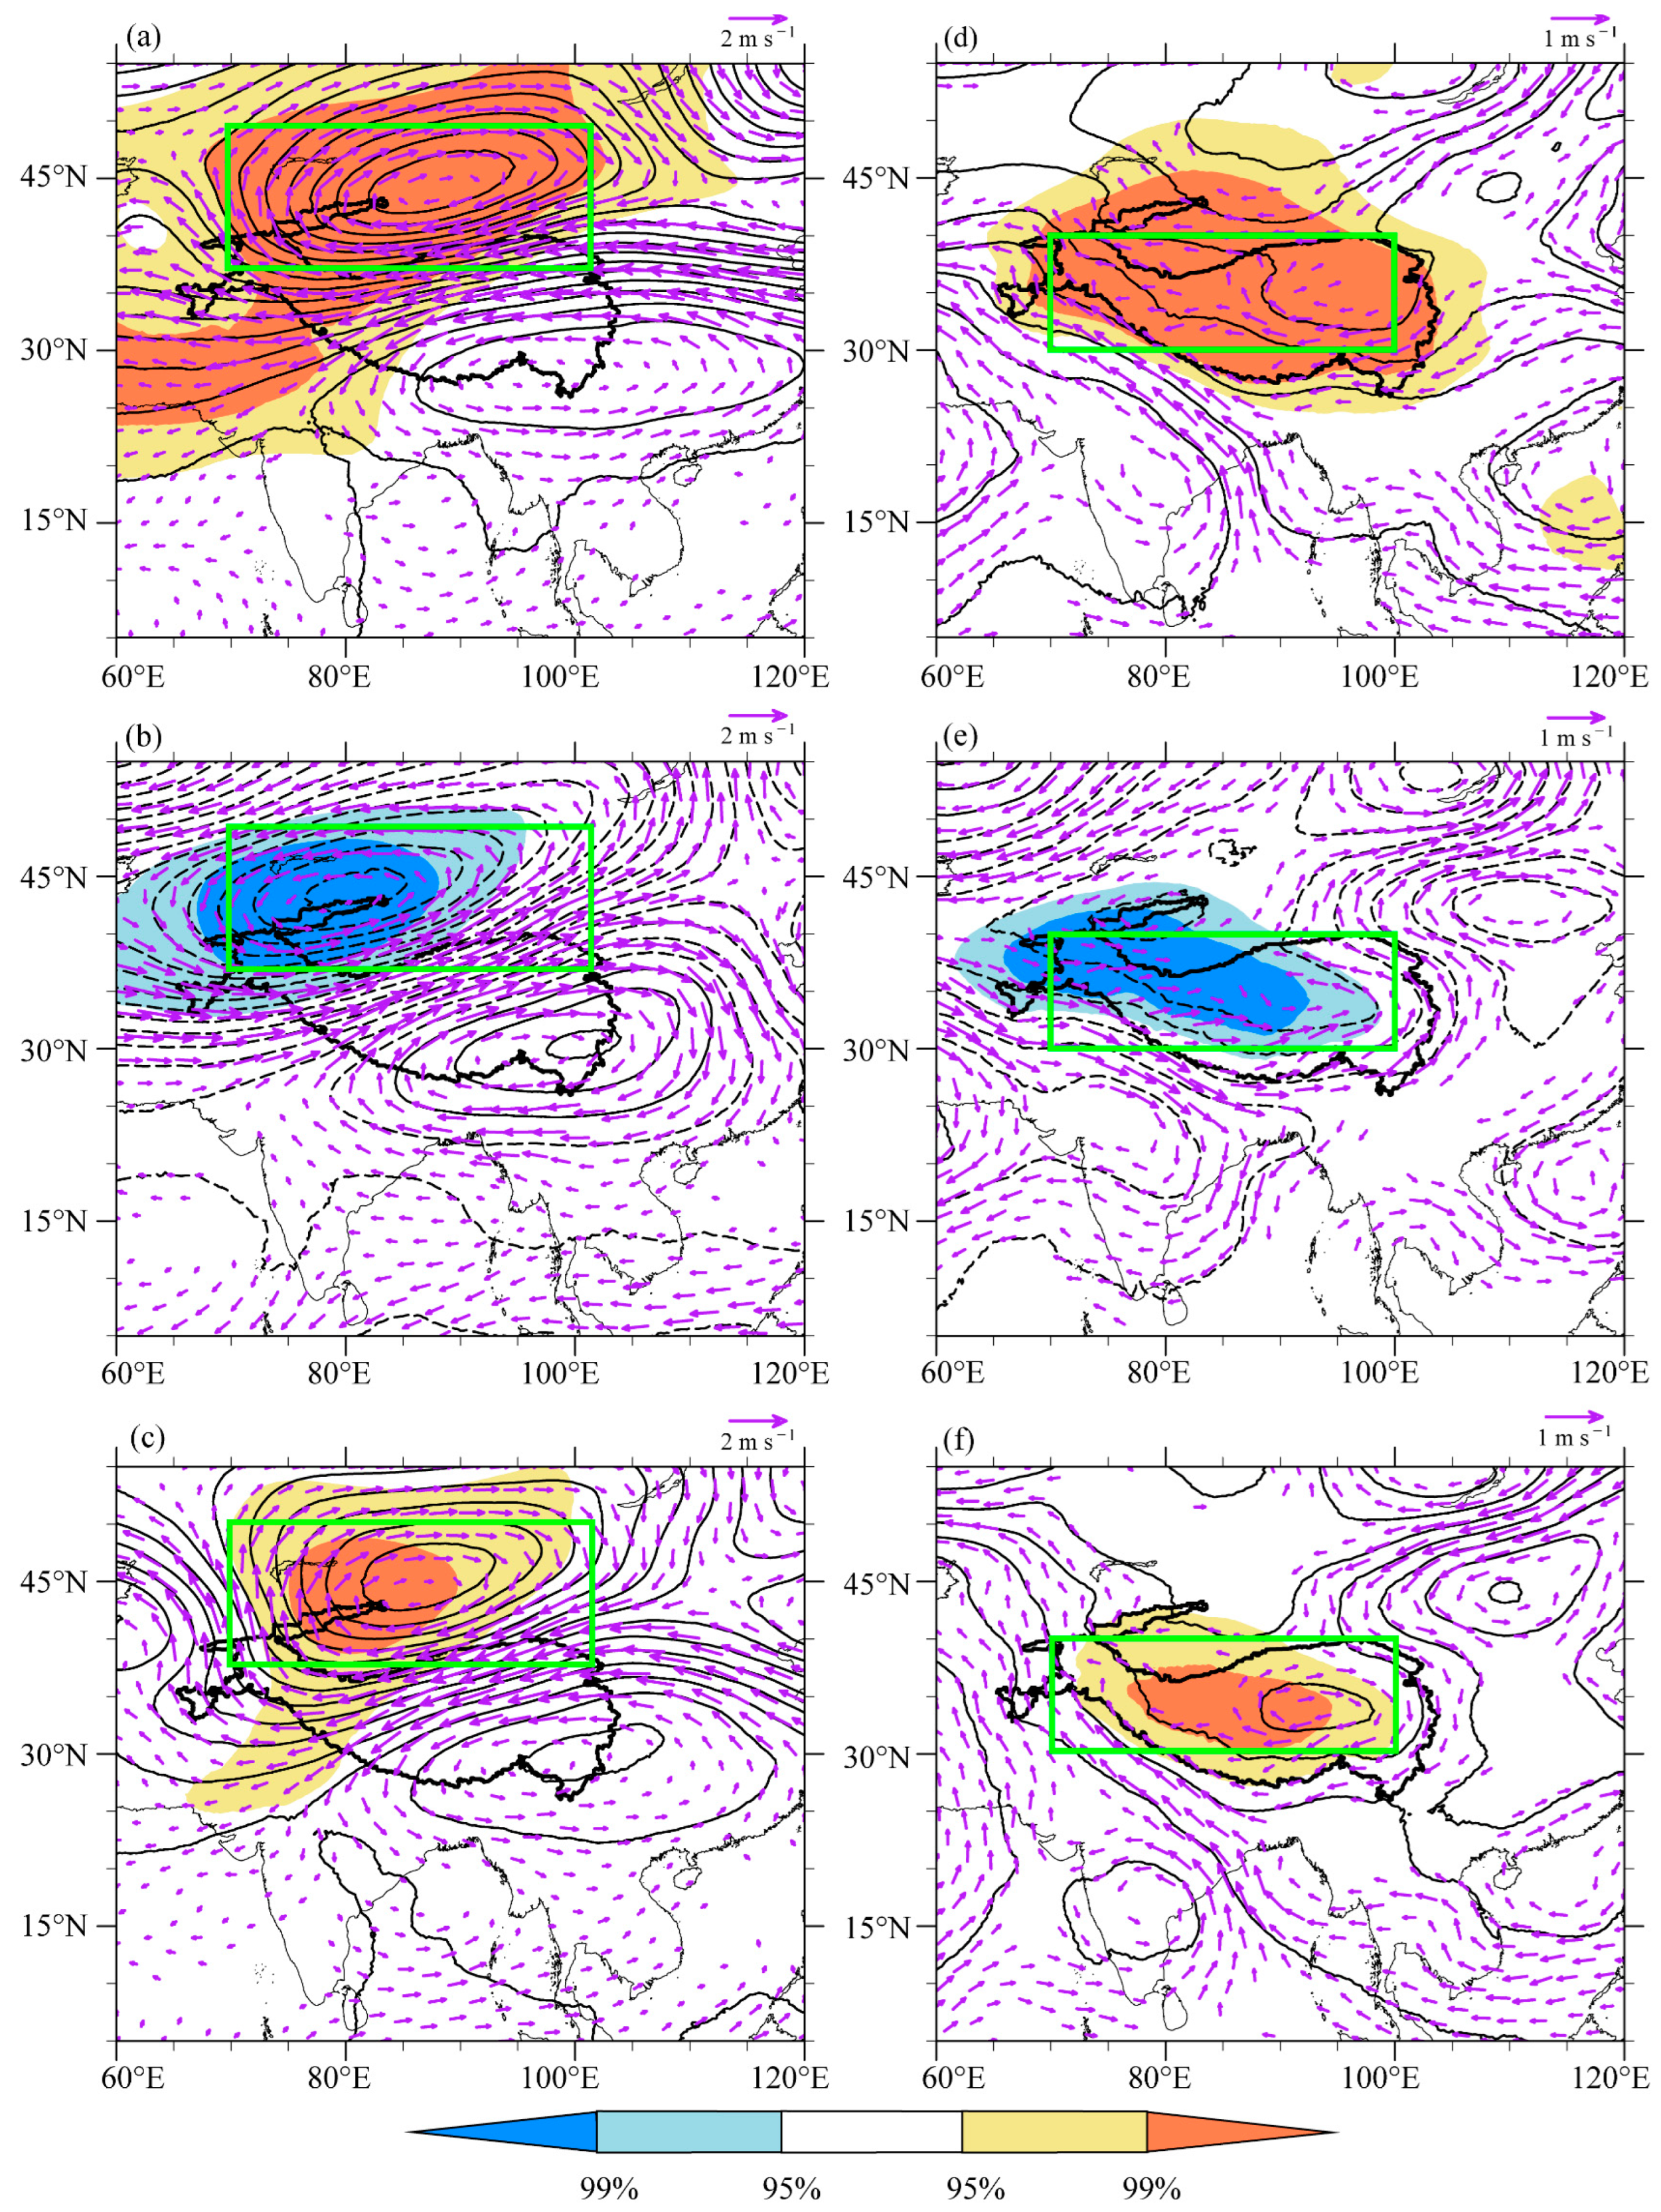
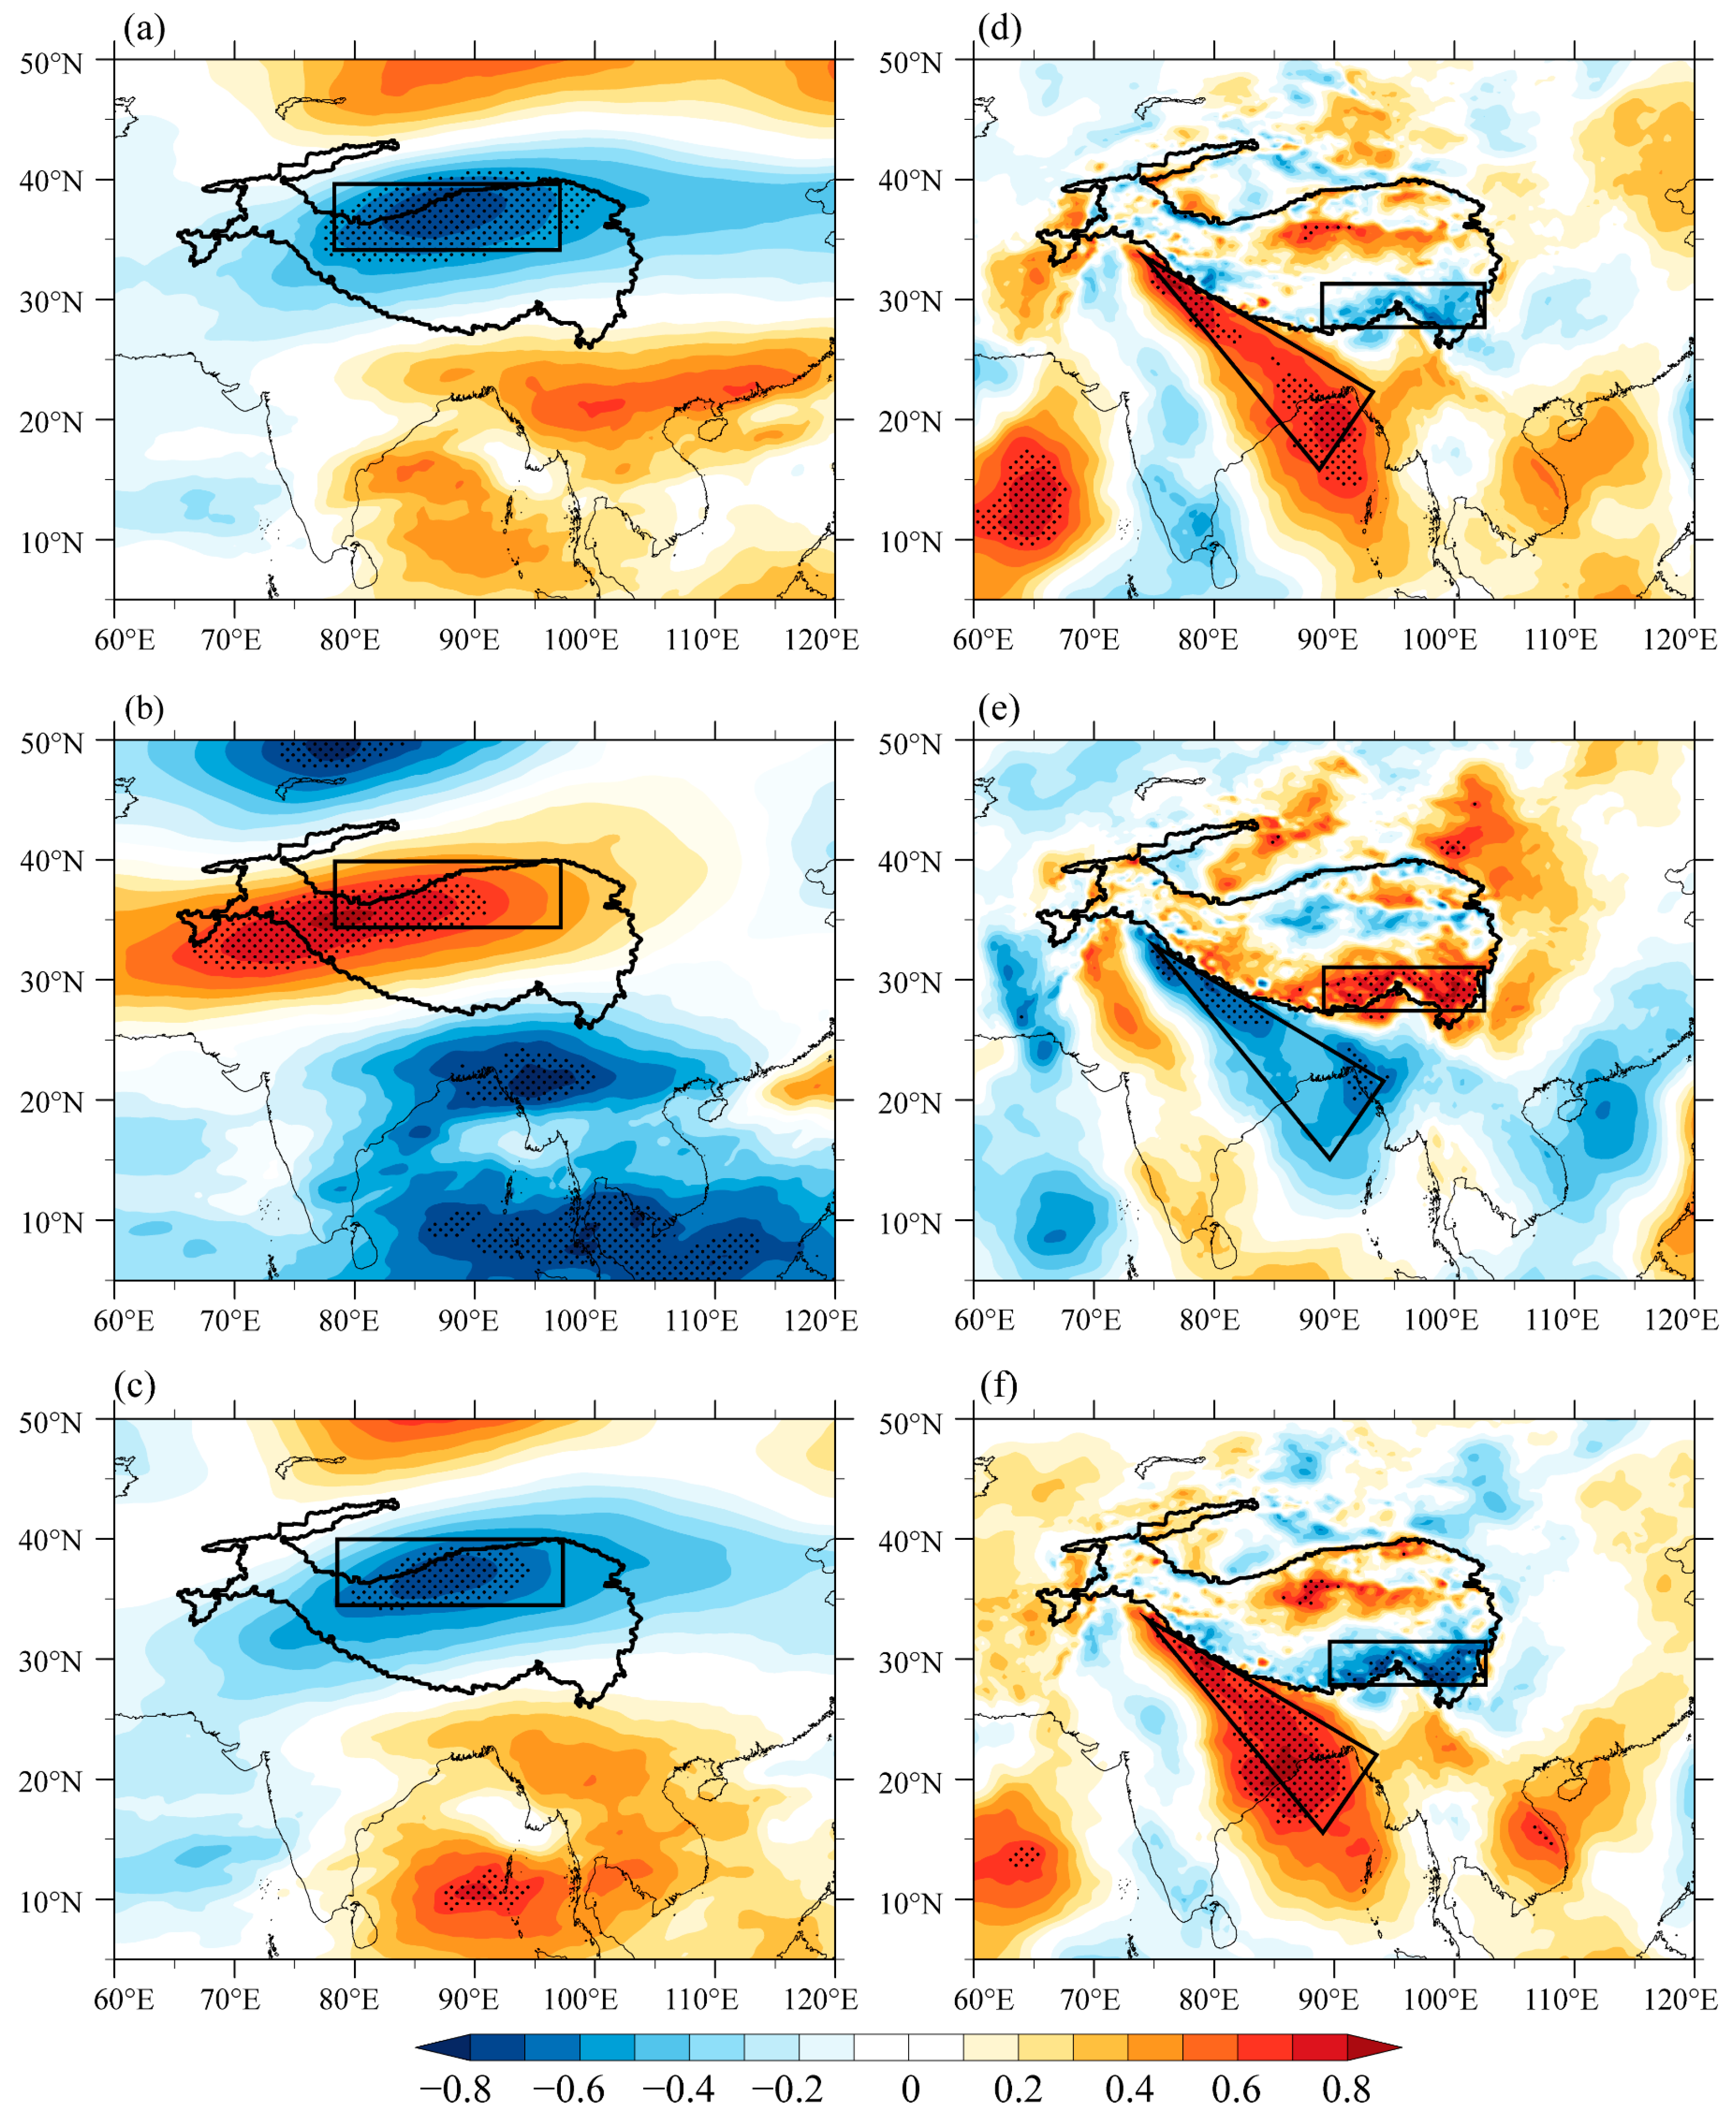
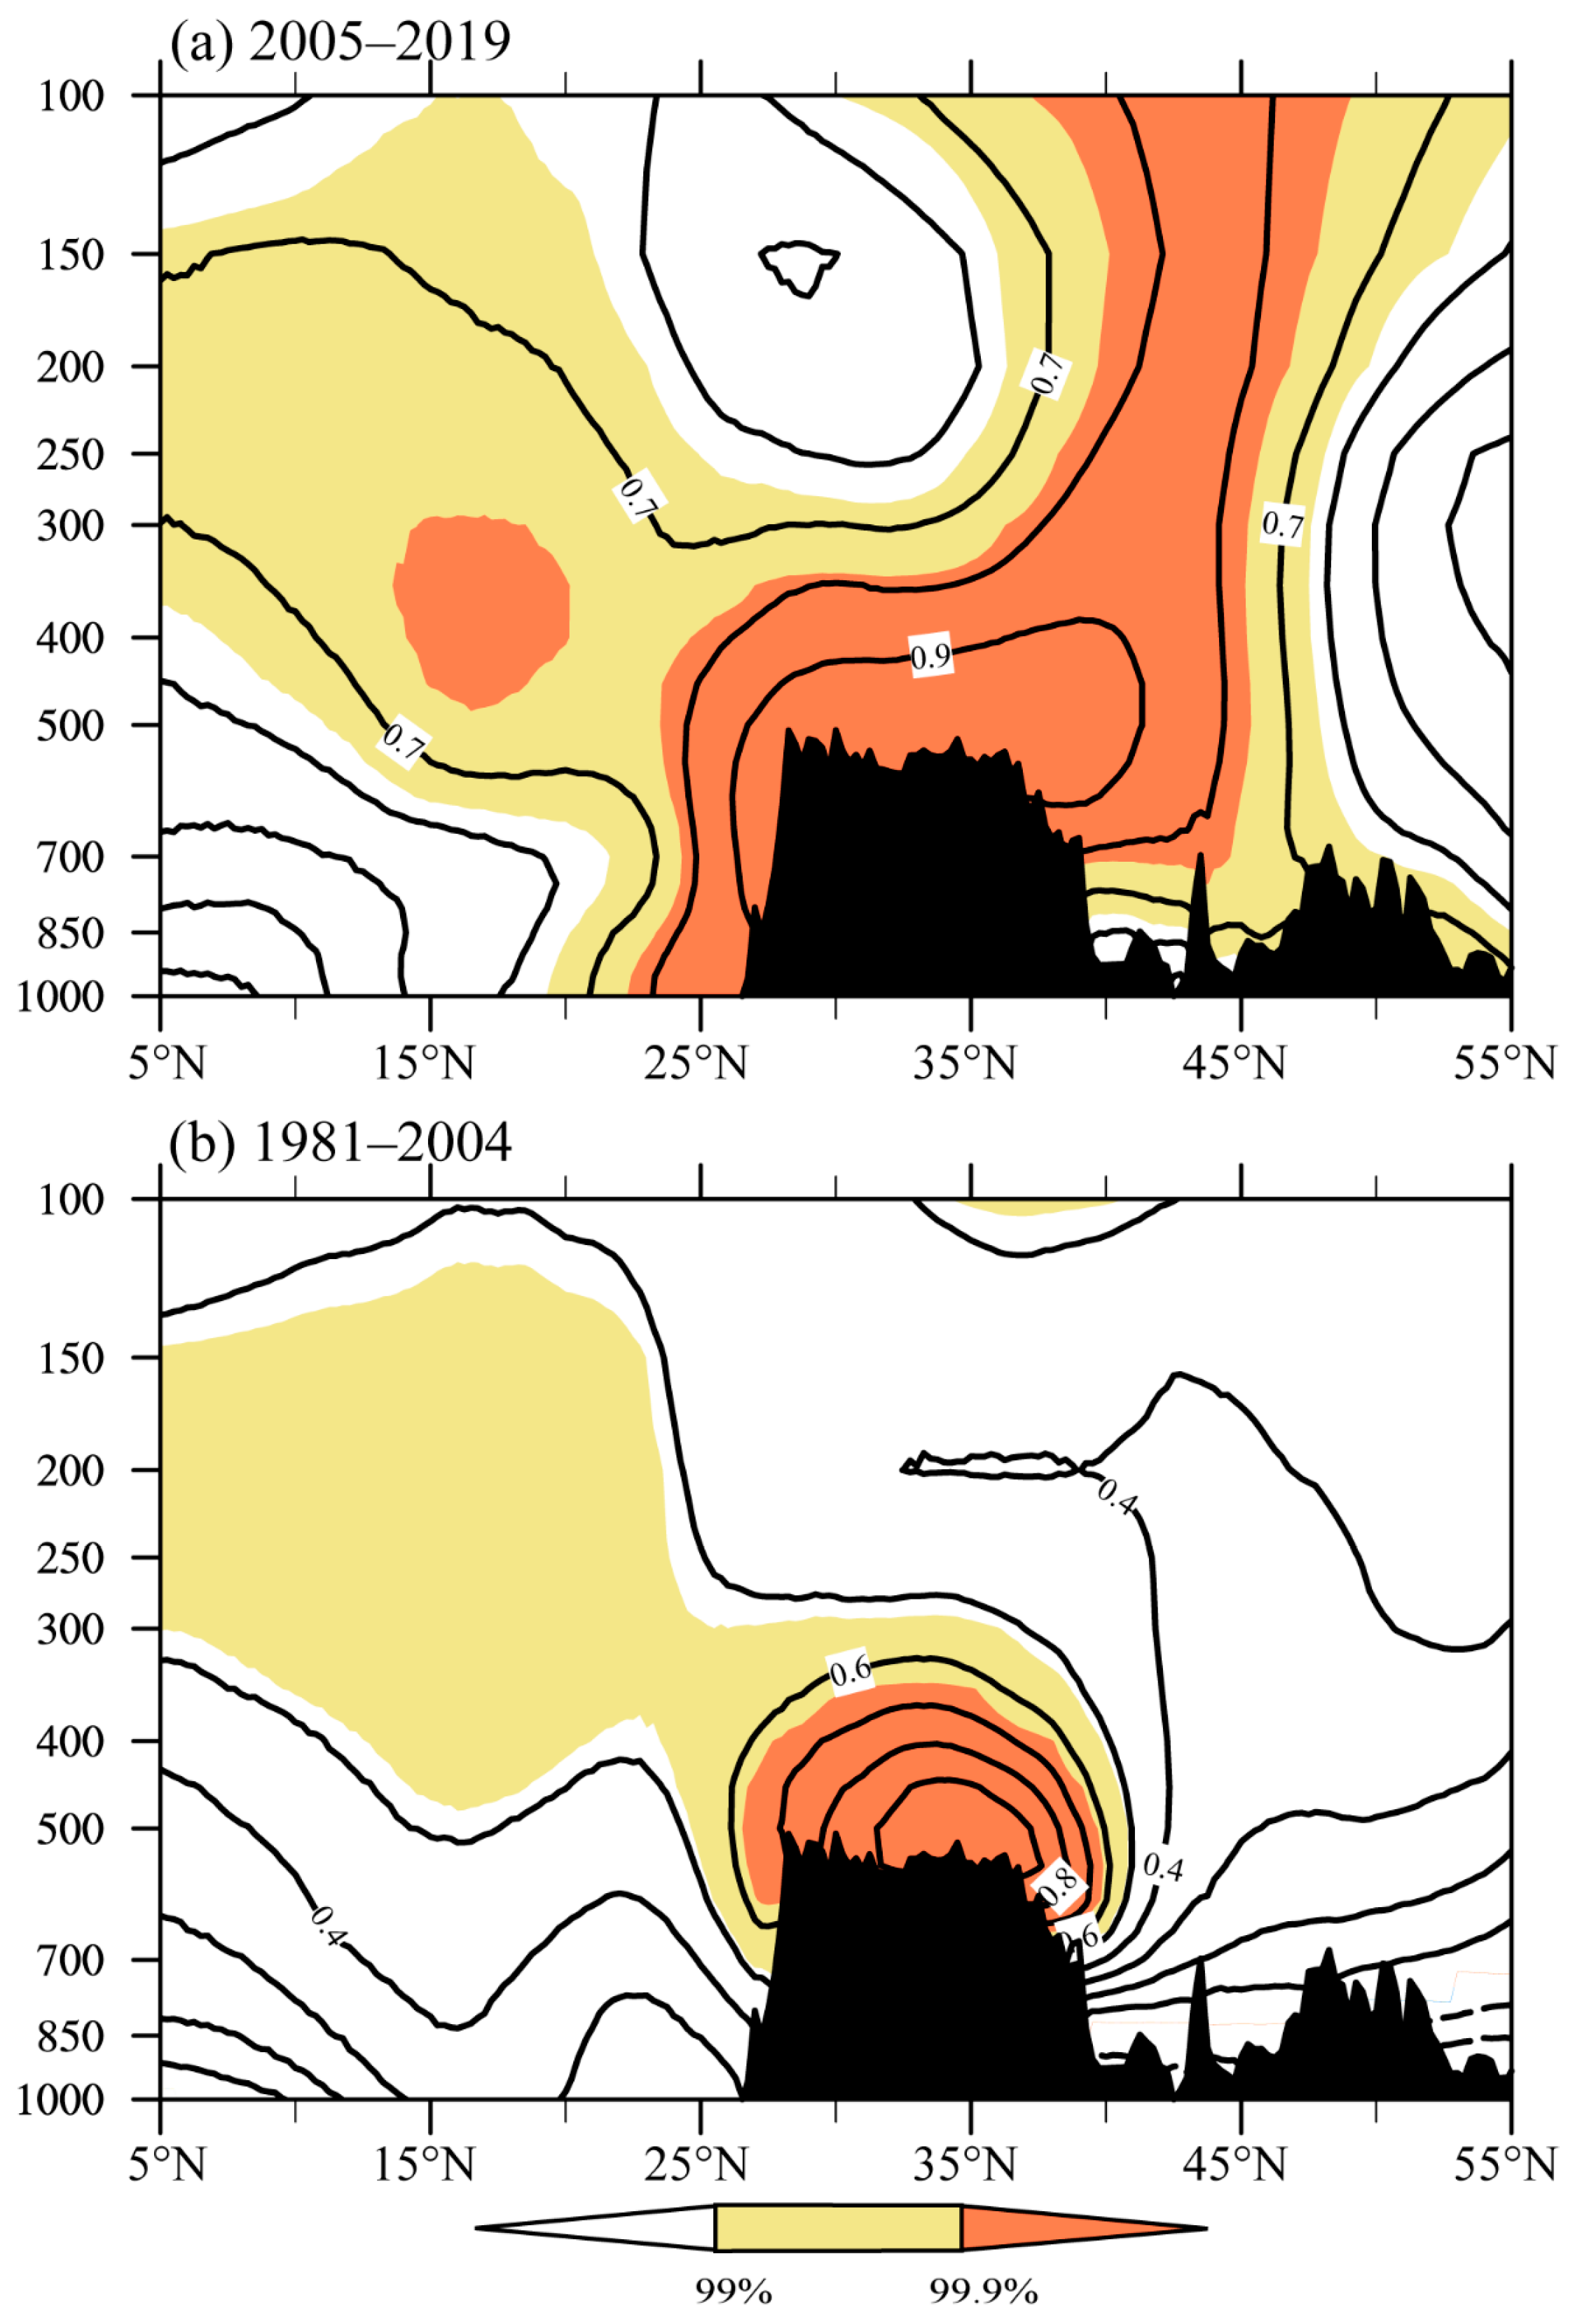
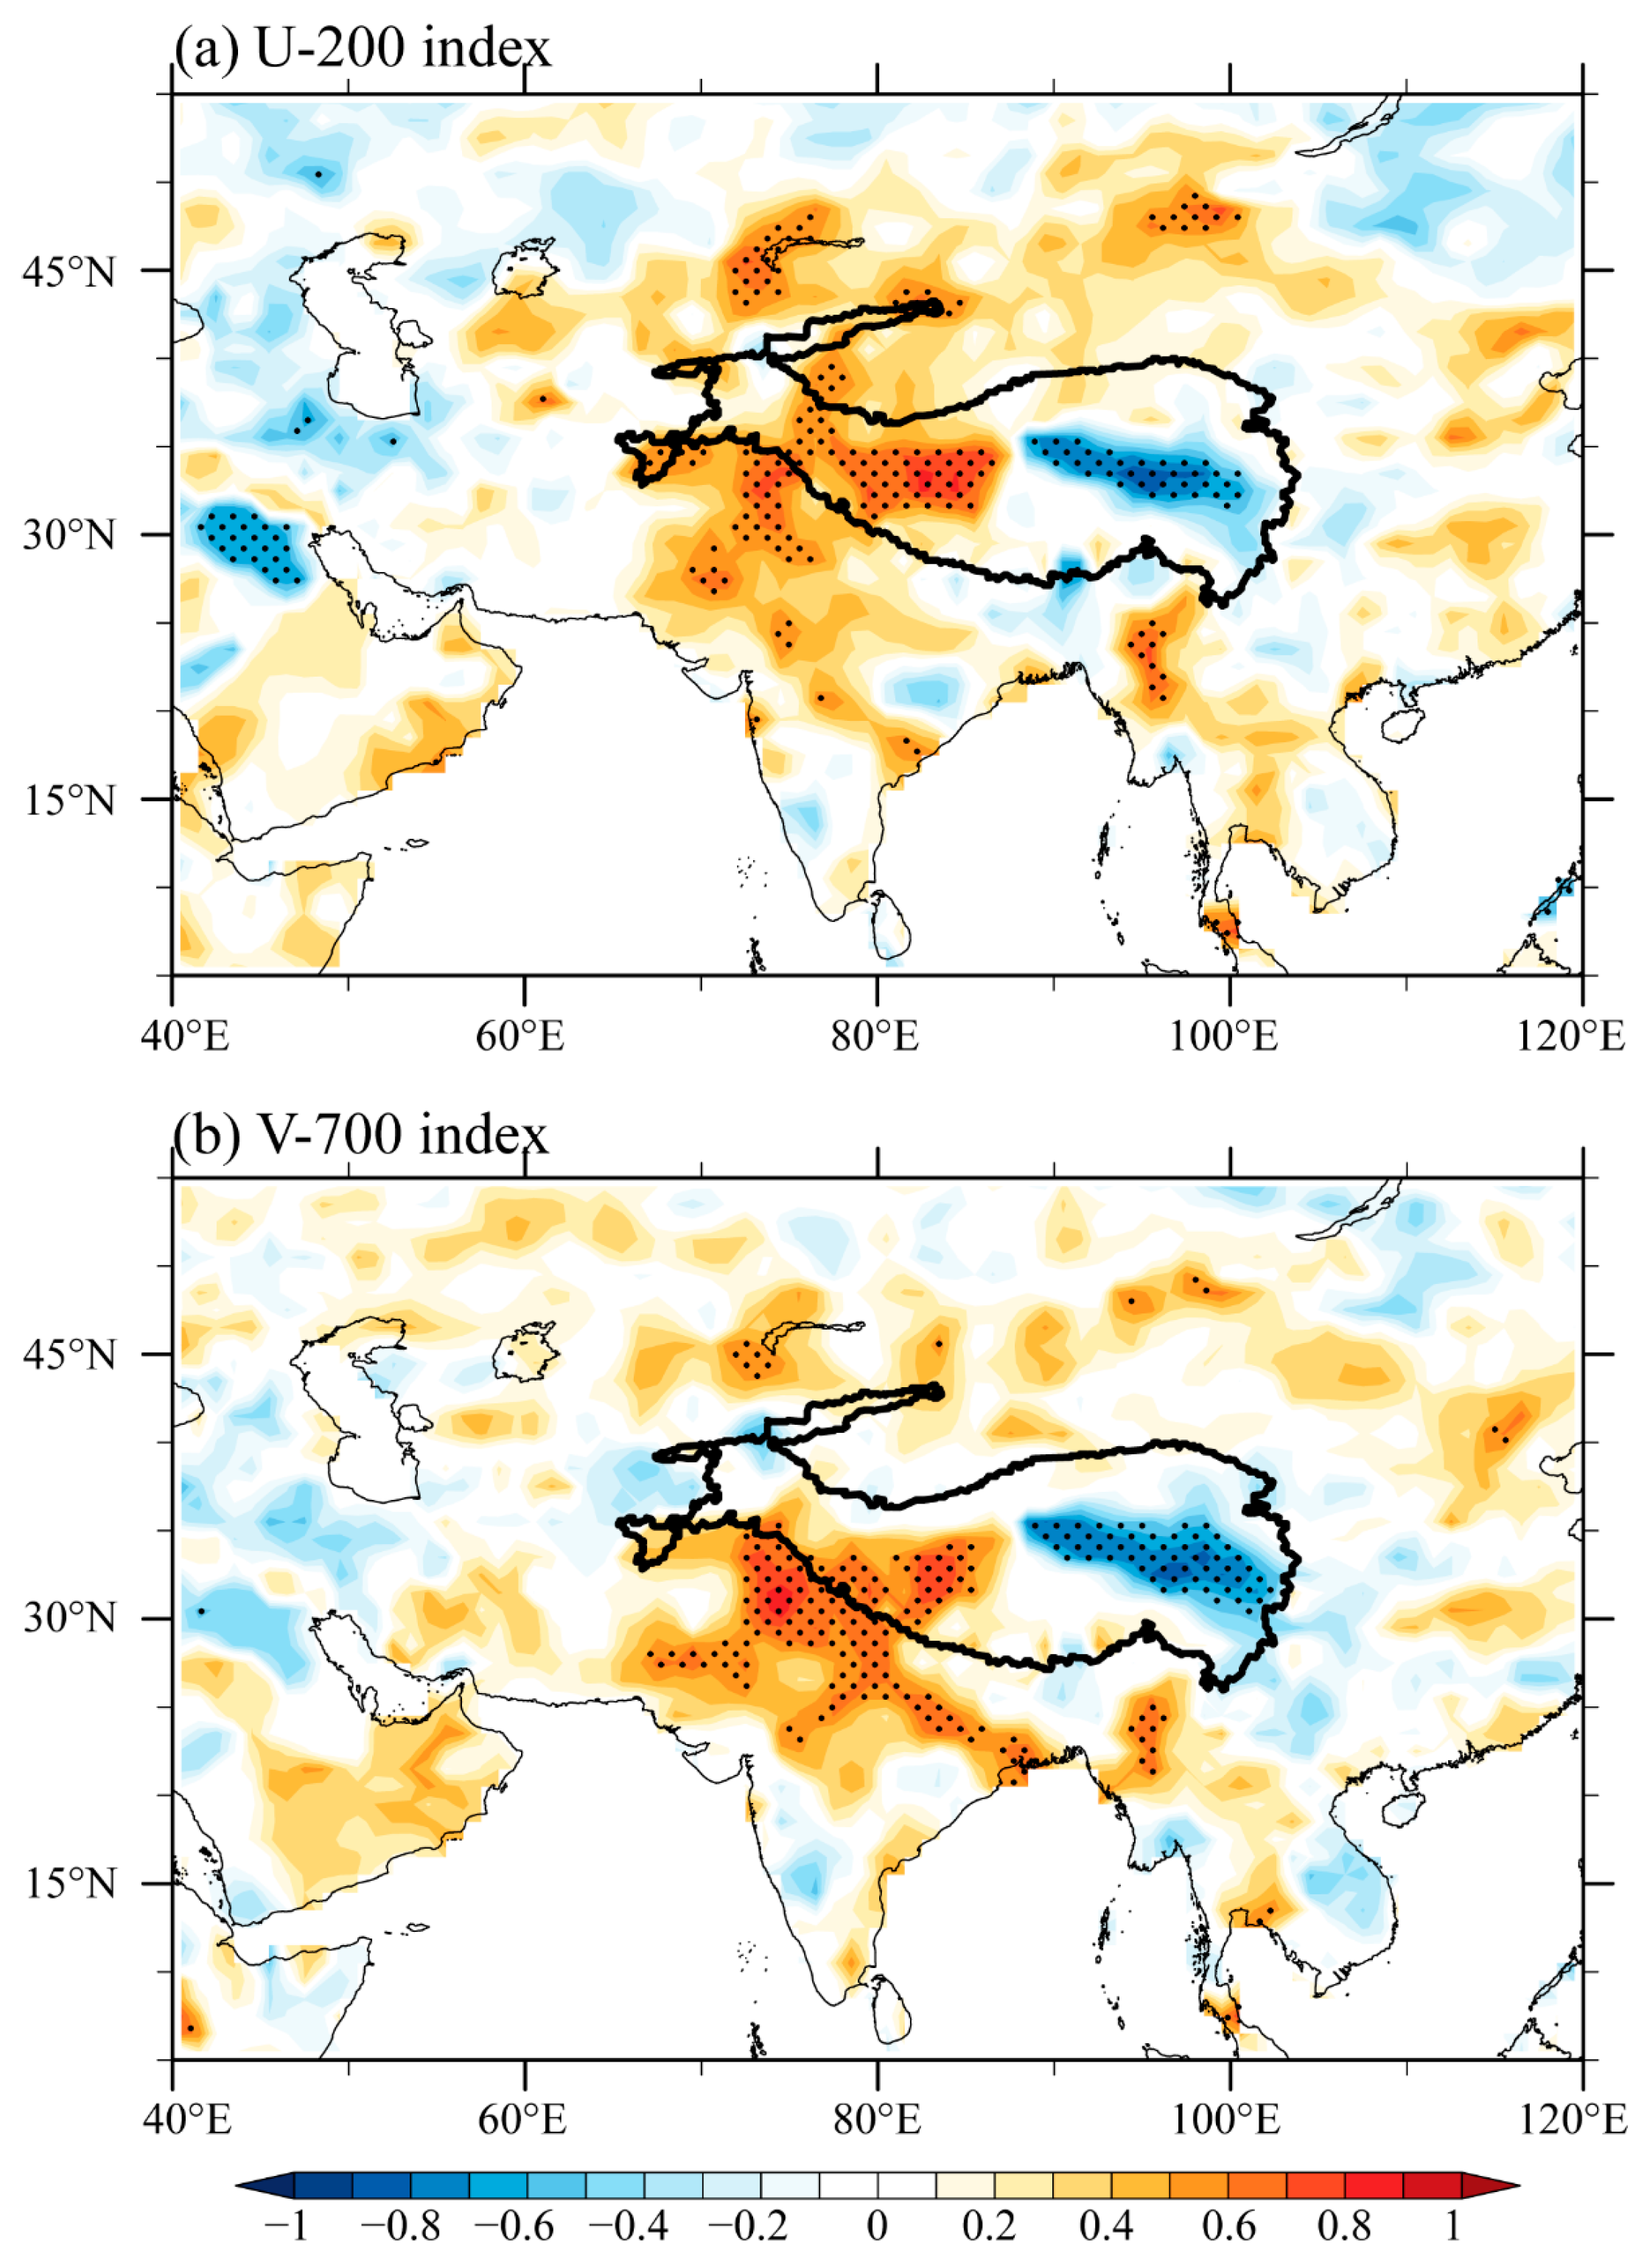
3.2.1. Dominant Circulation Anomalies for Covariability during 2005–2019

Figure 5 presents the summer anomalous geopotential heights and winds regressed on the simultaneous WTPP, ETPP, and NWIP indices during 2005–2019. Corresponding to a higher WTPP index, a large-scale positive geopotential height anomaly and associated anomalous anticyclone appear to the north of the TP at the upper-tropospheric (200 hPa) level (Figure 5a). Along the south flank of the anomalous anticyclone, anomalous easterlies prevail over the TP, implying weaker upper-level westerlies. The summer anomalous geopotential heights and winds regressed upon the simultaneous WTPP index show opposite circulation anomalies, with a negative geopotential height anomaly and associated anomalous cyclone to the north of the TP and relevant stronger upper-level westerlies over the TP (Figure 5b). The stronger upper-level westerlies may push water vapor to the ETP, causing more precipitation over the ETP and less precipitation over the WTP. In contrast, the weaker upper-level westerlies can only transport water vapor to the WTP and cannot reach the WTP, leading to more precipitation over the WTP and less precipitation over the ETP. This link between anomalous westerlies and the TP precipitation dipole pattern agrees well with the results of He et al. [27].
Figure 5c presents the summer anomalous 200 hPa geopotential heights and winds regressed upon the simultaneous NWIP index, which show circulation anomalies similar to those in Figure 5a and opposite to those in Figure 5b. This implies that the upper-level westerlies, which modulate the WTPP and ETPP, are also connected with the NWIP.
The summer anomalous 500 hPa geopotential heights and winds regressed upon the simultaneous WTPP and NWIP indices both show a significantly positive geopotential height anomaly and associated anomalous anticyclone over the TP (Figure 5d,f). Along the southwestern flank of the anomalous anticyclone, anomalous mid- and lower-tropospheric southeasterlies prevail from the Bay of Bengal to the southwestern TP via northern India (Figure 5d,f). The anomalous southeasterlies guide stronger water vapor transport from the Bay of Bengal to northwestern India and the WTP, which may facilitate more precipitation in the two regions and cause the covariability of the WTPP and NWIP. The summer anomalous 500 hPa geopotential heights and winds regressed upon the simultaneous ETPP index (Figure 5e) show circulation anomalies opposite to those in Figure 5d,f. Specifically, a significantly negative geopotential height anomaly and associated anomalous cyclone appear over the TP (Figure 5e). Along the southeastern flank of the anomalous cyclone, anomalous mid- and lower-tropospheric southwesterlies prevail over the southeastern edge of the TP (Figure 5e), which may strengthen the water vapor transport into the ETP from the southern boundary of the TP and hence result in more precipitation over the ETP. In contrast, corresponding to the positive geopotential height anomaly and associated anomalous anticyclone over the TP in Figure 5d,f, anomalous mid- and lower-tropospheric northeasterlies prevail over the southeastern edge of the TP, which may weaken the water vapor transport into the ETP and accordingly lead to less precipitation over the ETP. That is, the mid-tropospheric (500 hPa) geopotential height anomaly over the TP and associated anomalous mid- and lower-tropospheric winds may also contribute to the covariability of the summer WTPP, ETPP, and NWIP.
To further explore whether the covariability of WTPP, ETPP, and NWIP is closely related to the intensity of upper-tropospheric westerlies, we performed correlation analyses between the WTPP, ETPP, and NWIP indices and 200 hPa zonal winds (Figure 6a–c). Corresponding to the WTPP, ETPP, and NWIP indices, significantly negative, positive, and negative correlations appear over the TP (Figure 6a–c). The results further verify that weaker (stronger) upper-tropospheric westerlies over the TP may lead to higher (lower) WTPP, lower (higher) ETPP, and higher (lower) NWIP. Figure 6d–f show the correlations between the WTPP, ETPP, and NWIP indices and 700 hPa meridional winds, respectively. Corresponding to higher WTPP and NWIP, significantly positive correlations appear from the Bay of Bengal to the southwestern TP and significantly negative correlations appear over the southeastern edge of the TP (Figure 6d,f). Corresponding to higher ETPP, significantly negative correlations appear from the Bay of Bengal to the southwestern TP and significantly positive correlations appear over the southeastern edge of the TP (Figure 6e), opposite to Figure 6d,f. The results confirm that the anomalous southerlies (northerlies) from the Bay of Bengal to the southwestern TP can facilitate (suppress) precipitation over NWI and the WTP and that the anomalous northerlies (southerlies) over the southeastern edge of the TP can suppress (facilitate) precipitation over the ETP. Clearly, the summer WTPP, ETPP, and NWIP can be simultaneously and jointly regulated by similar circulation anomalies and therefore exhibit covariability during 2005–2019.
Based on the key regions in Figure 5, the area-mean 500 hPa geopotential height averaged over the TP (30–40° N, 70–100° E) is defined as the 500 hPa TP geopotential height (TPGH-500) index. The area-mean 200 hPa geopotential height averaged over the key region north of the TP (37–50° N, 70–102° E) is defined as the 200 hPa TP geopotential height (TPGH-200) index. The correlation coefficient between the summer TPGH-500 and TPGH-200 indices is 0.79, which is significant at the 99% confidence level. This result shows that during the period 2005–2019, the 500 hPa geopotential height anomaly over the TP is closely correlated with the 200 hPa geopotential height anomaly to the north of the TP. Moreover, the correlation between the summer TPGH-500 index and simultaneous geopotential heights along the 90° E meridional–vertical cross section (Figure 7a) shows that significantly positive anomalies appear over the TP and slightly tilt northward with the increase in altitude, forming a thick geopotential height anomaly. The 500 hPa and 200 hPa geopotential heights around the TP can be regarded as part of this thick geopotential height anomaly. Therefore, the TPGH-500 and TPGH-200 indices were significantly linked and coupled with each other during 2005–2019.
Because of the coupled 500 hPa and 200 hPa geopotential height anomalies, the upper-tropospheric (200-hPa) zonal wind anomalies over the TP are also associated with the lower-tropospheric (700-hPa) meridional wind anomalies around the southern TP. Based on the key areas in Figure 6, the area-mean 200 hPa U winds averaged over the northern TP (34–40° N, 78–97° E; the black boxes in Figure 6a–c) were defined as the U-200 index. The difference between the area-mean 700 hPa V winds averaged over the southwestern flank of the TP (the black triangles in Figure 6d–f) and those averaged over the southeastern TP (28–31° N, 89–102° E; the black boxes in Figure 6–f) was defined as the V-700 index. For ease of understanding, the U-200 index is multiplied by −1 in the following study. Thus, a higher U-200 index reflects weaker upper-tropospheric westerlies over the TP, which corresponds to more precipitation over the WTP and NWI and less precipitation over the ETP, in accordance with the higher V-700 index-related precipitation pattern. The U-200 index is significantly correlated with the V-700 index during 2005–2019, with a correlation coefficient of 0.73, significant at the 99% confidence level. Because the U-200 and V-700 are coupled with each other, the correlations between the two indices and precipitation show similar patterns, with significantly positive correlations over the WTP and NWI and significantly negative correlations over the ETP (Figure 8). In other words, the 500 hPa and 200 hPa geopotential heights and associated upper- and lower-tropospheric wind anomalies can be considered as a coupled circulation system that concurrently regulates the summer WTPP, ETPP, and NWIP and consequently led to the covariability of precipitation over the TP and India during 2005–2019.
If the upper- and lower-tropospheric winds are not coupled, can they independently affect the covariability of precipitation? To distinguish the independent contribution of the U-200 and V-700 anomalies to the covariability of summer WTPP, ETPP, and NWIP, we defined the independent U-200 index after removing the variability of the V-700 index using a linear fitting method [44,45,46]. The correlation between the summer independent U-200 index and simultaneous precipitation during 2005–2019 shows significantly positive correlations around the WTP and negative correlations over the ETP, generally displaying an east–west dipole pattern over the TP (Figure 9a). However, the correlations over the ETP are weak and insignificant. In addition, the positive correlations over NWI are insignificant. The weak and insignificant correlations imply that the anomalous 200 hPa westerly (U-200) itself is insufficient to cause the significant covariability of WTPP, ETPP, and NWIP when the effect of the 700 hPa circulation anomalies is absent. Similarly, we defined the independent V-700 index after removing the variability of the U-200 index. The correlation between the summer independent V-700 index and simultaneous precipitation during 2005–2019 does not show significant correlations over the WTP, ETP, and NWI (Figure 9b). This indicates that the 700 hPa circulation anomalies cannot independently result in the covariability of WTPP, ETPP, and NWIP when the effect of the 200 hPa circulation anomalies is absent.
The arithmetic mean of the normalized U-200 and V-700 indices was defined as the upper- and lower-tropospheric coupled circulation (ULCC) index, which can be used to reflect the collaborative variability in the ULCC anomalies around the TP. During 2005–2019, the correlation between the summer ULCC index and simultaneous precipitation shows significantly positive correlations over the WTP and NWI and significantly negative correlations over the ETP (Figure 9c), which is highly similar to Figure 2c. The above results further imply that when the 200 hPa and 700 hPa circulation anomalies are coupled with each other, they tend to jointly modulate the summer WTPP, ETPP, and NWIP and hence give rise to the covariability of precipitation over the TP and India during 2005–2019.
The modulation of circulation anomalies on the covariability of the WTPP, ETPP, and NWIP during 2005–2019 is summarized in Figure 10. During 2005–2019, a thick geopotential height anomaly column, which tilted slightly northward, governed the TP, forming upper- and lower-level coupled circulation anomalies. In the upper troposphere, a positive geopotential height anomaly and associated anomalous anticyclone appeared to the north of the TP. Along the south flank of the anomalous anticyclone, anomalous easterlies governed the TP, indicating weaker upper-level westerlies. The weaker upper-level westerlies can only guide water vapor to the WTP and cannot reach the ETP, causing the covariability of higher WTPP and lower ETPP. In the middle troposphere, a positive geopotential height anomaly and associated anomalous anticyclone appeared over the TP. Along the southwestern flank of the anomalous anticyclone, anomalous lower-tropospheric southeasterlies prevailed from the Bay of Bengal to the southwestern TP via northern India, inducing more water vapor from the Bay of Bengal to the NWI and WTP and therefore causing higher NWIP and WTPP. Along the southeastern flank of the anomalous anticyclone, anomalous lower-tropospheric northeasterlies prevailed over the southeastern edge of the TP, weakening the water vapor transport into the ETP from the southern boundary of the TP and hence causing the lower ETTP. In short, the upper- and lower-tropospheric circulation anomalies are coupled and synergistically modulate the summer WTPP, ETPP, and NWIP, resulting in the covariability of summer precipitation over the TP and India during 2005–2019 (Figure 10).

3.2.2. Reason for Non-Covariability during 1981–2004

During 1981–2004, the correlation between the summer TPGH-500 index and simultaneous geopotential heights along the 90° E meridional–vertical cross section (Figure 7b) shows that significantly positive anomalies appeared over the TP and greatly tilted southward with increasing altitude. Unlike during 2005–2019, there was no thick geopotential height anomaly above the TP during 1981–2004 (Figure 7b). Because of the absence of a thick geopotential height anomaly connecting the upper- and lower-tropospheric circulation systems, the upper-tropospheric zonal wind anomalies over the TP and the lower-tropospheric wind anomalies around the southern TP were not tightly coupled. The correlation coefficient between the U-200 and V-700 indices during 1981–2004 is only 0.47, which is much lower than that (0.73) during 2005–2019.
Because the U-200 and V-700 were not tightly coupled with each other during 1981–2004, the correlations between the above two indices and precipitation show distinct distributions (Figure 11). The correlation between the U-200 index and precipitation (Figure 11a) shows significantly positive values over the WTP and significantly negative values over the ETP. However, in contrast to Figure 8a, no significant positive correlations can be observed over NWI (Figure 11a). The above correlation result implies that the anomalous upper-tropospheric westerlies can primarily modulate the TP dipole precipitation pattern but cannot remarkably affect precipitation over NWI. The correlation between the V-700 index and precipitation (Figure 11b) shows significantly positive values over NWI and significantly negative values over the ETP. However, the positive correlation over the WTP is insignificant (Figure 11b). This result signifies that the lower-tropospheric wind anomalies around the southern TP mainly modulate precipitation over NWI but have a relatively weaker impact on the TP dipole precipitation pattern. When the upper- and lower-tropospheric circulation anomalies are not strongly coupled, the respective effects of the anomalous 200 hPa westerlies over the TP and 700 hPa wind anomalies around the southern TP are insufficient to cause significant covariability of WTPP, ETPP, and NWIP. The uncoupled variations in the upper- and lower-tropospheric circulations around the TP can, to some extent, explain why there was no significant covariability of WTPP, ETPP, and NWIP during 1981–2004 (Figure 2b).

4. Discussion

Previous studies have revealed that the out-of-phase variation between summer precipitation over the ETP and that over the WTP is a dominant pattern on interannual timescales [26]. He et al. [27] reported that summer precipitation over the ETP was negatively correlated with that over the WTP during 1981–2019, showing the TP east–west dipole precipitation pattern. The present study further reveals that the east–west dipole precipitation pattern shows a clear interdecadal change, with an unclear pattern occurring during 1981–2004 and a significant pattern occurring during 2005–2019. In addition, we find that the TP east–west dipole pattern is more significantly connected with northwestern Indian precipitation during 2005–2019 than that during 1981–2004. The covariability between the TP east–west dipole precipitation and Indian precipitation is different from that in a previous study [34], which emphasized a dipole precipitation pattern between the TP and northern India and did not discuss the interdecadal change in the pattern.
Further analyses reveal that the covariability of summer precipitation over the TP and India can be attributed to the upper- and lower-tropospheric coupled circulation anomalies around the TP during 2005–2019. One may wonder why the upper- and lower-tropospheric circulation anomalies around the TP were coupled during 2005–2019 but uncoupled during 1981–2004. Sea surface temperature anomalies (SSTAs) in different oceans can regulate precipitation over the TP by modulating atmospheric circulation anomalies around the TP [36,48,49,50,51,52]. Can the covariability and non-covariability of WTPP, ETPP, and NWIP be attributed to the different modulations of SSTAs in some key sea regions during different periods?
The correlations of SSTs with the TPGH-500 and TPGH-200 indices during 2005–2019 show significant correlations in the western North Pacific (WNP; domained by a quadrilateral with four vertices at 34° N, 130° E, 25° N, 140° E, 5° N, 120° E, and 15° N, 110° E), and tropical Atlantic (TA; domained by a quadrilateral with four vertices at 2° N, 37° W, 12° N, 32° W, 2° N, 3° W, and 8° S, 8° W) (figure omitted), implying that the WNP and TA SSTs may play an important role in causing the upper- and lower-tropospheric coupled circulation anomalies around the TP. The area-mean SSTs averaged over the WNP and TA were defined as the WNP-SST and TA-SST indices, respectively. Figure 12 shows the anomalous geopotential heights and winds regressed on the summer WNP-SST index during 2005–2019. Corresponding to warmer SSTs in the WNP, a significant 200 hPa geopotential height anomaly appears to the north of the TP (Figure 12a). Meanwhile, the significant 500 hPa geopotential height anomaly extends from the WNP to the TP (Figure 12b). Therefore, the upper- and lower-level coupled circulation anomalies, which are responsible for the precipitation covariability, are established. Correspondingly, the correlation between the WNP-SST index and precipitation shows precipitation covariability over the TP and NWI (Figure 13a).
Figure 14 shows the anomalous geopotential heights and winds regressed on the summer TA-SST index during 2005–2019. Corresponding to warmer SSTs in the TA, a significant positive 200 hPa geopotential height anomaly and associated anomalous anticyclone appear over the mid-latitude North Atlantic (Figure 14a). The TA SSTAs may cause geopotential height anomalies over the mid-latitude North Atlantic by modulating anomalous vertical circulations between the TA and the mid-latitude North Atlantic [53]. In Figure 14a, we can also detect an anomalous anticyclone–cyclone alternative wave train extending from the mid-latitude North Atlantic to the area to the north of the TP. As a part of this wave train, a significant positive geopotential height anomaly appears to the north of the TP (Figure 14a). Similarly, the wave train can be detected at the 500 hPa level, with a significant positive anomaly governing the TP (Figure 14b). This indicates that the TA SST may facilitate the upper- and lower-level coupled circulation anomalies. As a result, the correlation between the TA-SST index and precipitation shows precipitation covariability over the TP and NWI (Figure 13b).
Given that both the WNP and TA SSTs can modulate the upper- and lower-level coupled circulation anomalies and accordingly facilitate precipitation covariability of the TP and India, we defined a WNP-TA-SST index (i.e., the arithmetic mean of the standardized WNP-SST and TA-SST indices) to measure the joint effect. The correlation between the WNP-TA-SST index and precipitation shows more significant precipitation covariability of the ETP, WTP, and NWI regions (Figure 13c), which signifies that the combined effect of the WNP and TA SSTs on the precipitation covariability is more pronounced than the respective effect of either WNP SST or TA SST. The process of the combined effect of the WNP and TA SSTs on the precipitation covariability by modulating the upper- and lower-level coupled circulation anomalies around the TP can be summarized in Figure 15.
During 1981–2004, corresponding to warmer SSTs in the WNP, a significant positive 500 hPa geopotential height anomaly extended from the WNP to the southern TP, with the positive geopotential height anomaly and associated anomalous anticyclone farther south than those during 2005–2019 (figure omitted). Moreover, the significant 200 hPa geopotential height anomaly did not appear to the north of the TP but over the southern TP (figure omitted). Clearly, this configuration does not match the upper- and lower-level coupled circulation anomalies responsible for the precipitation covariability. Corresponding to warmer SSTs in the TA, positive geopotential height anomalies appeared over the North Atlantic (figure omitted). However, the anomalies were much weaker and smaller than those during 2005–2019. The anomalous anticyclone–cyclone alternative wave train was also different from that during 2005–2019. Consequently, the upper- and lower-level coupled circulation anomalies, which are responsible for the precipitation covariability, did not appear around the TP during 1981–2004. The different modulations of the WNP and TA SSTs on circulation anomalies during the two periods may partly explain the precipitation covariability during 2005–2019 and non-covariability during 1981–2004.

5. Conclusions

Previous studies have revealed the east–west dipole pattern of TP summer precipitation and the covariability between the entire TP and Indian summer precipitation. However, it remains unclear whether there are interdecadal changes in the connection between the TP east–west dipole pattern and Indian precipitation. This study investigates the interdecadal change in the covariability between the TP east–west dipole pattern and Indian precipitation and explores the modulation of circulation anomalies on covariability. The results reveal that the summer precipitation over the WTP, ETP, and NWI shows covariability, with an in-phase variation between the WTPP and NWIP and an out-of-phase variation between the WTPP and ETPP. Running correlation analyses further indicate an interdecadal change in this covariability. The covariability of the WTPP, ETPP, and NWIP was unclear during 1981–2004 and became significant during 2005–2019. To the best of our knowledge, the covariability of the WTPP, ETPP, and NWIP and the interdecadal change in the covariability can be regarded as new findings.
Further analyses indicate that the upper- and lower-tropospheric coupled circulation anomalies, which are closely related to a thick geopotential height anomaly column around the TP, are responsible for the covariability of the WTPP, ETPP, and NWIP during 2005–2019. The different modulations of the WNP and TA SSTs on circulation anomalies during the two periods may partly explain the precipitation covariability during 2005–2019 and non-covariability during 1981–2004. As summarized in Figure 15, during 2005–2019, the WNP SSTs appear to induce the westward extension of geopotential height anomalies from the WNP to the TP. The TA SST may modulate the geopotential height anomalies around the TP by stimulating a downstream wave train. The WNP and TA SSTs may jointly contribute to the upper- and lower-level coupled circulation anomalies and associated precipitation covariability of the TP and NWI during 2005–2019. However, the modulation of the SSTs on the upper- and lower-tropospheric coupled circulation anomalies around the TP was weaker during 1981–2004. As a result, the precipitation over the TP and NIW showed non-covariability during this period. These results may provide scientific support for local water resource management, ecological environment protection, and social and economic development around the TP.
However, it remains unclear as to why the modulation of the WNP and TA SSTs on the upper- and lower-level coupled circulation anomalies around the TP was weaker during 1981–2004. Can strong modulation only occur when both the WNP and TA SSTs reach higher levels? The detailed mechanism of the changing impact of SSTs on circulation anomalies and associated precipitation around the TP will be further investigated in the future. In addition to the modulation of the SSTAs, is it possible that the increasing TP heat fluxes in recent decades [54,55] may strengthen the coupling between the upper- and mid-tropospheric circulation anomalies and cause the covariability of precipitation? Can the TP precipitation pattern be modulated by distinct precipitation microphysics in different regions of the TP [56]? These questions deserve further exploration.

Author Contributions

Conceptualization, G.L.; methodology, X.W., G.L., S.N., T.Q., T.Z., X.M., Y.F., and Y.Z.; software, X.W., T.Z., X.M. and Y.F.; validation, G.L. and Y.Z.; formal analysis, X.W. and G.L.; investigation, G.L. and S.N.; resources, X.W. and G.L.; data curation, X.W.; writing—original draft preparation, X.W. and G.L.; writing—review and editing, X.W., G.L. and T.Q.; visualization, X.W., T.Z., X.M., Y.F. and Y.Z.; supervision, G.L.; project administration, G.L.; funding acquisition, G.L. All authors have read and agreed to the published version of the manuscript.

Funding

This research was funded by the National Key Research and Development Program of China (Grant 2023YFC3007503), the Meteorological Joint Fund of the National Natural Science Foundation of China (NSFC) (Grant U2342209), the Youth Innovation Team of China Meteorological Administration “Climate change and its impact in the Tibetan Plateau” (Grant CMA2023QN16), and the Basic Research Fund of CAMS (Grant 2023Z024).

Institutional Review Board Statement

Not applicable.

Informed Consent Statement

Not applicable.

Data Availability Statement

Publicly available datasets were analyzed in this study. The observational precipitation data can be found here: http://data.cma.cn/ (accessed on 19 October 2022). GPCC, GPCP, CRU, ERA5, and NOAA datasets are publicly available. GPCC can be found here: https://opendata.dwd.de/climate_environment/GPCC/html/fulldata-monthly_v2020_doi_download.html (accessed on 24 May 2023). GPCP can be found here: https://psl.noaa.gov/data/gridded/data.gpcp.html (accessed on 6 January 2022). CRU can be found here: https://crudata.uea.ac.uk/cru/data/hrg/cru_ts_4.07/cruts.2304141047.v4.07/pre/ (accessed on 14 April 2023). ERA5 can be found here: https://cds.climate.copernicus.eu/cdsapp#!/search?type=dataset (accessed on 10 August 2022). NOAA can be found here: https://psl.noaa.gov/data/gridded/data.noaa.ersst.v5.html (accessed on 14 May 2023).

Conflicts of Interest

The authors declare no conflicts of interest.

References

  1. Qiu, J. The third pole. Nature 2008, 454, 393–396. [Google Scholar] [CrossRef]
  2. Lu, C.; Xie, G.; Cheng, S.; Li, S. The Tibetan Plateau as Water Tower. J. Mt. Sci. 2004, 22, 428–432. (In Chinese) [Google Scholar]
  3. Davis, M.E.; Thompson, L.G.; Yao, T.D.; Wang, N.L. Forcing of the Asian monsoon on the Tibetan Plateau: Evidence from high-resolution ice core and tropical coral records. J. Geophys. Res. Atmos. 2005, 110, D04101. [Google Scholar] [CrossRef]
  4. Immerzeel, W.W.; van Beek, L.P.H.; Bierkens, M.F.P. Climate Change Will Affect the Asian Water Towers. Science 2010, 328, 1382–1385. [Google Scholar] [CrossRef] [PubMed]
  5. Feng, L.; Zhou, T. Water vapor transport for summer precipitation over the Tibetan Plateau: Multidata set analysis. J. Geophys. Res. Atmos. 2012, 117, D20114. [Google Scholar] [CrossRef]
  6. Pang, G.; Wang, X.; Yang, M. Using the NDVI to identify variations in, and responses of, vegetation to climate change on the Tibetan Plateau from 1982 to 2012. Quatern. Int. 2017, 444, 87–96. [Google Scholar] [CrossRef]
  7. Zhang, C.; Tang, Q.; Chen, D.; van der Ent, R.J.; Liu, X.; Li, W.; Haile, G.G. Moisture Source Changes Contributed to Different Precipitation Changes over the Northern and Southern Tibetan Plateau. J. Hydrometeorol. 2019, 20, 217–229. [Google Scholar] [CrossRef]
  8. Wang, T.; Zhao, Y. Relationships between Thermal Anomalies over the Qinghai-Xizang Plateau and Tropical Indian Ocean in May with Summer Rainfall in Xinjiang. Plateau Meteor. 2021, 40, 1–14. (In Chinese) [Google Scholar]
  9. Wang, T.; Zhao, Y. Influences of summer thermal anomalies over the Tibetan Plateau and the tropical Indian Ocean on summer rainfall in the Tarim Basin. Clim. Environ. Res. 2021, 26, 275–288. (In Chinese) [Google Scholar]
  10. Duan, A.M.; Wu, G.X. Role of the Tibetan Plateau thermal forcing in the summer climate patterns over subtropical Asia. Clim. Dyn. 2005, 24, 793–807. [Google Scholar] [CrossRef]
  11. Duan, A.; Wang, M.; Lei, Y.; Cui, Y. Trends in Summer Rainfall over China Associated with the Tibetan Plateau Sensible Heat Source during 1980–2008. J. Clim. 2013, 26, 261–275. [Google Scholar] [CrossRef]
  12. Liu, G.; Zhao, P.; Chen, J.M.; Yang, S. Preceding Factors of Summer Asian-Pacific Oscillation and the Physical Mechanism for Their Potential Influences. J. Clim. 2015, 28, 2531–2543. [Google Scholar] [CrossRef]
  13. Liu, G.; Zhao, P.; Chen, J.M. Possible Effect of the Thermal Condition of the Tibetan Plateau on the Interannual Variability of the Summer Asian-Pacific Oscillation. J. Clim. 2017, 30, 9965–9977. [Google Scholar] [CrossRef]
  14. Wu, G.; Zhuo, H.; Wang, Z.; Liu, Y. Two types of summertime heating over the Asian large-scale orography and excitation of potential-vorticity forcing I. Over Tibetan Plateau. Sci. China Earth Sci. 2016, 59, 1996–2008. [Google Scholar] [CrossRef]
  15. Lu, M.; Yang, S.; Li, Z.; He, B.; He, S.; Wang, Z. Possible effect of the Tibetan Plateau on the “upstream” climate over West Asia, North Africa, South Europe and the North Atlantic. Clim. Dyn. 2018, 51, 1485–1498. [Google Scholar] [CrossRef]
  16. Chen, J.M.; Yue, X.Y.; Liu, G.; Nan, S.L. Relationship between the thermal condition of the Tibetan Plateau and precipitation over the region from eastern Ukraine to North Caucasus during summer. Theor. Appl. Climatol. 2020, 142, 1379–1395. [Google Scholar] [CrossRef]
  17. Nan, S.; Zhao, P.; Chen, J. Variability of summertime Tibetan tropospheric temperature and associated precipitation anomalies over the central-eastern Sahel. Clim. Dyn. 2019, 52, 1819–1835. [Google Scholar] [CrossRef]
  18. Nan, S.; Zhao, P.; Chen, J.; Liu, G. Links between the thermal condition of the Tibetan Plateau in summer and atmospheric circulation and climate anomalies over the Eurasian continent. Atmos. Res. 2021, 247, 105212. [Google Scholar] [CrossRef]
  19. Liu, H.; Duan, K. Effects of North Atlantic Oscillation on Summer Precipitation over the Tibetan Plateau. J. Glaciol. Geocryol. 2012, 34, 311–318. [Google Scholar]
  20. Zhou, S.; Wu, P.; Wang, C.; Han, J. Spatial distribution of atmospheric water vapor and its relationship with precipitation in summer over the Tibetan Plateau. J. Geogr. Sci. 2012, 22, 795–809. [Google Scholar] [CrossRef]
  21. Liu, H.; Duan, K.; Li, M.; Shi, P.; Yang, J.; Zhang, X.; Sun, J. Impact of the North Atlantic Oscillation on the Dipole Oscillation of summer precipitation over the central and eastern Tibetan Plateau. Int. J. Climatol. 2015, 35, 4539–4546. [Google Scholar] [CrossRef]
  22. Yao, T.; Bolch, T.; Chen, D.; Gao, J.; Immerzeel, W.; Piao, S.; Su, F.; Thompson, L.; Wada, Y.; Wang, L.; et al. The imbalance of the Asian water tower. Nat. Rev. Earth Environ. 2022, 3, 618–632. [Google Scholar] [CrossRef]
  23. Ma, J.; Ren, H.-L.; Cai, M.; Huang, J. Seasonally Evolving Trends Explain the North-South Dipole Pattern Observed in Tibetan Plateau Precipitation. Geophys. Res. Lett. 2023, 50, e2023GL104891. [Google Scholar] [CrossRef]
  24. Ding, J.; Cuo, L.; Zhang, Y.; Zhang, C.; Liang, L.; Liu, Z. Annual and Seasonal Precipitation and Their Extremes over the Tibetan Plateau and Its Surroundings in 1963–2015. Atmosphere 2021, 12, 620. [Google Scholar] [CrossRef]
  25. Yu, R.-C.; Li, J.; Zhang, M.-M.; Li, N.N.; Zhao, Y. South drying and north wetting over the Tibetan Plateau modulated by a zonal temperature dipole across timescales. Adv. Clim. Chang. Res. 2023, 14, 276–285. [Google Scholar] [CrossRef]
  26. Hu, S.; Zhou, T.; Wu, B. Impact of Developing ENSO on Tibetan Plateau Summer Rainfall. J. Clim. 2021, 34, 3385–3400. [Google Scholar] [CrossRef]
  27. He, K.; Liu, G.; Wu, R.; Nan, S.; Wang, S.; Zhou, C.; Qi, D.; Mao, X.; Wang, H.; Wei, X. Oceanic and land relay effects linking spring tropical Indian Ocean sea surface temperature and summer Tibetan Plateau precipitation. Atmos. Res. 2022, 266, 105953. [Google Scholar] [CrossRef]
  28. Li, Z.; Xiao, Z.; Ling, J. Impact of extremely warm Tibetan Plateau in spring on the rare rainfall anomaly pattern in the regions west and east to Plateau in late summer 2022. Atmos. Res. 2023, 290, 106797. [Google Scholar] [CrossRef]
  29. Duan, A.; Wu, G. Weakening trend in the atmospheric heat source over the Tibetan plateau during recent decades. Part I: Observations. J. Clim. 2008, 21, 3149–3164. [Google Scholar] [CrossRef]
  30. Jiang, X.; Li, Y.; Yang, S.; Yang, K.; Chen, J. Interannual Variation of Summer Atmospheric Heat Source over the Tibetan Plateau and the Role of Convection around the Western Maritime Continent. J. Clim. 2016, 29, 121–138. [Google Scholar] [CrossRef]
  31. Wu, G.; Liu, Y.; He, B.; Bao, Q.; Duan, A.; Jin, F.-F. Thermal Controls on the Asian Summer Monsoon. Sci. Rep. 2012, 2, 404. [Google Scholar] [CrossRef]
  32. Yao, T.; Masson-Delmotte, V.; Gao, J.; Yu, W.; Yang, X.; Risi, C.; Sturm, C.; Werner, M.; Zhao, H.; He, Y.; et al. A review of climatic controls on δ18O in precipitation over the Tibetan Plateau: Observations and simulations. Rev. Geophys. 2013, 51, 525–548. [Google Scholar] [CrossRef]
  33. Zhou, L.; Zou, H.; Ma, S.; Li, F.; Zhu, J.; Li, P.; Zhang, Y. The observed impacts of South Asian summer monsoon on the local atmosphere and the near-surface turbulent heat exchange over the Southeast Tibet. J. Geophys. Res. 2015, 120, 11509–11518. [Google Scholar] [CrossRef]
  34. Jiang, X.; Ting, M. A Dipole Pattern of Summertime Rainfall across the Indian Subcontinent and the Tibetan Plateau. J. Clim. 2017, 30, 9607–9620. [Google Scholar] [CrossRef]
  35. Ren, Q.; Zhou, C.; He, J.; Cen, S.; Deng, M. Impact of Preceding Indian Ocean Sea Surface Temperature Anomaly on Water Vapor Content over the Tibetan Plateau Moist Pool in Summer and Its Possible Reason. Chin. J. Atmos. Sci. 2017, 41, 648–658. (In Chinese) [Google Scholar]
  36. Liu, M.; Ren, H.-L.; Wang, R.; Ma, J.; Mao, X. Distinct Impacts of Two Types of Developing El Niño-Southern Oscillations on Tibetan Plateau Summer Precipitation. Remote Sens. 2023, 15, 4030. [Google Scholar] [CrossRef]
  37. Dong, W.; Lin, Y.; Wright, J.S.; Ming, Y.; Xie, Y.; Wang, B.; Luo, Y.; Huang, W.; Huang, J.; Wang, L.; et al. Summer rainfall over the southwestern Tibetan Plateau controlled by deep convection over the Indian subcontinent. Nat. Commun. 2016, 7, 10925. [Google Scholar] [CrossRef]
  38. National Geophysical Data Center. 2-minute Gridded Global Relief Data (ETOPO2) v2. National Geophysical Data Center, NOAA. 2006. Available online: https://www.ngdc.noaa.gov/mgg/global/relief/ETOPO2/ETOPO2v2-2006/ (accessed on 18 August 2022).
  39. Schneider, U.; Becker, A.; Finger, P.; Rustemeier, E.; Ziese, M. GPCC Full Data Monthly Product Version 2020 at 1.0°: Monthly Land-Surface Precipitation from Rain-Gauges Built on GTS-Based and Historical Data. 2020. Available online: https://opendata.dwd.de/climate_environment/GPCC/html/fulldata-monthly_v2020_doi_download.html (accessed on 24 May 2023).
  40. Adler, R.F.; Huffman, G.J.; Chang, A.; Ferraro, R.; Xie, P.P.; Janowiak, J.; Rudolf, B.; Schneider, U.; Curtis, S.; Bolvin, D.; et al. The version-2 global precipitation climatology project (GPCP) monthly precipitation analysis (1979-present). J. Hydrometeorol. 2003, 4, 1147–1167. [Google Scholar] [CrossRef]
  41. Harris, I.; Osborn, T.J.; Jones, P.; Lister, D. Version 4 of the CRU TS monthly high-resolution gridded multivariate climate dataset. Sci. Data 2020, 7, 109. [Google Scholar] [CrossRef]
  42. Hersbach, H.; Bell, B.; Berrisford, P.; Hirahara, S.; Horanyi, A.; Munoz-Sabater, J.; Nicolas, J.; Peubey, C.; Radu, R.; Schepers, D.; et al. The ERA5 global reanalysis. Quart. J. R. Meteorol. Soc. 2020, 146, 1999–2049. [Google Scholar] [CrossRef]
  43. Huang, B.; Thorne, P.W.; Banzon, V.F.; Boyer, T.; Chepurin, G.; Lawrimore, J.H.; Menne, M.J.; Smith, T.M.; Vose, R.S.; Zhang, H.-M. Extended Reconstructed Sea Surface Temperature, Version 5 (ERSSTv5): Upgrades, Validations, and Intercomparisons. J. Clim. 2017, 30, 8179–8205. [Google Scholar] [CrossRef]
  44. Hu, M.; Gong, D.; Wang, L.; Zhou, T.; Zhang, Z. Possible influence of January-March Arctic Oscillation on the convection of tropical North Pacific and North Atlantic. Acta Meteorol. Sin. 2012, 70, 479–491. (In Chinese) [Google Scholar]
  45. Yue, X.; Liu, G.; Chen, J.; Zhou, C. Synergistic regulation of the interdecadal variability in summer precipitation over the Tianshan mountains by sea surface temperature anomalies in the high-latitude Northwest Atlantic Ocean and the Mediterranean Sea. Atmos. Res. 2020, 233, 104717. [Google Scholar] [CrossRef]
  46. He, K.; Liu, G.; Wu, R.; Nan, S.; Li, J.; Yue, X.; Wang, H.; Wei, X.; Li, R. Effect of preceding soil moisture-snow cover anomalies around Turan Plain on June precipitation over the southern Yangtze River valley. Atmos. Res. 2021, 264, 105853. [Google Scholar] [CrossRef]
  47. Wang, H.; Liu, G.; Wang, S.; He, K. Precursory Signals (SST and Soil Moisture) of Summer Surface Temperature Anomalies over the Tibetan Plateau. Atmosphere 2021, 12, 146. [Google Scholar] [CrossRef]
  48. Chen, X.; You, Q. Effect of Indian Ocean SST on Tibetan Plateau Precipitation in the Early Rainy Season. J. Clim. 2017, 30, 8973–8985. [Google Scholar] [CrossRef]
  49. Sun, J.; Yang, K.; Guo, W.; Wang, Y.; He, J.; Lu, H. Why Has the Inner Tibetan Plateau Become Wetter since the Mid-1990s? J. Clim. 2020, 33, 8507–8522. [Google Scholar] [CrossRef]
  50. Zhao, Y.; Zhou, T. Interannual Variability of Precipitation Recycle Ratio Over the Tibetan Plateau. J. Geophys. Res. Atmos. 2021, 126, e2020JD033733. [Google Scholar] [CrossRef]
  51. Yue, S.; Wang, B.; Yang, K.; Xie, Z.; Lu, H.; He, J. Mechanisms of the decadal variability of monsoon rainfall in the southern Tibetan Plateau. Environ. Res. Lett. 2021, 16, 014011. [Google Scholar] [CrossRef]
  52. Hu, W.; Chen, L.; Shen, J.; Yao, J.; He, Q.; Chen, J. Changes in Extreme Precipitation on the Tibetan Plateau and Its Surroundings: Trends, Patterns, and Relationship with Ocean Oscillation Factors. Water 2022, 14, 2509. [Google Scholar] [CrossRef]
  53. Wang, H.; Liu, G.; Chen, J. Contribution of the tropical western Atlantic thermal conditions during the preceding winter to summer temperature anomalies over the lower reaches of the Yangtze River basin-Jiangnan region. Int. J. Climatol. 2017, 37, 4631–4642. [Google Scholar] [CrossRef]
  54. Han, C.; Ma, Y.; Chen, X.; Su, Z. Trends of land surface heat fluxes on the Tibetan Plateau from 2001 to 2012. Int. J. Climatol. 2017, 37, 4757–4767. [Google Scholar] [CrossRef]
  55. Li, N.; Zhao, P.; Wang, J.; Deng, Y. The long-term change of latent heat flux over the western Tibetan Plateau. Atmosphere 2020, 11, 262. [Google Scholar] [CrossRef]
  56. Wang, Y.; Zheng, J.; Cheng, Z.; Wang, B. Characteristics of raindrop size distribution on the eastern slope of the Tibetan Plateau in summer. Atmosphere 2020, 11, 562. [Google Scholar] [CrossRef]
Figure 1. Map of the study area, in which the color shadings denote terrain altitude. The Tibetan Plateau and India are indicated by blue words.
Atmosphere 15 00117 g001
Figure 2. (a) Distribution of correlation coefficients between the summer WTPP index and simultaneous precipitation during the period 1981–2019. (b,c) As in (a), but for the periods 1981–2004 and 2005–2019, respectively. The black dots indicate the correlation coefficient significant at the 95% confidence level. The thick black contours denote the TP (3000 m above sea level). In (c), the green boxes from left to right denote the northwestern India (24–32° N, 71–76° E), western TP (32–36° N, 78–86° E), and eastern TP (33–36° N, 89–101° E) regions, respectively.
Atmosphere 15 00117 g002
Figure 3. (a) Running correlation coefficients on 15-year windows between the WTPP and ETPP indices (the black curve) and those between the WTPP and NWIP indices (the red curve). On the time axis, 1981 represents the period 1981–1995 and 2005 represents the period 2005–2019. The blue dashed lines denote the 95% confidence level. (b) As in (a), but for the one-by-one year-reducing windows from 39 to 15 years. On the time axis in (b), 1981 represents the period 1981–2019 and 2005 represents the period 2005–2019. The blue dashed curves denote the 95% confidence level.
Atmosphere 15 00117 g003
Figure 4. (a) Time series of the normalized WTPP (the red line) and ETPP (the blue line) during 2005–2019. (b) Time series of the normalized WTPP (the red line) and NWIP (the blue line) during 2005–2019. (c,d) as in (a,b), respectively, but during 1981–2004. The correlation coefficient (R) is shown at the top right of each figure.
Atmosphere 15 00117 g004
Figure 5. (a) Anomalies of summer 200 hPa geopotential heights (contours; units: gpm) and winds (purple vectors; units: m s−1) obtained by regressing upon the summer WTPP index during the period 2005–2019. (b,c) as in (a), but for the ETPP and NWIP indices. (df) as in (ac), but for 500 hPa geopotential heights (contours; units: gpm) and winds (purple vectors; units: m s−1). The shadings denote positive and negative geopotential height anomalies significant at the 95% (99%) confidence level, as shown by the color bars. The thick black contours denote the TP (3000 m above sea level). The green boxes (37–50° N, 70–102° E) in (ac) are used to define the TPGH-200 index, and the green boxes (30–40° N, 70–100° E) in (df) are used to define the TPGH-500 index.
Atmosphere 15 00117 g005
Figure 6. (a) Distribution of correlation coefficients (shadings) between the WTPP index and 200 hPa zonal winds (i.e., U winds) during the period 2005–2019. (c,d) as in (a), but for the ETPP and NWIP indices, respectively. (df) as in (ac), but for 700 hPa meridional winds (i.e., V winds). The black dots indicate the correlation coefficient significant at the 95% confidence level. The thick black contours denote the TP (3000 m above sea level). The black boxes (34–40° N, 78–97° E) in (ac) are used to define the U-200 index. The black triangles with the vertices (33° N, 75° E), (16° N, 88° E), and (22° N, 93° E) and the black boxes (28–31° N, 89–102° E) in (df) are used to define the V-700 index.
Atmosphere 15 00117 g006
Figure 7. (a) Correlation (contours) between the summer TPGH-500 index and simultaneous geopotential heights along the 90° E meridional–vertical cross section during the period 2005–2019. (b) as in (a), but for the correlation during the period 1981–2014. The shadings denote the positive and negative correlations significant at the 99% and 99.9% confidence levels, as shown by the color bars. The black shading represents the terrain.
Atmosphere 15 00117 g007
Figure 8. (a) Distribution of correlation coefficients (color shadings) between the summer U-200 index and simultaneous precipitation during 2005–2019. (b) as in (a), but for the V-700 index. The black dots indicate the correlation coefficient significant at the 95% confidence level. The thick black contours denote the TP (3000 m above sea level).
Atmosphere 15 00117 g008
Figure 9. (a) Distribution of correlation coefficients (color shadings) between the summer independent U-200 index and simultaneous precipitation during the period 2005–2019. (b,c) as in (a), but for the independent V-700 and ULCC indices, respectively. The correlation coefficients significant at the 95% confidence level are stippled. The thick black contours denote the TP (3000 m above sea level).
Atmosphere 15 00117 g009
Figure 10. Schematic diagram summarizing the modulation of upper- and lower-tropospheric coupled circulation anomalies on the covariability of the WTPP, ETPP, and NWIP during 2005–2019. The red cylinder indicates the thick geopotential height anomaly, which tilted slightly northward, governed the TP, forming upper- and lower-level coupled circulation anomalies. The red arrows indicate anomalous upper-level anticyclone to the north of the TP and lower-level anticyclone over the TP. The green arrows indicate anomalous upper-level westerlies over the TP and lower-level southeasterlies and northeasterlies around the southern flank of the TP.
Atmosphere 15 00117 g010
Figure 11. (a) Distribution of correlation coefficients (color shadings) between the summer U-200 index and simultaneous precipitation during 1981–2004. (b) as in (a), but for the V-700 index. The black dots indicate the correlation coefficient significant at the 95% confidence level. The thick black contours denote the TP (3000 m above sea level).
Atmosphere 15 00117 g011
Figure 12. Anomalies of summer (a) 200 and (b) 500 hPa geopotential heights (contours; units: gpm) and winds (purple vectors; units: m s−1) obtained by regressing upon the summer WNP-SST index during the period 2005–2019. The shadings denote geopotential height anomalies significant at the 95% and 99% confidence levels. The thick black contours denote the TP (3000 m above sea level).
Atmosphere 15 00117 g012
Figure 13. (a) Distribution of correlation coefficients between the summer WNP-SST index and simultaneous precipitation during the period 2005–2019. (b,c) as in (a), but for the TA-SST and WNP-TA-SST indices, respectively. The black dots indicate the correlation coefficient significant at the 95% confidence level. The thick black contours denote the TP (3000 m above sea level). In (c), the green boxes from left to right denote the NWI, WTP, and ETP regions, respectively.
Atmosphere 15 00117 g013
Figure 14. Anomalies of summer (a) 200 and (b) 500 hPa geopotential heights (contours; units: gpm) and winds (purple vectors; units: m s−1) obtained by regressing upon the summer TA-SST index during the period 2005–2019. The shadings denote geopotential height anomalies significant at the 95% and 99% confidence levels. The thick black contours denote the TP (3000 m above sea level).
Atmosphere 15 00117 g014
Figure 15. Schematic diagram summarizing the combined effect of the WNP and TA SSTs on precipitation covariability during 2005–2019.
Atmosphere 15 00117 g015
Disclaimer/Publisher’s Note: The statements, opinions and data contained in all publications are solely those of the individual author(s) and contributor(s) and not of MDPI and/or the editor(s). MDPI and/or the editor(s) disclaim responsibility for any injury to people or property resulting from any ideas, methods, instructions or products referred to in the content.

