Article

Projected Changes of Wind Energy Input to Surface Waves in the North Indian Ocean Based on CMIP6

1
College of Ocean Science and Engineering, Shandong University of Science and Technology, Qingdao 266590, China
2
Laboratory for Regional Oceanography and Numerical Modeling, Pilot National Laboratory for Marine Science and Technology, Qingdao 266590, China
3
State Key Laboratory of Tropical Oceanography, South China Sea Institute of Oceanology, Chinese Academy of Sciences, Guangzhou 510301, China
*
Author to whom correspondence should be addressed.
Atmosphere 2024, 15(1), 139; https://doi.org/10.3390/atmos15010139
Submission received: 1 December 2023 / Revised: 12 January 2024 / Accepted: 18 January 2024 / Published: 22 January 2024
(This article belongs to the Special Issue New Insights in Atmospheric Teleconnection)

Abstract

:
This paper explores the effects of climate change on the wind energy input (WEI) to the surface waves (SWs) in the northern Indian Ocean (NIO), a region with great potential for green renewable energy from waves and wind. We used the newly developed Coupled Model Intercomparison Project Phase 6 (CMIP6) model data to predict the spatiotemporal variations of the WEI to the SW. We found that, under the global warming scenario, the WEI to the SWs decreased significantly in most of the NIO, and it will drop by 18% to 27% in the central and southern regions by the end of the 21st century under the SSP5–8.5 scenario. However, the WEI to the SWs increased in the Red Sea, Persian Gulf, northwestern Arabian Sea, and northern Bay of Bengal, with the largest increase in the Persian Gulf region (up to 27%). We also examined the interannual and interdecadal variability characteristics of the WEI to the SW after the accumulation of the whole study region and found that it showed a long-term increasing trend only under the SSP1–2.6 scenario, while it showed a significant decreasing trend under the SSP2–4.5 and SSP5–8.5 scenarios. Furthermore, we show that the WEI to the SWs in the Indian Ocean mainly occurs in summer, followed by winter.

1. Introduction

The Indian Ocean plays a pivotal role in global climate change and ocean energy research. Since 2005, the Indian Ocean’s warming and the surge in anthropogenic aerosol concentration have significantly impacted the summer monsoon circulation over the Indian Ocean. The Indian Ocean monsoon has demonstrated a distinct weakening trend over recent decades, with aerosols identified as the primary factor inducing the weakening of the summer monsoon [1,2,3,4]. The direct impact of the weakening of the North Indian Ocean (NIO) summer monsoon is a reduction in monsoon rainfall. Drought-prone countries around the NIO are highly dependent on monsoon rains for their agriculture, economy, food security, and overall health. Therefore, the weakening of the NIO summer monsoon significantly affects the climates of neighboring countries, even in China, South Korea, and Japan, as well as the development of agriculture and economy [5,6,7]. WE in the ocean can serve as an important renewable energy source, playing a crucial role in reducing carbon emissions and mitigating climate change [8]. Meanwhile, the Indian Ocean is one of the world’s maritime shipping centers, with abundant marine resources, numerous marine energy channels, and a central location on the Maritime Silk Road [9]. Therefore, the development and utilization of wind and wave energy are necessary for the energy needs and economic development of neighboring countries and for past ships. The wind energy input (WEI) to the ocean surface waves (SWs), recognized as a renewable energy source, holds considerable research potential for the advancement and utilization of future energy. The implications of climate change will be particularly noticeable in coastal regions where human activities intersect with the ocean. Importantly, the escalation in coastal wave energy suggests that coastal risk and adaptability will face heightened challenges [10]. Waves serve as a vital conduit between the atmosphere and the ocean, channeling substantial amounts of heat, momentum, and gas fluxes into the ocean via the air–sea interface [11]. Concurrently, the WEI to SWs constitutes the dominant component of the WEI to the ocean [12]. Over the past three decades, a multitude of scholars have conducted pertinent research on the WEI to the ocean [12,13,14,15,16]. The WEI to the ocean is approximately 70 TW [17], of which the WEI to the SWs is about 68 TW [11]. The WEI to the SWs exhibits variations across different periods and is contingent on different estimation methods. Wang and Huang utilized satellite data to estimate that the average WEI to the world’s ocean via the SW was about 60 TW during 1997–2002 [12], which was fundamentally consistent with the model-simulated results from 2005 (57 TW) and 2003–2007 (68 TW) [11,18].
Climate models enable us to assess the impact of future global climate change on the WEI input to the ocean surface. Global climate models (GCMs) and regional climate models (RCMs) have been extensively applied to predict future changes in various meteorological elements [19,20,21]. Since the Coupled Model Intercomparison Project Phase 5 (CMIP5), many studies have used CMIP datasets (e.g., CMIP5 and CMIP6) to analyze and forecast the spatiotemporal changes in wind speed or wind energy in the future [22,23,24,25,26,27,28,29,30]. The latest CMIP6 datasets include more complex processes and higher resolutions of atmospheric and ocean models than CMIP5 datasets. Many models have achieved bidirectional coupling of atmospheric and ocean processes [31]. In addition, the Shared Socioeconomic Pathways (SSPs) in CMIP6 consider the specific social development paths and provide more diversified emission scenarios, which can offer more reasonable simulation results for mitigation and adaptation research and regional climate prediction. Based on CMIP6 models, scholars have predicted the future changes in wind energy, monsoons, precipitation, and other meteorological elements at the global and regional scales [20,26,27,32,33,34,35], mainly focusing on China [28,33,36], North America, Northern Europe [26,34,37], and other wind energy hotspots and wind-energy-rich land areas. However, the prediction of wind and wind energy in the world’s oceans and seas is relatively scarce, mostly in the global [25,38,39], Caribbean Sea [40], and North Sea [35] regions. The prediction of WEI to the ocean surface is even rarer. Pourali et al. predicted a 21% to 45% increase in the future wave energy changes in the Gulf of Oman under the SSP5−8.5 based on CMIP6 CNRM model results [41].
Previous studies have shown that the WEI to the global ocean SWs varies significantly across regions due to climate change and environmental factors [15,42,43]. The Southern Ocean has the strongest WEI, followed by the equatorial and western boundary regions of the Indian, Pacific, and Atlantic Oceans, especially the tropical Pacific region [15,42,43,44,45,46,47]. Some studies have focused on the North Atlantic subpolar and North Pacific subtropical regions [45,48,49]. There are relatively fewer studies on the Indian Ocean. In recent years, some scholars have only analyzed the spatial distribution of WEI to SWs [41,50,51]. Pourali et al. calculated the wave energy at different locations in the northern part of the Gulf of Oman and found that the relative enhancement of wave energy was greater in the western part [41]. Hammar et al. found that the southern part of the Western Indian Ocean has a high wave energy potential, with the highest wave energy in southern Madagascar [50]. Yang et al. analyzed NIO’s wind and wave energy resources based on WW3 (a third-generation ocean wave model), and the results showed that the Somali waters, the Arabian Sea, and the southern NIO have the most abundant wind and wave energy resources, followed by the La Cardiff Sea, while the middle of the NIO is relatively poor [51]. However, there are no studies that have used CMIP6 simulations to predict the WEI to the SWs in the Indian Ocean.
In summary, wind power, representing a clean and sustainable source of energy in the NIO, holds significant potential for meeting global energy needs, reducing carbon emissions, and fostering sustainable development. However, current research on the WEI to SWs is severely lacking, particularly regarding predictions utilizing CMIP6 data. As such, no relevant studies have thus far been undertaken. Against this backdrop, this research seeks to assess the impact of future global climate change on the WEI to the ocean SW in the NIO (40–100° E, 0–30° N) using climate models. The CMIP6 simulation results provide new opportunities and methods to reveal future changes in WEI input to the SW in NIO. Accurate prediction and evaluation of the changes in WEI to the SW of the NIO are of great importance for optimizing energy management, reducing environmental impact, and promoting sustainable development. Based on these issues, this paper uses ERA5 reanalysis data (1995–2014) and CMIP6 model data to predict and study the spatiotemporal changes in the WEI to ocean SWs in the NIO under different social scenarios in the 21st century as well as future projections. The remainder of this paper is structured as follows. Section 2 presents the data and methods used in this work. In Section 3, the projected spatiotemporal variation of the WEI and its low-frequency variations and trends are analyzed in detail. Section 4 presents a discussion. Finally, in Section 5, conclusions are drawn.

2. Data and Methods

2.1. CMIP6 and ERA5 Data

This study examines the spatial and temporal variations in the WEI to SWs and the impact of seasonal changes on WEI estimation under various climate change scenarios. The data used for this analysis were the monthly surface wind stress (WS) data, sourced from the CMIP6 GCMs [23]. WS data are a direct output of CMIP6, which refers to the force exerted by the wind on the sea surface, including the two main components of the meridional wind stress (along the direction of the wind) and the transverse wind stress (perpendicular to the direction of the wind). The CMIP6 GCMs generally simulate the historical stage from 1850 to 2014. Due to the limited quality and availability of grid data before the satellite era [52], herein, the period of 1995–2014 is considered to keep the period common in terms of the model’s historical simulation, reanalysis, and observation data sets. This selection aimed to minimize potential errors. Three distinct climate change scenarios were considered for future simulations: SSP1–2.6, SSP2–4.5, and SSP5–8.5 [53]. SSP1–2.6 represents a low greenhouse gas emission scenario, aligning with a sustainable development pathway that will result in a 2.6 Wm−2 forcing pathway by 2100. SSP2–4.5 represents a medium greenhouse gas emission scenario, assuming current climate change trends continue, leading to a 4.5 Wm−2 forcing pathway by 2100. SSP5–8.5 represents a high greenhouse gas emission scenario where no greenhouse gas reduction policies are implemented, resulting in intensive fossil fuel combustion and an 8.5 Wm−2 forcing pathway by 2100 [54]. For each scenario, two reference periods are considered, 2046–2065 (mid-term future) and 2080–2099 (long-term future), in this paper. Combined with the previous research results and limitations [26], initially, we developed an objective evaluation system to quantitatively assess the capability of CMIP6 GCMs to simulate surface wind stress characteristics during the historical period, each model’s performance was evaluated using this system. Following this, a select few models that demonstrated superior performance were chosen for integration, thereby reducing the models’ systematic bias. This approach helps to mitigate the variability and uncertainty inherent in individual models, thereby enhancing the reliability of the results. Subsequently, the integrated wind data from this multi-model ensemble were utilized to assess future shifts in large-scale wind energy resources in the NIO. Table 1 provides details of the 10 selected CMIP6 GCMs, including the model name, development organization, model’s spatial resolution, and main references. These models provided future (mid-term and long-term) predicted data for monthly surface WS under the three climate change scenarios (SSP1–2.6, SSP2–4.5, and SSP5–8.5).
The availability of observed surface WS data in the NIO is limited and not publicly accessible. To validate the accuracy of the model, we compared historical data (1995–2014) from GCMs with ERA5 reanalysis data from the European Centre for Medium-Range Weather Forecasts (ECMWF) [55]. ERA products have traditionally been the official validation database for the CMIP [56]. Although reanalysis is not purely observational, it is generally considered to be sufficiently close to observational results and can be used as a reference for climate research [24,57,58,59]. The latest fifth-generation reanalysis system, ERA5, offers higher spatiotemporal resolution and various improvements [55,60]. In this study, we used monthly mean surface WS data with a resolution of 0.25° × 0.25° and a time span of 1995–2014.
Table 1. Information on the 10 CMIP6 climate models used in this paper.
S/NModelInstituteResolution
(lon × lat)
References
1ACCESS6-CM2Commonwealth Scientific and
Industrial Research Organisation
1.88 × 1.25[61,62]
2BCC-CSM2-MRBeijing Climate Center (BCC) and China Meteorological Administration (CMA)1.13 × 1.13[63,64]
3CMCC-CM2-SR5Euro-Mediterranean Centre on
Climate Change coupled climate mode
1.25 × 0.94[65,66]
4GFDL-ESM4Geophysical Fluid Dynamics
Laboratory (GFDL)
1.25 × 1.00[67,68]
5INM-CM4-8Institute of Numerical Mathematics2.00 × 1.50[69,70]
6INM-CM5-0Institute of Numerical Mathematics2.00 × 1.50[71,72]
7IPSL-CM6A-LRInstitute Pierre-Simon Laplace (IPSL)2.50 × 1.26[73,74]
8MIROC6Japanese Modeling Community1.41 × 1.41[75,76]
9MPI-ESM1-2-LRMax Planck Institute1.88 × 1.88[77,78]
10MRI-ESM2-0Meteorological Research Institute (MRI)1.13 × 1.13[79,80]

2.2. Methodology

2.2.1. Study Domain

In this study, the research domain is the NIO, and the latitude and longitude ranges are 40–100° E, 0–30° N. In order to better compare and analyze the pattern results of ERA5 and CMIP6, a linear interpolation method was employed to remap the ERA5 data and CMIP6 GCMs data onto a common grid of 2.0° × 2.5° (latitude × longitude). This was necessary due to the differences in spatial resolution among different GCMs. To obtain more accurate and reliable results, this study utilized the ensemble mean (EnsMean) of CMIP6 simulations as defined by Akinsanola and Zhou [81]. Multi-model ensembles have been proven to be an effective method for minimizing individual model biases and reducing uncertainties, and they often exhibit better and more reliable results than single models [82,83].

2.2.2. Surface Wave Power

To calculate the wind energy input to the surface waves, several methods are available. This calculation is primarily influenced by the wind stress, the effective phase velocity of the surface wave, and the sea condition. Notably, the calculation formulas for different wave ages vary slightly. Scholars have developed their own empirical formulas based on experimental results. For this paper, we utilized the calculation formula provided by Wang and Huang. For more information, please refer to the second chapter of the original text [12]. The WEI into SWs can be estimated by the following equation [12]:
W w a v e = A 3.5 ρ a τ ρ a 3 2 d x   d y
where W w a v e represents the WEI into SWs, A is the area of the calculated ocean, ρ a = 1.2   kg / m 3 is the air density, and τ is the magnitude of surface WS.

2.2.3. The Annual Mean or Seasonal Mean Wind Energy Input Rate

The annual mean or seasonal mean wind energy input rate be calculated by
W ¯ = 1 N i = 1 n W i
where W ¯ is the multi-year annual average or multi-year seasonal average wind energy input rate, N is the number of years for the sample, and W i is the WEI for the annual mean or a specific seasonal mean in the ith year.

3. Results

3.1. Evaluation of Historical CMIP6 Runs

The ability of CMIP6 models to simulate sea surface WS can be evaluated by comparing historical simulations with reanalysis data from ERA5. In this study, we present the spatial distribution of the climatological annual mean and seasonal mean WS (magnitude and direction) for ERA5 reanalysis data and the EnsMean data of CMIP6 models during the historical period of 1995–2014, as well as their relative biases (i.e., EnsMean minus ERA5), as shown in Figure 1. The EnsMean effectively reproduced the spatial distribution of WS (including speed and direction) observed by ERA5 on annual and seasonal timescales. Broadly, the climatological annual mean WS was dominated by north-westerly winds in the NIO, with the maximum value areas located in the eastern waters of Somalia and the northwestern Arabian Sea, reaching about 0.1 N/m2, and the prevailing wind directions were north-westerly and westerly (Figure 1a). The NIO is the most significant region for monsoons in the global ocean due to its unique geographical location. The climatological distribution of WS during summer (June–July–August) has the most significant impact on the annual mean climatological WS, which basically determines its characteristics of spatial distribution, followed by the northeast monsoon in winter (December–January–February), while the impacts of spring (March–April–May) and autumn (September–October–November) on the annual mean are relatively small. During the summer season, the southwest monsoon prevails over the NIO, and the region is almost controlled by the southwest airflow. The great value center is located in most of the eastern waters of Somalia and the Arabian Peninsula, with a maximum value exceeding 0.2 N/m2 (Figure 1j). In winter, the monsoon direction moves away from the Asian continent, and the NIO is dominated by north-easterly winds. The maximum value areas of WS are mainly located in the eastern waters of Somalia and the eastern waters of Sri Lanka (Figure 1d), and their sizes are smaller than in summer, with a maximum of 0.1 N/m2, which is approximately half of that in summer. Spring and autumn are the transition seasons for the NIO monsoon; the wind is weaker and the direction is unstable (Figure 1g,m). Our findings are consistent with previous research results [84].
On annual and seasonal timescales, the EnsMean data from CMIP6 (Figure 1b,e,h,k,n) can effectively replicate the magnitude and spatial distribution of WS observed in the ERA5 reanalysis dataset, particularly on an annual timescale (Figure 1c). The annual mean climatological WS obtained from the EnsMean was in good agreement with most of the areas in the NIO, especially in the inner area of the NIO, with relative biases of less than 40% (Figure 1c). The EnsMean was able to capture most of the climatological details of WS observed in ERA5 reanalysis (Figure 1c,f,i,l,o), which is consistent with the findings of Sawadogo et al. [85]. However, there were still significant deviations in certain specific regions at specific times. For instance, the EnsMean generally overestimated the WS in most of the coastal areas of the NIO, particularly in winter (Figure 1f), with an overestimation of 10–50% in the western boundary of the NIO, most of the Arabian Sea, and the southern Bay of Bengal. In the low-latitude areas south of 5° N, the EnsMean underestimated the WS by approximately 30–50% in spring compared to ERA5 observations (Figure 1i), and this underestimation bias further expanded to 50–70% in autumn (Figure 1o). Overall, the EnsMean results can effectively replicate the WS in the NIO and minimize the single-model bias and uncertainty.

3.2. Projected Variation in Wind Energy Input to the Sea Surface Waves in the North Indian Ocean

The WEI into the ocean is the crucial energy source for maintaining large-scale surface circulation and driving deep ocean currents. Among these, the WEI into SWs is the most significant aspect of WEI into the ocean [12]. This study predicts the spatial and temporal variations in the WEI to SWs in the NIO for the mid-term future (2046–2065) and long-term future (2080–2099) at annual and seasonal timescales based on three climate change scenarios (SSP1–2.6, SSP2–4.5, and SSP5–8.5).
Figure 2 illustrates the spatial distribution of the annual mean climatology (Baseline) of the WEI into SWs during the period of 1995–2014, and the spatial distribution of the annual mean WEI variation trend under different scenarios in the future stage. Based on the baseline data, it can be observed that the areas with the maximum WEI values are mainly located in the waters surrounding Somali, the Red Sea, the southwestern and eastern coastal areas of the Arabian Sea, and the northern waters of Sri Lanka, with a maximum value per unit area reaching up to 0.21 W/m2. Followed by the Persian Gulf, the northern Arabian Sea and the Bay of Bengal had ranges of 0.04–0.08 W/m2, while the low-latitude waters of the NIO exhibited relatively smaller values, only 0.01−0.03 W/m2. This distribution pattern is primarily attributed to the influence of the strong southwest monsoon.
Based on the findings presented in Figure 2, there are significant regional differences in the variation trend of WEI to SWs. The most significant increase in WEI was observed in the Persian Gulf, followed by the Red Sea, the northern and northwestern Arabian Sea, and the northern Bay of Bengal. Conversely, a significant decrease in WEI was observed in most of the central and southern parts of the NIO, particularly within the latitude range of 5–10° N. Meanwhile, two distinct low-value centers were observed in the southwestern sea area of the Indian Peninsula and the southeastern sea area of Sri Lanka. All three climate change scenarios predicted important changes in WEI to SWs during the mid-term future (2046–2065) and long-term future (2080–2099). However, the average WEI to SWs did not exhibit a significant change (less than 16%) compared to the historical period (1995–2014) during the mid-term future (Figure 2a–c). Nevertheless, the magnitude of change is expected to increase significantly in the long-term future, with WEI in the Persian Gulf projected to increase by nearly 30%. It is worth noting that variation trends discovered in a specific region during the mid-term future, whether positive or negative, tend to amplify over the long term.
The predicted changes in WEI to SW exhibited similar spatial distributions under a low-emission scenario (SSP1–2.6), a medium-emission scenario (SSP2–4.5), and a high-emission scenario (SSP5–8.5), but with a greater magnitude of changes under the high-emission scenario. As greenhouse gas emissions increase, the center of the maximum decrease in WEI gradually shifts northeastward, and the range of decrease further expands (Figure 2). The climate scenario characterized by intensive greenhouse gas emissions (SSP5–8.5) results in the largest changes in WEI, within a range of −30% to +30% in the long-term future. Projections under this scenario indicate a widespread decrease of approximately 21% in WEI over most of the central and southern parts of the NIO, with further reductions of about 27% in the southwestern waters of the Indian Peninsula and the southern waters of Sri Lanka. Conversely, certain regions are expected to experience significant increases in WEI under the same climate scenario (SSP5−8.5): the Red Sea and the northern Bay of Bengal (~9%), the northern and northwestern Arabian Sea (>15%), and the Persian Gulf (up to 30%) (Figure 2f). The predicted changes in WEI under the SSP2–4.5 and SSP1–2.6 scenarios show similar spatial distributions to the SSP5–8.5 scenario, but with relatively smaller magnitudes of change. Consistent with the SSP5–8.5 scenario, both of these two scenarios also predict a general decrease in WEI over the central and southern waters of the NIO, although to a lesser extent.
The NIO is a region with the most prominent monsoons in the global oceans. The wind direction changes every six months, and the WEI into SWs exhibits significant seasonal variations under the influence of the monsoon [84]. In winter, the areas with the highest WEI values are found in the waters surrounding Somalia, the northern waters of Sri Lanka, and the eastern Bay of Bengal, with maximum values exceeding 0.21 W/m2. However, in other areas, the WEI is relatively small, approximately 0.03–0.06 W/m2 (Figure 3 baseline).
Figure 3 shows that the variation trends of WEI to SWs during winter are significantly different in spatial distributions from the annual average. Firstly, the sea areas where WEI increases or decreases differ. Secondly, the centers of high value with linear trend changes also differ. The WEI to SWs exhibits a decreasing trend in most of the NIO, forming two great value centers in the northeastern and southwestern Arabian Sea. However, it shows a slight increasing trend in the Red Sea, the Persian Gulf, the northwestern and southeastern Bay of Bengal, and the southern waters of the Indian Peninsula. When compared to the historical period of climatological WEI from 1995 to 2014, the average WEI varies within the range of −18% to 8% during the mid-term future (2046–2065). Under the SSP1–2.6 and SSP2–4.5 scenarios, the predicted changes in WEI were generally similar in terms of spatial distribution and magnitude. However, under the high-emission scenario of SSP5–8.5, there was a widespread decrease in WEI in the NIO, with a much larger decrease in the Arabian Sea (14% to 18%) than in the Bay of Bengal (6% to 12%) (Figure 3c).
The variation of WEI will further increase in the range of −32% to 16% in the long-term future (2080–2099). All three climate change scenarios predict a general decrease in WEI in the Arabian Sea, with larger change amplitude expected as greenhouse gas emissions increase. Specifically, the maximum decrease in WEI is estimated to be approximately 32% under the high-emission scenario of SSP5–8.5 (Figure 3f). In the Bay of Bengal, differences among the three climate change scenarios were observed. The low emission scenario of SSP1–2.6 predicted an overall decrease in WEI, while no overall trend was found in the SSP2–4.5 and SSP5–8.5 scenarios, with increases or decreases in WEI depending on the specific region considered.
As can be seen from the baseline of Figure 4, the area with the highest WEI during the spring season extends to the coastal waters of the NIO, but with a slight decrease in magnitude, reaching a maximum of 0.15 W/m2. In the inner area of the NIO, it is only 0.01–0.03 W/m2.
During the spring season, the WEI to SWs exhibits varying degrees of increase in the northern and northwestern Arabian Sea, the northern Bay of Bengal, and the Red Sea, while it shows varying degrees of decrease in most of the central and southern parts of the NIO. The average WEI varies within a range of ±18% in the mid-term future (2046–2065) compared to the climatological WEI during the historical period of 1995–2014. Regions with a decreasing trend in WEI have two significant centers: the western waters of the Indian Peninsula and the 0–5° N waters south of the Bay of Bengal. In the long-term future (2080–2099), the magnitude of WEI variation will further increase. The maximum center of the decreasing trend in WEI is located in the 0–5° N region south of the Bay of Bengal, transitioning from two centers in the mid-term future to one. If measures are not taken to reduce greenhouse gas emissions (SSP5–8.5 scenario), the increase in WEI in the northwestern Arabian Sea may reach a maximum of 27%, and the decrease in WEI in the low-value center region may be as high as approximately 32% (Figure 4f). The situation under the SSP2–4.5 scenario is similar to the SSP5−8.5 scenario, but the magnitude of change is relatively smaller (Figure 4e). Under the SSP1–2.6 scenario, the WEI increases slightly compared to the historical period in the western and northern Arabian Sea, the Persian Gulf, and the northern Bay of Bengal, but the change is not significant, mostly below 12%. The decrease in WEI reaches approximately 16% in the southern Bay of Bengal and the southern waters of Sri Lanka (Figure 4d).
During the summer season, the WEI to SWs is relatively consistent with the spatial distribution of the annual mean climate state, but the magnitude is much larger. Except for the southern area, where the WEI is small (about 0.075 W/m2), the WEI in other areas is particularly large, especially in the waters surrounding Somalia, the western Arabian Sea, the western coastal waters of the Indian Peninsula, and the northern waters of Sri Lanka, with the maximum value exceeding 0.6 W/m2 (Figure 5 baseline).
Based on the findings presented in Figure 5, a significant increasing trend in WEI to SW can be observed in the Persian Gulf. This is followed by the Red Sea, the northern and northwestern Arabian Sea, and the northern Bay of Bengal. Conversely, varying degrees of decreasing trends in WEI can be seen in most of the central and southern parts of the NIO. The predicted changes in WEI during the summer season are basically consistent in spatial distribution with the predicted changes throughout the year, indicating that the WEI into SWs is primarily driven by the summer southwest monsoon.
In comparison to the climatological WEI from 1995–2014, there is a significant variation in WEI to SW during the summer season. It is anticipated that the average WEI will fluctuate within a range of ±30% in the mid-term future (2046–2065), while this variation range is expected to increase to ±40% in the long-term future (2080–2099). Under the high emission scenario of SSP5−8.5, the WEI to SW is expected to decrease by approximately 20–30% in the central and southern parts of the NIO. Additionally, there will be further reductions of around 40% in the southwestern waters of the Indian Peninsula and the eastern waters of Sri Lanka. Conversely, an increase in WEI to SW is predicted in the northern Bay of Bengal (10%), the northern and northwestern Arabian Sea (10–25%), and the Persian Gulf (up to 40%) (Figure 5f). Under the moderate emission scenario of SSP2–4.5, the spatial distribution of WEI changes is similar to the SSP5−8.5 scenario, but with relatively lower magnitudes (Figure 5e). Under the low emission scenario of SSP1–2.6, there is a slight decrease in WEI in most of the southern waters of the NIO, with a decrease of no more than 10%. However, there is an increasing trend in WEI in the northern waters of the NIO, with an increase of approximately 5–10%, and a significant increase of about 20% in the Persian Gulf (Figure 5d).
The WEI is relatively small in autumn, and the areas with the highest values are mainly located in the waters surrounding Somalia, the northern waters of Sri Lanka, and the eastern Bay of Bengal, with maximum values of 0.15 W/m2 per unit area. These are followed by the western Arabian Sea, the western coastal waters of the Indian Peninsula, and the western Bay of Bengal, with ranges of 0.06–0.09 W/m2, while in other areas, the input values are small, not exceeding 0.03 W/m2 (Figure 6 baseline).
During the autumn season, the WEI into SWs exhibits varying degrees of increase in the Persian Gulf, the northern and northwestern Arabian Sea, and the northern Bay of Bengal, while it shows varying degrees of decrease in the southern part of the NIO. Furthermore, the trends observed in the medium-term future, whether positive or negative, are expected to amplify in the long-term future (Figure 6). The low-emission scenario of SSP1−2.6 predicts an increase in WEI in the central and northern parts of the NIO, and the increase in the Bay of Bengal (8%~16%) is expected to be much greater than that in the Arabian Sea (~8%). However, the WEI is expected to decrease in the Red Sea and most areas of the southern part of the NIO, with a decrease of approximately 8% to 16% (Figure 6d). Under the SSP2–4.5 scenario, the areas exhibiting decreasing trends in WEI expand northward, with a further increase in the magnitude of the decrease (Figure 6e). Under the high-emission scenario of SSP5–8.5, the spatial distribution of WEI changes is similar to that of the SSP2–4.5 scenario, but with larger magnitudes of change. The significant increase in WEI is approximately 20% in the northwestern Arabian Sea and the northern Bay of Bengal, and further increases to 32% in the Persian Gulf. Conversely, the decrease in WEI ranges from approximately 16% to 28% in most parts of the southern parts of the NIO (Figure 6f).

3.3. Low-Frequency Variations and Trends in Energy Input of Wind Stress Direction Surface Waves under Different Scenarios

In this study, we computed the time series of integrated WEI to SWs over the entire NIO under different scenarios based on EnsMean data from CMIP6. The bootstrap test was used to analyze the trend of the WEI to SW, and the significance level was also set at 5%. The annual mean (Figure 7) and seasonal mean (Figure 8, Figure 9, Figure 10 and Figure 11) time series were calculated. The annual mean WEI to SWs exhibited significant interannual and long-term trends under different scenarios during the period from 2015 to 2099 (Figure 7). Under the low-emission scenario of SSP1−2.6, the WEI into SW showed significant interannual variations and an increasing trend. The annual variation amplitude was about 30 GW, and the increasing trend was about 0.3 GW/y. Under the medium-emission scenario of SSP2–4.5 and the high-emission scenario of SSP5–8.5, the interannual variation amplitudes of WEI were basically similar to that in the SSP1–2.6 scenario, but there was a significant decreasing trend in the variation trend. With the increase in emission concentration, the decreasing trend grew greater, with decreasing trends of −0.1 GW/y and −0.3 GW/y, respectively.
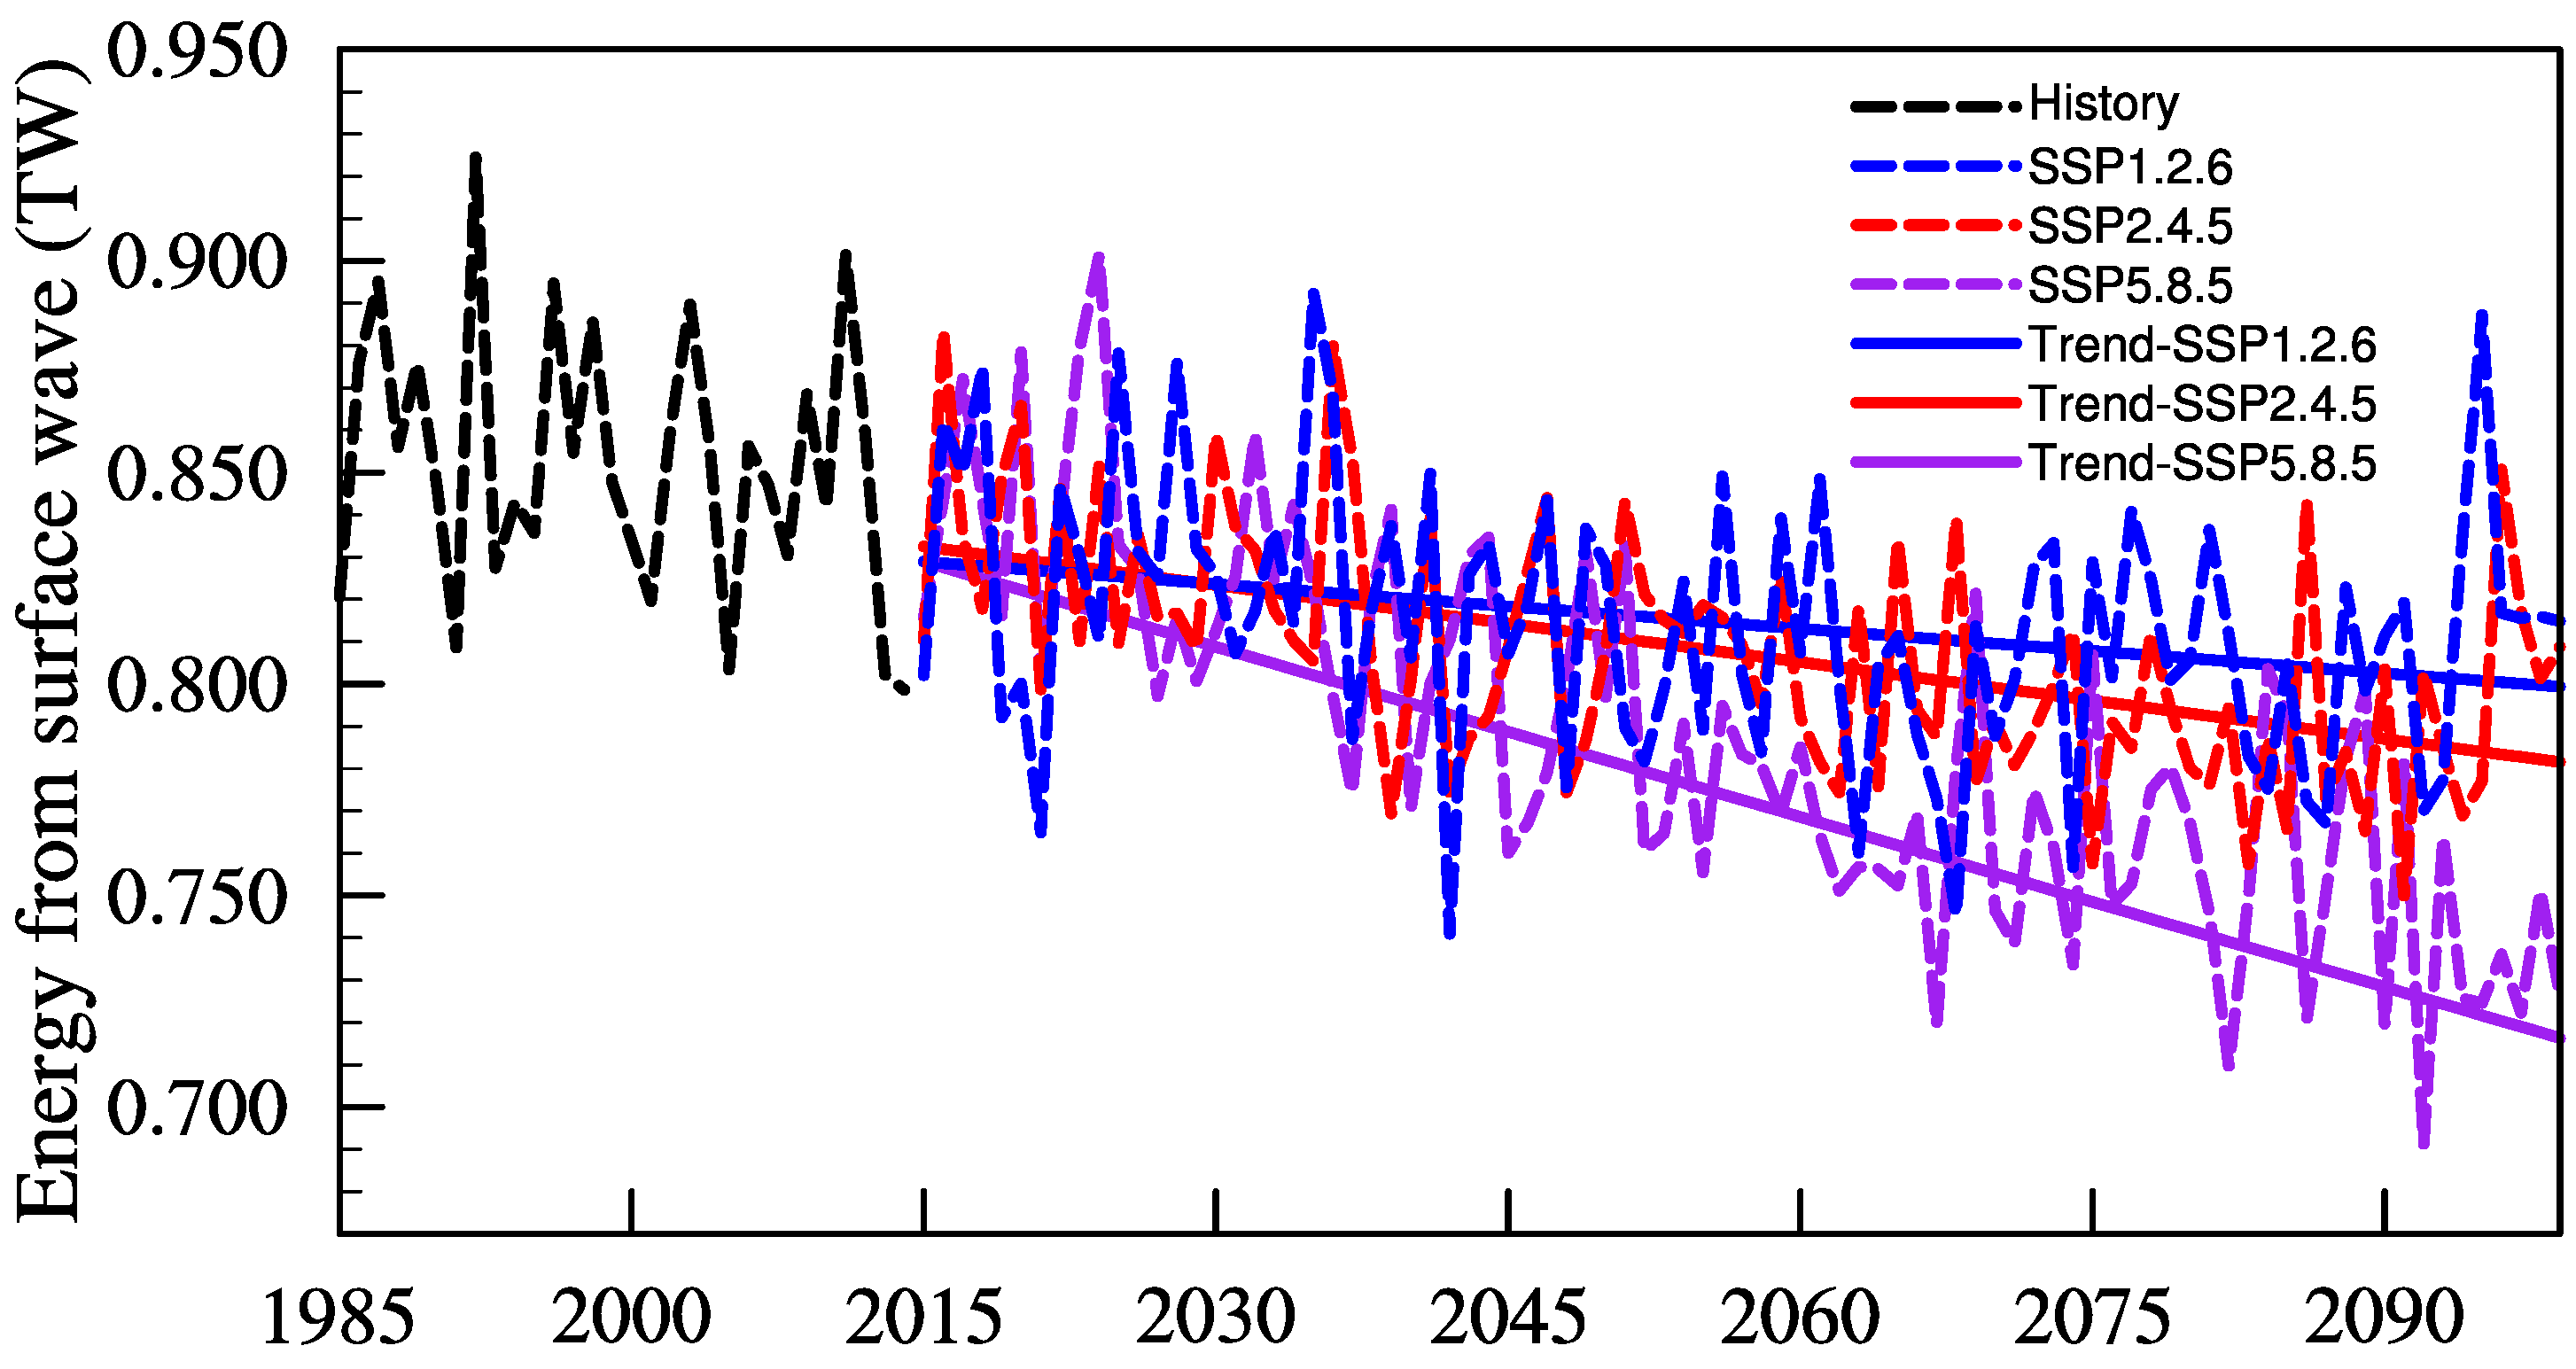
From 2015 to 2099, the seasonal mean WEI into SWs also displays notable interannual and long-term trends under different scenarios (Figure 8, Figure 9, Figure 10 and Figure 11). During the winter season, the amplitude of interannual variation in WEI into SWs is relatively consistent among low-emission scenarios (SSP1–2.6), medium-emission scenarios (SSP2–4.5), and high-emission scenarios (SSP5–8.5), with an annual variation amplitude of approximately 50 GW (Figure 8). Across the three climate change scenarios, the average WEI into SW exhibits a decreasing trend, with the magnitude of the decline increasing with the concentration of emissions, namely, −0.3 GW/y, −0.6 GW/y, and −1.3 GW/y, respectively.
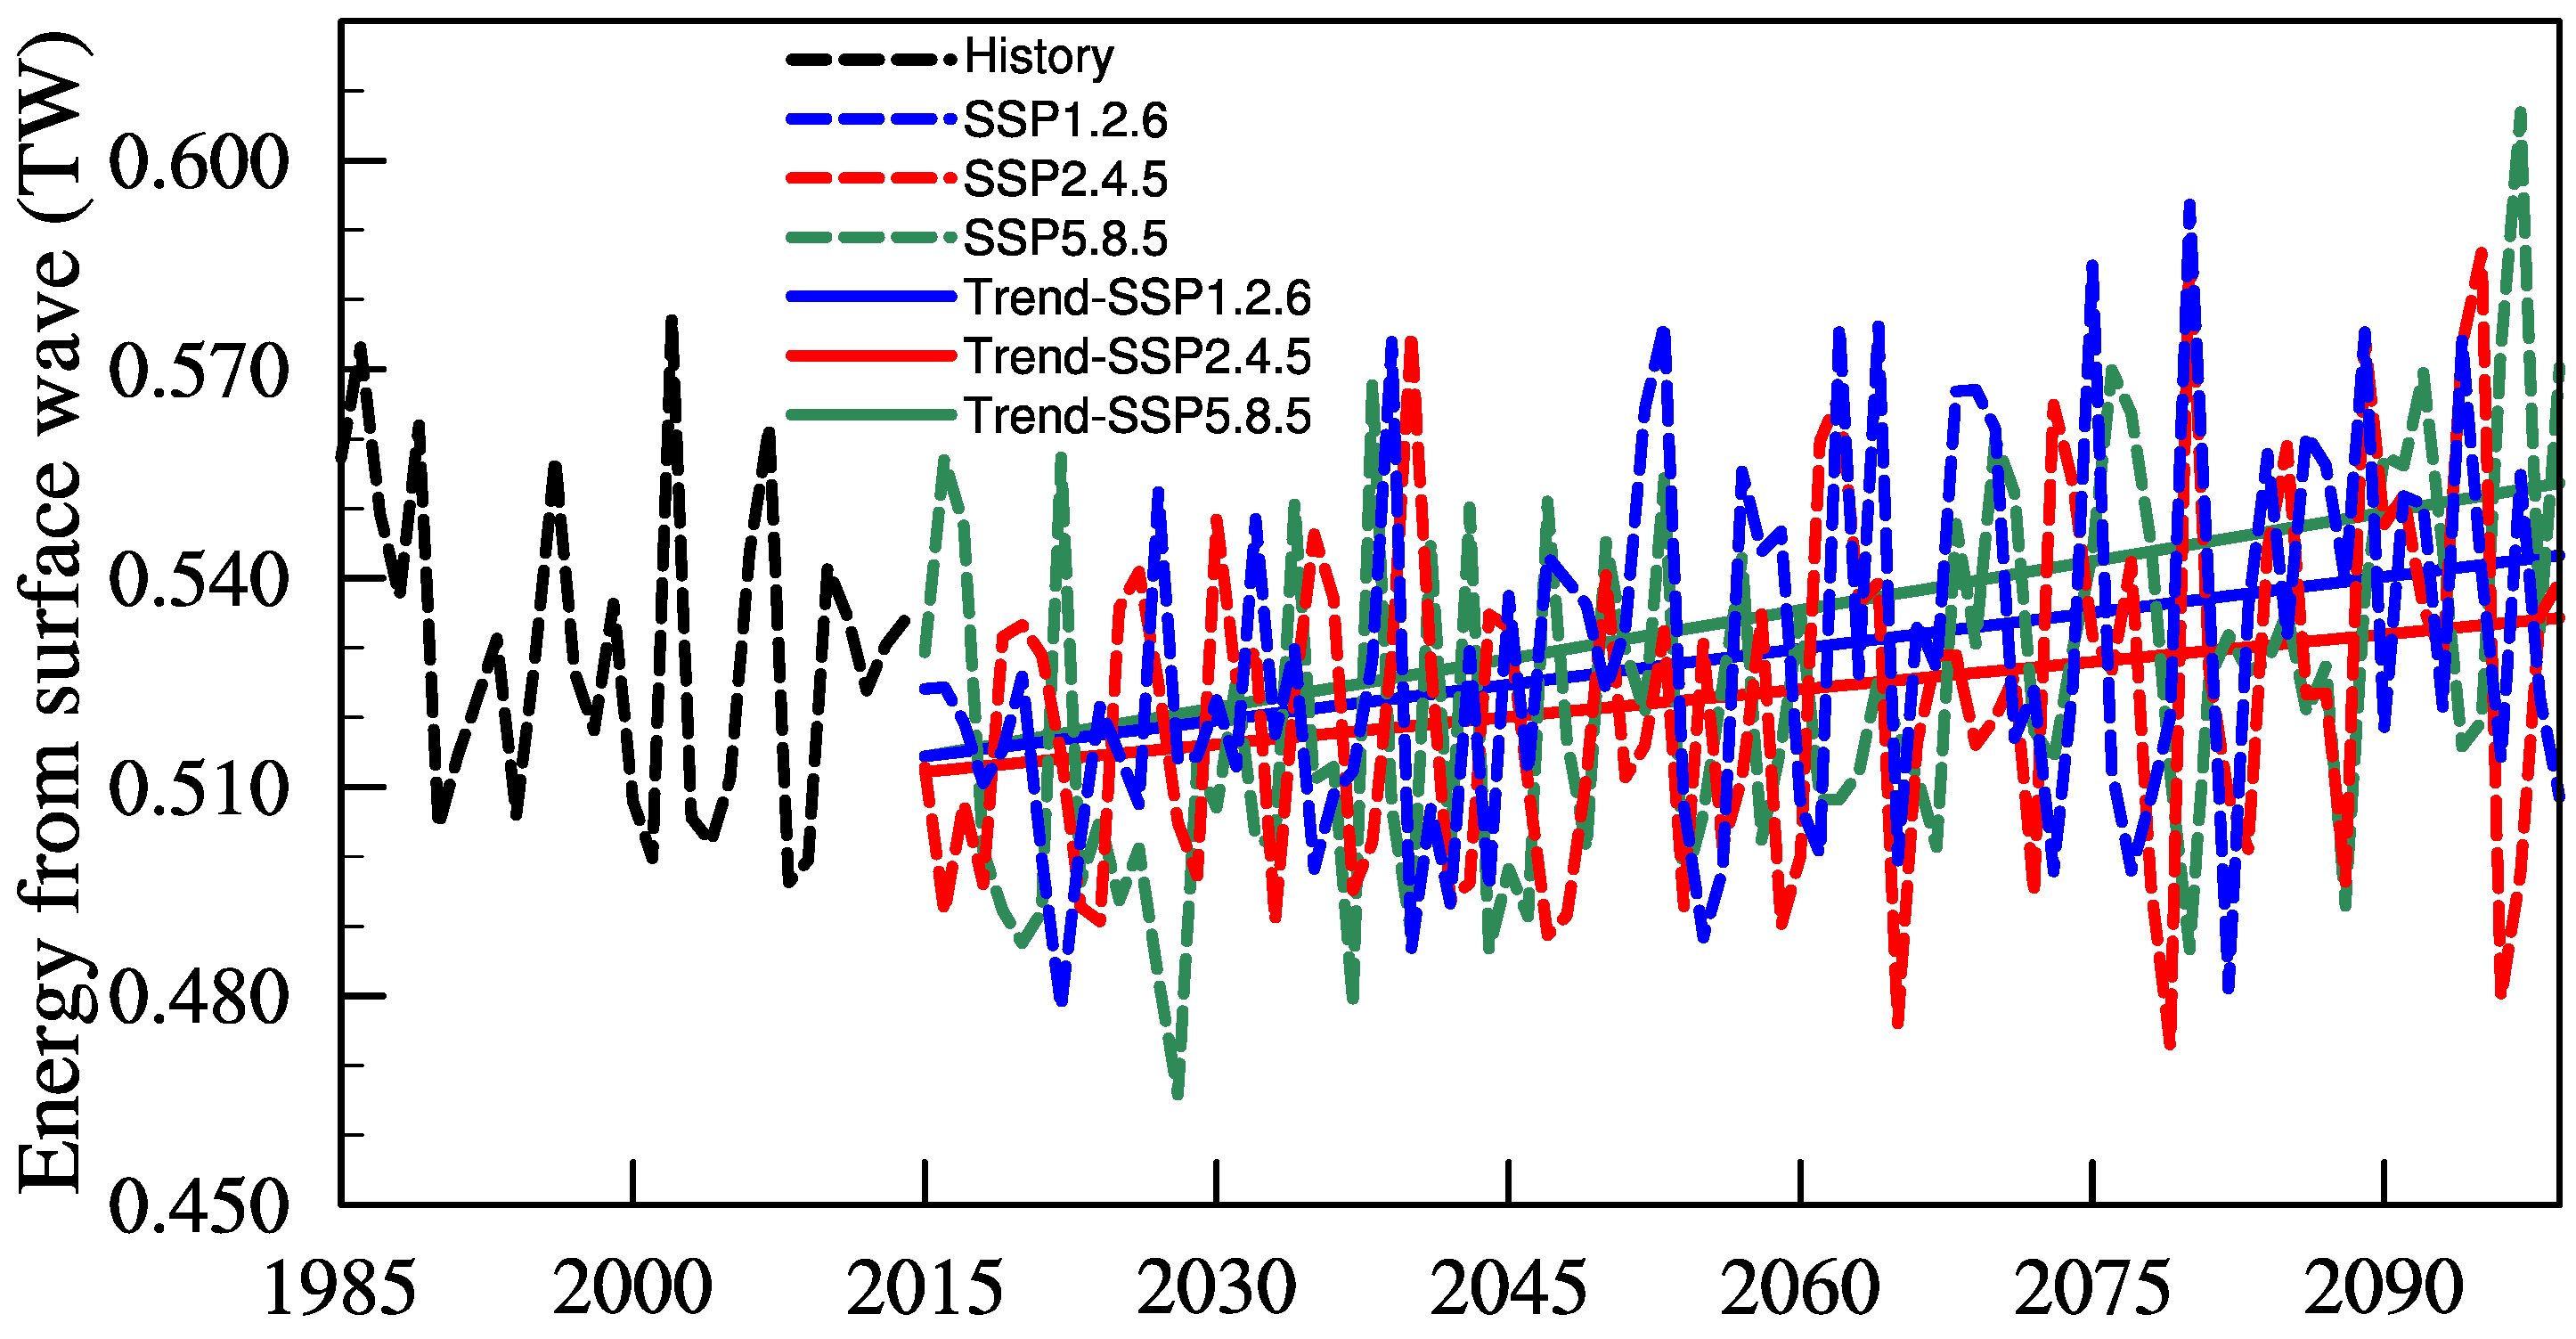
During the spring season, the average WEI to SWs in the NIO exhibits significant interannual variations under different scenarios (Figure 9). The interannual variation amplitude is approximately 50 GW. In contrast to the long-term trend predicted for the winter season, the average WEI to SW shows an overall increasing trend under different scenarios during the spring season (Figure 9). The increasing trend of WEI is approximately 0.3 GW/y under the low-emission scenario of SSP1−2.6. For the medium-emission scenario of SSP2–4.5, the increasing trend of WEI is slightly reduced compared to the low-emission scenario of SSP1–2.6, at approximately 0.2 GW/y. For the high-emission scenario of SSP5–8.5, the increasing trend is the highest, at approximately 0.5 GW/y. The magnitude of the WEI into SW is relatively small during the spring season, ranging from 0.46 to 0.61 TW, which is approximately half of the annual average. Therefore, it has a relatively small impact on the annual time series.
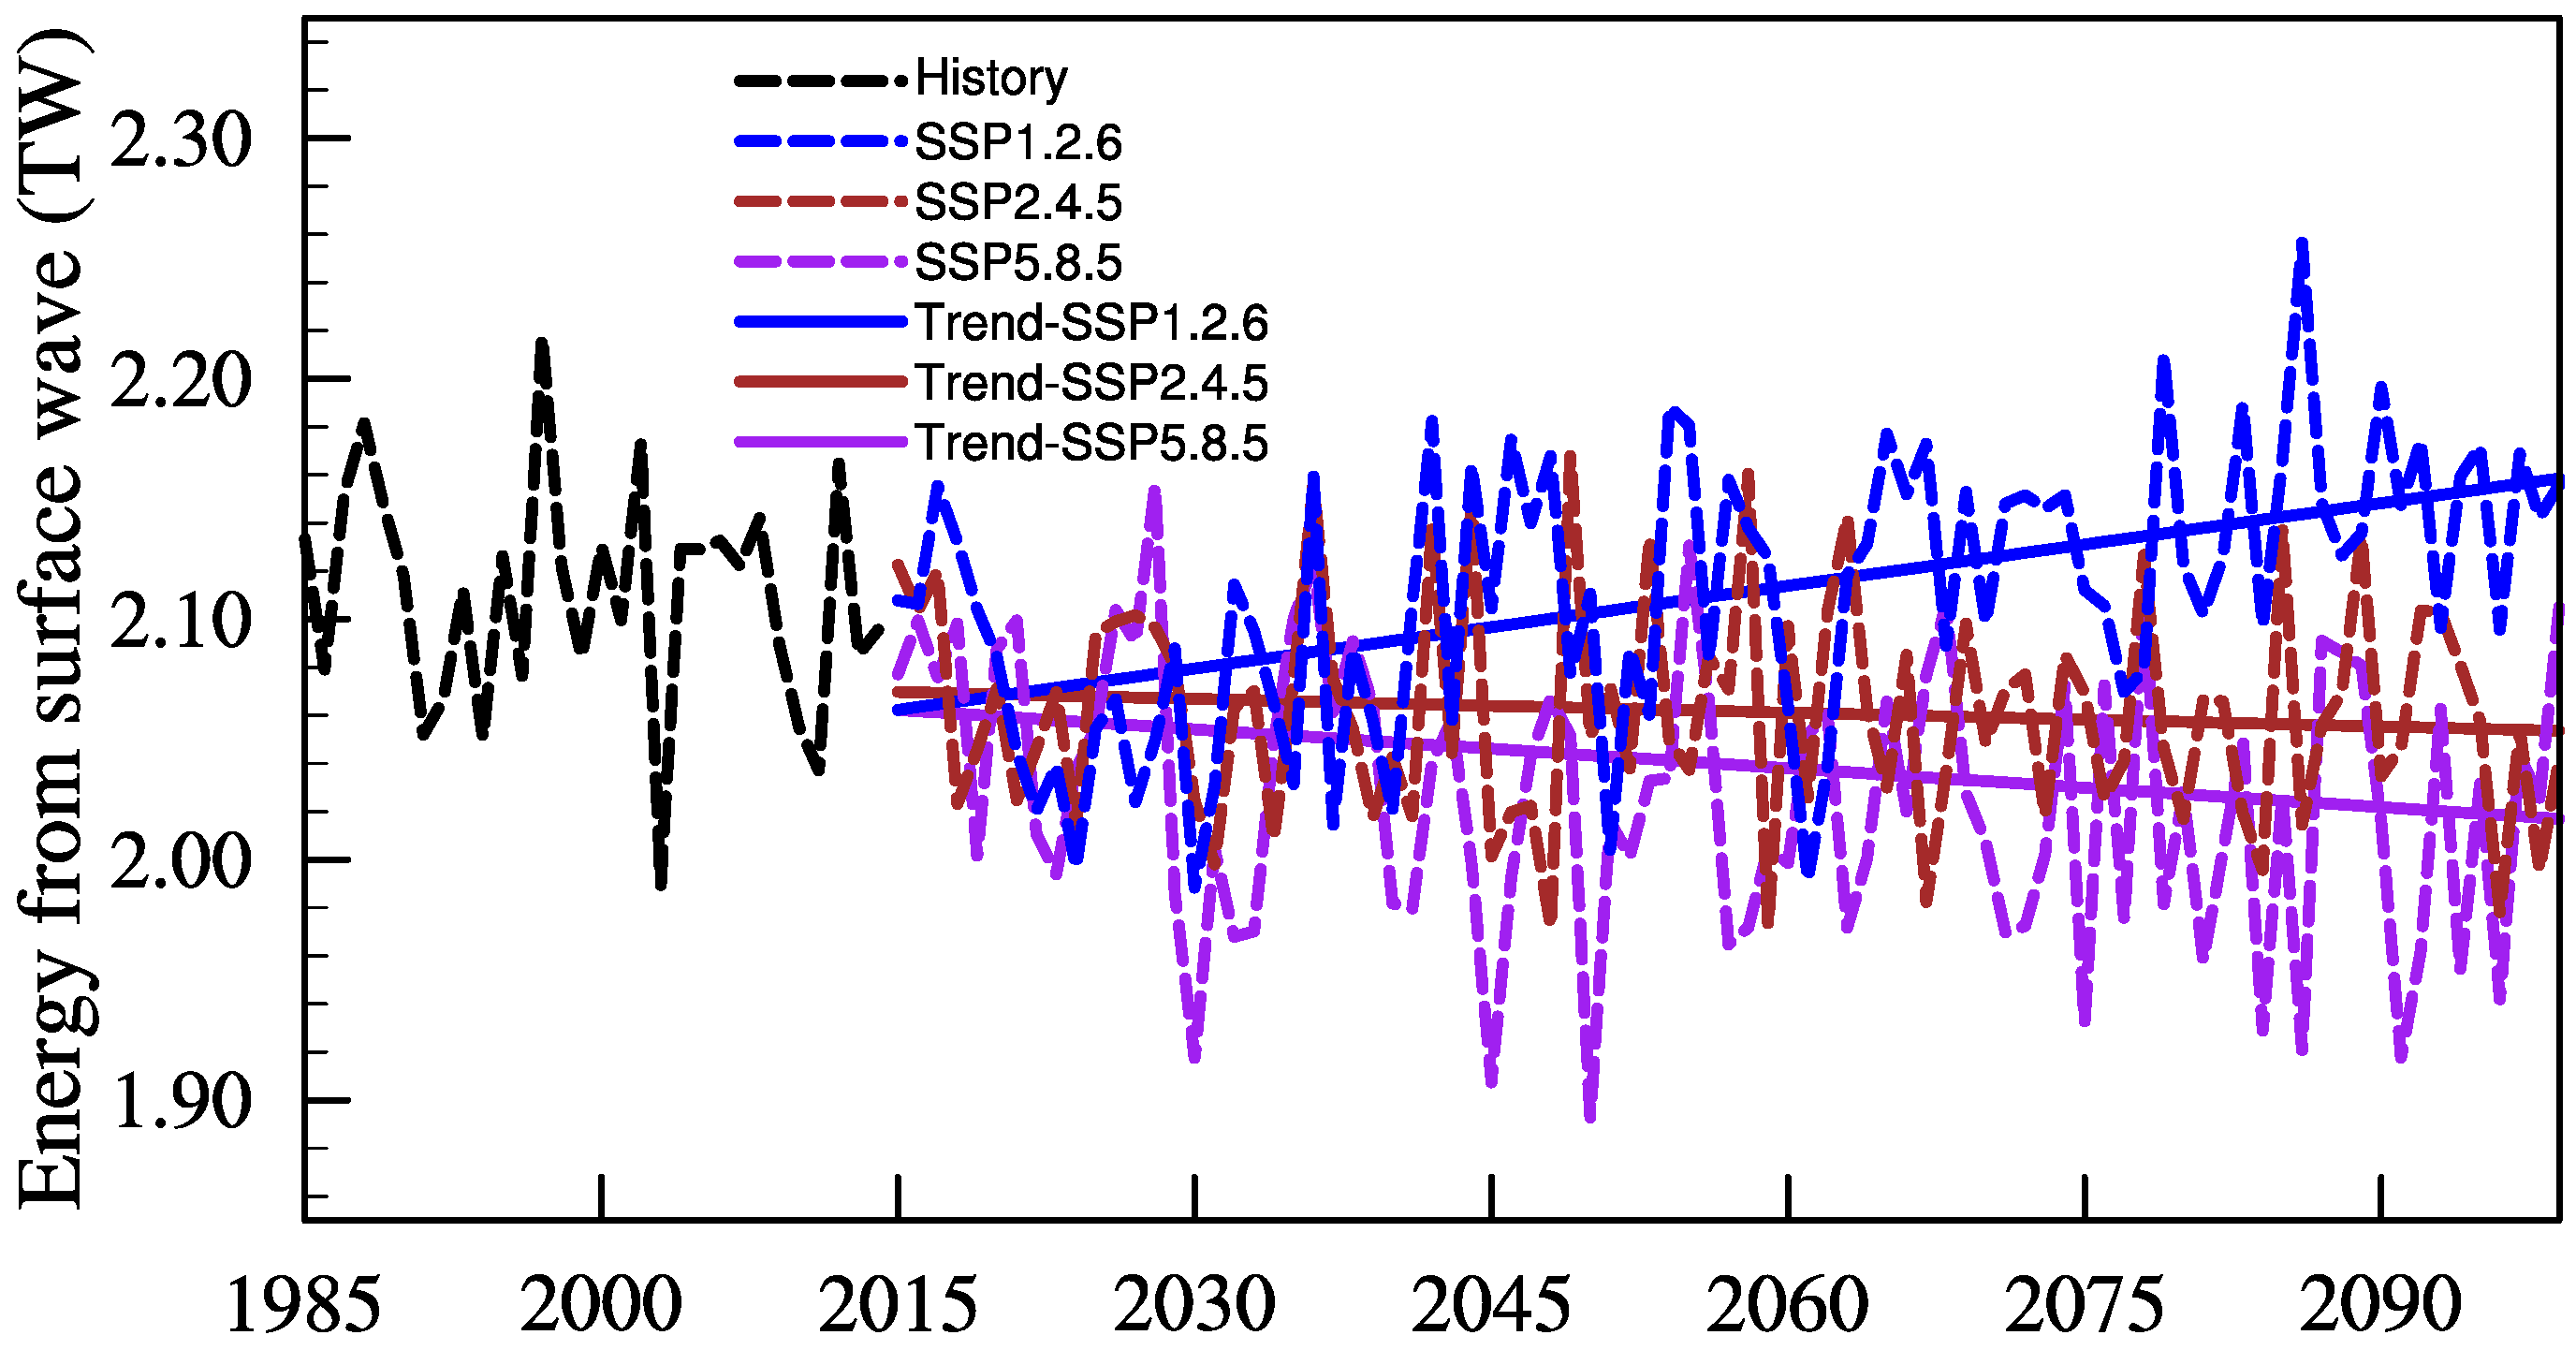
The average WEI to SWs displays notable interannual and long-term trends under various scenarios during the summer season of 2015–2099 (Figure 10). The long-term trends are consistent with those observed on an annual timescale. In the low-emission scenario of SSP1–2.6, the WEI into SWs exhibits significant interannual variation and an increasing trend. The annual amplitude is approximately 90 GW, and the increasing trend is about 1.0 GW/y. In the moderate-emission scenario of SSP2–4.5 and the high-emission scenario of SSP5−8.5, the interannual variation amplitude of WEI is similar to that in the low-emission scenario of SSP1–2.6. However, it shows a significant decreasing variation trend, which increases with the increase in emission concentration, at −0.3 GW/y and −0.5 GW/y, respectively. The WEI into SW during the summer season is substantial, accounting for about 60% to 70% of the total WEI throughout the year. Therefore, the variation in and trend of WEI during the summer season directly affect the annual average time series of WEI.
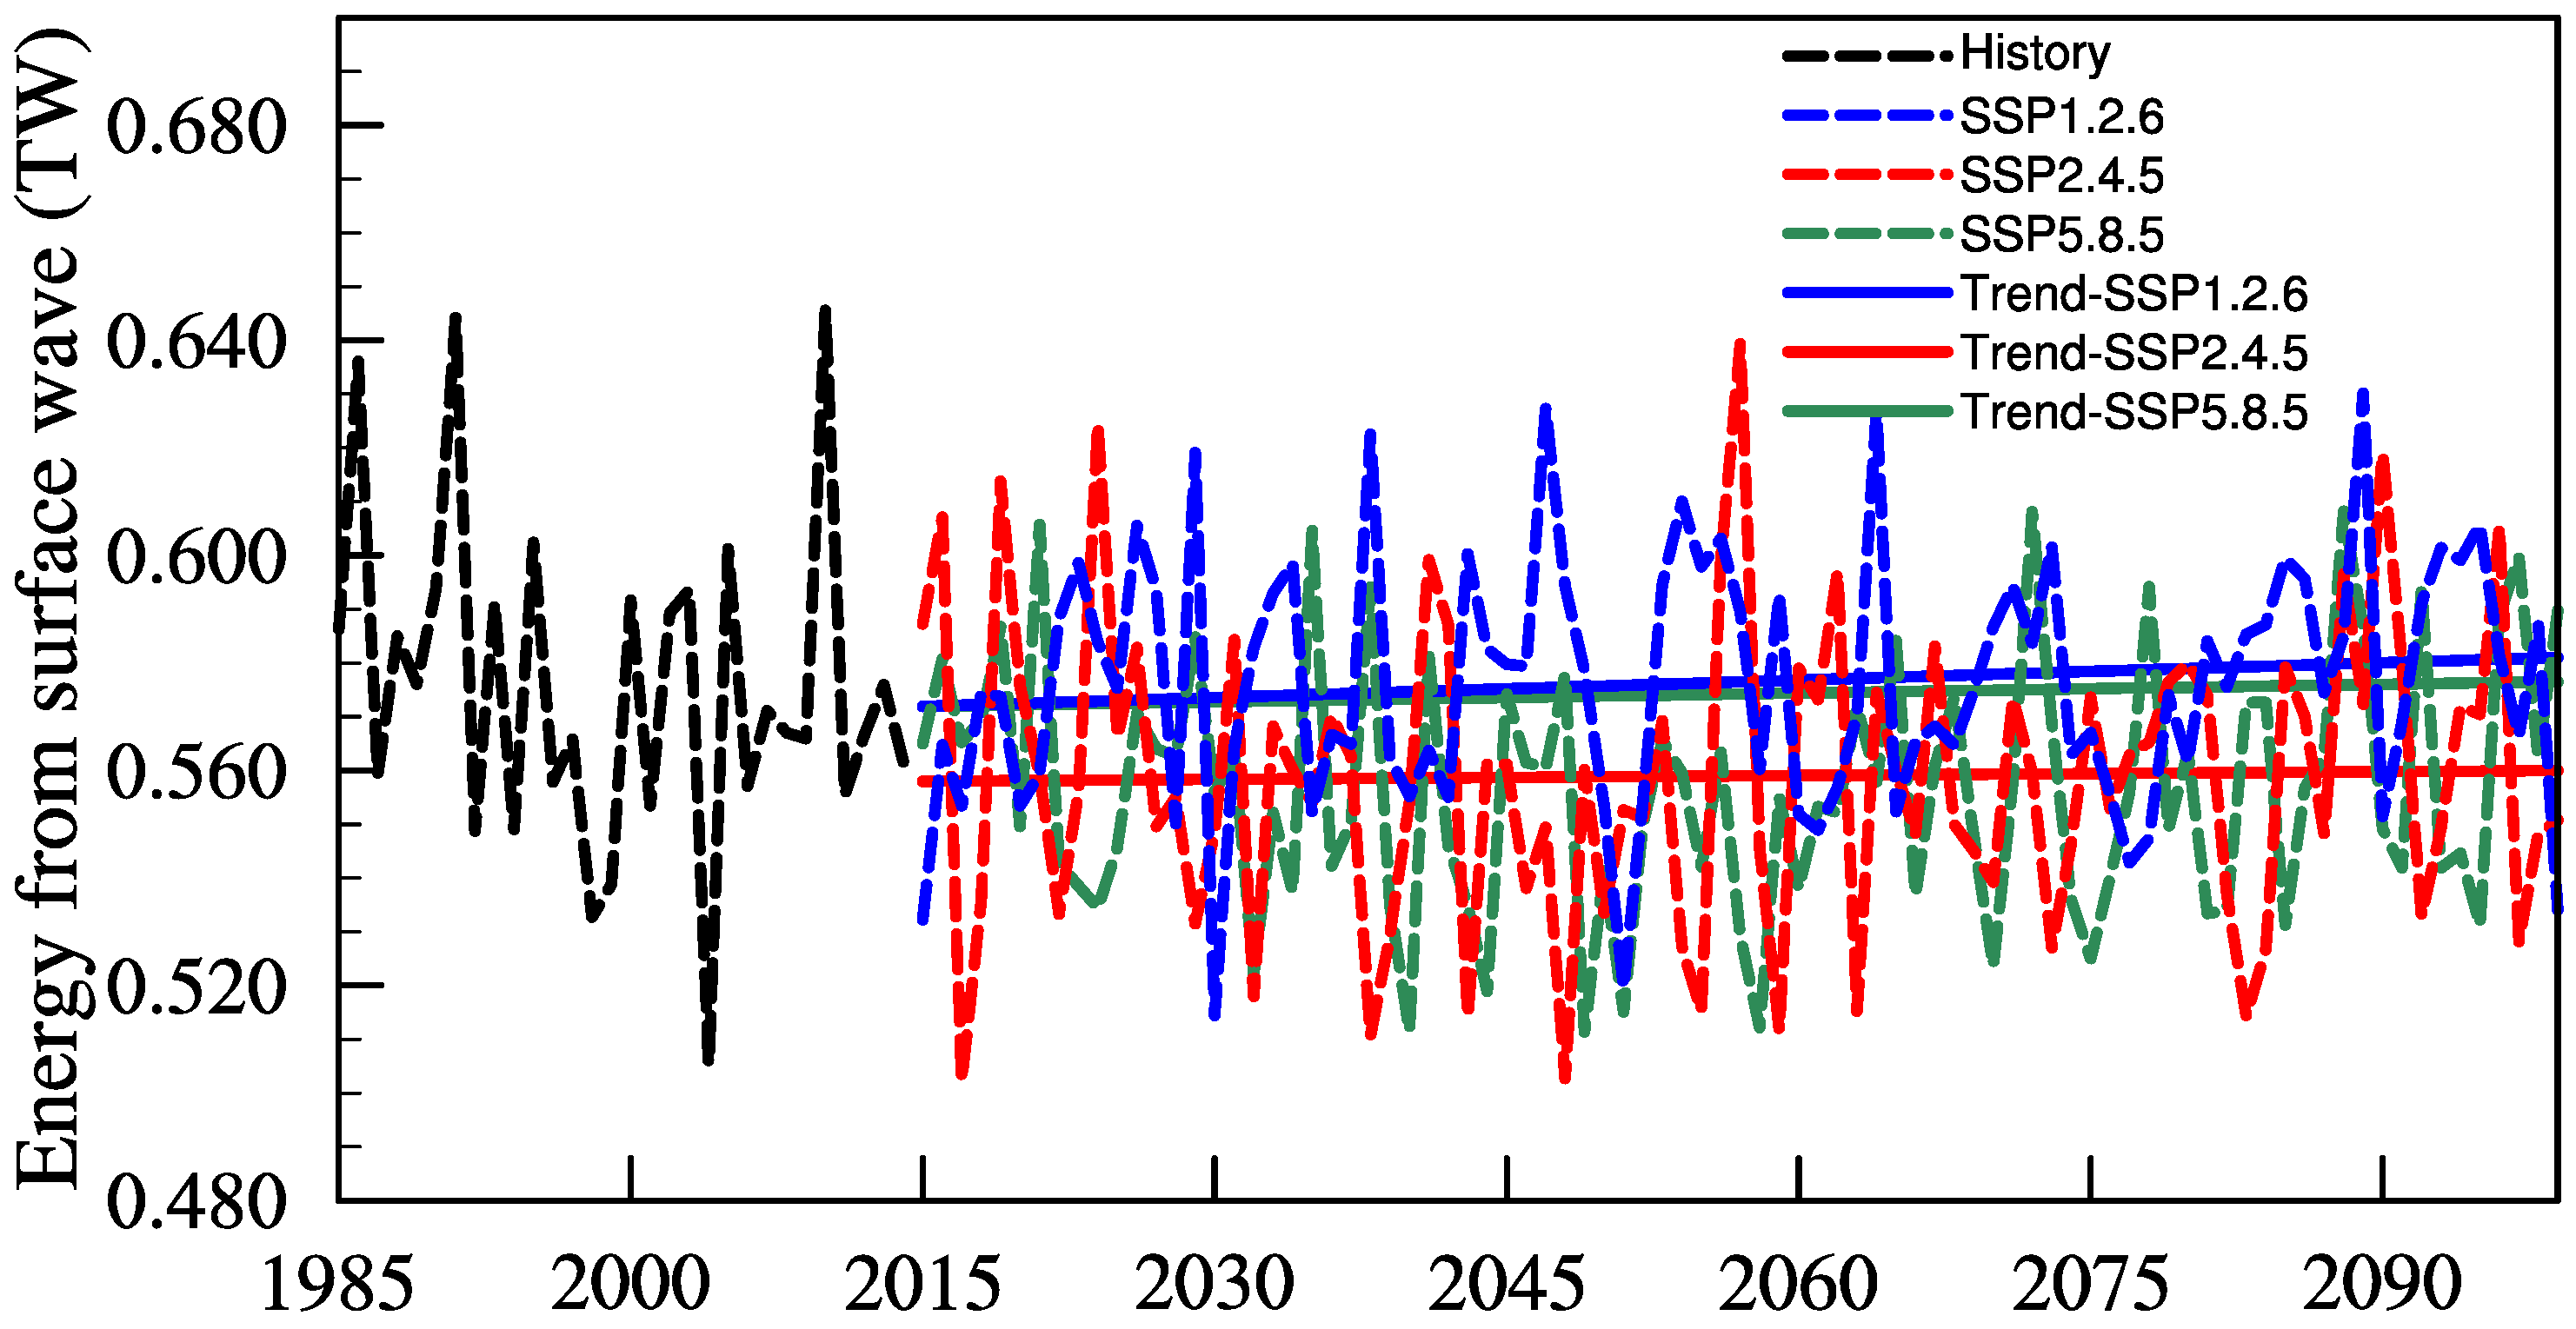
During the autumn season, the average WEI to SW in the NIO exhibits significant interannual variation under three different climate change scenarios, with a consistent magnitude of approximately 50 GW (Figure 11). However, the long-term trends of WEI are not significant and remain relatively stable over time.

4. Discussion

In this study, we utilized the latest CMIP6 model data to predict changes in WEI to SWs in the NIO. While previous research has delved into the transformation of WEI to SWs, these studies have predominantly focused on a global scale. The uneven distribution of WEI areas and the relatively coarse resolution of the utilized data have resulted in a lack of detailed information specific to the NIO. Although Hammer et al. [50] and Yang et al. [51] have examined the WEI in the Indian Ocean, their analyses have been limited to the spatial distribution characteristics of wind stress input into wave energy. Furthermore, no prior studies have explored the temporal variations and future predictions of WEI in this region. As such, this study employs the latest ERA5 reanalysis data and CMIP6 model data to forecast the spatiotemporal variations and long-term trends of WEI in the NIO.
Despite the novelty and timeliness of this research, reducing uncertainties in projections due to model bias could greatly benefit future studies. Model biases may impact the accuracy of prediction results to a certain degree, particularly in regions where WS data validation in historical periods yields poor results. However, it is important to note that this does not imply that the entire model has not been validated. The climate is a multifactorial, multiscale, and nonlinear system, making the simulation of its changes a highly challenging task. Ensemble models, developed based on a comprehensive understanding and modeling of the physical and dynamic processes within the climate system, are executed and optimized using extensive data and computational resources. While the prediction results of ensemble models may not be absolutely accurate, they typically provide valuable information about climate trends, variability, and other key factors. Therefore, ensemble models can still yield valuable prediction outcomes.
Additionally, the temporal, seasonal, and geographical changes in atmospheric parameters, such as air density, may introduce some uncertainties in the prediction results [86]. In future research, we aim to obtain more accurate results by combining observations and model results in response to the aforementioned issues.

5. Summary

The main objective of this study is to examine the influence of monsoon activity and climate change scenarios on the WEI to SW in the NIO. Using the latest CMIP6 model’s EnsMean data, this study explored the spatial and temporal variation of the WEI to the SW in the NIO under three different climate change scenarios for the mid-term future (2046–2065) and the long-term future (2080–2099). The results showed that the spatial distribution of predicted changes in WEI into the SW was generally consistent across the scenarios. Most of the central and southern parts of the NIO experienced a widespread decreasing trend in WEI, with the largest decline occurring in the 5° N–10° N areas. In contrast, the Red Sea, the Persian Gulf, the northern and northwestern Arabian Sea, and the northern Bay of Bengal showed varying degrees of increasing trends in WEI. The WEI changes relative to the historical period were relatively small under the low-emission scenario of SSP1–2.6 and the medium-emission scenario of SSP2–4.5, while the high-emission scenario of SSP5–8.5 predicted the most drastic changes in WEI. Moreover, the predicted changes of WEI into the SW exhibited strong temporal variability. As the prediction time increased, the regions with decreasing trends in WEI expanded, while the regions with increasing trends contracted. The magnitude of WEI changes in the long-term future (2080–2099) also increased compared to the mid-term future (2046–2065).
The trend of WEI to SW shows significant seasonal variations, with the largest changes observed during the summer season, while relatively weaker variations are observed in other seasons. This phenomenon can be attributed to the dominant monsoon activity in the NIO, which is the most significant region for monsoon activity among the global oceans. The northeast monsoons prevail during winter, while the southwest monsoons prevail during summer, exerting a significant influence on the WEI to SWs in the NIO. Furthermore, the southwest summer monsoons in the NIO have significantly weakened under the backdrop of climate warming.
The WEI to SWs exhibits significant interannual variability and long-term trends under different climate change scenarios. Under the SSP1–2.6 sustainable development scenario, the WEI to SW shows a significant increasing trend of 0.3% per decade, which is a positive signal. However, under the SSP2–4.5 and SSP5–8.5 scenarios, the predicted WEI shows decreasing trends of −0.1% and −0.3% per decade, respectively, with the latter showing a more significant decline. The WEI to SWs also exhibits significant seasonal variability, with the highest input occurring in summer, followed by winter. Spring and autumn are the transition seasons of the NIO monsoon, with relatively weak wind and unstable wind direction, resulting in a smaller contribution to WEI. This study reveals the spatiotemporal patterns and mechanisms of WEI to SWs in the NIO, and provides useful information for ocean and climate modeling.
In summary, the novelty of this study lies in its use of the latest CMIP6 model’s EnsMean data, an advanced climate model that can more accurately predict future climate changes. Not only does this study consider the impact of climate change on the WEI to SWs in the NIO, but it also takes seasonal variations and monsoon activity into account, representing a novel research approach. Its future applicability lies in its provision of useful information for ocean and climate modeling and its predictions of future climate changes. These findings are of significant importance to scientists.

Author Contributions

J.L. proposed the idea. Y.Z. collected data and made the analysis. J.L. and M.W. wrote the manuscript. W.T. helped in the data preparation and participated in discussions on the results. J.Y. embellished the manuscript. All authors have read and agreed to the published version of the manuscript.

Funding

Li is supported by the National Natural Science Foundation of China (42006021, 42076233), Tan is supported by the National Natural Science Foundation of China (42176012).

Institutional Review Board Statement

Not applicable.

Informed Consent Statement

Not applicable.

Data Availability Statement

Publicly available datasets were analyzed in this study. The CMIP6 data are openly available at https://aims2.llnl.gov/search (accessed on 15 December 2023). The ERA5 data are maintained and provided by European Centre for Medium-Range Weather forecasts (ECMWF), and can be found at https://cds.climate.copernicus.eu/cdsapp#!/search?type=dataset&text=ERA5 (accessed on 15 October 2023).

Acknowledgments

The ERA5 data are maintained and provided by European Centre for Medium-Range Weather forecasts (ECMWF) (https://cds.climate.copernicus.eu/cdsapp#!/search?type=dataset&text=ERA5), accessed on 15 October 2023. We appreciate the constructive comments and insightful suggestions from the anonymous reviewers.

Conflicts of Interest

The authors declare they have no conflicts of interest.

References

  1. Bollasina, M.A.; Ming, Y.; Ramaswamy, V. Anthropogenic aerosols and the weakening of the South Asian summer mon soon. Science 2011, 334, 502–505. [Google Scholar] [CrossRef] [PubMed]
  2. Ganguly, D.; Rasch, P.J.; Wang, H.; Yoon, J.H. Climate response of the South Asian monsoon system to anthropogenic aerosols. J. Geophys. Res. Atmos. 2012, 117, D13. [Google Scholar] [CrossRef]
  3. Annamalai, H.; Hafner, J.; Sooraj, K.; Pillai, P. Global warming shifts the monsoon circulation, drying South Asia. J. Climate 2013, 26, 2701–2718. [Google Scholar] [CrossRef]
  4. Ayantika, D.; Krishnan, R.; Singh, M.; Swapna, P.; Sandeep, N.; Prajeesh, A.; Vellore, R. Understanding the combined effects of global warming and anthropogenic aerosol forcing on the South Asian monsoon. Clim. Dynam. 2021, 56, 1643–1662. [Google Scholar] [CrossRef]
  5. Roxy, M.K.; Ritika, K.; Terray, P.; Murtugudde, R.; Ashok, K.; Goswami, B. Drying of Indian subcontinent by rapid Indian Ocean warming and a weakening land-sea thermal gradient. Nat. Commun. 2015, 6, 7423. [Google Scholar] [CrossRef] [PubMed]
  6. Paul, S.; Ghosh, S.; Oglesby, R.; Pathak, A.; Chandrasekharan, A.; Ramsankaran, R. Weakening of Indian summer monsoon rainfall due to changes in land use land cover. Sci. Rep. 2016, 6, 32177. [Google Scholar] [CrossRef] [PubMed]
  7. Roxy, M.K.; Chaithra, S.T. Impacts of Climate Change on the Indian Summer Monsoon; Ministry of environment, Forest and Climate Change, Government of India: New Delhi, India, 2018; pp. 21–37. ISBN 978-81-933131-6-9. [Google Scholar]
  8. Guo, Q.; Xu, X.; Zhang, K.; Li, Z.; Huang, W.; Mansaray, L.R.; Liu, W.; Wang, X.; Gao, J.; Huang, J. Assessing global ocean wind energy resources using multiple satellite data. Remote Sens. 2018, 10, 100. [Google Scholar] [CrossRef]
  9. Hamza, F.R.; Priotti, J.P. Maritime trade and piracy in the Gulf of Aden and the Indian Ocean (1994–2017). J. Transp. Secur. 2020, 13, 141–158. [Google Scholar] [CrossRef]
  10. Reguero, B.G.; Losada, I.J.; Méndez, F.J. A recent increase in global wave power as a consequence of oceanic warming. Nat. Commun. 2019, 10, 205. [Google Scholar] [CrossRef]
  11. Rascle, N.; Ardhuin, F.; Queffeulou, P.; Croizé-Fillon, D. A global wave parameter database for geophysical applications. Part 1: Wave-current–turbulence interaction parameters for the open ocean based on traditional parameterizations. Ocean Model. 2008, 25, 154–171. [Google Scholar] [CrossRef]
  12. Wang, W.; Huang, R.X. Wind energy input to the surface waves. J. Phys. Oceanogr. 2004, 34, 1276–1280. [Google Scholar] [CrossRef]
  13. Munk, W.; Wunsch, C. Abyssal recipes II: Energetics of tidal and wind mixing. Deep Sea Res. Part I Oceanogr. Res. Pap. 1998, 45, 1977–2010. [Google Scholar] [CrossRef]
  14. Wang, W.; Huang, R.X. Wind energy input to the Ekman layer. J. Phys. Oceanogr. 2004, 34, 1267–1275. [Google Scholar] [CrossRef]
  15. Wunsch, C. Is the ocean speeding up? Ocean surface energy trends. J. Phys. Oceanogr. 2020, 50, 3205–3217. [Google Scholar] [CrossRef]
  16. Zippel, S.F.; Farrar, J.T.; Zappa, C.J.; Plueddemann, A.J. Parsing the kinetic energy budget of the ocean surface mixed layer. Geophys. Res. Lett. 2022, 49, e2021GL095920. [Google Scholar] [CrossRef] [PubMed]
  17. Ferrari, R.; Wunsch, C. The distribution of eddy kinetic and potential energies in the global ocean. Tellus A 2010, 62, 92–108. [Google Scholar] [CrossRef]
  18. Teng, Y.; Yang, Y.; Qiao, F.; Lu, J.; Yin, X. Energy budget of surface waves in the global ocean. Acta Oceanol. Sin. 2009, 28, 5–10. [Google Scholar] [CrossRef]
  19. Sooraj, K.; Terray, P.; Mujumdar, M. Global warming and the weakening of the Asian summer monsoon circulation: As sessments from the CMIP5 models. Clim. Dynam. 2015, 45, 233–252. [Google Scholar] [CrossRef]
  20. Moon, S.; Ha, K.J. Future changes in monsoon duration and precipitation using CMIP6. NPJ Clim. Atmos. Sci. 2020, 3, 45. [Google Scholar] [CrossRef]
  21. Ha, K.J.; Moon, S.; Timmermann, A.; Kim, D. Future changes of summer monsoon characteristics and evaporative demand over Asia in CMIP6 simulations. Geophys. Res. Lett. 2020, 47, e2020GL087492. [Google Scholar] [CrossRef]
  22. Reyers, M.; Moemken, J.; Pinto, J.G. Future changes of wind energy potentials over Europe in a large CMIP5 multi-model ensemble. Int. J. Climatol. 2016, 36, 783–796. [Google Scholar] [CrossRef]
  23. Eyring, V.; Bony, S.; Meehl, G.A.; Senior, C.A.; Stevens, B.; Stouffer, R.J.; Taylor, K.E. Overview of the Coupled Model Inter comparison Project Phase 6 (CMIP6) experimental design and organization. Geosci. Model Dev. 2016, 9, 1937–1958. [Google Scholar] [CrossRef]
  24. Carvalho, D.; Rocha, A.; Gómez-Gesteira, M.; Santos, C.S. Potential impacts of climate change on European wind energy resource under the CMIP5 future climate projections. Renew. Energy 2017, 101, 29–40. [Google Scholar] [CrossRef]
  25. Zheng, C.W.; Li, X.Y.; Luo, X.; Chen, X.; Qian, Y.H.; Zhang, Z.H.; Gao, Z.S.; Du, Z.B.; Gao, Y.B.; Chen, Y.G. Projection of future global offshore wind energy resources using CMIP data. Atmos.-Ocean 2019, 57, 134–148. [Google Scholar] [CrossRef]
  26. Qian, H.; Zhang, R. Future changes in wind energy resource over the Northwest Passage based on the CMIP6 climate projections. Int. J. Energy Res. 2021, 45, 920–937. [Google Scholar] [CrossRef]
  27. Akinsanola, A.A.; Ogunjobi, K.O.; Abolude, A.T.; Salack, S. Projected changes in wind speed and wind energy potential over West Africa in CMIP6 models. Environ. Res. Lett. 2021, 16, 044033. [Google Scholar] [CrossRef]
  28. Wu, J.; Shi, Y.; Xu, Y. Evaluation and projection of surface wind speed over China based on CMIP6 GCMs. J. Geophys. Res. Atmos. 2020, 125, e2020JD033611. [Google Scholar] [CrossRef]
  29. Zha, J.; Shen, C.; Li, Z.; Wu, J.; Zhao, D.; Fan, W.; Deng, K. Projected changes in global terrestrial near-surface wind speed in 1.5 °C−4.0 °C global warming levels. Environ. Res. Lett. 2021, 16, 114016. [Google Scholar] [CrossRef]
  30. Ma, X.; Li, Y.; Li, Z. The projection of canadian wind energy potential in future scenarios using a convection-permitting regional climate model. Energy Rep. 2022, 8, 7176–7187. [Google Scholar] [CrossRef]
  31. Zhou, T.J.; Zou, L.W.; Chen, X.L. Commentary on the Coupled Model Intercomparison Project Phase 6 (CMIP6). Clim. Chang. Res. 2019, 15, 445–456. [Google Scholar] [CrossRef]
  32. Kumar, P.; Sarthi, P.P. Intraseasonal variability of Indian Summer Monsoon Rainfall in CMIP6 models simulation. Theor. Appl. Climatol. 2021, 145, 687–702. [Google Scholar] [CrossRef]
  33. Zhang, S.; Li, X. Future projections of offshore wind energy resources in China using CMIP6 simulations and a deep learning-based downscaling method. Energy 2021, 217, 119321. [Google Scholar] [CrossRef]
  34. Carvalho, D.; Rocha, A.; Costoya, X.; DeCastro, M.; Gómez-Gesteira, M. Wind energy resource over Europe under CMIP6 future climate projections: What changes from CMIP5 to CMIP6. Renew. Sustain. Energy Rev. 2021, 151, 111594. [Google Scholar] [CrossRef]
  35. Hahmann, A.N.; García-Santiago, O.; Peña, A. Current and future wind energy resources in the North Sea according to CMIP6. Wind Energy Sci. 2022, 7, 2373–2391. [Google Scholar] [CrossRef]
  36. Deng, H.; Hua, W.; Fan, G. Evaluation and projection of near-surface wind speed over China based on CMIP6 models. Atmosphere 2021, 12, 1062. [Google Scholar] [CrossRef]
  37. Martinez, A.; Iglesias, G. Climate change impacts on wind energy resources in North America based on the CMIP6 projections. Sci. Total Environ. 2022, 806, 150580. [Google Scholar] [CrossRef] [PubMed]
  38. Karnauskas, K.B.; Lundquist, J.K.; Zhang, L. Southward shift of the global wind energy resource under high carbon dioxide emissions. Nat. Geosci. 2018, 11, 38–43. [Google Scholar] [CrossRef]
  39. Wang, B.; Jin, C.; Liu, J. Understanding future change of global monsoons projected by CMIP6 models. J. Clim. 2020, 33, 6471–6489. [Google Scholar] [CrossRef]
  40. Costoya, X.; DeCastro, M.; Santos, F.; Sousa, M.C.; Gómez-Gesteira, M. Projections of wind energy resources in the Caribbean for the 21st century. Energy 2019, 178, 356–367. [Google Scholar] [CrossRef]
  41. Pourali, M.; Kavianpour, M.R.; Kamranzad, B.; Alizadeh, M.J. Future variability of wave energy in the Gulf of Oman using a high resolution CMIP6 climate model. Energy 2023, 262, 125552. [Google Scholar] [CrossRef]
  42. Hu, S.; Sprintall, J.; Guan, C.; McPhaden, M.J.; Wang, F.; Hu, D.; Cai, W. Deep-reaching acceleration of global mean ocean circulation over the past two decades. Sci. Adv. 2020, 6, eaax7727. [Google Scholar] [CrossRef]
  43. Wu, K.; Liu, B. Stokes drift−induced and direct wind energy inputs into the Ekman layer within the Antarctic Circumpo lar Current. J. Geophys. Res.Oceans 2008, 113, C10. [Google Scholar] [CrossRef]
  44. Huang, R.X.; Wang, W.; Liu, L.L. Decadal variability of wind-energy input to the world ocean. Deep Sea Res. Part II Top. Stud. Oceanogr. 2006, 53, 31–41. [Google Scholar] [CrossRef]
  45. Zhai, X.; Wunsch, C. On the variability of wind power input to the oceans with a focus on the subpolar North Atlantic. J. Clim. 2013, 26, 3892–3903. [Google Scholar] [CrossRef]
  46. Kilbourne, B.F.; Girton, J.B. Quantifying high-frequency wind energy flux into near-inertial motions in the southeast Pacific. J. Phys. Oceanogr. 2015, 45, 369–386. [Google Scholar] [CrossRef]
  47. Brown, J.N.; Fedorov, A.V. Mean energy balance in the tropical Pacific Ocean. J. Mar. Res. 2008, 66, 1–23. [Google Scholar] [CrossRef]
  48. Zhai, X.; Greatbatch, R.J. Wind work in a model of the northwest Atlantic Ocean. Geophys. Res. Lett. 2007, 34, 4. [Google Scholar] [CrossRef]
  49. Zhang, Y.; Cui, C.R.; Yang, Q.; Guan, Y.P. North part of the North Pacific is a major gateway of wind energy into the ocean. Haiyang Xuebao 2021, 43, 40–47. [Google Scholar]
  50. Hammar, L.; Ehnberg, J.; Mavume, A.; Cuamba, B.C.; Molander, S. Renewable ocean energy in the Western Indian Ocean. Renew. Sust. Energ. Rev. 2012, 16, 4938–4950. [Google Scholar] [CrossRef]
  51. Yang, S.; Duan, S.; Fan, L.; Zheng, C.; Li, X.; Li, H.; Xu, J.; Wang, Q.; Feng, M. 10-year wind and wave energy assessment in the North Indian Ocean. Energies 2019, 12, 3835. [Google Scholar] [CrossRef]
  52. Wu, L.; Yang, X.Y.; Hu, J. Assessment of Arctic sea ice simulations in CMIP5 models using a synthetical skill scoring method. Acta Oceanol. Sin. 2019, 38, 48–58. [Google Scholar] [CrossRef]
  53. O’Neill, B.C.; Tebaldi, C.; Van Vuuren, D.P.; Eyring, V.; Friedlingstein, P.; Hurtt, G.; Knutti, R.; Kriegler, E.; Lamarque, J.F.; Lowe, J. The scenario model intercomparison project (ScenarioMIP) for CMIP6. Geosci. Model Dev. 2016, 9, 3461–3482. [Google Scholar] [CrossRef]
  54. Riahi, K.; Van Vuuren, D.P.; Kriegler, E.; Edmonds, J.; O’neill, B.C.; Fujimori, S.; Bauer, N.; Calvin, K.; Dellink, R.; Fricko, O. The Shared Socioeconomic Pathways and their energy, land use, and greenhouse gas emissions implications: An overview. Glob. Environ. Chang. 2017, 42, 153–168. [Google Scholar] [CrossRef]
  55. Hersbach, H.; Bell, B.; Berrisford, P.; Hirahara, S.; Horányi, A.; Muñoz-Sabater, J.; Nicolas, J.; Peubey, C.; Radu, R.; Schepers, D. The ERA5 global reanalysis. Q. J. R. Meteorol. Soc. 2020, 146, 1999–2049. [Google Scholar] [CrossRef]
  56. Gutowski, W.J., Jr.; Giorgi, F.; Timbal, B.; Frigon, A.; Jacob, D.; Kang, H.S.; Krishnan, R.; Lee, B.; Lennard, C.; Nikulin, G. WCRP coordi- nated regional downscaling experiment (CORDEX): A diagnostic MIP for CMIP6. Geosci. Model Dev. 2016, 9, 4087–4095. [Google Scholar] [CrossRef]
  57. Bloom, A.; Kotroni, V.; Lagouvardos, K. Climate change impact of wind energy availability in the Eastern Mediterranean using the regional climate model PRECIS. Nat. Hazard. Earth. Sys. 2008, 8, 1249–1257. [Google Scholar] [CrossRef]
  58. Brands, S.; Herrera, S.; Fernández, J.; Gutiérrez, J.M. How well do CMIP5 Earth System Models simulate present climate conditions in Europe and Africa? A performance comparison for the downscaling community. Clim. Dynam. 2013, 41, 803–817. [Google Scholar] [CrossRef]
  59. Dosio, A.; Panitz, H.J.; Schubert-Frisius, M.; Lüthi, D. Dynamical downscaling of CMIP5 global circulation models over CORDEX-Africa with COSMO-CLM: Evaluation over the present climate and analysis of the added value. Clim. Dyn. 2015, 44, 2637–2661. [Google Scholar] [CrossRef]
  60. Olauson, J. ERA5: The new champion of wind power modelling? Renew. Energ. 2018, 126, 322–331. [Google Scholar] [CrossRef]
  61. Dix, M.; Bi, D.; Dobrohotoff, P.; Fiedler, R.; Harman, I.; Law, R.; Yang, R. CSIRO-ARCCSS ACCESS-CM2 Model Output Prepared for CMIP6 CMIP Historical; Earth System Grid Federation: Greenbelt, MD, USA, 2019. [Google Scholar] [CrossRef]
  62. Dix, M.; Bi, D.; Dobrohotoff, P.; Fiedler, R.; Harman, I.; Law, R.; Mackallah, C.; Marsland, S.; O’Farrell, S.; Rashid, H. CSIRO-ARCCSS ACCESS-CM2 Model Output Prepared for CMIP6 ScenarioMIP ssp585; Earth System Grid Federation: Greenbelt, MD, USA, 2019. [Google Scholar] [CrossRef]
  63. Wu, T.; Chu, M.; Dong, M.; Fang, Y.; Jie, W.; Li, J.; Li, W.; Liu, Q.; Shi, X.; Xin, X. BCC BCC-CSM2MR Model Output Prepared for CMIP6 CMIP Historical; Earth System Grid Federation: Greenbelt, MD, USA, 2018. [Google Scholar] [CrossRef]
  64. Xin, X.; Wu, T.; Shi, X.; Zhang, F.; Li, J.; Chu, M.; Liu, Q.; Yan, J.; Ma, Q.; Wei, M. BCC BCC-CSM2MR Model Output Prepared for CMIP6 ScenarioMIP ssp585; Earth System Grid Federation: Greenbelt, MD, USA, 2019. [Google Scholar] [CrossRef]
  65. Lovato, T.; Peano, D. CMCC CMCC-CM2-SR5 Model Output Prepared for CMIP6 CMIP Historical; Earth System Grid Federation: Greenbelt, MD, USA, 2020. [Google Scholar] [CrossRef]
  66. Lovato, T.; Peano, D. CMCC CMCC-CM2-SR5 Model Output Prepared for CMIP6 ScenarioMIP ssp585; Earth System Grid Federation: Greenbelt, MD, USA, 2020. [Google Scholar] [CrossRef]
  67. Krasting, J.P.; John, J.G.; Blanton, C.; McHugh, C.; Nikonov, S.; Radhakrishnan, A.; Rand, K.; Zadeh, N.T.; Balaji, V.; Durachta, J. NOAA-GFDL GFDL-ESM4 Model Output Prepared for CMIP6 CMIP Historical; Earth System Grid Federation: Greenbelt, MD, USA, 2018. [Google Scholar] [CrossRef]
  68. John, J.G.; Blanton, C.; McHugh, C.; Radhakrishnan, A.; Rand, K.; Vahlenkamp, H.; Zeng, Y. NOAA-GFDL GFDL-ESM4 Model Output Prepared for CMIP6 ScenarioMIP ssp585; Earth System Grid Federation: Greenbelt, MD, USA, 2018. [Google Scholar] [CrossRef]
  69. Volodin, E.; Mortikov, E.; Gritsun, A.; Lykossov, V.; Galin, V.; Diansky, N.; Emelina, S. INM INM-CM4-8 Model Output Prepared for CMIP6 CMIP Historical; Earth System Grid Federation: Greenbelt, MD, USA, 2019. [Google Scholar] [CrossRef]
  70. Volodin, E.; Mortikov, E.; Gritsun, A.; Lykossov, V.; Galin, V.; Diansky, N.; Gusev, A.; Kostrykin, S.; Iakovlev, N.; Shestakova, A. INM INM-CM4-8 Model Output Prepared for CMIP6 ScenarioMIP ssp585; Earth System Grid Federation: Greenbelt, MD, USA, 2019. [Google Scholar] [CrossRef]
  71. Volodin, E.; Mortikov, E.; Gritsun, A.; Lykossov, V.; Galin, V.; Diansky, N.; Gusev, A.; Kostrykin, S.; Iakovlev, N.; Shestakova, A. INM INM-CM5-0 Model Output Prepared for CMIP6 CMIP Historical; Earth System Grid Federation: Greenbelt, MD, USA, 2019. [Google Scholar] [CrossRef]
  72. Volodin, E.; Mortikov, E.; Gritsun, A.; Lykossov, V.; Galin, V.; Diansky, N.; Emelina, S. INM INM-CM5-0 Model Output Prepared for CMIP6 ScenarioMIP ssp585; Earth System Grid Federation: Greenbelt, MD, USA, 2019. [Google Scholar] [CrossRef]
  73. Boucher, O.; Denvil, S.; Levavasseur, G.; Cozic, A.; Caubel, A.; Foujols, M.A.; Meurdesoif, Y.; Cadule, P.; Devilliers, M.; Ghattas, J. IPSL IPSL-CM6A-LR Model Output Prepared for CMIP6 CMIP Historical; Earth System Grid Federation: Greenbelt, MD, USA, 2018. [Google Scholar] [CrossRef]
  74. Boucher, O.; Denvil, S.; Levavasseur, G.; Cozic, A.; Caubeel, A.; Foujols, M.; Meurdesoif, Y.; Cadule, P.; Devilliers, M.; Dupont, E. IPSL IPSL-CM6A-LR Model Output Prepared for CMIP6 ScenarioMIP ssp585; Earth System Grid Federation: Greenbelt, MD, USA, 2019. [Google Scholar] [CrossRef]
  75. Tatebe, H.; Watanabe, M. MIROC MIROC6 Model Output Prepared for CMIP6 CMIP Historical; Earth System Grid Federation: Greenbelt, MD, USA, 2018. [Google Scholar] [CrossRef]
  76. Shiogama, H.; Abe, M.; Tatebe, H. MIROC MIROC6 Model Output Prepared for CMIP6 ScenarioMIP ssp585; Earth System Grid Federation: Greenbelt, MD, USA, 2019. [Google Scholar] [CrossRef]
  77. Wieners, K.; Giorgetta, M.; Jungclaus, J.; Reick, C.; Esch, M.; Bittner, M.; Gayler, V.; Haak, H.; de Vrese, P.; Raddatz, T. MPI-M MPI-ESM1.2-LR Model Output Prepared for CMIP6 CMIP Historical; Earth System Grid Federation: Greenbelt, MD, USA, 2019. [Google Scholar] [CrossRef]
  78. Wieners, K.; Giorgetta, M.; Jungclaus, J.; Reick, C.; Esch, M.; Bittner, M.; Gayler, V.; Haak, H.; de Vrese, P.; Raddatz, T. MPI-M MPI-ESM1. 2-LR Model Output Prepared for CMIP6 ScenarioMIP ssp585; Earth System Grid Federation: Greenbelt, MD, USA, 2019. [Google Scholar] [CrossRef]
  79. Yukimoto, S.; Koshiro, T.; Kawai, H.; Oshima, N.; Yoshida, K.; Urakawa, S.; Tsujino, H.; Deushi, M.; Tanaka, T.; Hosaka, M. MRI MRI-ESM2. 0 Model Output Prepared for CMIP6 CMIP Historical; Earth System Grid Federation: Greenbelt, MD, USA, 2019. [Google Scholar] [CrossRef]
  80. Yukimoto, S.; Koshiro, T.; Kawai, H.; Oshima, N.; Yoshida, K.; Urakawa, S.; Tsujino, H.; Deushi, M.; Tanaka, T.; Hosaka, M. MRI MRI-ESM2. 0 Model Output Prepared for CMIP6 ScenarioMIP ssp585; Earth System Grid Federation: Greenbelt, MD, USA, 2019. [Google Scholar] [CrossRef]
  81. Akinsanola, A.A.; Zhou, W. Projections of West African summer monsoon rainfall extremes from two CORDEX models. Clim. Dynam. 2019, 52, 2017–2028. [Google Scholar] [CrossRef]
  82. Räisänen, J.; Palmer, T. A probability and decision-model analysis of a multimodel ensemble of climate change simulations. J. Clim. 2001, 14, 3212–3226. [Google Scholar] [CrossRef]
  83. Pierce, D.W.; Barnett, T.P.; Santer, B.D.; Gleckler, P.J. Selecting global climate models for regional climate change studies. Proc. Natl. Acad. Sci. USA 2009, 106, 8441–8446. [Google Scholar] [CrossRef] [PubMed]
  84. Schott, F.A.; Xie, S.P.; McCreary, J.P., Jr. Indian Ocean circulation and climate variability. Rev. Geophys. 2009, 47, 1. [Google Scholar] [CrossRef]
  85. Sawadogo, W.; Reboita, M.S.; Faye, A.; Porfírio da Rocha, R.; Giorgi, F. Current and future potential of solar and wind energy over Africa using the RegCM4 CORDEX-CORE ensemble. Clim. Dyn. 2020, 10, 1–26. [Google Scholar] [CrossRef]
  86. Ulazia, A.; Sáenz, J.; Ibarra-Berastegi, G.; González-Rojí, S.J.; Carreno-Madinabeitia, S. Global estimations of wind energy potential considering seasonal air density changes. Energy 2019, 187, 115938. [Google Scholar] [CrossRef]
Figure 1. Spatial distribution of annual and seasonal mean WS during the historical period of 1995–2014. The ERA5 is shown in (a,d,g,j,m) (unit: N/m2), the EnsMean is shown in (b,e,h,k,n) (unit: N/m2), and the relative biases are shown in (c,f,i,l,o) (unit: %).
Atmosphere 15 00139 g001
Figure 2. Evolution of WEI to SW in the NIO. The spatial distribution of the annual mean climatological state of WEI (unit: W/m2) (baseline) during the historical period from 1995 to 2014, and the expected changes in annual mean WEI compared to the historical period (unit: %) during the mid-term future period (top panels: (ac)) and the long-term future period (bottom panels: (df)) under the climate change scenarios SSP1–2.6, SSP2–4.5, and SSP5–8.5.
Atmosphere 15 00139 g002
Figure 3. Evolution of WEI to SW in the NIO. The spatial distribution of the winter mean climatological state of WEI (unit: W/m2) (baseline) during the historical period from 1995 to 2014, and the expected changes in winter mean WEI compared to the historical period (unit: %) during the mid-term future period (top panels: (ac)) and the long-term future period (bottom panels: (df)) under the climate change scenarios SSP1–2.6, SSP2–4.5, and SSP5–8.5.
Atmosphere 15 00139 g003
Figure 4. Evolution of WEI to SW in the NIO. The spatial distribution of the spring mean climatological state of WEI (unit: W/m2) (baseline) during the historical period from 1995 to 2014, and the expected changes in spring mean WEI compared to the historical period (unit: %) during the mid-term future period (top panels: (ac)) and the long-term future period (bottom panels: (df)) under the climate change scenarios SSP1–2.6, SSP2–4.5, and SSP5–8.5.
Atmosphere 15 00139 g004
Figure 5. Evolution of WEI to SW in the NIO. The spatial distribution of the summer mean climatological state of WEI (unit: W/m2) (Baseline) during the historical period from 1995 to 2014, and the expected changes in summer mean WEI compared to the historical period (unit: %) during the mid-term future period (top panels: (ac)) and the long-term future period (bottom panels: (df)) under the climate change scenarios SSP1–2.6, SSP2–4.5, and SSP5–8.5.
Atmosphere 15 00139 g005
Figure 6. Evolution of WEI to SWs in the NIO. The spatial distribution of the autumn mean climatological state of WEI (unit: W/m2) (baseline) during the historical period from 1995 to 2014, and the expected changes in autumn mean WEI compared to the historical period (unit: %) during the mid-term future period (top panels: (ac)) and the long-term future period (bottom panels: (df)) under the climate change scenarios SSP1–2.6, SSP2–4.5, and SSP5–8.5.
Atmosphere 15 00139 g006
Figure 7. The annual mean time series of the integrated wind stress input to surface waves over the North Indian Ocean under SSP1–2.6 (blue line), SSP2–4.5 (red line), and SSP5–8.5 (green line), with the long-term trends.
Atmosphere 15 00139 g007
Figure 8. The winter mean time series of the integrated wind stress input to surface waves over the North Indian Ocean under SSP1–2.6 (blue line), SSP2–4.5 (red line), and SSP5–8.5 (purple line), with the long-term trends.
Atmosphere 15 00139 g008
Figure 9. The spring mean time series of the integrated wind stress input to surface waves over the North Indian Ocean under SSP1–2.6 (blue line), SSP2–4.5 (red line), and SSP5–8.5 (green line), with the long-term trends.
Atmosphere 15 00139 g009
Figure 10. The summer mean time series of the integrated wind stress input to surface waves over the North Indian Ocean under SSP1–2.6 (blue line), SSP2–4.5 (brown line), and SSP5–8.5 (purple line), with the long-term trends.
Atmosphere 15 00139 g010
Figure 11. The autumn mean time series of the integrated wind stress input to surface waves over the North Indian Ocean under SSP1–2.6 (blue line), SSP2–4.5 (red line), and SSP5–8.5 (green line), with the long-term trends.
Atmosphere 15 00139 g011
Disclaimer/Publisher’s Note: The statements, opinions and data contained in all publications are solely those of the individual author(s) and contributor(s) and not of MDPI and/or the editor(s). MDPI and/or the editor(s) disclaim responsibility for any injury to people or property resulting from any ideas, methods, instructions or products referred to in the content.