Article

Effects of Ground Subsidence on Permafrost Simulation Related to Climate Warming

1
Key Laboratory of Meteorological Disaster, Ministry of Education (KLME)/Joint International Research Laboratory of Climate and Environment Change (ILCEC)/Collaborative Innovation Center on Forecast and Evaluation of Meteorological Disasters (CIC-FEMD), Nanjing University of Information Science & Technology, Nanjing 210044, China
2
School of Geography and Planning, Nanning Normal University, Nanning 530001, China
3
Cryosphere Research Station on the Qinghai-Tibetan Plateau, State Key Laboratory of Cryospheric Sciences, Northwest Institute of Eco-Environment and Resources, Chinese Academy of Sciences, Lanzhou 730000, China
4
University of Chinese Academy of Sciences, Beijing 100049, China
*
Author to whom correspondence should be addressed.
Atmosphere 2024, 15(1), 12; https://doi.org/10.3390/atmos15010012
Submission received: 30 October 2023 / Revised: 8 December 2023 / Accepted: 16 December 2023 / Published: 21 December 2023
(This article belongs to the Special Issue The Role of the Tibetan Plateau in the Climate System)

Abstract

:
We develop a moving-mesh permafrost model that contains a ground subsidence computation module to estimate the effects of ground subsidence on permafrost simulation under different warming scenarios. Including the ground subsidence process in the permafrost simulation produces only a relatively small improvement in the simulation performance of the ground temperature field, as validated by observations from two sites on the Qinghai–Tibetan Plateau (QTP). It is shown that ignoring ground subsidence tends to achieve a larger active layer thickness (ALT) but a smaller original thickness of permafrost that has thawed when simulating permafrost changes in a warming climate. The heat consumed by permafrost changes will be underestimated in simulations that do not consider ground subsidence. The effects that ground subsidence exerts within the permafrost simulation are clearly demonstrated under a strong warming scenario, which will influence the global energy budget. Projections indicate that the permafrost in the continuous permafrost area of the QTP may be close to the phase transition temperature to become zero thermal gradients in 2030–2040 under the SSP5-8.5 scenario, and there will be a great risk of ground subsidence by that stage. For permafrost regions with rich ground ice, the downward propagating temperature signals caused by ground subsidence are more attenuated. However, the heat calculation error will be larger in a simulation that does not consider ground subsidence there. This study quantifies the effects of ground subsidence, which can provide a better understanding of the permafrost thaw and energy budget of the QTP.

1. Introduction

Over the past decade, the international community has become interested in using simulations to determine the fate of permafrost regions affected by the warming climate. This requires an accurate description of both the climate forcing mechanisms and the physical processes governing the transformation of the local permafrost systems [1,2]. Permafrost degradation is defined by rising temperatures within permafrost regions and by decreases in the thickness and area covered by permafrost within a period of at least several years [3]. The permafrost on the QTP is vulnerable to climate change because of the relatively rich ground ice and generally warm ground temperature (>−1 °C) [4,5]. Widespread permafrost degradation on the QTP has been linked to global warming [6,7,8]. The volume of ice within permafrost can exceed the volume of natural soil pores because of ice wedges, segregation ice or ice lenses. Ground subsidence, which occurs as a consequence of ground ice melting, has been exacerbated in permafrost regions worldwide in recent years [9,10,11]. Changes to landforms as a result of ground subsidence can damage the foundations of buildings and lead to irreversible ecological changes [12,13,14] but also influence the trajectories of subsequent permafrost changes [15]. Recent advances in modeling have improved the representation of permafrost systems by considering the effects of melting ground ice, such as the deformation of the soil layer as it thaws [16,17,18]. Some studies have noted that incorporating ground subsidence into the model, which brings the permafrost table closer to the ground surface, will produce more intense permafrost thawing, although there are no uniform conclusions. Painter et al. [19] believed that subsidence slightly accelerates ALT development, Buteau et al. [20] believed there is significant acceleration, and Nitzbon et al. [21] believed there is slight acceleration or large acceleration, depending on the assumed boundary conditions. It is still difficult to quantify the effect that ground subsidence has on permafrost simulations because there is a striking gap between the massive scales demanded by atmospheric models and the effect scope of ground subsidence [22]. For example, several centimeters of thawing permafrost only causes several millimeters of ground subsidence at spatial scales that range from meters to hundreds of meters within time periods of years to a dozen years [23]. Ground subsidence and its effects are such highly localized and nonlinear processes that it is difficult to obtain accurate information directly through low-resolution process modeling, as is generally performed in atmospheric modeling. Permafrost is also acknowledged as a vital part of the underlying surface in general circulation models (GCMs) because they have a great effect on the global energy budget [24,25]. Misestimation of permafrost thawing may result in changes to how energy is allocated to other climate subsystems [26]. The numerical models used for permafrost change projections for the QTP, however, lack a ground subsidence process, which may preclude realistic simulation of the permafrost thaw and energy budget in such ice-rich regions.
In our previous research, we developed a new moving-mesh permafrost model incorporating ground subsidence [27]. Our model is characterized by the simulated soil columns ranging from tens to hundreds of meters in height, with a centimeter-scale vertical resolution. As a consequence, the simulation results are detailed enough to be verified via field measurements at the site scale directly. With this accuracy, it is possible to disentangle the annual dynamics of the active layer thickening and the variation of the permafrost temperature field under climate warming. The ground subsidence computation module in the model can be turned on or off, which can represent permafrost simulation with or without considering ground subsidence. Here, we are principally concerned with two questions. First, how does ground subsidence quantitatively effect the trajectory of permafrost change, main characteristic indicators and heat consumption in a permafrost simulation? Second, as there are different modes and stages of permafrost degradation processes on the QTP [28,29], what are the differences in the characteristics and effects of ground subsidence between ice-poor and ice-rich permafrost regions at different permafrost degradation stages?
In this study, which monitored ground temperatures on the QTP to validate the model, we compare the performance of the permafrost simulation both with and without considering ground subsidence. We also carry out an experiment to test the bias of the heat consumption for permafrost degradation under different warming scenarios if ground subsidence is not considered in the permafrost simulation. As opposed to previous studies that have estimated the thawing rate of permafrost affected by ground subsidence, we seek to quantify the effects that the ground subsidence process has on downward propagating temperature signals and the heat consumption for permafrost degradation in a thermodynamic model. Moreover, we compare the ground subsidence and its influence in permafrost regions with different underground ice contents in a warming climate. We hope that the results of this research can improve the understanding, simulations, and predictions concerning the interrelationships between permafrost evolution and climate warming.

2. Methods

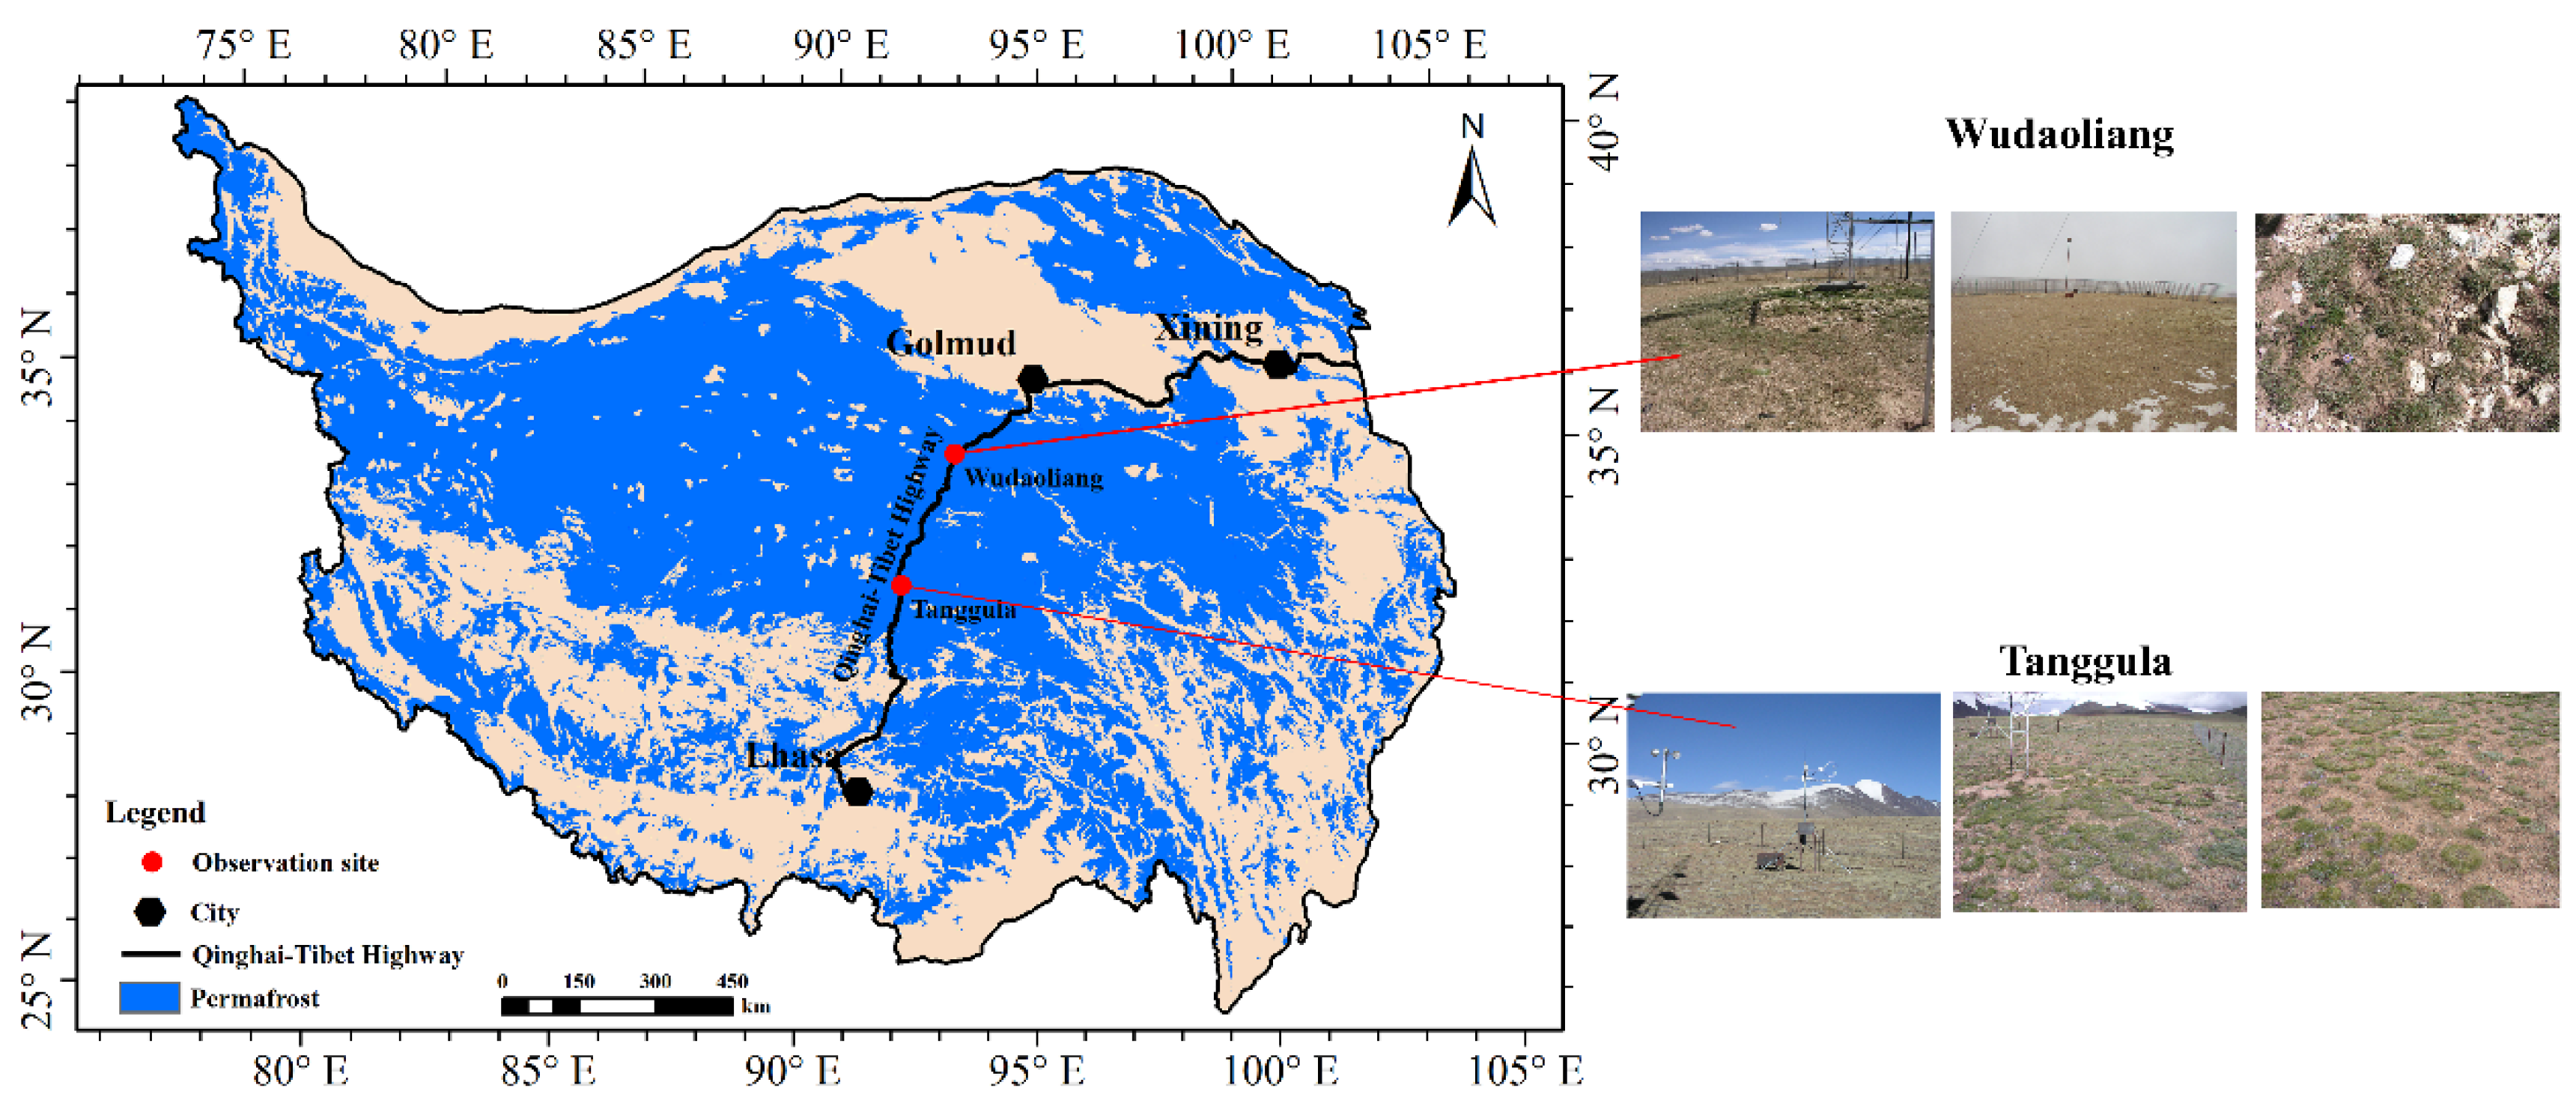
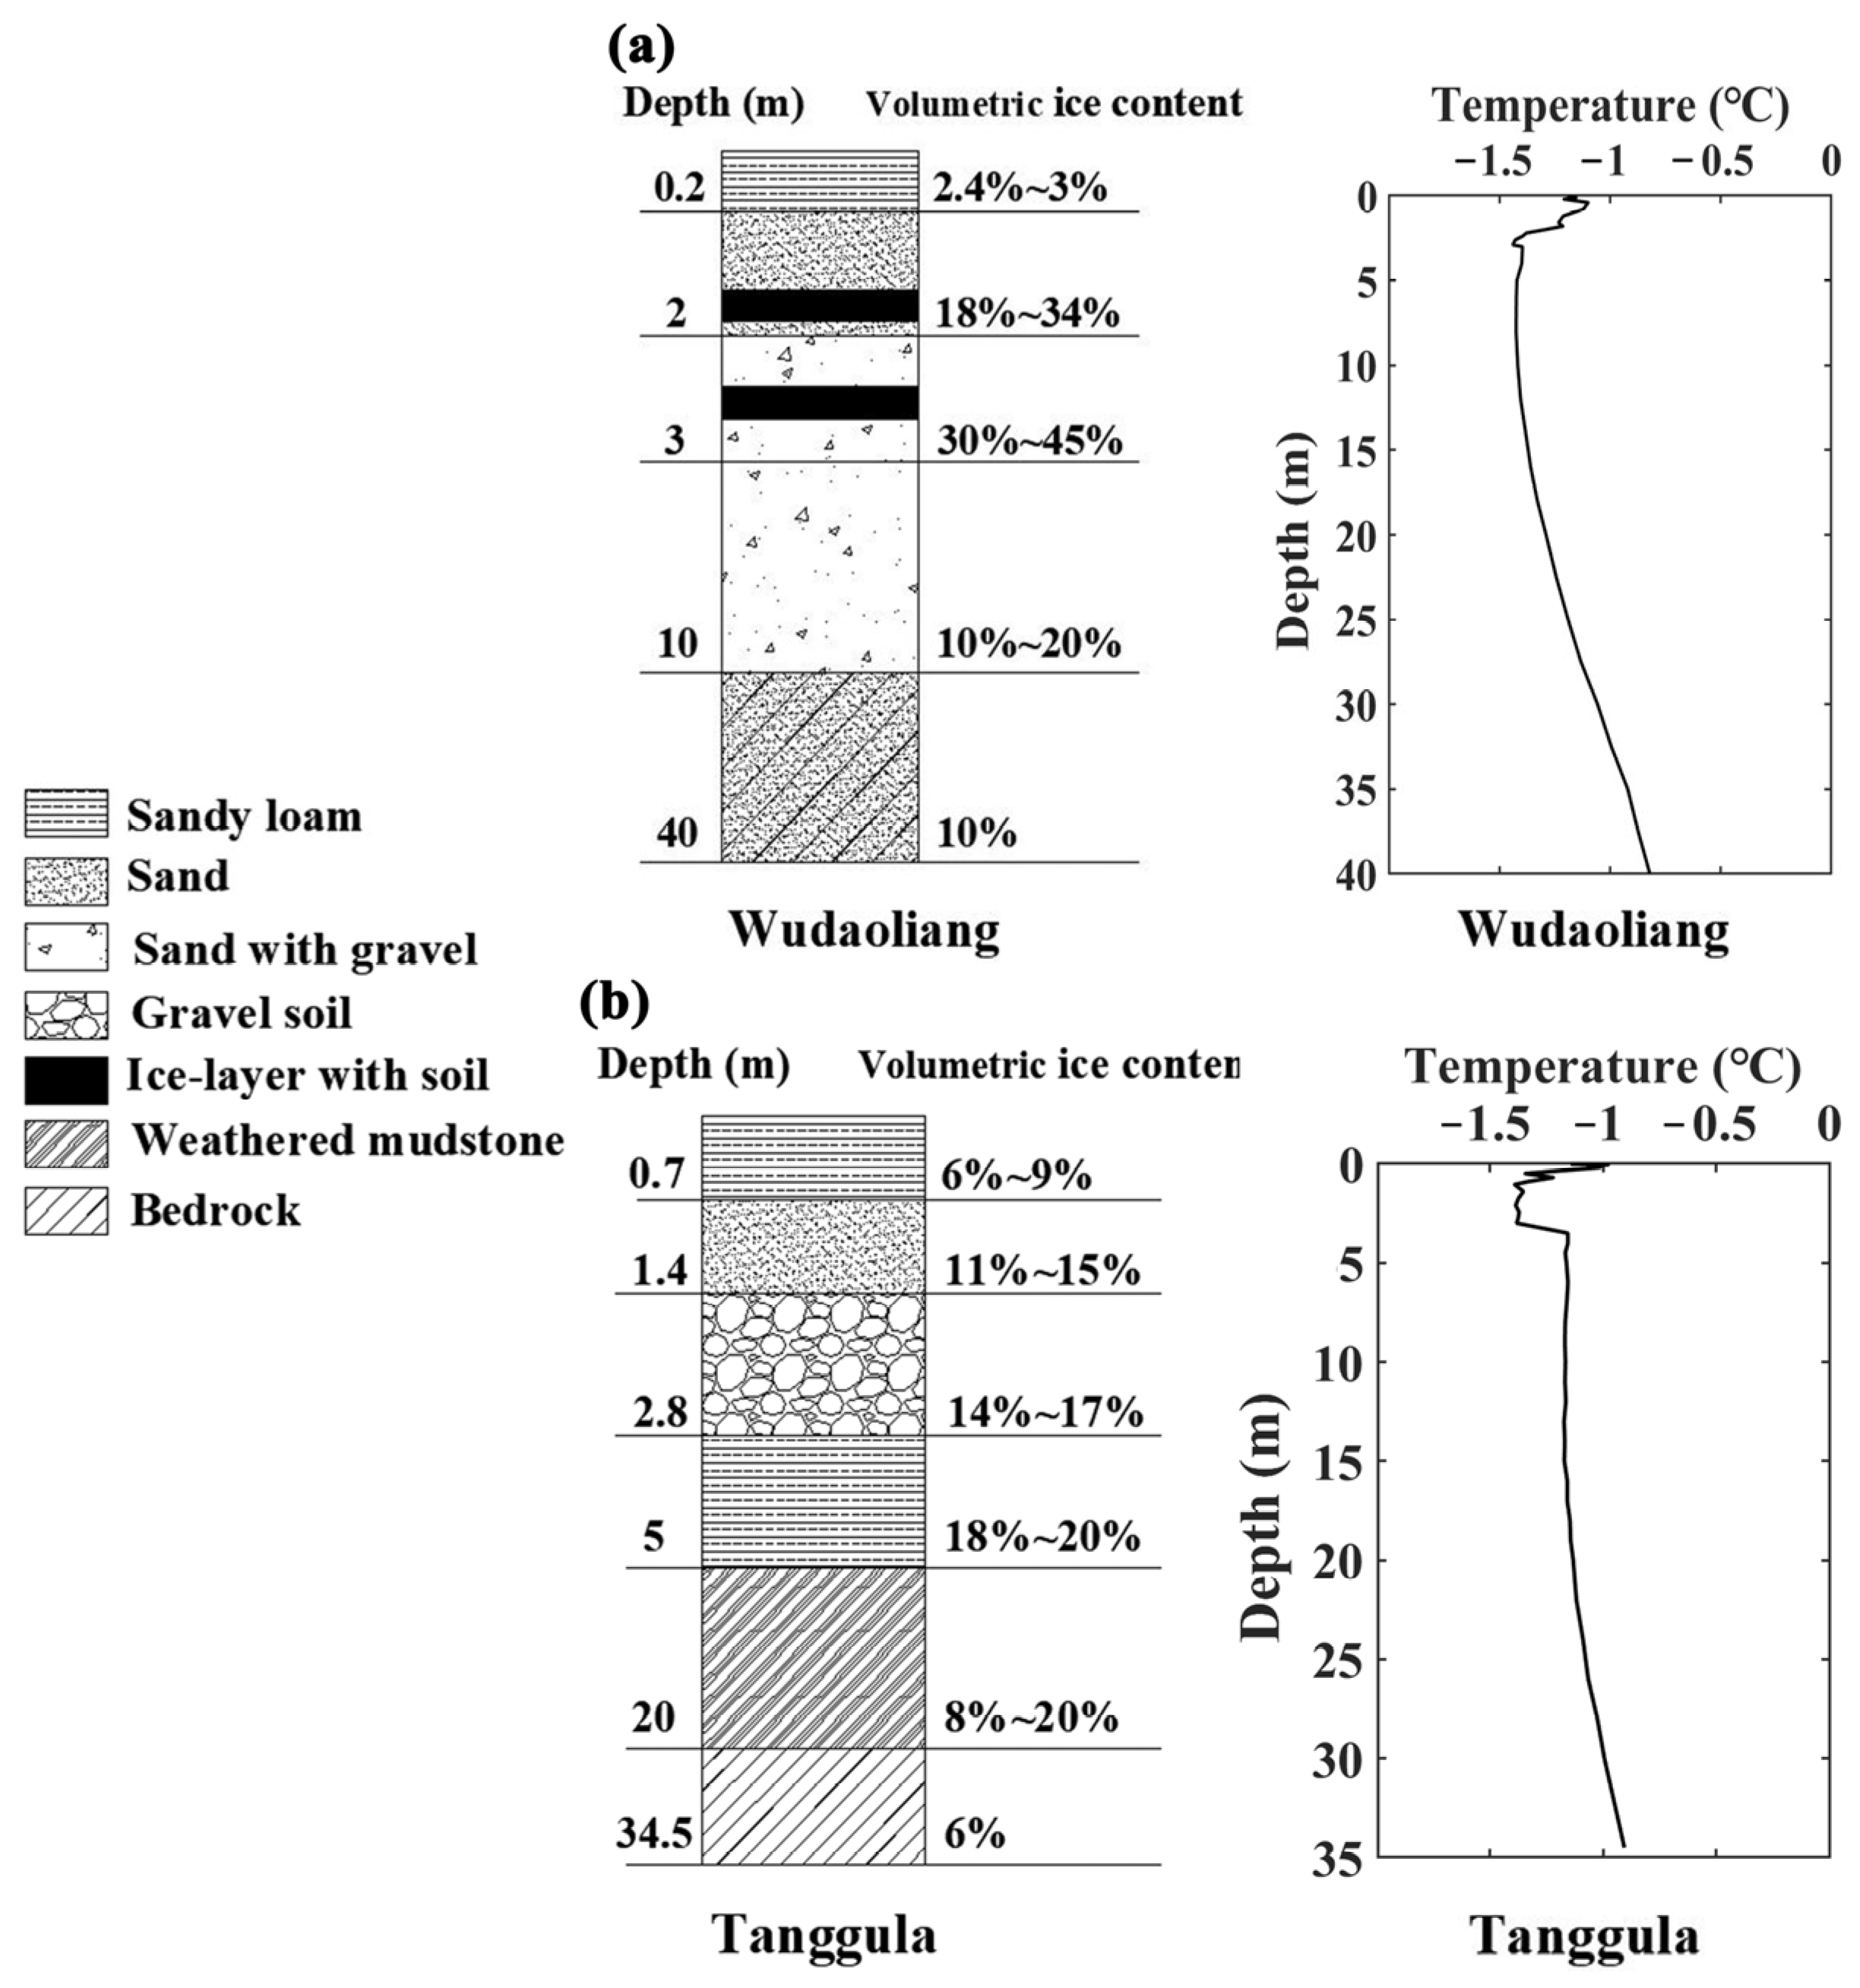
2.1. Study Areas and Observations

A permafrost monitoring network on the QTP has been established by the Cryosphere Research Station, Chinese Academy of Sciences (CRS-CAS) [30]. The study areas are two representative permafrost observation sites that are part of the network. One is in the Wudaoliang Basin (35.22° N, 93.08° E; altitude 4783 m), and the other is on Tanggula Mountain (33.07° N, 91.93° E; altitude 5100 m) (Figure 1). The mean annual air temperature and precipitation are −5.1 °C and 294.8 mm at Wudaoliang, and −4.9 °C and 436.7 mm at Tanggula. Long-term monitoring and field investigations, including meteorological factors, soil moisture, ground temperature, geological profiles, geodetic leveling and so on, have been conducted at the study sites. The stratum conditions, ground ice contents and the annual average temperature–depth curves in 2015 at the two study sites are shown in Figure 2. There is rich ground ice (volume ice content > 45%) near the present permafrost table at Wudaoliang, while the volume ice content is approximately 15% near the present permafrost table at Tanggula.

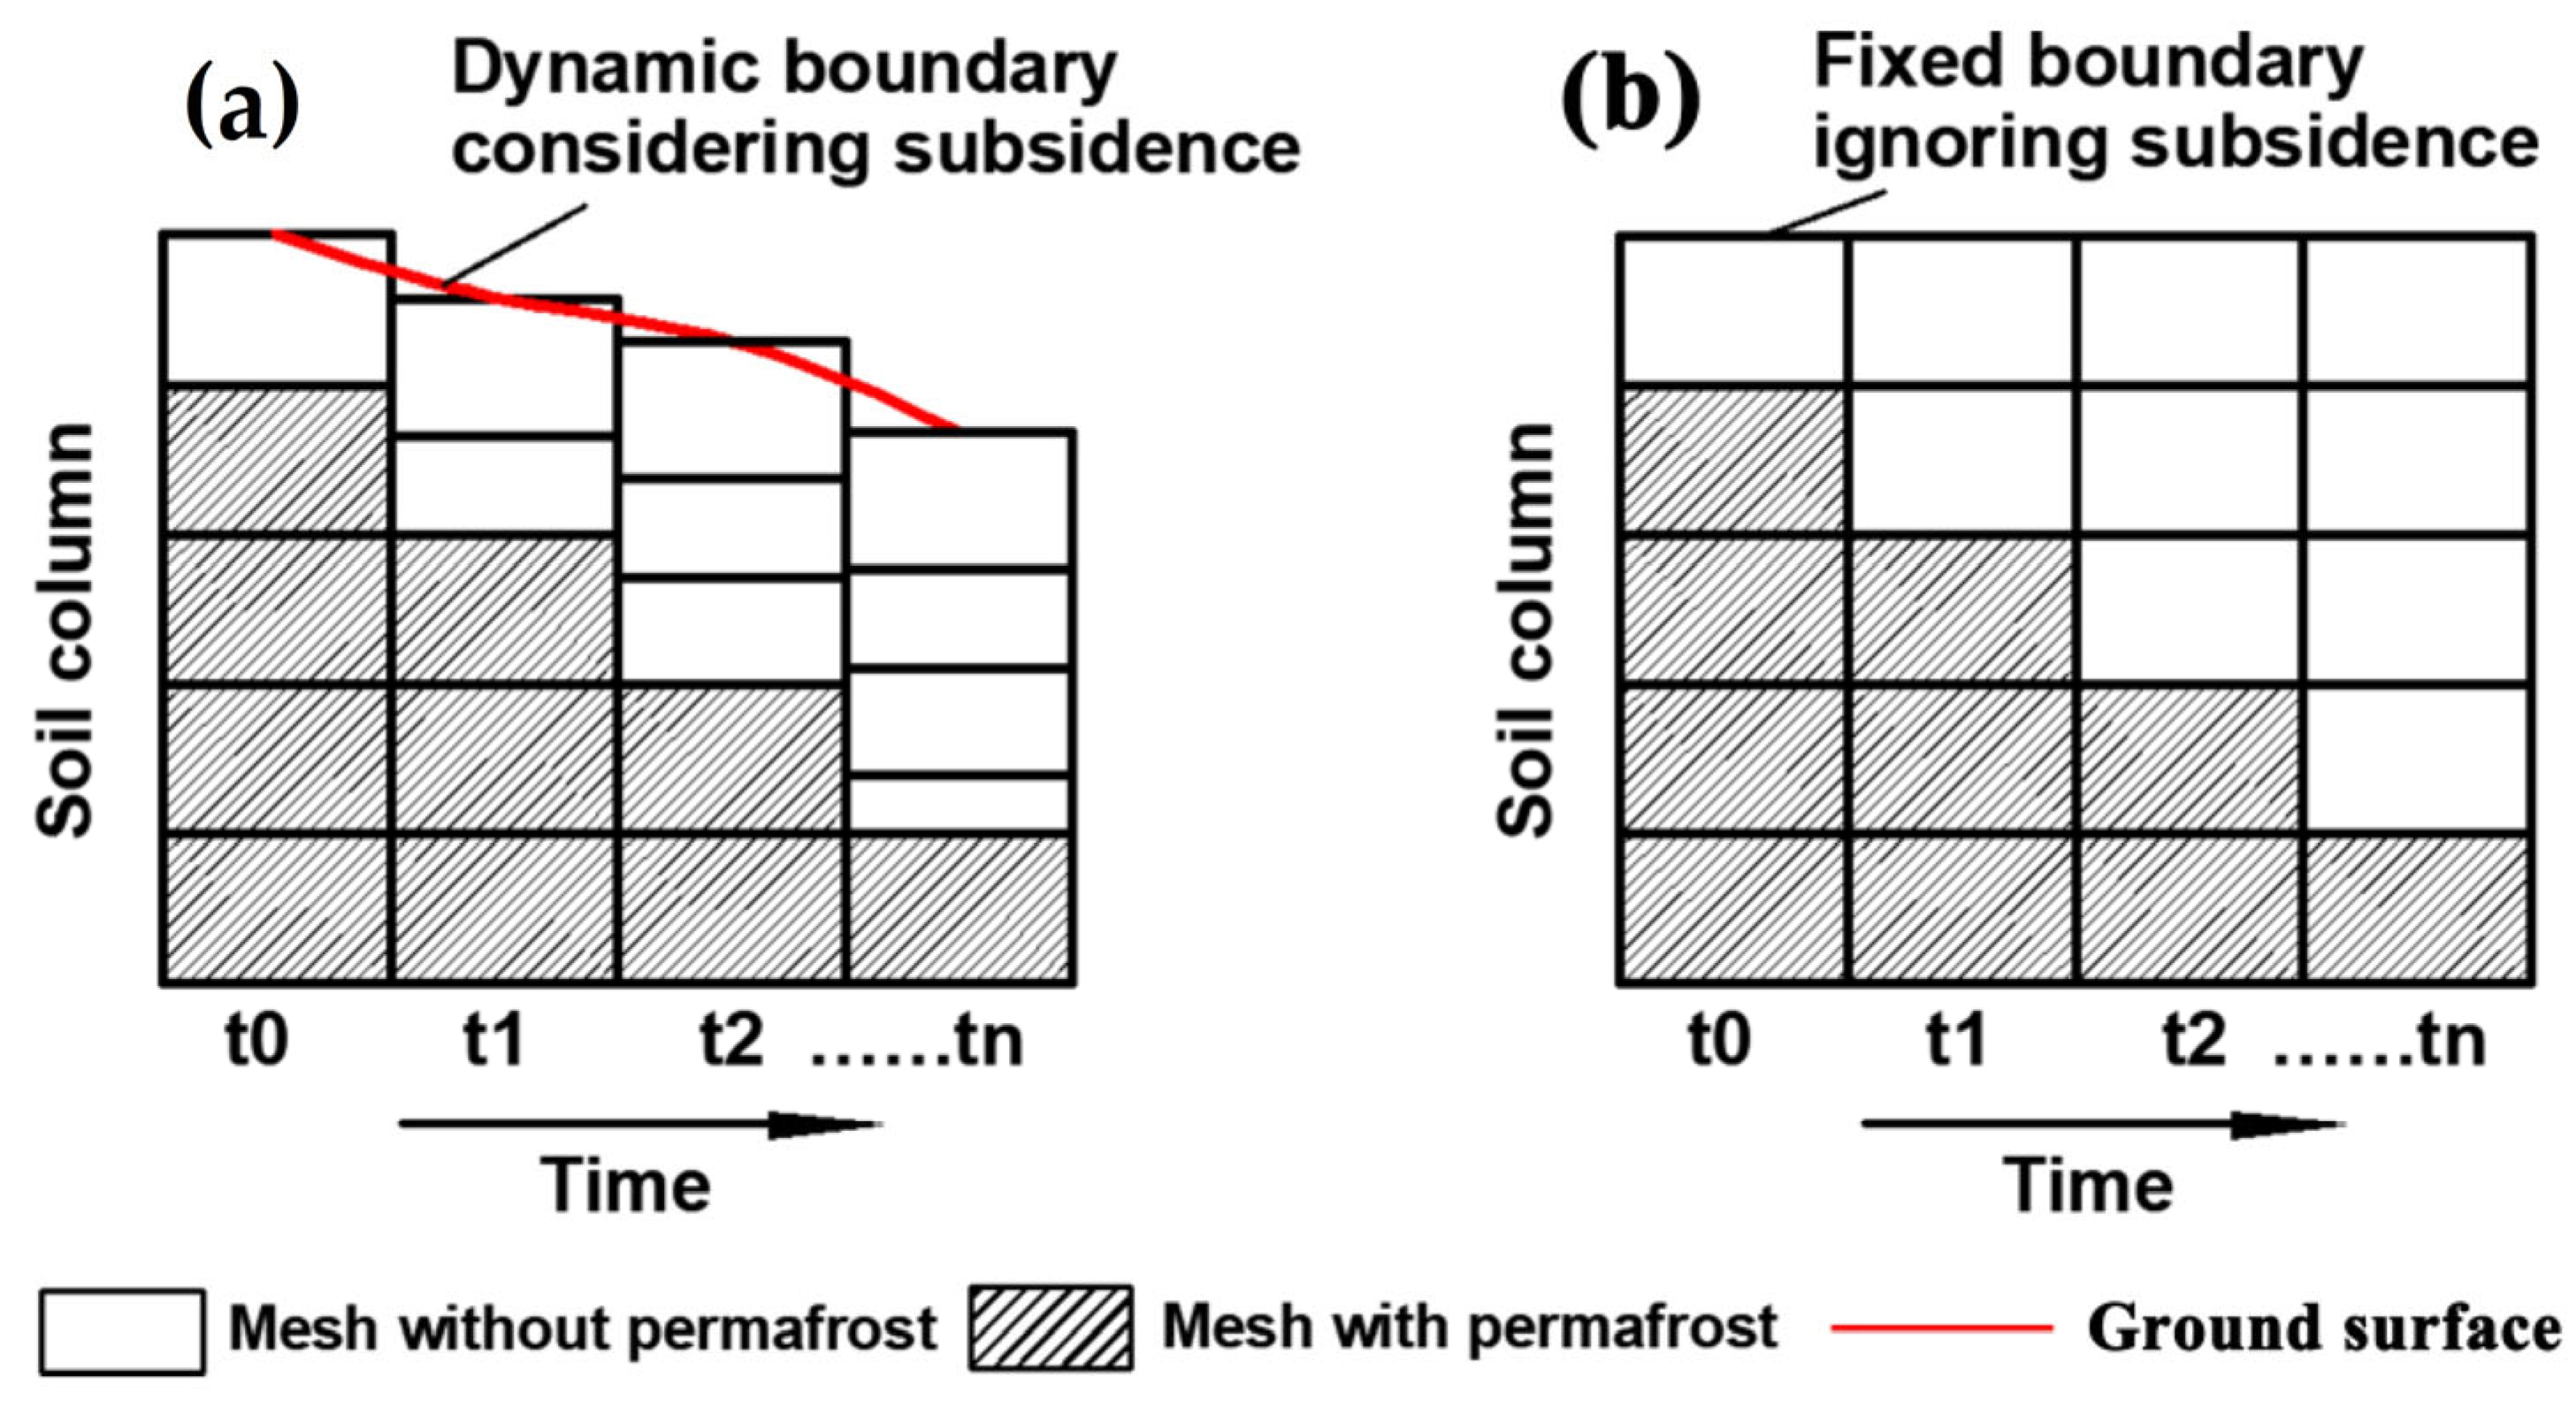
2.2. Numerical Model

The moving-mesh permafrost model is designed to study permafrost changes with ground subsidence [27]. The subsurface heat distribution process is described by a one-dimensional heat conduction equation with nonconstant coefficients, and the apparent heat capacity ceff(z,T) (J/(m³·°C)) is introduced to take into account the latent heat of thawing/freezing within a small phase transition temperature range of −0.3~0 °C based on observations. The equations
c e f f z , T T t z λ   z , T T t = 0
c e f f z , T = c z , T + L θ w T
representing the variation of the soil temperature  T  (°C) with the depth  z  (m) and time  t  (d), where L = 334 MJ·m−3 denotes the volumetric latent heat of the ice-water phase transition, and  θ w  (%) denotes the volumetric water content. The soil thermal properties are described by the soil volumetric heat capacity c(z,T) (J/(m³·°C)) and the soil thermal conductivity λ(z,T) (w/(m·°C). The volumetric water content  θ w  (%) and soil texture used in this study are from the monitoring data and observations (Figure 2). However, we cannot obtain the soil volumetric heat capacity c(z,T) and the soil thermal conductivity λ(z,T) via monitoring directly due to conditional limitations. We select c(z,T) and λ(z,T) from Principles of Geocryology [31] based on the observed soil texture and measured volumetric water content (Table 1). And it is assumed that the soil parameters remain unchanged in the past and future.
There is a ground subsidence computation module based on the moving-mesh Lagrangian method in the model. The control equation [32] is as follows:
S = α ( H t H 0 )
α = A ( θ θ 0 )
where  S  denotes the ground subsidence caused by permafrost thawing; H0 and Ht are the calculated thickness of the frozen soil layers before and after ground ice melting, respectively; and  α  denotes the thawing settlement coefficient depending on the soil texture parameter  A , the volumetric ice content θ and the critical volumetric ice content for ground subsidence θ0. Similarly,  A  and θ0 that cannot be directly measured are selected from the authoritative references [33,34] (Table 1).
In the ground subsidence computation module, the soil column is divided into finite variable spatial meshes following Hooke’s law, just like an elastomer. The ground surface is defined as a dynamic boundary (Figure 3a). However, ground subsidence is different from spring deformation. The ground subsidence is not caused by the displacement of all the spatial nodes but by the compression of the spatial mesh near the permafrost table where the underground ice has melted. This causes the spatial nodes above the permafrost table to all shift downward after melting, while the spatial nodes below the permafrost table are not displaced (Figure 3a). Therefore, the displacement equation used to calculate the domain nodes in a unit time step is as follows:
Δ z i = z i n e w z i o l d = Δ S i j ,   h t a b l e o l d < z i < h t a b l e n e w   Δ z i = Δ S = S i j ,                                     0 < z i h t a b l e o l d Δ z i = 0 ,                                                                                   z i h t a b l e n e w  
where  Δ z i  is the displacement of node I z i n e w  and  z i o l d  represent the spatial positions of node i before and after displacement, respectively;  Δ S i j  is the amount of subsidence and compression caused by the melting of underground ice in the spatial mesh composed of node i and adjacent node j in this unit time step, as calculated by control Equations (3) and (4);  Δ S  is the ground subsidence amount, which is the sum of the melting settlement compression amount generated by all the spatial meshes where underground ice melting occurs; and  h t a b l e o l d  and  h t a b l e n e w  are the permafrost table depth before and after ground ice melting. The boundary geometry is redefined by the displacement of the mesh nodes, which is used for the updating of the spatial structure of the soil layers. The movement of the soil column’s upper boundary represents the ground subsidence, and its speed depends on the thawing settlement coefficient and the melting rate of ground ice. The ground subsidence is induced by permafrost thawing, and the seasonal ground surface deformation is ignored in this study.
The ground subsidence computation module of the model can be enabled or disabled. If it is turned on, the permafrost model considers ground subsidence (hereinafter called the “moving-mesh model”) (Figure 3a). If it is turned off, the spatial nodes of each soil layer are fixed and the permafrost model does not consider ground subsidence (hereinafter called the “fixed-mesh model”) (Figure 3b).

2.3. Forcing Data

For a better understanding of how ground subsidence operates in permafrost simulations, historical permafrost changes and different future warming scenarios are considered in this study. The forcing data consist of historical and future ground surface temperature (GST). There is a Chinese official meteorological station (Wudaoliang station and Tuotuohe station) near each of the two study sites, which has the daily observation data of the GST from 1966 to 2018. The historical GST series (1966–2018) are reproduced by establishing multiple regressions between our local observation records of the GST (2005–2012) and the daily observation data of the GST (1966–2018) from the two Chinese official meteorological stations as follow:
GSTWrep = 1.04GSTWudaoliang − 2.87,   r2 = 0.88 and p < 0.01
GSTTrep = 0.85GSTTuotuohe − 1.32,     r2 = 0.93 and p < 0.01
where GSTWrep and GSTTrep are the reproduced GST at Wudaoliang and Tanggula, respectively; GSTWudaoliang and GSTTuotuohe are the daily observation data from the Chinese official meteorological station at Wudaoliang and Tuotuohe, respectively; and r and p are the correlation coefficient and its significance level between our observed GST and the reproduced historical GST during our observation period. We achieve an r2 > 0.89 and p < 0.01 at the study sites, suggesting the validity of our approach.
The changes in the future climate has been evaluated and projected by the new phase of the Coupled Model Intercomparison Project (CMIP6) [35]. The separate outputs from the ensemble median of the 31–34 models from the CMIP6 predicted that the mean air temperature will rise by 0.017–0.064 °C·a−1 according to the Shared Socioeconomic Pathways (SSPs) during the 21st century over the QTP [36]. In this study, it is assumed that the GST and air temperature rise at the same rate, giving the minimum value of 0.017 °C·a−1 under the SSP1-2.6 scenario and the maximum value 0.064 °C·a−1 under the SSP5-8.5 scenario. With these trends superimposed, the historical forcing data through 2018 are repeated to provide daily forcing from 2019–2100 to conduct the future permafrost simulation.
The forcing data are used as the upper boundary driving condition. The bottom boundary of the simulation is set at 100 m, and the observed mean annual heat fluxes, which are 0.08 W/m2 at Wudaoliang and 0.05 W/m2 at Tanggula, are used as the lower boundary condition (Neumann boundary).

2.4. Experimental Design

The historical and future ground surface temperature series are used to drive the moving-mesh model that considers ground subsidence and the fixed-mesh model that does not consider ground subsidence. All the input parameters and the initial conditions are the same for the two models. The simulation results, including the permafrost change trajectories, ground temperature fields and the heat consumption difference between the two models, are compared and analyzed to study the effects of ground subsidence on permafrost simulation.
Firstly, the models are continually driven by the ground surface temperature of the first year (1966) for the simulation initialization. When the interannual temperature variation is less than 0.01 °C in the deepest soil layers, it is believed that the ground temperature field has reached an equilibrium state. The ground temperature profile in the equilibrium state is used as the initial conditions. Subsequently, the models are driven by the entire forcing data to achieve the finial simulation results, which are validated using the ground temperature measurements from 2005 to 2018. The simulation performances are assessed using the root mean square error (RMSE) and the Nash efficiency coefficient (NSE) [37]. The RMSE is defined as:
R M S E = i = 0 n ( O i S i ) 2 n
where Si is the ith simulation value, Oi is the ith observation value and n is the number of comparison points. The smaller the RMSE is, the more accurate the simulation is. The NSE is defined as:
N S E = 1 i = 0 n ( O i S i ) 2 i = 0 n ( O i O i ¯ ) 2
where  O i ¯  is the mean observation value and n is the number of comparison points. The closer to 1 the NSE is, the better the simulation reproduces the variation pattern of the observations.
To quantify the effects of the ground subsidence on the downward propagating signals in the ground temperature field simulation, we regard the simulated ground temperatures at different depths from the moving-mesh model as the reference values and calculate the mean absolute error (MAE) of the results from the fixed-mesh model relative to the reference values under the different warming scenarios.
M A E = i = 0 n | F i M i | n      
where Mi denotes the simulated temperature value from the moving-mesh model, and Fi denotes the simulated temperature value from the fixed-mesh model. If the MAE is larger than 0.01 °C at a given depth, the annual temperature signal at that depth is considered to have been influenced by ground subsidence. If the MAE is larger than 0.05 °C at a specific depth, the temperature at that depth is considered to have been significantly influenced by ground subsidence.
In general, calculating the heat absorbed from the ground surface during permafrost degradation involves two parts: (1) heat consumption for ground ice melting and (2) sensible heat for permafrost temperature rises. The following equation is used to estimate the bias of the heat consumption for permafrost degradation caused by the ground subsidence process:
Q = L θ Z + c i T i d t t x i
where ΔQ denotes the bias of the heat consumption for permafrost degradation (MJ/m2), θ denotes the volumetric ice content in the corresponding thawing permafrost, ΔZ denotes the difference in the original thickness of the permafrost that has thawed calculated by the two models (m),  c i  denotes the heat capacity in the ith soil layer ((J/(m3·°C)), t denotes the total time (d),  x i  denotes the thickness of the ith soil layer (m), and  T i d t  denotes the difference in the freeze–thaw index between the two models (°C·d). The first item in the equation represents the difference in the heat required for a phase change per unit area, and the second item in the equation represents the difference in the sensible heat per unit area due to ignoring ground subsidence.

3. Results

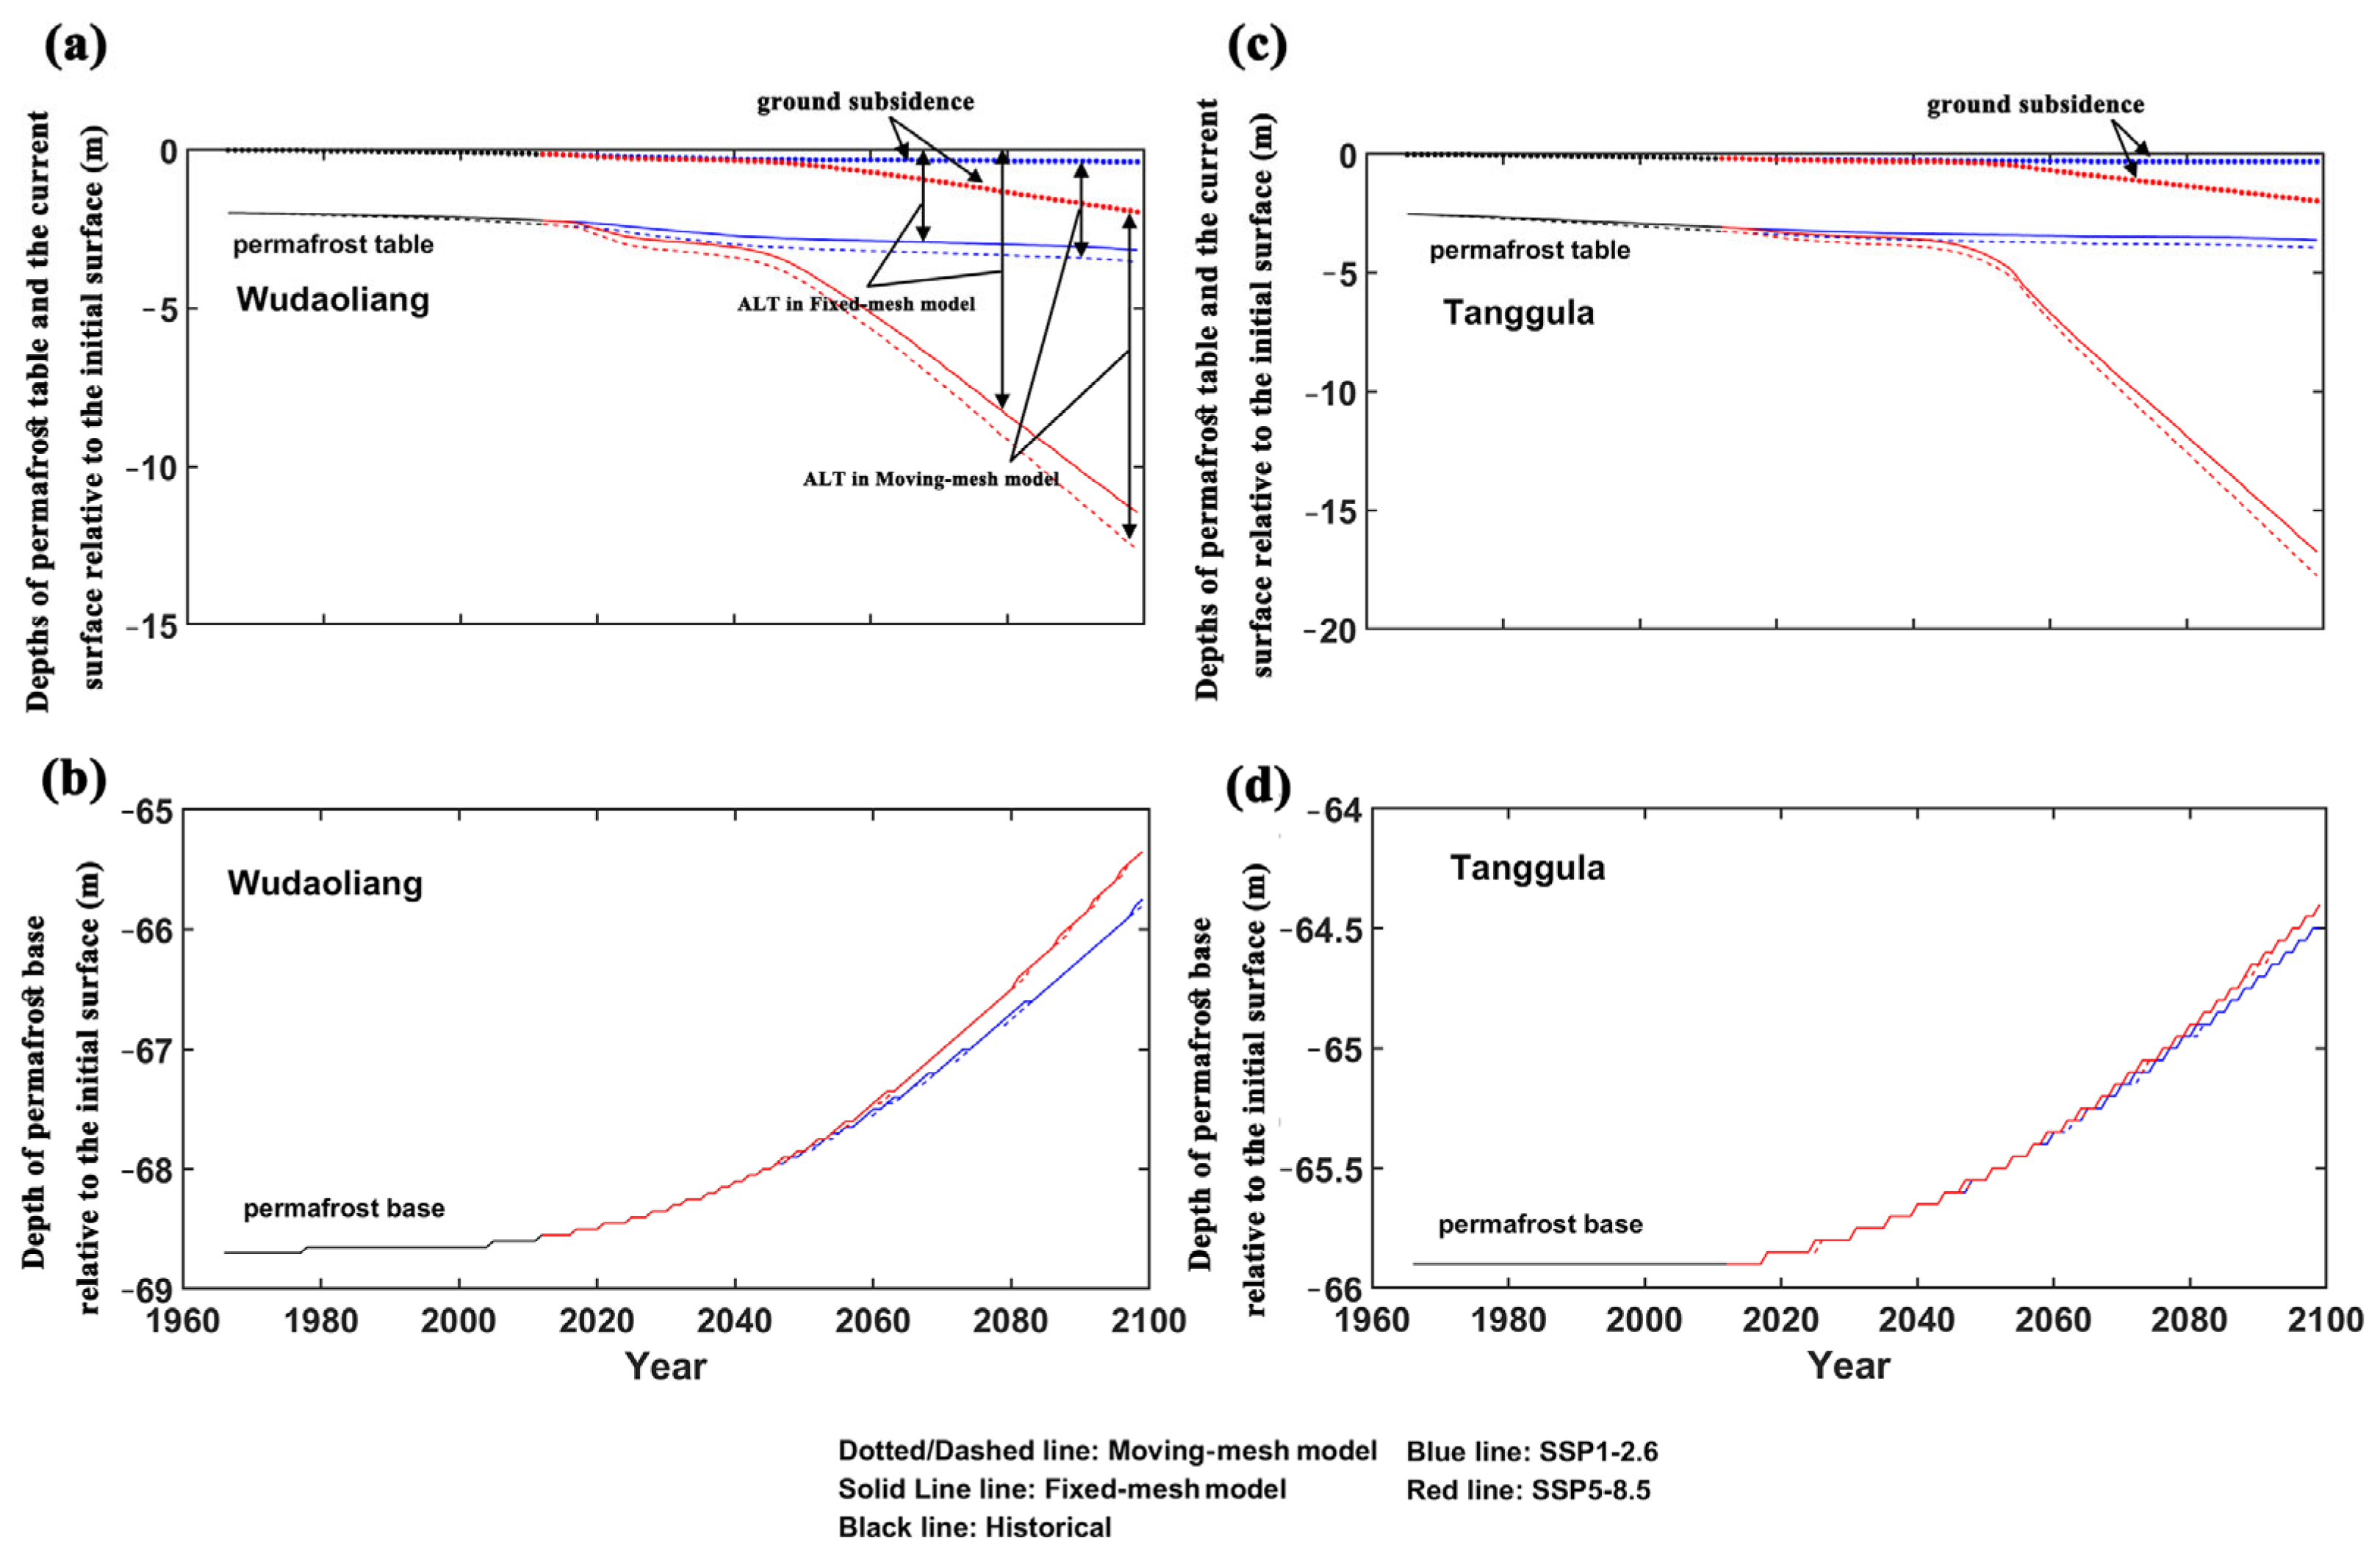
3.1. Ground Subsidence and Permafrost Change Trajectories

The simulation results concerning the ground subsidence and permafrost change trajectories in the period 1966–2100 at the two study sites under different warming scenarios from the moving- and fixed-mesh models are shown in Figure 4. The differences in the two models are not obvious at the study sites from 1966 to 2018, because the simulated total ground subsidence is 0.170 m and 0.122 m at Wudaoliang and Tanggula by 2018, respectively, which are too minimal to be easily discerned. Therefore, the effects of ground subsidence on the simulation of the permafrost change trajectories are unclear during this time. The simulated permafrost changes of the two models are basically consistent with the observations, but the spatial resolution of the probe interval is not sufficient to determine which simulated results are better.
Under the SSP1-2.6 scenario, the simulated total ground subsidence is 0.382 m at Wudaoliang and 0.324 m at Tanggula by 2100. The ALTs in the results of the two models are not very different, but the remaining permafrost thicknesses in the results of the moving-mesh model are 0.462 m and 0.304 m smaller than those in the results of the fixed-mesh model by 2100 at Wudaoliang and Tanggula, respectively.
Under the SSP5-8.5 scenario, the simulated total ground subsidence increases to 3.864 m at Wudaoliang and 3.309 m at Tanggula by 2100. The ALTs in the results of the moving-mesh model are 1.864 m and 1.709 m smaller than those in the results of the fixed-mesh model, and the remaining permafrost thicknesses in the results of the moving-mesh model are 1.828 m and 1.540 m smaller than those in the results of the fixed-mesh model by 2100 at Wudaoliang and Tanggula, respectively. The permafrost table is closer to the ground surface during permafrost degradation, and permafrost thawing is more significant in the moving-mesh model that considers ground subsidence. The effects of ground subsidence are clearly demonstrated.

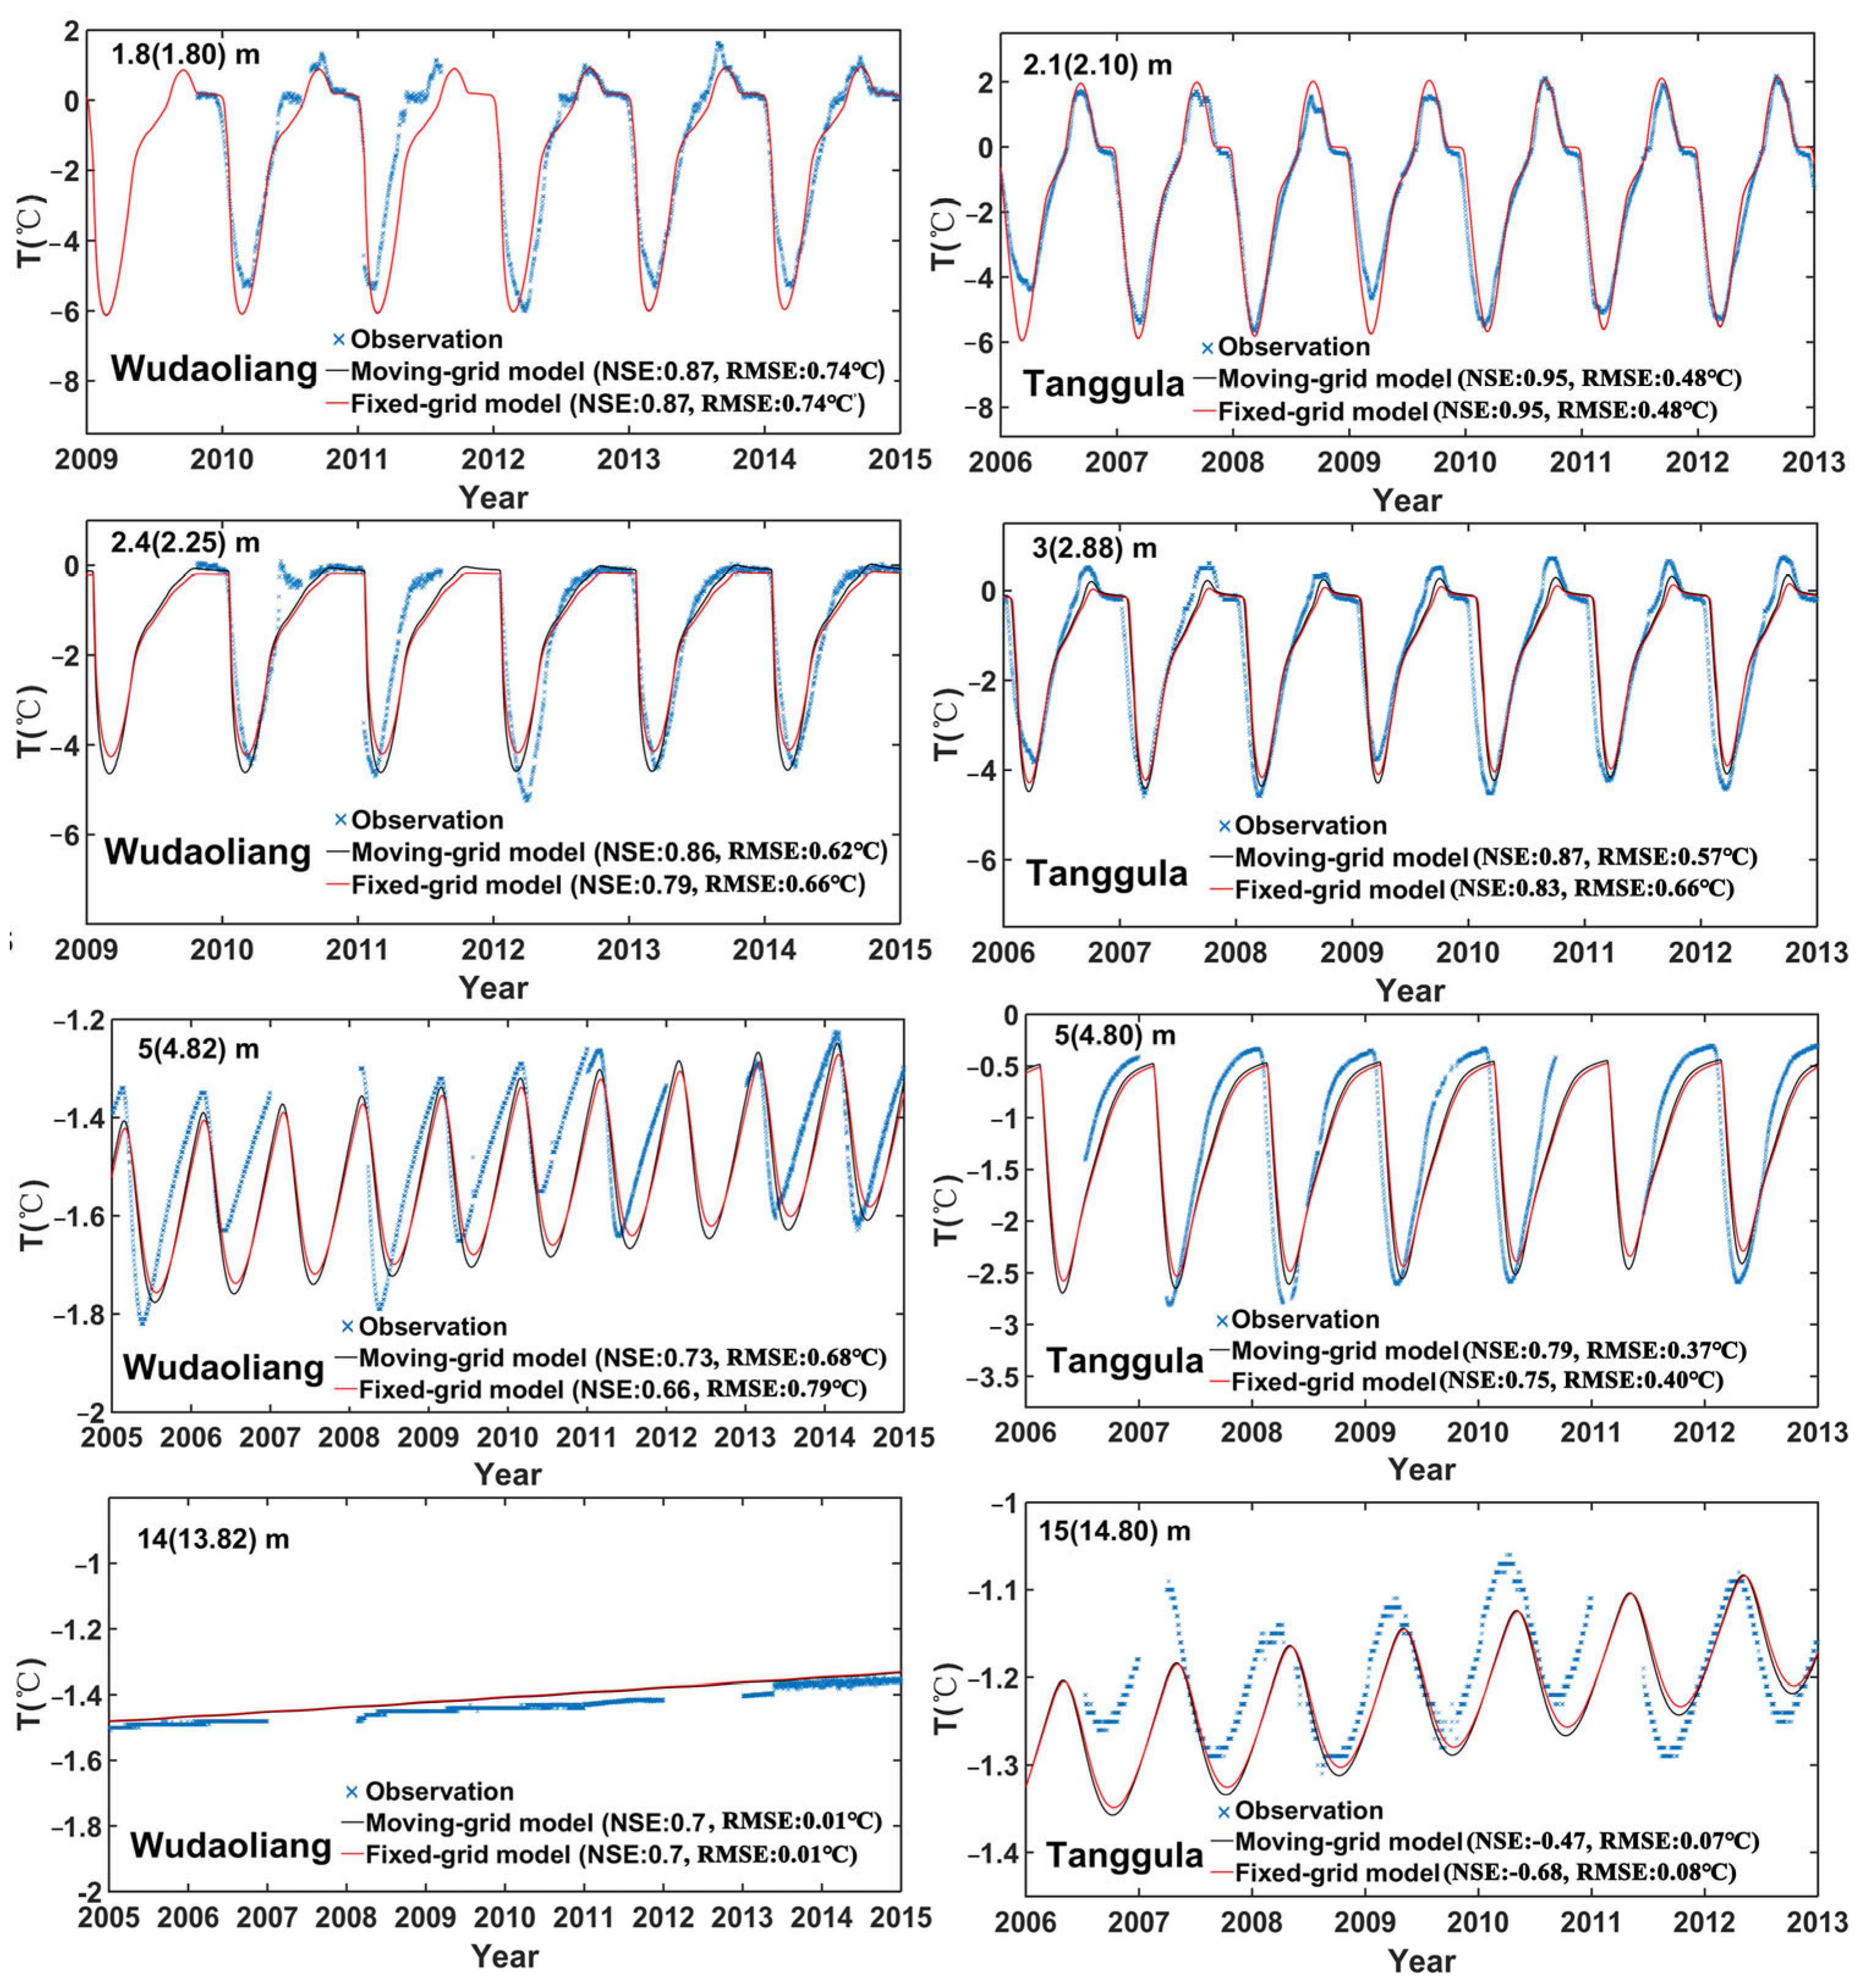
3.2. Comparison of Ground Temperature Simulations

The moving-mesh model can well reproduce the measured ground subsidence trend at the study sites. The geodetic leveling shows the mean ground subsidence rates are 7.30 mm/a and 3.84 mm/a, while the simulated mean ground subsidence rates are 5.40 mm/a and 3.60 mm/a during the observation period at Wudaoliang and Tanggula, respectively. With the validation via the measured daily ground temperature data, the RMSE and NSE of the simulation results concerning the ground temperature during the observation period from the two model are shown in Figure 5. In general, compared with the fixed-mesh model, the average RMSE is smaller and the average NSE is closer to 1 in the ground temperature simulation from the moving-mesh model. This indicates that the performance of the permafrost model is improved by considering the influence of ground subsidence. However, there is no statistically significant difference in the simulation performances (p > 0.05) during the observation periods due to the minimal ground subsidence at the study sites. The simulated temperature changes in the mesh nodes whose initial depth was above 1.8 m at Wudaoliang and 2.1 m at Tanggula are completely the same in the two models. These spatial meshes are slightly above the calculated initial permafrost table in 1966 at the corresponding site, which means that they are not affected by the subsequent ground subsidence in the moving-mesh model. Those affected mesh nodes have greater annual temperature amplitudes in the moving-mesh model than they do in the fixed-mesh model with the same initial depth. The largest difference in the simulated temperatures in the two models is observed at the mesh nodes around the present permafrost table at the two study sites, and the difference decreases exponentially with increasing depth. As shown in Figure 6, this effect is not obvious during the observation period or under the SSP1-2.6 scenario because of the slight ground subsidence, but it will be significant under the SSP5-8.5 scenario. Compared with the fixed-mesh model, the temperatures in the corresponding spatial meshes with the same initial depths in the moving-mesh model surpassed the phase transition temperature more easily.
The depth–time diagram map of the MAE values for the ground temperature simulation between the two models is used to represent the extent to which a downward propagating signal, induced by ground subsidence, effects the ground temperature field (Figure 7). For Tanggula, the depth of MAE = 0.01 °C over time exhibits a pattern of first propagating downward, then upward, and finally downward once more. The influence (MAE > 0.01 °C) can reach 33 m and 40 m under the SSP1.26 and SSP5-8.5 scenarios, respectively. The reason for this is that when the frozen soil is in the heating stage, the permafrost table in the moving-mesh model is closer to the surface and more easily heated, so the simulated temperature in the permafrost layer with the same initial depth in the moving-grid model is gradually greater that in the fixed-grid model from top to bottom, and the depth of MAE = 0.01 °C will exhibit a downward trend. When the whole permafrost layers simultaneously reach the critical temperature of phase (0 °C), known as the zero geothermal gradient stage [28], there is little difference in the simulated temperature in the deep permafrost layers by the two models, so the depth of MAE = 0.01 °C will exhibit an upward trend instead. When the upper permafrost layers melts completely, the depth of MAE = 0.01 °C will exhibit a downward trend again in these unfrozen soil layers. The significant influence (MAE > 0.05 °C) can reach 7.5 m and 19.5 m under the SSP1.26 and SSP5-8.5 scenarios at Tanggula, respectively. For Wudaoliang, the depth of MAE = 0.01 °C exhibits a downward trend over time. This may be because the massive ground ice at Wudaoliang prevents the whole permafrost layer from reaching the critical temperature of phase simultaneously. The influence (MAE > 0.01 °C) can reach 22 m and 35 m under the SSP1.26 and SSP5-8.5 scenarios, respectively. The significant influence (MAE > 0.05 °C) can reach 4.63 m and 14.1 m under the SSP1.26 and SSP5-8.5 scenarios at Wudaoliang, respectively.

3.3. Error Calculation of Heat Consumption for Permafrost Changes

As shown in Figure 4, permafrost simulation ignoring ground subsidence will lead to a smaller original thickness of permafrost that has thawed. Compared with the fixed-mesh model, there are an extra 0.04 m3/m2 and 0.03 m3/m2 of melted ground ice at Wudaoliang and Tanggula by 2018, respectively, in the moving-mesh model. The extra melted ground ice in the moving-mesh model will reach 0.12 m3/m2 at Wudaoliang and 0.05 m3/m2 at Tanggula by 2100 under the SSP1-2.6 scenario, and reach 0.57 m3/m2 at Wudaoliang and 0.32 m3/m2 at Tanggula by 2100 under the SSP5-8.5 scenario. Therefore, the heat consumed by ground ice melting may also be underestimated in permafrost simulations without ground subsidence considerations. We performed quantitative calculations of the bias of the heat consumption for permafrost changes resulting from ground subsidence (Figure 8). The effect that error accumulation has on the calculation of heat consumption is clear even under the SSP1-2.6 scenario. The heat consumed by permafrost changes in the moving-mesh model is much larger than that in the fixed-mesh model under the SSP5-8.5 scenario. The calculated difference in heat consumption is 15.94 MJ/m2 at Wudaoliang and 11.64 MJ/m2 at Tanggula by 2018. It is 38.60 MJ/m2 at Wudaoliang and 19.43 MJ/m2 at Tanggula by 2100 under the SSP1-2.6 scenario. It is 190.23 MJ/m2 at Wudaoliang and 106.94 MJ/m2 at Tanggula by 2100 under the SSP5-8.5 scenario.

4. Discussion

The QTP is considered to be an amplifier and driver of global climatic changes [38]. The permafrost on the QTP is extremely vulnerable to climate change due to the rich ground ice and warm permafrost temperature [4,5]. These research results confirm that if ground subsidence is not considered, the permafrost table depth may be larger but the original thickness of permafrost that has thawed may be smaller in permafrost simulations because of miscalculations regarding the distance between the ground surface and permafrost layer. This can lead to errors when calculating the heat consumed during permafrost changes, which will influence the global energy budget. It is difficult to estimate the effect of ground subsidence in permafrost regions accurately using the approach of simulation with field calibration because the final determination of its characteristics under climate warming still requires decades of observation [22]. Although the calculation error of the heat consumed by permafrost changes is accumulating, the accuracy of ground temperature simulations is insignificantly improved by incorporating the ground subsidence process into permafrost simulation because of the minimal ground subsidence at the study sites. We have no better methods to further confirm the improvement in simulation accuracy. The effect that settlement has on permafrost simulation may be significant under a strong warming scenario.
The relationship among the amount of ground subsidence, ice content and warming rate is complex and nonlinear. There is massive ground ice at Wudaoliang, and the mean volume of the ice contained within the permafrost at Wudaoliang is larger than that at Tanggula. The total ground subsidence at Wudaoliang is smaller than that at Tanggula during 1966 to 2018. This is because the historic GST rise rate at Wudaoliang (0.02 °C·a−1) is smaller than that at Tanggula (0.03 °C·a−1), while the total ground subsidence at Wudaoliang is slightly smaller than that at Tanggula in 2100 under the SSP1-2.6 and SSP5-8.5 scenarios. There is a larger thawing settlement coefficient, which leads to more proportions of space from the thawing permafrost converting to ground subsidence, at Wudaoliang, although rich ground ice has slowed down the deepening rate of the active layer. However, the errors when calculating the heat consumed by permafrost changes at Wudaoliang are always larger than at Tanggula.
The degradation characteristics of permafrost can be divided into two obvious stages: low-temperature stage and zero geothermal gradient stage [28]. In the low-temperature stage, the content of unfrozen water in the permafrost layers is extremely small. Phase change rarely occurs during warming, and there is a magnitude difference between the latent heat of phase change and the sensible heat of soil layer warming. Therefore, the warming rate of the soil layers is fast but the ground subsidence is minimal. In the zero-gradient stage, the entire permafrost layer approaches the phase change temperature, and the unfrozen water content increases. Most of the heat entering the soil layer is used for the phase change. The warming rate of the soil layers slows down or even stops but ground subsidence is severe. The differences in the simulation results concerning the permafrost change trajectories (ALT and permafrost thickness) and heat consumption caused by ground subsidence increase with time, but the difference in the ground temperature simulation is dependent on the permafrost degradation stages. The turning point at which the depth of MAE = 0.01 °C changes from the initial downward direction to an upward trend occurs in 2030 at Tanggula. As Figure 6g–l show, the process of permafrost degradation will reach the zero-gradient stage in this time at Tanggula. Most permafrost layers are within the small phase transition temperature range in the zero-gradient stage; thus, the difference in the temperature simulation between the two models sharply decreases. The depth of MAE = 0.01 °C continues to exhibit a downward trend over time once more after the zero-gradient stage. Compared with Tanggula, the maximum depth of MAE = 0.01 °C is smaller at Wudaoliang. There is no a turning point in the trend of the depth of MAE = 0.01 °C from downward to upward over time at Wudaoliang. This indicates that the permafrost degradation does not fully reach the zero-gradient stage at Wudaoliang in 2100, even under a strong warming scenario. The reason for this may be that rich ground ice can act as a natural low-pass buffer to the upper signal, causing the response of the simulated ground temperature in deep layers to attenuate. Therefore, the temperature in the deep soil layers is less influenced by ground subsidence. The simulation error within some permafrost characteristic parameters dependent on the deep permafrost temperature field, such as the permafrost base, depth of zero annual amplitude of ground temperature (ZAA) and mean annual ground temperature (MAGT), may be not significant in the fixed-mesh permafrost model without ground subsidence consideration.
There remain some limitations of this study. Firstly, the underlying model simplifies the hydrological–thermal processes occurring in the active layer by neglecting soil moisture dynamics and by assuming a fixed soil thermal conductivity. While these model deficiencies can be mitigated when field observations are available through parameter calibration, it poses significant challenges when applied to future prediction without available field observations. Secondly, ground subsidence is estimated as the product of the difference in permafrost thickness before and after thawing and a coefficient. Again, with the availability of observed ground deformation, the coefficient can be calibrated, but it may raise questions about its constancy in a future climate warming scenario. Therefore, developing a widely applicable parameterized scheme for dynamic soil thermal conductivity and a dynamic thawing subsidence coefficient based on large amounts of measured data are expected to improve the modeling in the next study.

5. Conclusions

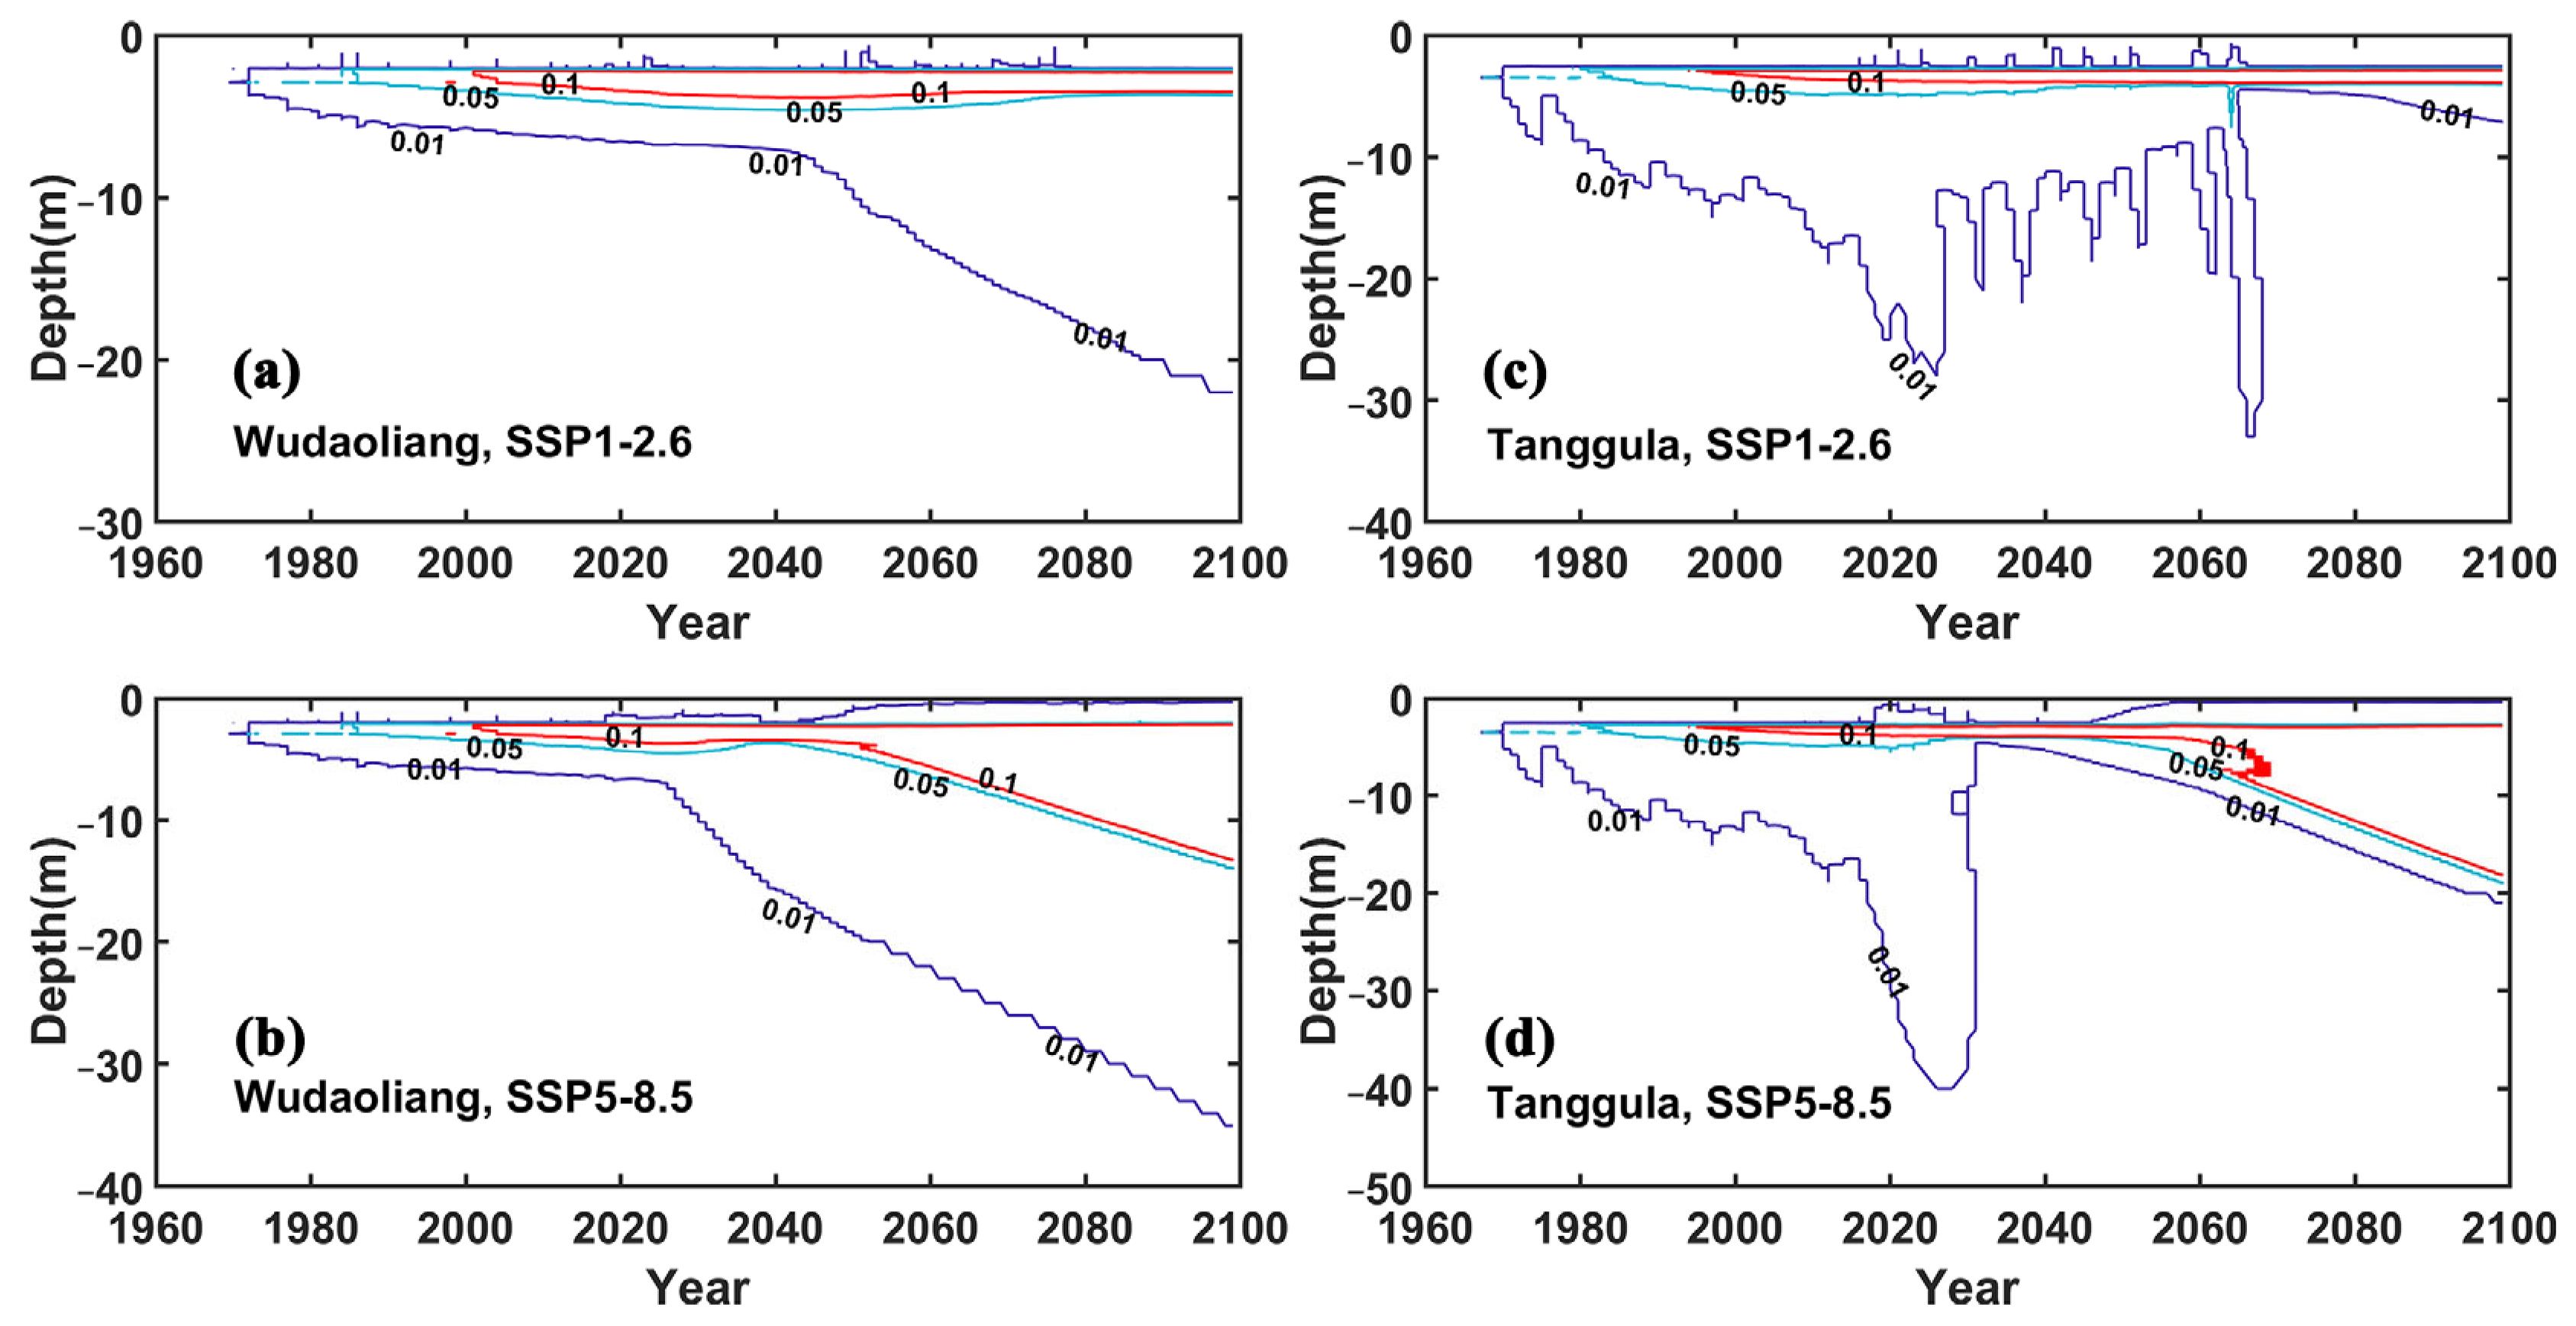
  • Wudaoliang and Tanggula are in the continuous permafrost zone of the QTP. The underlying permafrost is presently in the low-temperature stage there. This is associated with minimal ground subsidence. Therefore, the improvement of the simulation performance is relatively small in the moving-mesh model considering ground subsidence during the observation period. Projections indicate that the permafrost at the two study sites will be close to the zero-gradient stage in 2030–2040 under the SSP5-8.5 scenario. By that stage, there may be a high risk of ground surface settlement and the effects of ground subsidence on permafrost simulation may be significant.
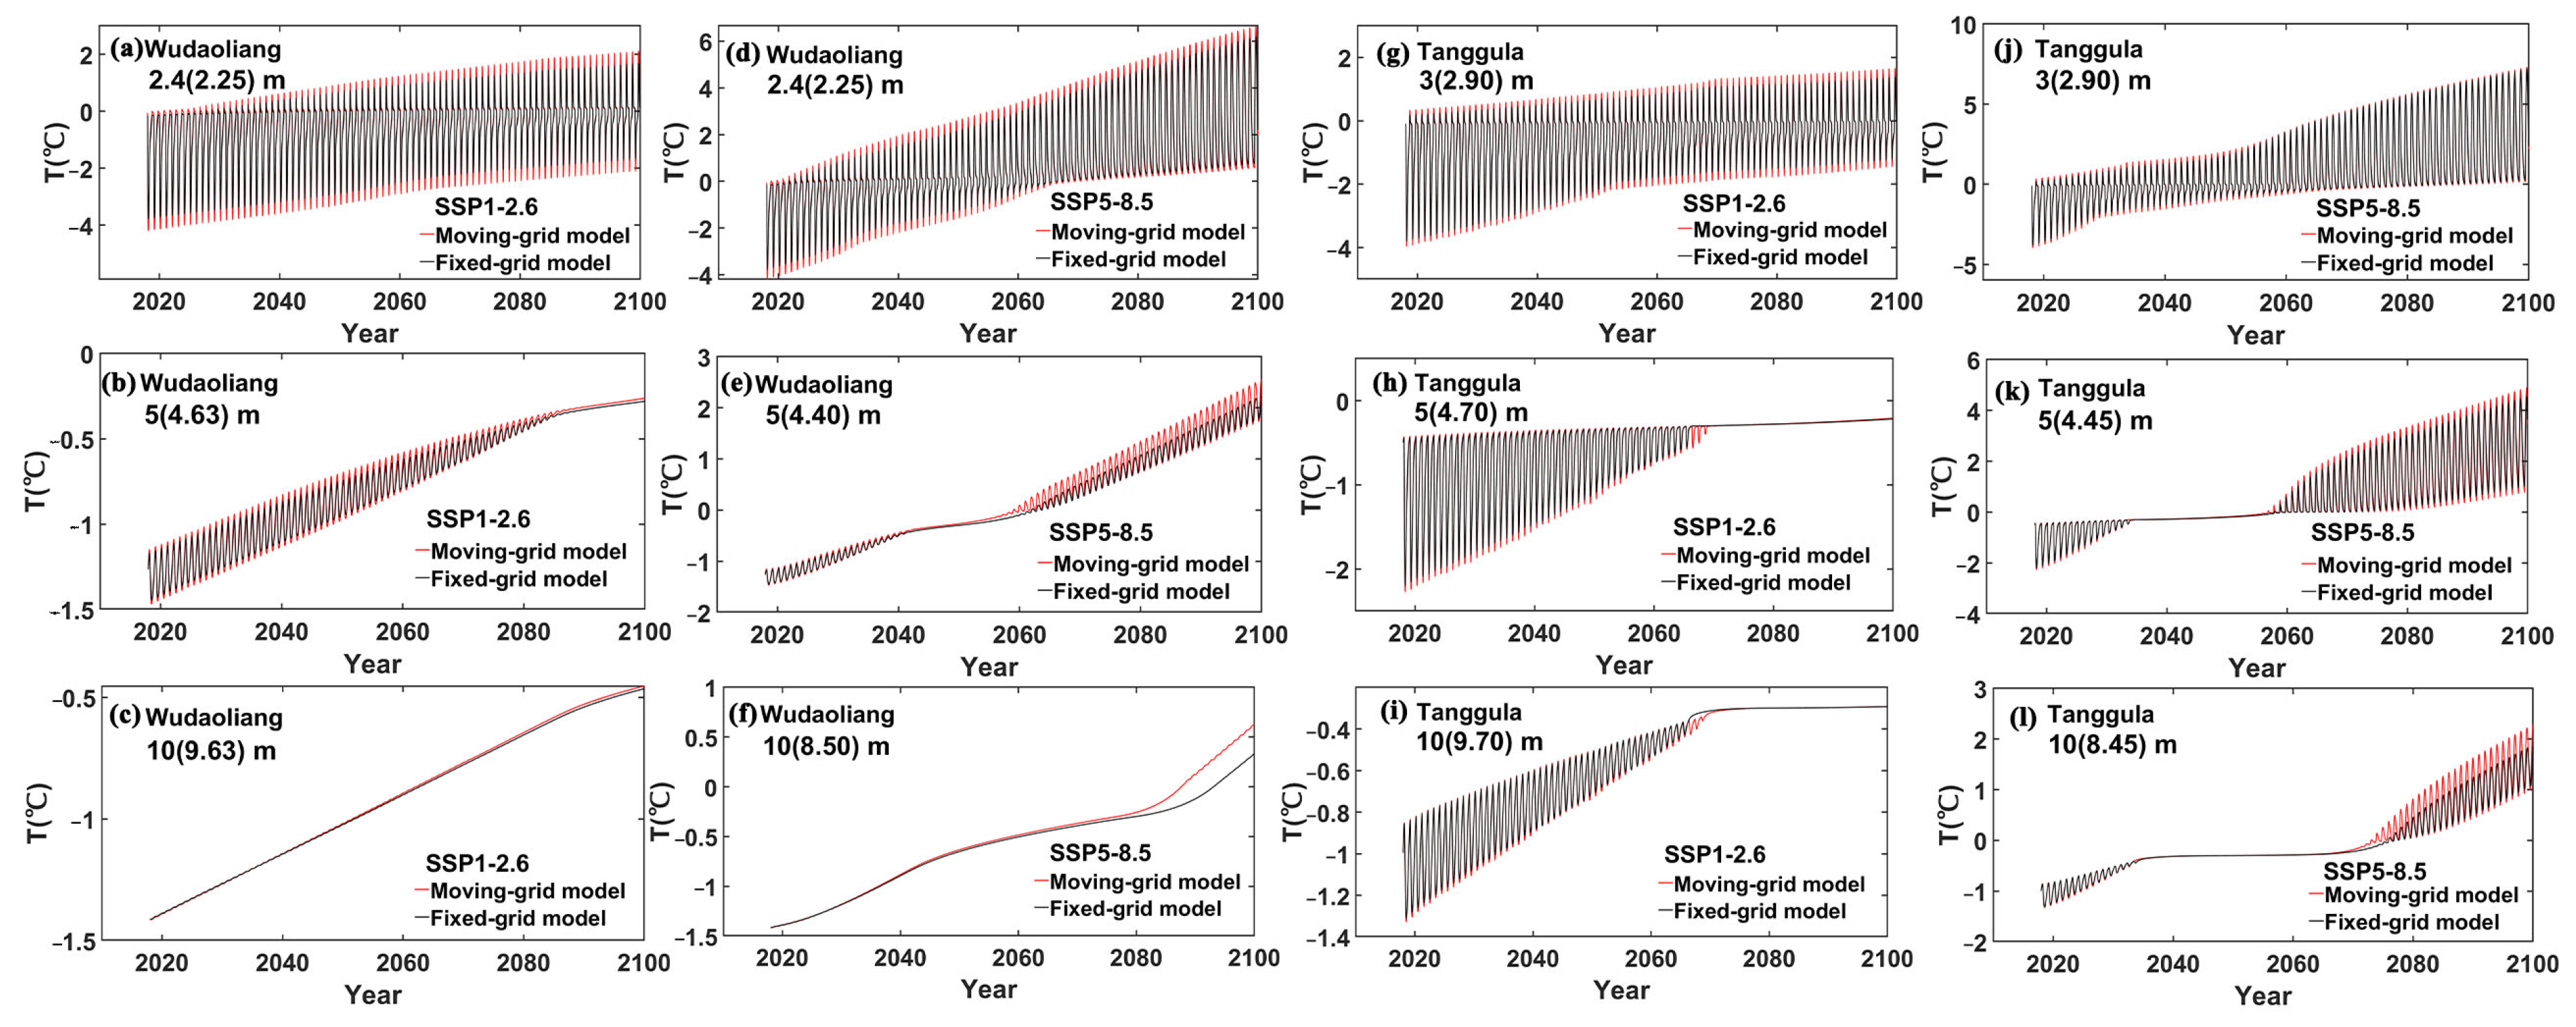
  • Ground subsidence plays a role in the trajectory of the permafrost change, ground temperature field and heat consumption in a permafrost simulation. Permafrost simulation without ground subsidence consideration tends to achieve a larger active layer thickness and to underestimate the permafrost thawing and the heat consumption. These effects increase with time, while the differences in the ground temperature field simulation caused by ground subsidence are dependent on the permafrost degradation stages.
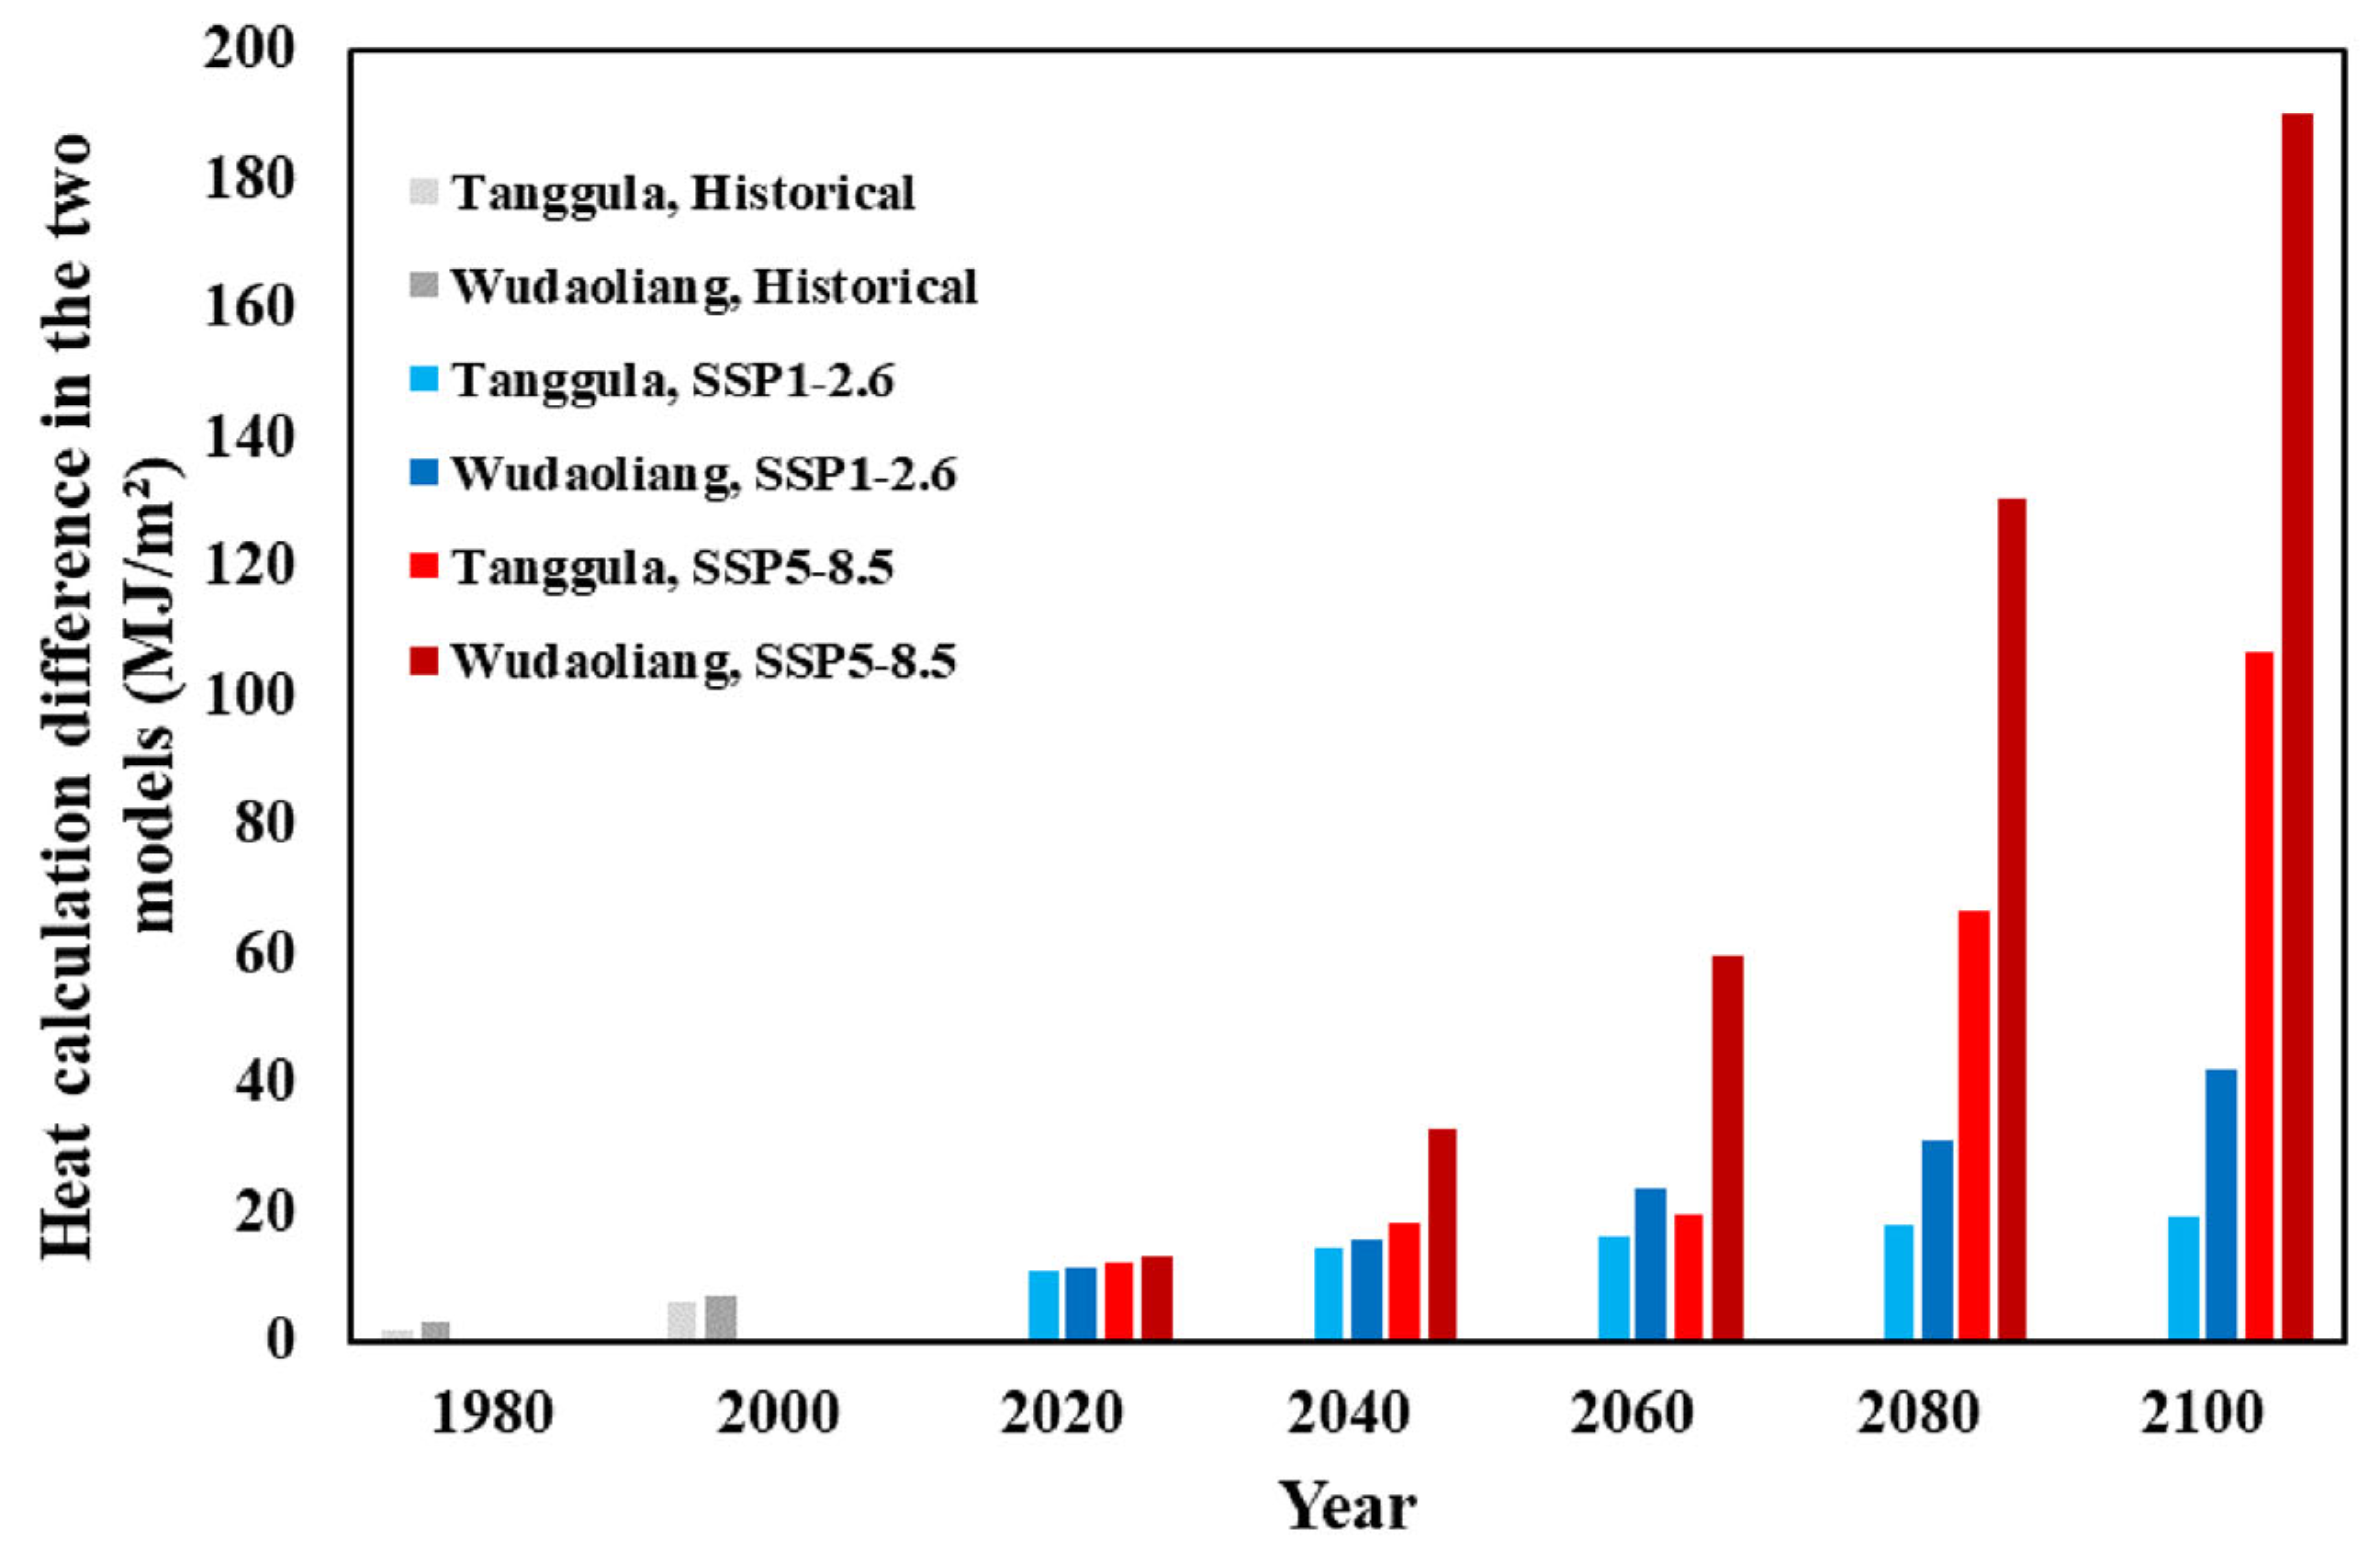
  • Permafrost regions with rich ground ice may not necessarily have a larger error in the simulated ground temperature field but will generate a larger heat calculation error in permafrost simulations that do not consider ground subsidence during a warming climate. In other words, ignoring ground subsidence may lead to a large quantity of heat in the energy budget being allocated to other climate system components rather than being consumed in ice-rich permafrost thaw, although the error within the simulated characteristic parameter related to deep permafrost layers, such as the permafrost base, ZAA and MAGT, may be not significant. Therefore, permafrost projections for the QTP where the permafrost regions are characteristic of ice-rich and high ground temperature regions should consider the ground subsidence process.

Author Contributions

Conceptualization, Z.S. and L.Z.; methodology, Z.S.; software, Z.S; validation, G.H. and D.Z.; formal analysis, C.X.; investigation, H.Z., S.L., Y.Q. and E.D.; resources, G.H., Y.Q. and D.Z.; data curation, H.Z. and S.L.; writing—original draft preparation, Z.S.; writing—review and editing, Z.S., L.Z. and C.X; project administration, L.Z; funding acquisition, Z.S. and L.Z. All authors have read and agreed to the published version of the manuscript.

Funding

This research was funded by the China Postdoctoral Science Foundation funded project (2022M721670), the Guangxi Science and Technology Plan Project (Guike AD23026075), the Second Tibetan Plateau Scientific Expedition and Research (STEP) program (grant no. 2019QZKK0201) and the National Natural Science Foundation of China (41931180).

Institutional Review Board Statement

Not applicable.

Informed Consent Statement

Not applicable.

Data Availability Statement

The simulation code is accessed from Zenodo (https://doi.org/10.5281/zenodo.6403886, accessed on 1~September 2023). Observation data concerning permafrost are available from the National Tibetan Plateau/Third Pole Environment Data Center (https://data.tpdc.ac.cn/en/disallow/789e838e-16ac-4539-bb7e-906217305a1d/, accessed on 1 October 2023). The historical ground surface temperature series can be downloaded from (https://www.resdc.cn/DOI/doi.aspx?DOIid=39, accessed on 1 October 2023).

Conflicts of Interest

The authors declare no conflict of interest.

References

  1. Wang, W.; Rinke, A.; Moore, J.C.; Cui, X.; Ji, D.; Li, Q.; Zhang, N.; Wang, C.; Zhang, S.; Lawrence, D.M. Diagnostic and model dependent uncertainty of simulated Tibetan permafrost area. Cryosphere 2016, 10, 287–306. [Google Scholar] [CrossRef]
  2. Riseborough, D.; Shiklomanov, N.; Etzelmüller, B.; Gruber, S.; Marchenko, S. Recent advances in permafrost modelling. Permafr. Periglac. Process. 2008, 19, 137–156. [Google Scholar] [CrossRef]
  3. Qin, D.; Yao, T.; Ding, Y.; Ren, J. Glossary of Cryospheric Science; China Meeorological Press: Beijing, China, 2016. [Google Scholar]
  4. Zhang, Z.; Wu, Q. Thermal hazards zonation and permafrost change over the Qinghai–Tibet Plateau. Nat. Hazards 2012, 61, 403–423. [Google Scholar] [CrossRef]
  5. Jin, H.; Wei, Z.; Wang, S.; Yu, Q.; Lü, L.; Wu, Q.; Ji, Y. Assessment of frozen-ground conditions for engineering geology along the Qinghai-Tibet highway and railway, China. Eng. Geol. 2008, 101, 96–109. [Google Scholar] [CrossRef]
  6. Wang, C.; Wang, Z.; Kong, Y.; Zhang, F.; Yang, K.; Zhang, T. Most of the Northern Hemisphere permafrost remains under climate change. Sci. Rep. 2019, 9, 3295. [Google Scholar] [CrossRef] [PubMed]
  7. Biskaborn, B.K.; Smith, S.L.; Noetzli, J.; Matthes, H.; Vieira, G.; Streletskiy, D.A.; Schoeneich, P.; Romanovsky, V.E. Permafrost is warming at a global scale. Nat. Commun. 2019, 10, 264. [Google Scholar] [CrossRef] [PubMed]
  8. Luo, D.; Wu, Q.; Jin, H.; Marchenko, S.S.; Lü, L.; Gao, S. Recent changes in the active layer thickness across the northern hemisphere. Environ. Earth Sci. 2016, 75, 555. [Google Scholar] [CrossRef]
  9. Droppo, I.G.; Cenzo, P.D.; Mcfadyen, R.; Reid, T. Assessment of the sediment and associated nutrient/contaminant continuum, from permafrost thaw slump scars to tundra lakes in the western Canadian Arctic. Permafr. Periglac. Process. 2022, 33, 32–45. [Google Scholar] [CrossRef]
  10. Mu, C.; Shang, J.; Zhang, T.; Fan, C.; Jia, L. Acceleration of thaw slump during 1997–2017 in the Qilian Mountains of the northern Qinghai-Tibetan plateau. Landslides 2020, 17, 1051–1062. [Google Scholar] [CrossRef]
  11. Luo, J.; Niu, F.; Lin, Z.; Liu, M.; Yin, G. Recent acceleration of thaw slumping in permafrost terrain of Qinghai-Tibet Plateau: An example from the Beiluhe Region. Geomorphology 2019, 341, 79–85. [Google Scholar] [CrossRef]
  12. Jin, H.; Wu, Q.; Romanovsky, V.E. Degrading permafrost and its impacts. Adv. Clim. Chang. Res. 2021, 12, 1–5. [Google Scholar] [CrossRef]
  13. Abbott, B.W.; Jones, J.B. Permafrost collapse alters soil carbon stocks, respiration, CH4, and N2O in upland tundra. Glob. Chang. Biol. 2015, 21, 4570–4587. [Google Scholar] [CrossRef] [PubMed]
  14. Wu, X.; Lin, Z.; Liu, G.; Xu, H.; Zhang, X.; Ding, Y. Effects of permafrost thaw-subsidence on soil bacterial communities in the southern Qinghai-Tibetan Plateau. Appl. Soil Ecol. 2018, 128, 81–88. [Google Scholar] [CrossRef]
  15. Abolt, C.J.; Young, M.H.; Atchley, A.L.; Harp, D.R.; Coon, E.T. Feedbacks between surface deformation and permafrost degradation in ice wedge polygons, Arctic Coastal Plain, Alaska. J. Geophys. Res. Earth Surf. 2020, 125, e2019JF005349. [Google Scholar] [CrossRef]
  16. Cai, L.; Lee, H.; Aas, K.S.; Westermann, S. Projecting circum-Arctic excess-ground-ice melt with a sub-grid representation in the Community Land Model. Cryosphere 2020, 14, 4611–4626. [Google Scholar] [CrossRef]
  17. Westermann, S.; Langer, M.; Boike, J.; Heikenfeld, M.; Peter, M.; Etzelmüller, B.; Krinner, G. Simulating the thermal regime and thaw processes of ice-rich permafrost ground with the land-surface model CryoGrid 3. Geosci. Model Dev. 2016, 9, 523–546. [Google Scholar] [CrossRef]
  18. Lee, H.; Swenson, S.C.; Slater, A.G.; Lawrence, D.M. Effects of excess ground ice on projections of permafrost in a warming climate. Environ. Res. Lett. 2014, 9, 1748–9326. [Google Scholar] [CrossRef]
  19. Painter, S.L.; Coon, E.T.; Khattak, A.J.; Jastrow, J.D. Drying of tundra landscapes will limit subsidence-induced acceleration of permafrost thaw. Proc. Natl. Acad. Sci. USA 2023, 120, e2212171120. [Google Scholar] [CrossRef]
  20. Buteau, S.; Fortier, R.; Delisle, G.; Allard, M. Numerical simulation of the impacts of climate warming on a permafrost mound. Permafr. Periglac. Process. 2004, 15, 41–57. [Google Scholar] [CrossRef]
  21. Nitzbon, J.; Westermann, S.; Langer, M.; Martin, L.C.P.; Strauss, J.; Laboor, S.; Boike, J. Fast response of cold ice-rich permafrost in northeast Siberia to a warming climate. Nat. Commun. 2020, 11, 2201. [Google Scholar] [CrossRef]
  22. Wagner, A.M.; Lindsey, N.J.; Shan, D.; Arthur, G.; Stephanie, S.; Christopher, W.; Ian, E.; Craig, U.; Sharon, B.; Alejandro, M. Permafrost degradation and subsidence observations during a controlled warming experiment. Sci. Rep. 2018, 8, 10908. [Google Scholar] [CrossRef] [PubMed]
  23. Liu, S.; Zhao, L.; Wang, L.; Zhou, H.; Zou, D.; Sun, Z.; Changwei, X.; Qiao, Y. Intra-annual ground surface deformation detected by site observation, simulation and InSAR monitoring in permafrost site of Xidatan, Qinghai-Tibet Plateau. Geophys. Res. Lett. 2022, 49, e2021GL095029. [Google Scholar] [CrossRef]
  24. Lawrence, D.M.; Slater, A.G. A projection of severe near-surface permafrost degradation during the 21st century. Geophys. Res. Lett. 2005, 32, L24401. [Google Scholar] [CrossRef]
  25. Smith, S.L.; O’Neill, H.B.; Isaksen, K.; Noetzli, J.; Romanovsky, V.E. The changing thermal state of permafrost. Nat. Rev. Earth Environ. 2022, 3, 10–23. [Google Scholar] [CrossRef]
  26. Stevens, M.B.; Smerdon, J.E.; González-Rouco, J.F.; Stieglitz, M.; Beltrami, H. Effects of bottom boundary placement on subsurface heat storage: Implications for climate model simulations. Geophys. Res. Lett. 2007, 34, 170–206. [Google Scholar] [CrossRef]
  27. Sun, Z.; Zhao, L.; Hu, G.; Qiao, Y.; Zhou, H.; Liu, S.; Du, E.; Zou, D.; Xie, C. Numerical simulation of thaw settlement and permafrost changes at three sites along the Qinghai-Tibet Engineering Corridor in a warming climate. Geophys. Res. Lett. 2022, 49, e2021GL097334. [Google Scholar] [CrossRef]
  28. Wu, J.C.; Yu, S.; Wu, Q.B.; Zhi, W. Processes and modes of permafrost degradation on the Qinghai-Tibet Plateau. Sci. China Earth Sci. 2010, 53, 150–158. [Google Scholar] [CrossRef]
  29. Jin, H.; Lin, Z.; Wang, S.; Rui, J. Thermal regimes and degradation modes of permafrost along the Qinghai-Tibet Highway. Sci. China 2006, 49, 1170–1183. [Google Scholar] [CrossRef]
  30. Zhao, L.; Zou, D.; Hu, G.; Wu, T.; Du, E.; Liu, G.; Xiao, Y.; Li, R.; Pang, Q.; Qiao, Y.; et al. A synthesis dataset of permafrost thermal state for the Qinghai-Xizang (Tibet) Plateau, China. Earth Syst. Sci. Data 2021, 13, 4207–4218. [Google Scholar] [CrossRef]
  31. Yershov, E.D. Principles of Gocryology; Lanzhou University Press: Lanzhou, China, 2015. [Google Scholar]
  32. Pullman, E.R.; Jorgenson, M.T.; Shur, Y. Thaw settlement in soils of the Arctic Coastal Plain, Alaska. Arctic Antarct. Alp. Res. 2007, 39, 468–476. [Google Scholar] [CrossRef]
  33. GB 50007-2011; Code for Design of Soil and Foundation of Building in Frozen Soil Region. China Architecture and Building Press: Beijing, China, 2011.
  34. GB 50324-2014; Code for Engineering Geological Investigation of Frozen Ground. China Planning Press: Beijing, China, 2014.
  35. IPCC. Special Report on the Ocean and Cryosphere in a Changing Climate. Available online: https://archiveipccch/srocc/ (accessed on 29 November 2022).
  36. Iturbide, M.; Gutiérrez, J.M.; Alves, L.M.; Bedia, J.; Cerezo-Mota, R.; Cimadevilla, E.; Cofiño, A.S.; Di Luca, A.; Faria, S.H.; Gorodetskaya, I.V. An update of IPCC climate reference regions for subcontinental analysis of climate model data: Definition and aggregated datasets. Earth Syst. Sci. Data 2020, 12, 2959–2970. [Google Scholar] [CrossRef]
  37. Nash, J.E.; Sutcliffe, J.V. River flow forecasting through conceptual models part I—A discussion of principles. J. Hydrol. 1970, 10, 282–290. [Google Scholar] [CrossRef]
  38. Li, X.; Cheng, G.; Jin, H.; Kang, E.; Che, T.; Jin, R.; Wu, L.; Nan, Z.; Wang, J.; Shen, Y. Cryospheric change in China. Glob. Planet. Chang. 2008, 62, 210–218. [Google Scholar] [CrossRef]
Figure 1. Locations and photographs of the study sites.
Atmosphere 15 00012 g001
Figure 2. Stratum conditions, ground ice contents and the annual average temperature–depth curves in 2015 at (a) Wudaoliang and (b) Tanggula.
Atmosphere 15 00012 g002
Figure 3. Illustration of (a) the moving-mesh permafrost model with ground subsidence consideration, and (b) the fixed-mesh permafrost model without ground subsidence consideration.
Atmosphere 15 00012 g003
Figure 4. The simulation results concerning the ground subsidence and permafrost change trajectories at (a,b) Wudaoliang and (c,d) Tanggula under the SSP1-2.6 and SSP5-8.5 scenarios.
Atmosphere 15 00012 g004
Figure 5. Comparison of the simulated ground temperatures from the moving-grid model with the observations in the representative soil layers at the three study sites. The depths of the spatial grids to the ground surface are changed with time because of thaw settlement consideration in the moving-grid model. The value to the left of the bracket at the top left corner of each of the subgraphs is the initial depth of the corresponding spatial grid in 1966, while the value in the bracket is the final depth of the corresponding spatial grid in 2018 in the moving-grid model.
Atmosphere 15 00012 g005
Figure 6. Differences in the predicted temperatures from the two model during 2018 to 2100 (ac) at Wudaoliang under the SSP1-2.6 scenario, (df) at Wudaoliang under the SSP5-8.5 scenario, (gi) at Tanggula under the SSP1-2.6 scenario, and (jl) at Tanggula under the SSP5-8.5 scenario. In the subgraphs, the figures outside and inside the top left parentheses denote the spatial node depths in the initial condition and after ground subsidence in 2100, respectively.
Atmosphere 15 00012 g006
Figure 7. The depth–time diagram of the MAE for the ground temperature field simulation from the fixed-mesh model relative to the reference values from the moving-mesh model: (a) Wudaoliang, SSP1-2.6 scenario; (b) Wudaoliang, SSP5-8.5 scenario; (c) Tanggula, SSP1-2.6 scenario; and (d) Tanggula, SSP5-8.5 scenario.
Atmosphere 15 00012 g007
Figure 8. Calculation difference in the heat consumption for permafrost changes between the moving- and fixed-mesh model.
Atmosphere 15 00012 g008
Table 1. Value range of the soil thermal and subsidence parameters for the simulation. Here, λ is the soil thermal conductivity; c is the soil volumetric heat capacity; A is the soil texture parameter used to calculate the thawing settlement coefficient; and  θ 0  is the critical volumetric ice content for ground subsidence.
Soil Textureλ
(w/(m·°C)
c
(103 kJ/(m³·°C))
A θ 0
(%)
Sandy loam0.72~2.161.7~3.50.718
Sand0.92~2.41.6~3.10.614
Sand with grave1.33~3.31.7~3.20.614
Gravel soil1.1~3.11.8~3.20.511
Sedimentary-cemented rock0.1~6.50.33~2.30.610
Ice-layer with soil0.73~2.151~41.130
Disclaimer/Publisher’s Note: The statements, opinions and data contained in all publications are solely those of the individual author(s) and contributor(s) and not of MDPI and/or the editor(s). MDPI and/or the editor(s) disclaim responsibility for any injury to people or property resulting from any ideas, methods, instructions or products referred to in the content.

