Abstract
The air pollution situation in the German city of Stuttgart is very important, as high pollutant concentrations are measured here compared to other German cities. This is mainly due to Stuttgart’s geographical location as it is in a basin covered by hills on three sides. This leads to reduced wind speeds that inhibit pollutant dispersion. One of the main contributors to the pollutant concentrations in Stuttgart is local traffic. To improve the air quality in Stuttgart, a diesel traffic ban was introduced on 1 January 2019, and is ongoing. In this study, the urban climate model PALM-4U was applied to obtain the pollutant distribution along the federal highways B14 and B27 of Stuttgart to evaluate the impact of the diesel traffic ban on air quality. The simulations were carried out in two areas of the city, namely the city center and Kaltental Valley, with domain sizes of 3.2 km × 2 km and 3.2 km × 1.6 km, respectively, and with a grid size of 10 m for each domain. The influence of traffic emissions on the air quality of Stuttgart was studied for a typical summer day. The results showed that air pollutant concentrations were highest near federal highways B14 and B27 (e.g., NO2 concentration peaks of around 200 µg/m3). Also, a significant reduction of around four times in air pollutant concentrations was observed in the study area after the diesel traffic ban was introduced.
1. Introduction
Over the last decades, urbanization has played a significant role in modifying the surface and the properties of the urban boundary layer. Due to the movement of inhabitants from rural areas to urban agglomerations, the world’s population in cities has increased swiftly [1]. Therefore, the population in cities is expected to increase significantly in the near future [2]. In addition, urbanization has increased environmental problems such as higher amounts of air pollution [3,4]. Air pollution is one of the main environmental problems worldwide, mostly caused by anthropogenic activities. A pollutant is any substance present in the air that can have harmful effects on human health or the environment as a whole [5]. The most common primary sources affecting the air quality in urban areas are combustion processes of industrial activities of the energy sector, residential areas, and the transport sector [6]. In Europe, transport (which can be divided into road and non-road traffic) is the major source of air pollution. Although some cars are more environmentally friendly today, traffic-related pollutant emissions are still an important concern. The main pollutants emitted by this sector are particulate matter (PM), nitrogen oxides (NOX), unburnt hydro-carbons (UBHCs), and carbon monoxide (CO), which are regulated within the EU [7].
Consequently, these emissions cause harmful effects to the environment, due to their contribution to climate change, and also produce health risks, causing respiratory and cardiovascular diseases, nervous system dysfunction, and cancer [7]. For this reason, during recent years, European countries have acted to reduce transport-related emissions [8]. The application of diverse legal mechanisms has contributed to reducing pollutants, with the implementation of target values for pollutant concentrations and the main emissions [9].
Numerical modelling is an approach that is consistently being used to address environmental problems and provide assistance in meteorological studies. Urban climate modelling (UCM) can simulate the urban climate in mesoscale and micro-scale, and provide detailed 3D fields as well. Therefore, it has become a beneficial tool to evaluate and estimate the effects of the city morphology on air quality and the effects of climate change in an area. Furthermore, it is suitable for conducting sensitivity analysis to examine the fundamental mechanism of weather and climate change [4,10]. For instance, computational fluid dynamics (CFD) is a field that studies different types of flows and their behaviors by developing numerical simulations. To represent the flow, physical characteristics should be known, such as wind velocity, atmospheric pressure, and air temperature, as well as the appropriate boundary conditions [11]. Another study was performed to check the reliability of the numerical model results, focusing on the estimation of average annual NO2 concentration near heavy traffic streets in the city of Kaunas in Lithuania. The modelled results have obtained a plausible correlation of 75% with the observed concentration in summer and winter [12].
Regarding the meteorological data, a study by De Ridder et al. has proven that, by using the UrbClim urban climate model, in a medium-sized city, the simulated air temperature during the whole month was well correlated with the observed air temperature, with plausible accuracy, even though some discrepancies appeared during some nights and afternoons [13]. Overall, it can be seen that the model obtains the timing of the diurnal peaks fairly well, although it underestimates the magnitude of air temperature on different days during the simulation.
The Parallelized Large-Eddy Simulation Model (PALM) is a meteorological model for atmospheric and oceanic boundary layer flows. It is a Fortran-based code, the first version of which was released in 1997, and it has been subsequently developed and improved to produce the current version (PALM 6.0) [14]. PALM is mainly considered a Large-Eddy Simulation (LES) model, but with recent improvements it can also resolve turbulence in the RANS model. Besides the atmospheric and boundary layers, it includes new complements in the separate model, PALM-4U, which also includes boundary layers for urban applications [13]. Recently, the PALM-4U model has been implemented for the estimation of weighted mean radiant temperature as well as human thermal comfort or stress [15]. The PALM-4U model has also been applied to study the complex interactions between the turbulent flow field and aerosol dynamic processes, by implementing the aerosol model component [16]. Figure 1 presents an illustrative representation of the constituent elements comprising PALM-4U. This study incorporates various models, including those about urban surface characteristics, chemical processes, and radiation interactions. Additionally, a land surface model encompassing vegetation and soil dynamics is employed. In the context of boundary conditions, PALM is fundamentally rooted in the non-hydrostatic, filtered Navier–Stokes equations in either the Boussinesq approximated or anelastic formulation. By default, the model assumes a planar bottom boundary and postulates a constant flux layer at the interface between the surface and the initial atmospheric grid level. Horizontal boundary conditions are conventionally configured as cyclic; nevertheless, PALM also accommodates non-cyclic boundary conditions. Furthermore, PALM offers a Cartesian topography model, where intricate terrain features and structures, such as buildings, are embodied as solid obstacles within the code [14,17].
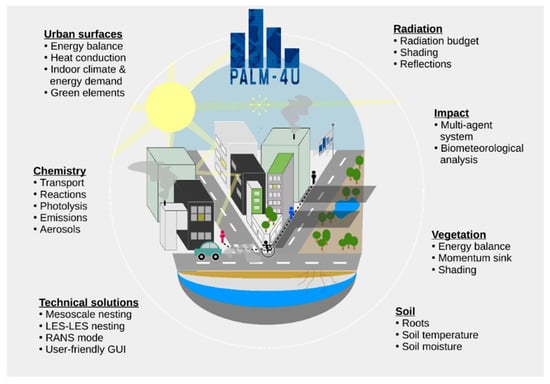
Figure 1.
An illustrative representation of the constituent elements comprising PALM-4U [18].
An illustration of the utilization of a numerical model, specifically the Weather Research and Forecasting (WRF) model, is exemplified to investigate mitigation strategies aimed at mitigating heat stress and its anticipated implications for human health in the urban area of Stuttgart. The work, done by Fallmann et al., has revealed that altering the reflective properties of surfaces exerts the most significant influence on near-surface temperatures, in comparison to augmenting urban green spaces or diminishing building density. Furthermore, the study confirms that Stuttgart experiences pronounced heat stress, primarily attributed to its topographical disposition and the region’s generally elevated temperatures [19]. In a complementary investigation, the WRF model was employed within the Stuttgart metropolitan region to assess the concentration and spatial dispersion of airborne pollutants during the winter season. The simulated data for particulate matter with a diameter of less than 10 µm and nitrogen dioxide enable a lucid identification of areas with heightened pollutant levels, surpassing the irregularly scattered monitoring stations [20]. Moreover, the study extended to the evaluation of model-simulated meteorological, air chemistry, and wall surface variables against in situ measurements taken in the vicinity of Prague, specifically in Degvice, Czech Republic. The PALM 6.0 model was employed over multiple days during both the summer and winter seasons. The results of the simulations demonstrated a consistent correspondence with observations, except for instances where LES inadequately represented nocturnal cooling near the surface under specific meteorological conditions. In certain situations, the modelling predicted reduced turbulent mixing, leading to elevated near-surface pollutant concentrations. At the majority of the surface evaluation points, the modelled wall surface temperature closely approximated the observed temperature, both in terms of absolute values and daily fluctuations. However, especially during wintery episodes and for contemporary buildings with multi-layered walls, the heat transfer through the walls was inadequately captured, resulting in disparities between the modelled and observed wall surface temperatures. Additionally, the study emphasized the critical influence of input data accuracy on model outcomes [21].
Stuttgart, the capital of Baden–Württemberg, is located in the center of the federal state in a valley basin mostly surrounded by hills. Due to its complex topographic conditions and the presence of industrial and commercial areas, the Stuttgart metropolitan area is one of the most polluted areas in Germany [22]. The region of the Neckar Valley is well known for relatively low wind speeds and a high frequency of calm winds [23]. In addition to the wind conditions, the existence of temperature inversions in the lower layers of the atmosphere plays a main role in air exchange. Especially in winter, the vertical transport of pollutants in the atmosphere becomes more difficult, due to the occurrence of temperature inversions, and because of which the pollutant concentrations increase within or below the temperature inversion. Another factor related to high pollution levels in the city center is traffic density. Due to a lack of ring roads around the city, most of the traffic on the main highways passes through the city [24]. The main air pollutants emitted by cars are particulate matter and nitrogen oxides, with the latter being an important precursor for tropospheric ozone formation [25]. As a measure to reduce the traffic emissions in Stuttgart, a traffic ban for all diesel vehicles with emission standard Euro 4/IV and worse was introduced from 1 January 2019 (the blue area shown in Figure 2). Furthermore, the ban was extended to diesel vehicles with emission standard Euro 5/V from 1 July 2020 in the Stuttgart Valley basin and the districts of Bad Cannstatt, Feuerbach, and Zuffenhausen (the brown area shown in Figure 2) [23].
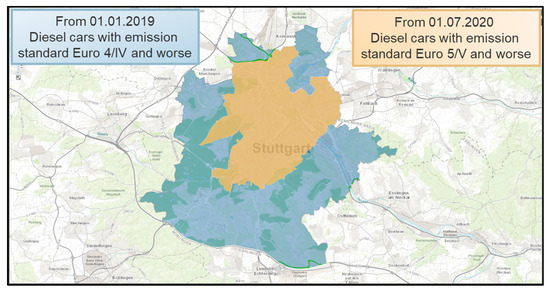
Figure 2.
A map showing implementation of the diesel ban in Stuttgart city [23].
In Stuttgart, air quality monitoring stations are installed at different locations in the city. However, these stations measure pollutant concentrations at a specific location, limiting the information about the spatial distribution of the measured parameters. Therefore, it is necessary to identify pollution hotspots in the city. The use of new technologies is required to obtain a better understanding of the behavior and distribution of pollutants around the city. Applying mobile measurements, e.g., a dense network of measurements with low-cost passive samplers or low-cost air quality sensors, offers the possibility of measuring the spatial distribution of air pollutants [26]. However, an alternative to measurements is dispersion modelling. In this context, the objectives of this study were to analyze different diesel traffic ban scenarios based on traffic conditions and their impact on the air quality situation of the city. Furthermore, we also aimed to compare the distribution of traffic-related pollutants along the main highways of the city and the areas with more vegetation, using the urban climate model PALM-4U.
2. Model Setup and Methodology
The urban climate model applied in this study was PALM-4U (revision 4857), which can simulate meteorological parameters such as air temperature, relative humidity, and wind components, as well as air pollutants, in urban areas on two and three-dimensional grids. This model is an open source and it was chosen for this study due to its ability to create simulations of horizontal domain sizes of up to 1000–2000 km2, and at the same time, its ability for building-resolving simulation at a grid spacing of less than or equal to 10 m; zoom functions to obtain 1 m spatial resolution are also possible. Apart from this, it provides an interface to read and use digital surface model data, an option for nesting or large-scale forcing to mesoscale numerical forecast models, and state-of-the-art multivariate data output interfaces (e.g., NetCDF) [17].
Although there are a few air quality monitoring stations in Stuttgart city, as well as emission mitigation plans, the distribution of traffic-related pollutants in the ambient air is barely understood. Therefore, the urban climate model was applied in this research to simulate the behavior of pollutants through the city center and the Kaltental Valley, a major source of cold air supply during favorable meteorological conditions. The study also aimed to identify the pollutant concentrations at hotspots and to validate the model by comparing its results with the observed data provided by monitoring stations. One of the selected areas for simulation was situated in the city center, as shown in Figure 3a, with a domain size of 3.2 km × 2 km. The other area was located in the southern part of Stuttgart city center, as shown in Figure 3b, with a specified domain size of 3.2 km × 1.6 km. The two domains were selected to compare the areas with high traffic, i.e., the main city domain, with an area with more vegetation, i.e., the Kaltental Valley domain.
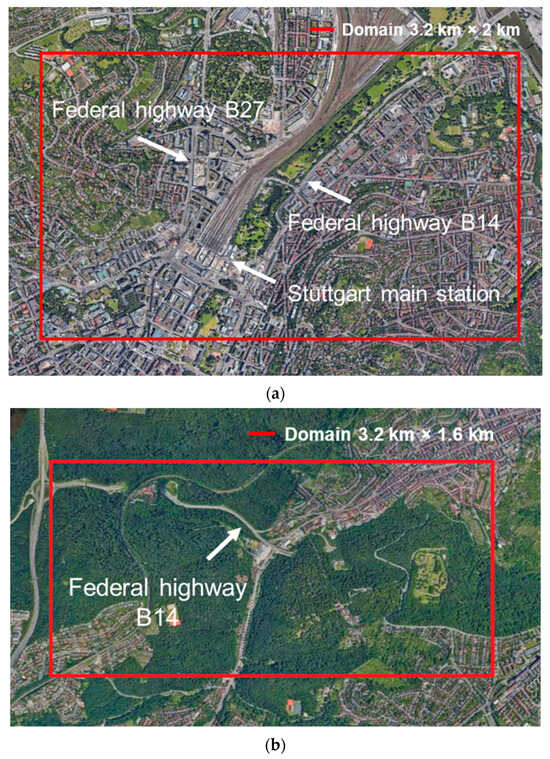
Figure 3.
(a) Domain of the study area at the city center, measuring 3.2 km × 2.0 km (Source: Google Earth). (b) Domain of the study area at Kaltental, measuring 3.2 km × 1.6 km (Source: Google Earth).
To run the model, a steering file with a set of input data in the form of drivers, such as static, dynamic, and emission drivers, must be generated; this will be discussed in upcoming sections.
2.1. Steering File
This file is written in Fortran-namelist form and includes detailed information about grid points, grid spacing, boundary conditions, chemistry parameters, and output parameters, as well as the simulation time under different namelist groups.
Firstly, the computational domain required for simulation was indicated in the steering file using several grid points and grid spacing. For an area of 3.2 km × 2.0 km, this should be given as 320 × 200 grid points with a horizontal grid spacing in “x” and “y” directions of 10 m. The vertical grid spacing was also 10 m, with a stretching factor of 1.1 above 1000 m. These settings provided the possibility of investigating the atmospheric boundary layer up to a height of around 3.6 km above the surface.
Concerning the boundary conditions, by default, the bottom boundary of the model was flat, and a constant flux layer was assumed between the surface and the first atmospheric grid level. Furthermore, the bottom boundary condition was assumed to be a no-slip condition. In contrast, the top boundary condition of the velocity components was the free-slip condition, and the constant flux layer parameter at the bottom boundary was switched on. Moreover, the horizontal boundary conditions for all quantities were non-cyclic, to create more realistic results. The initial conditions and mean profiles of the potential temperature (θ), mixing ratio (q), wind velocity components (u, v, w), soil moisture, and soil temperature were obtained from the dynamic driver. Then, the behavior of the parameters listed in Table 1 was analyzed and evaluated.

Table 1.
List of data output from the study.
2.2. Static Driver
The static input file consists of all topographic data of the modelled domain, such as streets, buildings, water bodies, and vegetation. This driver can be generated using the PALM tool to create the static driver in NetCDF format according to the model requirement. However, it requires pre-processed data for topography, streets, vegetation, etc. that was obtained from the German Space Agency (DLR) at the desired resolution (10 m). The figures from the static driver of the modelled domain showing the topographic data were extracted. For instance, the street type of computational domain that covers the areas of 3.2 km × 2.0 km of city center, and 3.2 km × 1.6 km of Kaltental, are shown in Figure 4. The federal highways are shown in the color red and the main roads in yellow. The rest of the colors show the small roads and side streets.
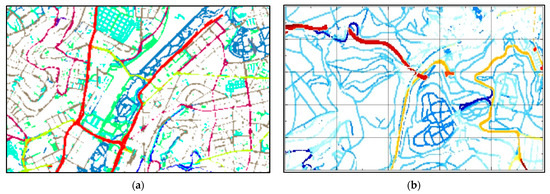
Figure 4.
Street type of PALM-4U simulation domain illustrated by Panoply software (version 4.12). (a) City center 3.2 km × 2.0 km, (b) Kaltental valley 3.2 km × 1.6 km.
2.3. Dynamic Driver
The dynamic input file contains all data that might change with time, such as initialization data for the atmosphere (wind velocity components, moisture, potential temperature) and soil state (temperature, moisture). By utilizing the pre-processing tool INIFOR, the dynamic file was created in NetCDF format. The tool required hourly data, e.g., COSMO data provided by the German Weather Service (DWD). In addition to this, it required a Fortran namelist file containing only the simulation domain size, its geographical information, and the simulation period.
2.4. Chemistry File
The chemistry model considers physical and chemical processes, such as emissions, transport, and chemical transformation. [17]. This is realized by the Kinetic Pre-Processor KPP, which generates the required chemistry code for PALM-4U, based on the selected pollutants to be simulated. KPP version 2.2.3 is used for the resolution of chemical reactions within a specific gas-phase chemistry mechanism [27,28,29]. Within the PALM environment, the desired gas-phase chemistry mechanism is generated using a pre-processor known as kpp4palm. This preprocessor undergoes a two-step process. Firstly, kpp4palm initiates the KPP pre-processor, and subsequently, the code generated by KPP is transfigured into a PALM subroutine during the second step [30]. The chemistry model includes several ready-to-use chemical mechanisms that can be implemented according to the aim of the research. They include the Carbon Bond Mechanism (CBM4), Photo-Chemical SMOG Mechanism (SMOG), a simplified version of SMOG (SIMPLE), Photo-Stationary State Mechanism (PHSTAT) that considers the photo stationary equilibrium between NO, NO2, and O3 and avoids the formation of any secondary compounds, and Photo-Stationary State, plus one passive tracer named PM10, including four compounds and two real reactions [30]. Since the main aim of this research was to investigate the diesel ban impact on the air quality of the studied area, where a comparison of traffic emissions in two different case-scenarios was made, the PHSTAT mechanism with PM10 passive tracer was applied in this study.
The chemistry input file contains information required to set up emission parameters, which can be provided in three different levels of detail (LOD). First, with LOD 0, which is known as a parameterized mode, the emission parameters are provided directly through the steering file and avoid the need for any additional chemistry file. Second, with LOD 1, known as default mode, localized emissions are estimated through annual mean values, as well as temporal, spatial, and species profiles supplied by the chemistry data file. Third, LOD 2, is known as pre-processed mode. In this case, the spatial and temporal emission levels are provided explicitly in the chemistry data file [14]. In this study, the emission parameters were provided using LOD 0, which should be sufficient for the investigation of the required case studies under given computational resources. The traffic emission data using the parameterized option (LOD 0) were based on emission factors derived from handbook emission factors for road transport (HBEFA 4.1). The mean surface emissions of 16,044 μmol/m2/day, 4484 μmol/m2/day, and 2400 × 10−8 Kg/m2/day were applied for NO, NO2, and PM10, respectively. According to Khan et al. [30], the emission factors change with the street type, therefore, the emission factor values required for this study for the main and side streets were 1.667 and 0.334 (µg·s·m−2/µg·s·m−2), respectively. Free slip and non-cyclic boundary conditions were applied for all chemical compounds for these simulations.
2.5. Case Studies
To investigate the impact of the diesel traffic ban on the air quality of Stuttgart, different scenarios were compared. The influence of diesel vehicles with different Euro emission standards was investigated on a typical summer day with the simulation that lasted 24 h, starting on 8 July 2018 at 4:00 UTC. A spin-up period of 24 h was used for the complete simulation to harmonize the dynamics of the model. The first case was simulated with the assumption that the diesel vehicles in the traffic fleet are of the emission standard Euro 4/IV. For the second case, it was assumed that the diesel vehicles in the traffic fleet were upgraded to the emission standard Euro 6/VI. This assumption was made as the best-case scenario in terms of regulatory decision-making that would maximize the air quality improvement. Hence, the second case was simulated with the same settings and only the emission factor was adjusted accordingly. The vehicle number on different street types was estimated based on previous years’ data and was included in the street type information required by the model to generate emissions. The background concentrations of NO, NO2, and O3 were given as input parameters based on the typical concentrations in the simulation area. The focus of this study was only on the difference between the traffic emissions; hence, non-traffic emissions were irrelevant for this study as they are the same in both cases.
In addition, to obtain a better overview of the impact of traffic variation on pollutant concentration, different domains were chosen. Two domains were selected for the simulation in the city center, including federal highways and busy roads, and the Kaltental Valley with more vegetation.
3. Results and Discussion
The results of this study were divided into two simulation domains, which include pollutant distribution results, during 24 h at Central European Summer Time (CEST).
3.1. City Center 3.2 km × 2.0 km
The city center domain included some parts of the city center of Stuttgart as well as the main railway station. This domain contained densely populated areas, street canyons, high-traffic and low-traffic streets, along with parks and green areas. A section of the two federal highways, B14 and B27, was also present in the domain. To gain a better understanding of the impact of traffic on the air quality situation of the city, the horizontal cross-sections of near-surface for standard and enhanced emissions were analyzed, specifically, at 5 m above the surface. Figure 5 and Figure 6 show a comparison between PM10 concentrations at 07:00, 13:00, 19:00, and 23:00 CEST for the scenarios of Euro 4 and Euro 6 diesel vehicles. As expected, PM10 concentrations in rush hours, e.g., at 07:00 CEST, were higher than during the night, due to the traffic volume present in the area during the morning rush hour. Furthermore, several hotspots were observed at these times, along the federal highways B14 and B27.
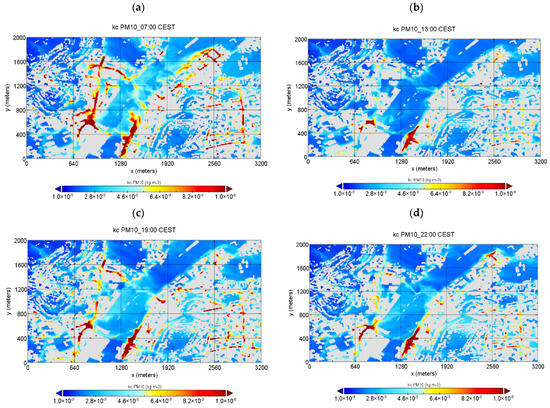
Figure 5.
Horizontal cross-section of near-surface PM10 concentrations at (a) 07:00, (b) 13:00, (c) 19:00, and (d) 22:00 CEST for the case of diesel cars with Euro 4 emissions.
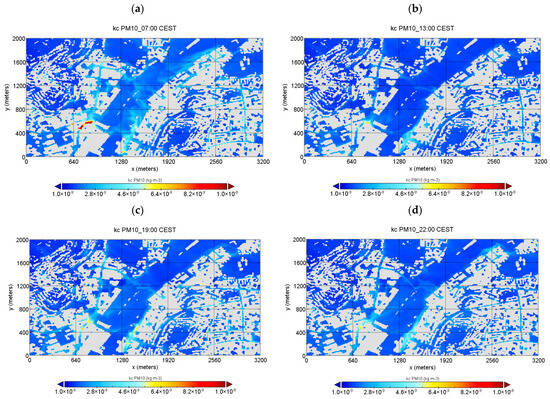
Figure 6.
Horizontal cross-section of near-surface PM10 concentrations at (a) 07:00, (b) 13:00, (c) 19:00, and (d) 22:00 CEST for the case of diesel cars with Euro 6 emissions.
For the scenario of diesel cars with the Euro 4 emission standard, the highest dispersion of pollutants and hotspots was observed during the early morning, at 7:00 CEST in the whole area, reaching around 1.0 × 10⁻⁸ kg/m3, as shown in Figure 5a. Moreover, during that time, the hotspots were not only identified near the federal highways B14 and B27 but also in the area of Stuttgart-East. This was not the case in the scenario of the emission standard Euro 6, which showed relatively low PM10 concentrations in this area (as presented in Figure 6). Likewise, similar behavior was observed during the evening. Even though the traffic volume at that time was less than during rush hours, the presence of hotspots was still observed, mainly on the federal highways, due to the poor ventilation in that area.
An intriguing comparison could be drawn by examining analyses conducted for Krakow, a city near Stuttgart, also situated in a basin and recognized as one of the most polluted cities in Poland. Danek and Weglinska researched the impact of traffic emissions on air pollution in Krakow. The high PM concentration clusters measured during morning and evening rush hours were associated with traffic [31]. They also used big data-driven machine learning for air pollution pattern analysis to reveal annual trends, which also showed comparable results. This suggests that such methods can be used to complement air quality dispersion simulations [32].
The results of NO2 concentrations for the same simulation can be seen in Figure 7 and Figure 8. It can be seen that the NO2 concentrations increase with the intensive traffic, mostly in the rush hours. The emitted pollutants then disperse over time, depending on the stability of the atmosphere, e.g., the dispersion of pollutants is hindered during temperature inversion situations due to low wind speeds and low vertical mixing of air parcels, causing high pollutant concentrations. The NO2 concentrations during the morning, at 7:00 CEST, and 22:00 CEST are shown in Figure 7a and Figure 7b, respectively. Similarly to the PM10 concentrations, NO2 concentrations were mainly higher on heavy traffic roads and on the street canyons that are surrounded by tall buildings, reaching a maximum concentration of 0.1 ppm. However, for the scenario of diesel cars with Euro 6 emission standards (Figure 8), it can be seen that a substantial improvement in air quality was observed by the reduction of traffic emissions. The highest NO2 concentration for this scenario was reduced to 0.07 ppm during the morning (Figure 8a) and no hotspots were observed during the evening (Figure 8b).
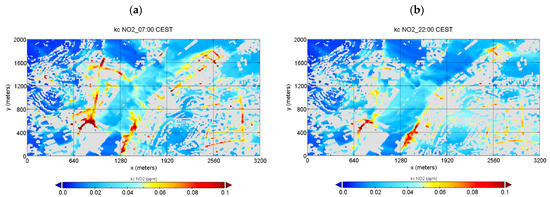
Figure 7.
Horizontal cross-section of near-surface NO2 concentrations at (a) 07:00 and (b) 22:00 CEST for the case of diesel cars with Euro 4 emissions.
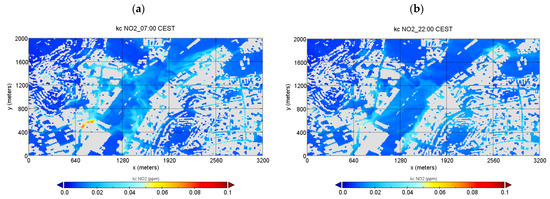
Figure 8.
Horizontal cross-section of near-surface NO2 concentrations at (a) 07:00 and (b) 22:00 CEST for the case of diesel cars with Euro 6 emissions.
3.2. Kaltental Valley 3.2 km × 1.6 km
This domain was named after the Kaltental Valley, which is one of the cold airflow routes responsible for transporting fresh and clean air to the city [33]. An extensive part of the domain area in Kaltental is covered by greenery. A section of the federal highway B14 was the main emission source of pollutants in this domain. Perpendicular to federal highway B14, the main road, Boeblinger Straße, also contributed to traffic emissions. The distribution of the NO2 concentrations was demonstrated at 8:00, 13:00, 22:00, and 1:00 CEST at 5 m above the surface. As illustrated in Figure 9a, the morning NO2 concentration peaks appeared at approximately 8:00 CEST, especially along the B14 highway, with the highest NO2 concentration of around 0.29 ppm. In the afternoon, the NO2 concentration dropped and remained steady at around 0.012 ppm. Afterwards, the NO2 concentration reached the evening peak at approximately 22:00 CEST. The main wind flow for this region was from southwest to northeast in the direction of the city center. Hence, the pollutants were transported in the same direction. It can be observed that the pollutant is dispersed rigorously over the vegetated areas and near the side streets.
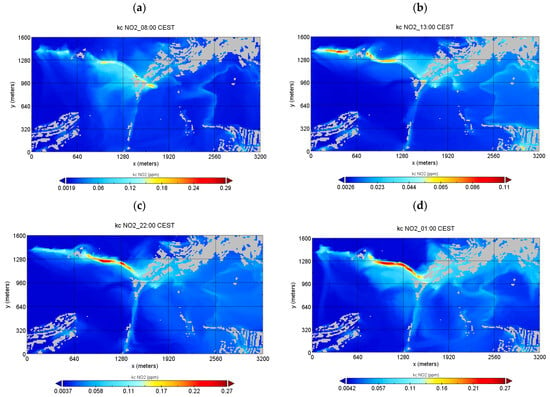
Figure 9.
Horizontal cross-section of near-surface NO2 concentration at (a) 8:00, (b) 13:00, (c) 22:00, and (d) 1:00 CEST for the case of diesel cars with Euro 4 emissions.
For the same simulation, the results are presented in Figure 10a,b for PM10 concentrations at 8:00 CEST and 22:00 CEST, respectively, for the case of diesel cars with Euro 4 emissions. Significantly, the distribution of the PM10 concentration in the morning was well dispersed along federal Highway B14. However, in the evening, PM10 was emitted locally and accumulated along the B14, due to stable atmospheric conditions that lead to poor mixing and dispersion of the pollutant. The high PM10 concentrations at this time were assumed to be due to the surface inversion that is likely to be formed at night, which enhances the pollutant concentration by trapping it near the surface [34].
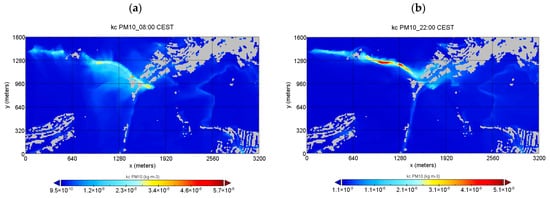
Figure 10.
Horizontal cross-section of near-surface PM10 concentration at (a) 8:00, (b) 22:00 CEST for the case of diesel cars with Euro 4 emissions.
The influence of traffic emissions according to the Euro 6 emission standard scenario can be observed in Figure 11, which shows that the emitted NO2 concentration was almost four times less than the NO2 concentration for the Euro 4 emission standard scenario. As it is shown in a simplified form in Figure 11a, 0.088 ppm NO2 was simulated early in the morning. Moreover, it can be observed that NO2 concentrations were dispersed well over the green areas and near the side streets. Nevertheless, there was a rise in the NO2 concentration in the northern part of the domain during the evening. The wind speed was faster in the open areas and, for that reason, there was more ventilation in these areas. Thus, the emitted pollutants were diluted by dispersion over the open areas. As with NO2 concentrations, there was also a strong influence of the traffic in terms of PM10 concentrations, i.e., around four times less for diesel cars with Euro 6 emission standard than for diesel cars with Euro 4 emission standard (from 5.7 × 10⁻⁸ kg/m3 to 1.5 × 10⁻⁸ kg/m3, as shown in Figure 12).
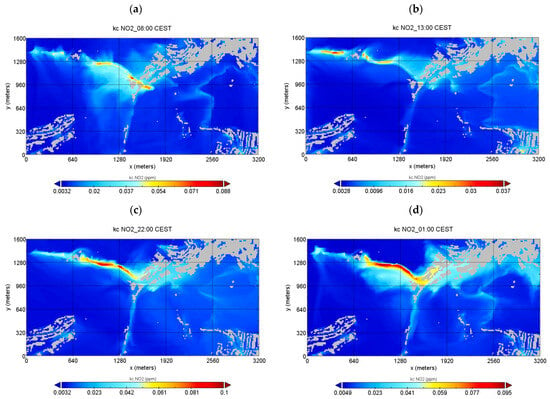
Figure 11.
Horizontal cross-section of near-surface NO2 concentration at (a) 8:00, (b) 13:00, (c) 22:00, and (d) 1:00 CEST for the case of diesel cars with Euro 6 emissions.
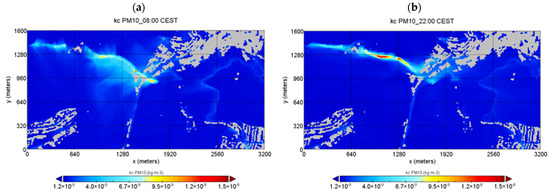
Figure 12.
Horizontal cross-section of near-surface PM10 concentration at (a) 8:00, (b) 22:00 CEST for the case of diesel cars with Euro 6 emissions.
3.3. Result Validation with Stationary Measurements
To ensure that the simulations were reliable and represented reality, they were compared and validated with actual measurement results. In this case, the hourly average measurement data were obtained from the stationary measurement stations located inside the domain, e.g., at Am Neckartor and Arnulf-Klett-Platz. Hourly average NO2 concentrations from both measurement and simulation were obtained for the period from 8 July 2018 at 06:00 CEST until 9 July 2018 at 06:00 CEST.
Figure 13 displays the modelled and observed hourly mean concentrations at Am Neckartor. It can be interpreted that the model could simulate the pattern in the observed NO2 concentration; however, the magnitude of the concentration is different. During this time (09:00 CEST to 15:00 CEST), the simulated NO2 concentrations varied between 10 μg/m3 and 20 μg/m3, while the observed NO2 concentration was approximately 30 μg/m3. At around 20:00 CEST, a slight increase in the modelled concentrations of NO2 was observed, until 22:00 CEST, and it corresponded with the measured concentration peak at this time. However, the NO2 concentration during this peak was around 120 µg/m3 compared to the simulated NO2 concentration of around 30 µg/m3, which is around four times less compared to the observed concentration. Later on, in the night, the observed mean NO2 concentration declined below 60 μg/m3 while the modelled average concentrations at this time were around 20 μg/m3. Overall, at this location, the measured NO2 concentration was always higher than the simulated NO2 concentration, with a factor of around 2 to 4 at different times of the day. It is worth mentioning that the emission data used as input data can cause this uncertainty and, hence, can be improved in further studies. Also, the model resolution (grid size) plays a role. The NO2 concentration is measured at around 3 m above ground level by the monitoring station, while the simulation takes an average of 10 m grid in x, y, and z directions. For a model resolution of 10 m, the model simulates the average concentration at a height of 5 m above ground and represents the average concentration in the 10 m × 10 m × 10 m grid. This could be the reason for lower NO2 concentrations from the simulation results.
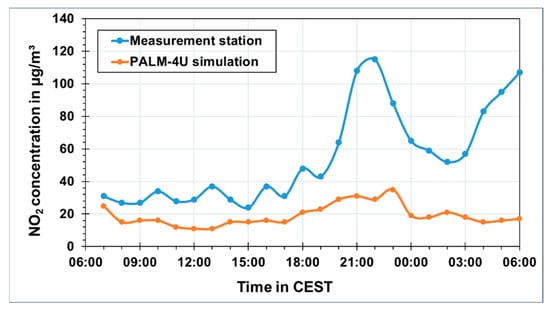
Figure 13.
Comparison of measured and simulated NO2 concentration at Stuttgart Am Neckartor.
A similar comparison is shown in Figure 14 for the site Arnulf-Klett-Platz, where an air quality monitoring station is located. It can be seen that the correlation between NO2 concentration values is higher between 12:00 and 19:00 CEST. During rush hours, the PALM-4U model is unable to simulate the absolute NO2 concentration values, but a similar concentration trend is observed. The correlation between the simulation and measured data was calculated to be around 60%.
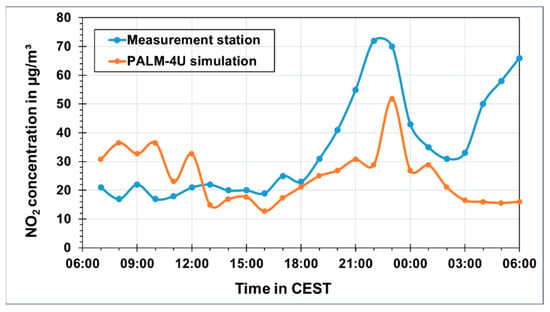
Figure 14.
Comparison of measured and simulated NO2 concentration at Arnulf-Klett-Platz.
The model validation was also performed for the hourly average air temperature at the measurement station at Boeblinger Straße, inside the domain area. Generally, the lower temperatures during the early morning from the simulation results corresponded well with the measurement results. However, deviations as high as around 6 K were observed for the peak temperatures during the day, as shown in Figure 15. During the evening, lower discrepancies of around 1 K were observed, that increased to around 5 K late at night. However, the absolute comparison between the observed and simulated parameters should be considered with caution as it depends on several factors, e.g., the domain settings, the input parameters, and the measurement height. An additional parameter for validation was the relative humidity. Figure 16 depicts that the correlation between the simulated and measured results is more reliable at the same time of the day as for air temperature. There are variances of around 20% visible at 06:00 CEST, 18:00 CEST, and 06:00 CEST on the next day. The simulated and observed wind speed results show relatively good agreement with each other, as shown in Figure 17. The correlation between the observed and simulated measurements for these parameters (air temperature, relative humidity, and wind speed) were 93.3%, 94.2%, and 70.8%, respectively.

Figure 15.
Comparison of measured and simulated air temperature at Boeblinger Straße using time series (left) and scatter (right) plots.
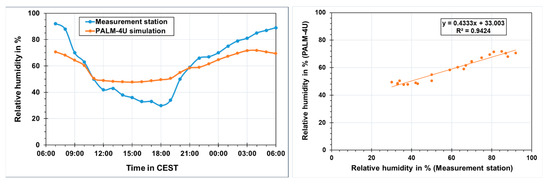
Figure 16.
Comparison of measured and simulated relative humidity at Boeblinger Straße using time series (left) and scatter (right) plots.
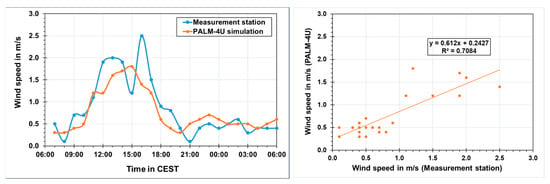
Figure 17.
Comparison of measured and simulated wind speed at Boeblinger Straße using time series (left) and scatter (right) plots.
This study mainly focuses on investigating the impact of the diesel ban on the air quality of the investigated area. Both extremes, i.e., worst-case scenario (all Euro 4 diesel cars) and best-case scenario (all Euro 6 diesel cars) were considered for the simulations to find the maximum potential impact that this change can cause. The actual reduction in air pollutant concentrations is expected to be lower than the maximum impact simulated in this study. The traffic emissions have a major impact on the local air quality of the city. In the air quality plan for Stuttgart, the source of the air pollution concentrations measured near the roadside is modelled, and it shows that around 80% of the pollutant concentration measured near the federal highway B14 at the monitoring station Am Neckartor is emitted from road traffic [35]. Therefore, only the traffic emissions were focused on during these simulations. The non-traffic emissions were the same in both cases and should only have an absolute but no relative effect on the pollutant concentrations. Another reason why these emissions were less relevant for this study was that the emission source is near to the simulated and measurement area, as the emphasis was on the traffic emissions near the streets and highways. Hence, for simplification, these can be ignored for the case studies in this research.
It would be interesting to include a complex chemistry model, current vehicle fleet data, and non-traffic emissions for the real case simulation. The current study will serve as an important intermediate step and will add to the findings of the simulation results with real case settings.
4. Conclusions
The results of this study show that the urban climate model PALM-4U can simulate not only meteorological parameters such as air temperature, relative humidity, wind speed, and wind direction, among others but it can also simulate chemical transformation, advection, and deposition of air pollutants for larger and realistically shaped urban areas. This makes it possible to analyze different scenarios to plan strategies to reduce the pollution impacts in urban areas. With the application of this model, it was possible to observe the traffic-related pollutant behavior around a defined area in the city and, with the investigation of different scenarios, it was confirmed that the pollutant distribution in an area can vary according to external factors such as meteorological situation, location, traffic volume, and surroundings.
In the diesel traffic ban scenarios, the effects of diesel vehicles with Euro 4 and Euro 6 emission standards were assessed. Different hotspots were identified, not only along the main highways of the city but also on the side roads near residential areas. The NO2 behavior during a diurnal cycle for both scenarios was compared, demonstrating that during the rush hours the emissions were relatively higher, leading to high NO2 concentrations along the federal highways and on the side roads that pass through the residential areas in Stuttgart-East. This shows that the relationship between emissions and traffic volume is directly proportional. The scenario with the assumption of upgraded diesel vehicles from Euro 4 to Euro 6 emission standards demonstrated a substantial improvement in the air quality due to a reduction of NO2 concentration by approximately four times. The realistic changes in air quality improvement could be much less than calculated in this study, as only the best-case scenario is investigated.
Likewise, for the PM10 concentrations, hotspots were observed, not only at the federal highways B14 and B27 but also in the area of Stuttgart-East for the case of diesel vehicles with Euro 4 emission standards. Similar behavior was noticed during the night, even though the traffic volume at this time was less than during rush hours. However, this was not the case for the scenario of diesel vehicles with Euro 6 emission standards.
Further research is required to bring the current study closer to reality by including a complex chemistry model, actual fleet composition, the pre-processed mode for emission inventory, and preferably a longer simulation period.
Author Contributions
Conceptualization, A.S., N.A.C.A., T.A. and U.V.; methodology, A.S., N.A.C.A., T.A. and U.V.; software, A.S., N.A.C.A. and T.A.; validation, A.S., N.A.C.A. and T.A.; formal analysis, A.S., N.A.C.A. and T.A.; investigation, A.S., N.A.C.A. and T.A.; resources, U.V.; data curation, A.S., N.A.C.A. and T.A.; writing—original draft preparation, A.S., N.A.C.A. and T.A.; writing—review and editing, A.S.; visualization, A.S., N.A.C.A. and T.A.; supervision, A.S. and U.V.; project administration, A.S. and U.V.; funding acquisition, U.V. All authors have read and agreed to the published version of the manuscript.
Funding
This research was performed under the project Urban Climate Under Change [UC]2, funded by the Federal Ministry of Education and Research (BMBF), Germany, grant number 01LP1912H.
Informed Consent Statement
Not applicable.
Data Availability Statement
The data presented in this study are available on request from the corresponding author. The data are not publicly available due to privacy restrictions.
Conflicts of Interest
The authors declare no conflict of interest.
References
- Cohen, B. Urbanization in developing countries: Current trends, future projections, and key challenges for sustainability. Technol. Soc. 2006, 28, 63–80. [Google Scholar] [CrossRef]
- United Nations. World Urbanization Prospects; Techical Report; Department of Economic and Social Affairs, Population Division, United Nations: New York, NY, USA, 2014; Available online: https://esa.un.org/unpd/wup/publications/files/wup2014-highlights.pdf (accessed on 20 March 2023).
- Saitoh, T.S.; Shimada, T.; Hoshi, H. Modeling and simulation of the Tokyo urban heat island. Atmos. Environ. 1996, 30, 3431–3442. [Google Scholar] [CrossRef]
- Yang, B.; Zhang, Y.; Qian, Y. Simulation of urban climate with high-resolution WRF model: A case study in Nanjing, China. Asia-Pac. J. Atmos. Sci. 2012, 48, 227–241. [Google Scholar] [CrossRef]
- Baumbach, G. Formation and Sources, Dispersion, Characteristics and Impact of Air Pollutants—Measuring Methods, Techniques for Reduction of Emissions and Regulations for Air Quality Control. In Air Quality Control; Springer: Berlin/Heidelberg, Germany, 1996. [Google Scholar]
- European Environment Agency. Air Quality in Europe—2022 Report; European Environment Agency: Copenhagen, Denmark, 2022. [Google Scholar]
- European Commission. Air Policies Environment; European Commission: Brussels, Belgium, 2021; Available online: https://ec.europa.eu/environment/air/souces/road.html (accessed on 20 March 2023).
- Pietrzak, K.; Pietrzak, O. Environmental effects of electromobility in a sustainable urban public transport. Sustainability 2020, 12, 1052. [Google Scholar] [CrossRef]
- European Environment Agency. Emissions of Air Pollutants from Transport; European Environment Agency: Copenhagen, Denmark, 2021; Available online: https://www.eea.europa.eu/data-and-maps/indicators/transport-emissions-of-air-pollutants-8/transport-emissions-of-air-pollutant-8 (accessed on 20 March 2023).
- Thatcher, M.; Hurley, P. Simulating Australian Urban Climate in a Mesoscale Atmospheric Numerical Model. Bound.-Layer Meteorol. 2012, 142, 149–175. [Google Scholar] [CrossRef]
- Kaijshima, T.T. Computational Fluid Dynamics. Incompressible Turbulent Flows; Springer International Publishing: Cham, Switzerland, 2017. [Google Scholar]
- Dėdelė, A.; Miškinytė, A. Estimation of inter-seasonal differences in NO2 concentrations using a dispersion ADMS-Urban model and measurements. Air Qual. Atmos. Health 2015, 8, 123–133. [Google Scholar] [CrossRef]
- De Ridder, K.; Lauwaet, D.; Maiheu, B. UrbClim—A fast urban boundary layer climate model. Urban Clim. 2015, 12, 21–48. [Google Scholar] [CrossRef]
- Maronga, B.; Banzhaf, S.; Burmeister, C.; Esch, T.; Forkel, R.; Fröhlich, D.; Fuka, V.; Gehrke, K.F.; Geletič, J.; Giersch, S.; et al. Overview of the PALM model system 6.0. Geosci. Model Dev. 2020, 13, 1335–1372. [Google Scholar] [CrossRef]
- Fröhlich, D.; Matzarakis, A. Calculating human thermal comfort and thermal stress in the PALM model system 6.0. Geosci. Model Dev. 2020, 13, 3055–3065. [Google Scholar] [CrossRef]
- Kurppa, M.; Roldin, P.; Strömberg, J.; Balling, A.; Karttunen, S.; Kuuluvainen, H.; Niemi, J.V.; Pirjola, L.; Rönkkö, T.; Timonen, H.; et al. Sensitivity of spatial aerosol particle distributions to the boundary conditions in the PALM model system 6.0. Geosci. Model Dev. 2020, 13, 5663–5685. [Google Scholar] [CrossRef]
- Maronga, B.; Gross, G.; Raasch, S.; Banzhaf, S.; Forkel, R.; Heldens, W.; Kanani-Sühring, F.; Matzarakis, A.; Mauder, M.; Pavlik, D.; et al. Development of a new urban climate model based on the model PALM—Project overview, planned work, and first achievements. Metz 2019, 28, 105–119. [Google Scholar] [CrossRef]
- IMUK, Institute of Meteorology and Climatology. PALM-4U Components. 2019. Available online: https://palm.muk.uni-hannover.de/trac/wiki/palm4u (accessed on 20 March 2023).
- Fallmann, J.; Emeis, S.; Suppan, P. Mitigation of urban heat stress—A modelling case study for the area of Stuttgart. Die Erde—J. Geogr. Soc. Berl. 2014, 144, 202–216. [Google Scholar] [CrossRef]
- Schwitalla, T.; Bauer, H.-S.; Warrach-Sagi, K.; Bönisch, T.; Wulfmeyer, V. Turbulence-permitting air pollution simulation for the Stuttgart metropolitan area. Atmos. Chem. Phys. 2021, 21, 4575–4597. [Google Scholar] [CrossRef]
- Resler, J.; Eben, K.; Geletič, J.; Krč, P.; Rosecký, M.; Sühring, M.; Belda, M.; Fuka, V.; Halenka, T.; Huszár, P.; et al. Vali-dation of the PALM model system 6.0 in a real urban environment: A case study in Dejvice, Prague, the Czech Republic. Geosci. Model Dev. 2021, 14, 4797–4842. [Google Scholar] [CrossRef]
- Musco, F. Counteracting Urban Heat Island Effects in a Global Climate Change Scenario; Springer International Publishing: Cham, Switzerland, 2016. [Google Scholar]
- Regierungspräsidium Stuttgart. Luftreinhalteplan für den Regierungsbezirk Stuttgart—Teilplan Landeshauptstadt Stuttgart; Regierungspräsidium Stuttgart: Stuttgart, Germany, 2018. [Google Scholar]
- Thomas, L.; Ramser, B.; Scheu-Hachtel, H.; Metzner, D. Verkehrsstarken an ausgewahlten Verkehrs- und Spotmessstellen—Auswertungen 2016; Landesanstalt für Umwelt, Messungen und Naturschutz Baden-Württemberg: Karlsruhe, Germany, 2018. [Google Scholar]
- Graf, T.; Horn, M.; Leiber, T.; Scheu-Hachtel, H.; Wirth, R.; Scheinhardt, S. Luftreinhalteplane fur Baden-Wurttemberg; Landesanstalt fur Umwelt Baden-Wurttemberg: Karlsruhe, Germany, 2020. [Google Scholar]
- Samad, A.; Vogt, U. Investigation of urban air quality by performing mobile measurements using a bicycle (MOBAIR). Urban Clim. 2020, 33, 100650. [Google Scholar] [CrossRef]
- Damian, V.; Sandu, A.; Damian, M.; Potra, F.; Carmichael, G. The Kinetic PreProcessor KPP—A Software Environment for Solving Chemical Kinetics. Comput. Chem. Eng. 2002, 26, 1567–1579. [Google Scholar] [CrossRef]
- Sandu, A.; Sander, R. Technical note: Simulating chemical systems in Fortran90 and Matlab with the Kinetic PreProcessor KPP-2.1. Atmos. Chem. Phys. 2006, 6, 187–195. [Google Scholar] [CrossRef]
- Sandu, A.; Daescu, D.; Carmichael, G.R. Direct and adjoint sensitivity analysis of chemical kinetic systems with KPP: Part I—Theory and software tools. Atmos. Environ. 2003, 37, 5083–5096. [Google Scholar] [CrossRef]
- Khan, B.; Banzhaf, S.; Chan, E.C.; Forkel, R.; Kanani-Sühring, F.; Ketelsen, K.; Kurppa, M.; Maronga, B.; Mauder, M.; Raasch, S.; et al. Development of an atmospheric chemistry model coupled to the PALM model system 6.0: Implementation and first applications. Geosci. Model Dev. 2020, 14, 1171–1193. [Google Scholar] [CrossRef]
- Danek, T.; Weglinska, E.; Zareba, M. The influence of meteorological factors and terrain on air pollution concentration and migration: A geostatistical case study from Krakow, Poland. Sci. Rep. 2022, 12, 11050. [Google Scholar] [CrossRef] [PubMed]
- Zareba, M.; Dlugosz, H.; Danek, T.; Weglinska, E. Big-Data-Driven Machine Learning for Enhancing Spatiotemporal Air Pollution Pattern Analysis. Atmosphere 2023, 14, 760. [Google Scholar] [CrossRef]
- Samad, A.; Vogt, U. Assessing the Effect of Traffic Density and Cold Airflows on the Urban Air Quality of a City with Complex Topography Using Continuous Measurements. In Modern Environmental Science and Engineering; Academic Star Publishlishing Company: New York, NY, USA, 2020; Volume 6, pp. 529–541. [Google Scholar] [CrossRef]
- Samad, A.; Vogt, U.; Panta, A.; Uprety, D. Vertical distribution of particulate matter, black carbon and ultra-fine particles in Stuttgart, Germany. Atmos. Pollut. Res. 2020, 11, 1441–1450. [Google Scholar] [CrossRef]
- Regierungspräsidium Stuttgart. Luftreinhalteplan für den Regierungsbezirk Stuttgart, Teilplan Landeshauptstadt Stuttgart. 4. Fortschreibung des Luftreinhalteplanes zur Minderung der NO2-Belastung. 2019. Available online: https://rp.baden-wuerttemberg.de/fileadmin/RP-Internet/Stuttgart/Abteilung_5/Referat_54.1/_DocumentLibraries/Luftreinhalteplan/Stuttgart/541_s_stutt_LRP_4_FS_2019.pdf (accessed on 20 March 2023).
Disclaimer/Publisher’s Note: The statements, opinions and data contained in all publications are solely those of the individual author(s) and contributor(s) and not of MDPI and/or the editor(s). MDPI and/or the editor(s) disclaim responsibility for any injury to people or property resulting from any ideas, methods, instructions or products referred to in the content. |
© 2024 by the authors. Licensee MDPI, Basel, Switzerland. This article is an open access article distributed under the terms and conditions of the Creative Commons Attribution (CC BY) license (https://creativecommons.org/licenses/by/4.0/).