Article

Patterns and Influencing Factors of Air Pollution at a Southeast Chinese City

1
School of Population Health, Curtin Health Innovation Research Institute, Curtin University of Technology, Perth 6845, Australia
2
Epidemiology Directorate, Department of Health Western Australia, Perth 6004, Australia
3
Zhejiang Provincial Center for Disease Control and Prevention, Hangzhou 310051, China
4
National Institute of Occupational Health and Poison Control, Beijing 100050, China
*
Authors to whom correspondence should be addressed.
Atmosphere 2023, 14(9), 1394; https://doi.org/10.3390/atmos14091394
Submission received: 21 July 2023 / Revised: 26 August 2023 / Accepted: 29 August 2023 / Published: 3 September 2023

Abstract

:
Ambient air pollution is a pressing global environmental problem. To identify the source of air pollution and manage air quality in urban areas, the patterns of air pollutants under different traffic conditions and the impact of weather on air quality were explored in Hangzhou, China, a city experiencing rapid growth in vehicles. Data for particulate matters (PM10, PM2.5, PM1.0, and UFP), gaseous pollutants (CO, SO2, O3, and NO), and weather parameters (temperature, relative humidity, wind speed, and air pressure) were collected at two venues with different traffic conditions. An exploratory factor analysis was employed to identify the main factors contributing to air quality. The results showed that PMs, particularly PM1.0 and UFP, significantly contributed to air quality in monitoring venues, especially at Venue 2. As the leading factor, PMs contributed 40.85%, while gaseous pollutants and traffic (particularly fuel type) contributed 30.46% to air quality. The traffic was an independent contributor at Venue 2. Temperature and wind speed had negative influences on air pollutants. The outcomes of the study suggest that exhaust emissions from vehicles, particularly PM1.0 and UFP from heavy-duty vehicles, contributed significantly to ambient air quality. The contribution of meteorological factors to air quality varied at different venues and should not be ignored.

1. Introduction

Air pollution is a pressing global environmental problem, particularly in developing countries. While experiencing a dramatic economic expansion as the world’s largest developing country, China is also facing the challenge of air pollution. Air quality in contemporary cities has raised concerns for the Chinese government since early 2010. Based on the report from the Chinese Ministry of Environmental Protection, the annual mean PM2.5 concentrations ranged from 29 to 47 µg/m−3 in the past decade [1], which exceed the World Health Organization (WHO) air pollution guideline level of 10 µg/m−3 [2]. To understand the status and influential factors of air pollutants in urban areas, many studies on urban ambient air pollution have been conducted and mainly focused on particulate matter with a diameter of less than or equal to 10 µm (PM10), particles with a diameter of less than or equal to 2.5 µm (PM2.5), carbon monoxide (CO), ozone (O3), sulphur dioxide (SO2), and nitrogen oxides (NOx) [3,4,5,6,7,8]. These air pollutants have air quality guideline levels determined by the WHO and have been included in the Chinese National Ambient Air Quality Standards (GB3095-2012) as air quality indicators [9]. Studies on ambient particles with a diameter of less than or equal to 1 µm (PM1.0) [10] and ultrafine particles (UFPs, diameter ≤ 0.1 μm or 100 nm) [11] were limited, even though they have drawn significant attention due to their possibly greater threatening effects on health [12]. As various particle sizes may result in various health impacts, it is crucial to investigate ambient air quality in a systematic approach, particularly for PM1.0 and UFP, to obtain useful information on the patterns of air pollutants and influential factors to identify the main sources of air pollution, efficiently manage air quality in urban areas, and provide useful information for future regulation of these air pollutants.
With the rapid increase in the use of motor vehicles, traffic-related air pollution in urban areas has become a major concern for its significant contribution to the total airborne particulate concentration and related adverse health effects [13,14,15,16]. Hangzhou, the capital city of Zhejiang Province located in southeast China, is one of the major coastal cities in China with rapid growth in cultural, tourism, and other service industries [17]. The rapid increase in vehicle numbers has resulted in increased on-road traffic volumes and tail gas emissions, which may have a negative health impact on local residents, pedestrians, and outdoor workers. Previous studies on traffic-related air pollution mainly focused on monitoring concentrations of pollutants under general traffic conditions and often used official monitoring data or remote sensing data [18,19,20,21]. Although big datasets can provide representative data for monitoring the trend change of air quality over years for the covered areas, such big data makes it difficult to obtain information on the pattern of air pollutants for different traffic conditions and the contribution of different vehicle types to air quality. Furthermore, the official monitoring or remote sensing data obtained from surveillance points were usually obtained from locations far from emission sources and needed to be estimated via various methods, such as the inverse distance weighted method or the Kriging interpolation method, which cannot accurately reflect the local exposure level due to the fast evolution of UFPs and PM1.0 in space and time [22]. In addition, weather conditions could be different in different locations within one city. Limited studies in Hangzhou using official or remote sensing data could not accurately obtain such data for the monitoring sites [3,23,24]. Hence, first-hand monitoring data near the emission source, including meteorological factors, is necessary.
In this study, an air quality experiment was conducted in Hangzhou to investigate the patterns of air pollutants (PM10, PM2.5, PM1.0, UFPs, O3, CO, NO, and SO2) under different traffic conditions, the contribution of traffic flow and type to air quality, and the relationships among air pollutants, traffic flow, and meteorological factors.

2. Materials and Methods

2.1. Sampling Venues and Strategy

The air quality monitoring study was conducted from April to June at two venues, representative of two different traffic conditions, in Hangzhou (Figure 1). Venue 1 was located in the centre of the Hangzhou metropolitan area and was a 4-lane, twenty-metre-high viaduct that could only be used by light-duty vehicles. The length of the viaduct from north to south is about 20 km, and the sampling site was near North Ring Road, which is near the midpoint of the viaduct’s length. Venue 2 was about 8 km away from Venue 1 and was located at a T-junction near the beginning of the Fourth Bridge, a bridge across the Qiantang River. About 150 m to the east of the venue were two offices and a textile sales market, and 200 m to the west was a residential area. Compared with Venue 1, this venue was a two-lane traffic road located in the southeast of the city. The traffic flow in this venue was not as busy as that in Venue 1, but the majority of vehicles traveling on the road were heavy-duty vehicles. The vehicle speed limit is 60 km/h for Venue 2 and 80 km/h for Venue 1. The measuring instruments’ inlets were situated 1.3 m above the ground, and the sampling duration covered 8 h every day (from 8:00 to 16:00 Beijing time) during the study period.

2.2. Equipment and Quality Control

The concentrations of PM2.5 and PMl.0 were measured with a real-time aerosol monitor (DustTrak DRX, model 8533, TSI, Shoreview, MN, USA), which can simultaneously measure multiple sizes of segregated mass fractions of the sampled aerosol, including total PMs, PM10, PM2.5, and PM1.0. The DustTrak DRX was calibrated by the manufacturer each year and was zeroed using a HEPA filter before sampling each day. The flow rate of the device was set at 1.7 L min−1 and the log interval was set at 1 min. The number concentration of UFPs was determined using a condensation particle counter (CPC, model 8525, TSI, Shoreview, MN, USA) measuring particles in the 20 to 1000 nm range. The CPC was zeroed before sampling each day, and the isopropyl alcohol cartridge was replaced every 4 h. The concentrations of gaseous pollutants, such as CO, SO2, NO2, and O3, were measured using YES Plus LGA (CET, Brampton, ON, Canada). The meteorological factors, including air temperature, pressure, relative humidity, and wind speed, were monitored in situ using a Professional Weather Centre (model WMR200A, Oregon Scientific, Tualatin, OR, USA). The inlet filters of monitoring devices were cleaned in a clean environment before measurement. All monitoring devices were placed side by side, and the inlet nozzles faced the road.

2.3. Statistical Analysis

Descriptive statistics were generated for summarising purposes. The median, minimum, and maximum were calculated for each particulate matter, each gaseous pollutant, and each meteorological variable at each monitoring venue. Because the data was not normally distributed, the Wilcoxon Mann–Whitney test was used to compare the differences in PMs between the two monitoring venues. To demonstrate the variation of fine PMs, traffic flow, and meteorological parameters, the concentrations were aggregated into hourly averages, and line charts were drawn.
To get an insight into the pattern of air pollution and the contribution of meteorological parameters, a separate explanatory factor analysis (EFA) with principal component extraction and the oblique rotation method was carried out for the overall data and then for each monitoring site. Before the analysis, the distributions of the outcome variables were assessed for normality, and some of them were found to be not normally distributed; however, factor analysis is generally robust to mild violations of normality [25]. The Kaiser–Meyer–Olkin (KMO) statistic was calculated, and Bartlett’s test of sphericity was conducted to test the sampling adequacy and zero correlation coefficients, respectively [26]. When the partial correlation coefficients between all variables are much smaller than the sum of squares of simple correlation coefficients, the KMO value is close to 1, indicating the data is suitable for factor analysis. When the KMO value is smaller than 0.6, the observed variable is considered inappropriate for EFA. Factors with eigenvalues that exceeded 1.0 were determined to be retained; however, items with factor loadings below 0.4 were eliminated. Furthermore, in Bartlett’s test, variables were suitable for EFA only if the result of Bartlett’s test of sphericity was significant.
All data were analysed by IBM SPSS Statistics Version 26 (Inc., Chicago, IL, USA, https://www.ibm.com/support/pages/downloading-ibm-spss-statistics-26?mhsrc=ibmsearch_a&mhq=spss%2026, accessed on 1 May 2019). A p-value of less than 0.05 is considered statistically significant at 5%.

3. Results

3.1. The Concentrations of Air Pollutants, Meteorological Parameters, and Traffic Flow

The concentrations of particulate air pollutants (number concentrations and mass concentrations), traffic flow, and meteorological parameters at both monitoring sites are presented in Table 1. Although the traffic numbers in Venue 1 (115 vehicles per hour) were more than four times higher than those in Venue 2 (24 vehicles per hour), the median concentrations of all particulate air pollutants at Venue 2 were higher than those at Venue 1. The median number concentration of UFP observed at Venue 2 (median = 5.45 × 10⁴, min = 1.05 × 10⁴, max = 18.2 × 10⁴) was more than 20% higher than that observed at Venue 1 (median = 4.29 × 10⁴, min = 1.95 × 10⁴, max = 9.53 × 10⁴). For other particulate air pollutants, the median concentrations at Venue 2 were more than 50% higher than those observed at Venue 1. The results of the Wilcoxon Mann–Whitney test showed that the concentrations of gaseous pollutants were significantly different between the two monitoring sites (p < 0.01). Among meteorological factors, there were significant differences in pressure, humidity, and wind speed between the two monitoring locations (p < 0.01).

3.2. Temporal Variations of the Concentrations of Fine PM Pollutants, Traffic Flow, and Meteorological Parameters

The concentrations of fine PMs, traffic flow, and meteorological parameters were aggregated into hourly averages (denoted as 1–8), and the mean levels within each hour were plotted in Figure 2. UFP and PMl.0 were plotted on the left axis, and the rest were plotted on the right axis. For illustration purposes, UFP and pressure were divided by 100, and wind speed was multiplied by 100.
Figure 2A showed that the overall concentrations of UFP and PM1.0 kept decreasing from morning to afternoon. The humidity levels followed the same pattern as the concentration of fine PMs. On the contrary, the temperature and wind speed tended to increase from morning to afternoon. The overall number of vehicles, which fluctuated in waves between 70 and 90, presented two peak values in the morning and the afternoon. The temporal variations in the concentrations of UFP and PMl.0, vehicle numbers, and weather parameters in the two venues were similar to those overall and presented in Figure 2B,C.

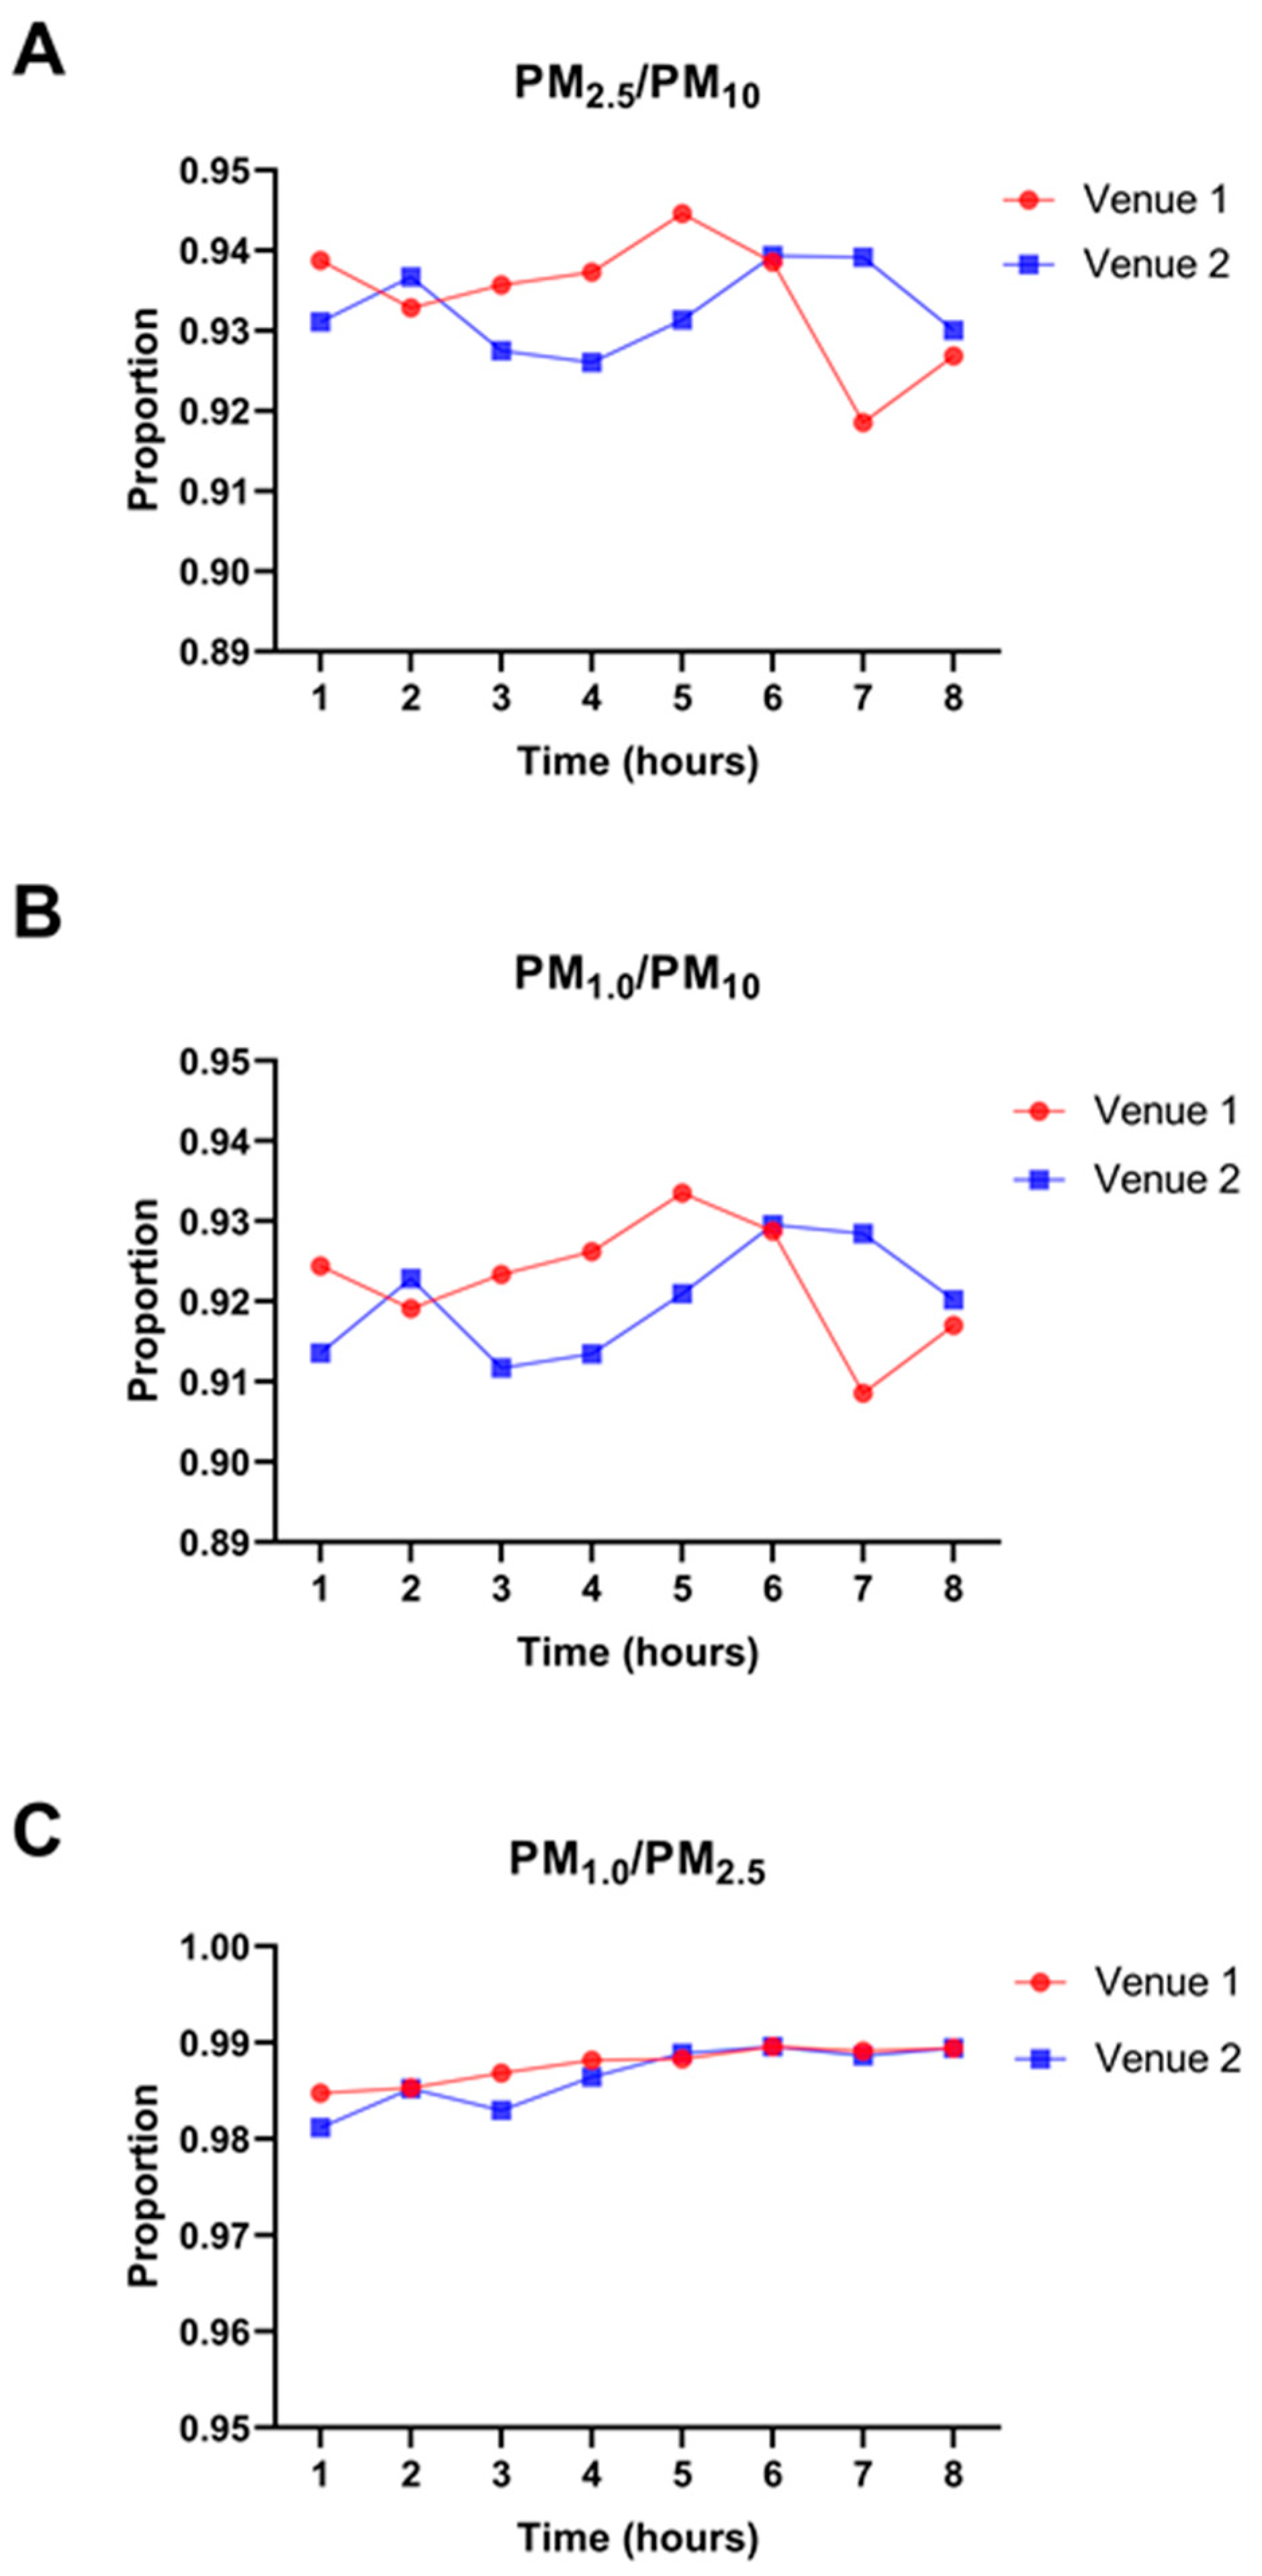
3.3. Temporal Variation in Mean Ratios of PM1.0 and PM2.5

The hourly average of the ratios between the PM fractions in the two locations was calculated (Figure 3). The results showed that the mean ratios for PM2.5 to PM10 and PM1.0 to PM10 at Venue 1 were higher than those at Venue 2, except for one point in the morning and two points in the late afternoon. The mean ratios for PM1.0 to PM2.5 at Venue 1 were similar to those at Venue 2, except for two points in the morning.

3.4. Factor Analysis of the Potential Sources of Air Pollution and Influential Weather Factors

To analyse the pattern and potential sources of air pollution, PMs, gaseous air pollutants, and traffic flow were included in the EFA. Meanwhile, the contribution of meteorological parameters as influential factors was explored using the EFA. The overall and venue specific EFA results were presented in Table 2. Kaiser–Meyer–Olkin (KMO) measures were greater than 0.6 for all factor analyses, suggesting the factors had a lot in common for a satisfactory factor analysis. Bartlett’s tests were significant (p < 0.001), suggesting good factorability of these variables.
The results showed that overall air quality (across the two monitoring venues) was mainly affected by two factors (71.31%). The first factor, including all particular matters, explained variation up to 40.85%, indicating that the PMs were a leading indicator that contributed most to the air quality observed in the study areas. The second factor, which consists of CO, SO2, NO, O3, and traffic flow, explained 30.46% of the total variation. Based on the venue specific EFA, air quality was mainly affected by three factors. For particulates, while PM1.0–PM10 were included in the first factor, UFP was in the second factor for both venues. For gaseous pollutants, CO and SO2 were included in the second factor in Venue 1, and CO and NO were included in the first factor in Venue 2. Traffic flow alone contributed to 12% of the variations as the third factor for Venue 2. For the EFA result including meteorological parameters, temperature and wind speed were presented as negative influential factors overall and for each venue. While temperature was involved in the third factor overall and for each venue, wind speed was involved in the second factor overall and for Venue 1 and was involved in the first factor in Venue 2.

4. Discussions

This study characterised the pattern of particulate pollutants under different traffic conditions and explored the relationships between PMs, gaseous air pollutants, traffic flow, and meteorological factors. In particular, the potential sources of air pollution were explored using the EFA method.
The overall EFA results (Table 2) indicated that mass concentrations of PMs (PM1.0-PM10, as the first factor) and particle number concentrations (PNC) of UFP contributed significantly to the air quality of the monitoring venues. The gaseous pollutants also contribute significantly (as the second factor) to the air quality of the monitoring venues. This study also observed that, within PM2.5, over 98% came from PM1.0 (Figure 3C), suggesting that the majority of PMs detected in the two venues were PM1.0 and smaller. This was supported by a study conducted in an urban area of Vietnam with heavy traffic, which revealed a high ratio of PM1.0 to PM2.5 mass (above 0.8) [27]. For the UFP, although they account for a negligible contribution to the total PM mass concentration, they contribute dominantly to PNC [28]. The higher PNC of UFP in Venue 2 suggested the non-negligible contribution of UFP to air quality by heavy-duty vehicles. Currently, there is no regulation for PM1.0 and UPF worldwide, as no sufficient epidemiological evidence exists to formulate the air quality guideline levels for them. In 2021, an air quality guideline by the WHO [2] indicated that the most significant process generating UFP was combustion. The main sources of UFP include vehicles and other forms of transportation (aviation and shipping), industrial power plants, and residential heating. Given that the monitoring venues were far from other sources, vehicles contributed significantly to the PNC of UFP in this study. This was also apparent in Venue 2, where UFP acted as factor 3 in EFA, a sole contributor, and the venue was dominated by heavy-duty vehicles using diesel fuel.
An interesting finding on the pollutants’ concentration was that although the traffic flow in Venue 2 was significantly lower than that in Venue 1, the PMs concentrations in Venue 2 were higher than those in Venue 1 (Table 1). This finding suggested that the pattern of air pollutants at both venues was different. A high concentration of PMs is usually accompanied by high traffic flow, which has been reported as a direct factor and a major source of PM in source studies [29,30,31]. However, the opposite trend of PM concentration and traffic flow observed in this study suggested that other contributors might be involved more prominently than traffic flow. The possible reason could be the influence of vehicle types, speeds, and meteorological conditions at the two venues.
Petrol and diesel are two types of fuels used most commonly for vehicles, which generate different mixtures of air pollutants. Petrol vehicles produce more carbon monoxide (CO), volatile organic compounds (VOCs), ammonia (NH3), and heavy metals, while diesel vehicles are responsible for more PM2.5 [32]. Diesel exhaust is one important contributor to the high concentration of UFP and fine particles [28,33,34,35]. At Venue 1, there were only a large number of passenger cars during monitoring periods. Compared with Venue 1, there were mainly heavy-duty vehicles with relatively low traffic flow at Venue 2. Furthermore, the factor analysis for air pollutants revealed that traffic flow, as an independent factor, explained 12% of the variation in Venue 2, which indicated the crucial role of heavy-duty vehicles at Venue 2. Hence, the different vehicle types and speeds probably weighted more than vehicle numbers to explain the high concentration of PMs at Venue 2. Recently, one study on the generation of spikes in UFP emissions in the city of Toronto demonstrated that the number of UFP spikes was highest on arterial roads where the vehicle speed was relatively low but with high variability [36]. In addition, a study on the characteristics of gaseous pollutants from light-duty diesel vehicles reported that gaseous pollutant emissions decreased with the rise of vehicle speed [37]. Among the two traffic roads, the speed limit at Venue 1 was 80 km/h and 60 km/h at Venue 2. The slower the speed, the lower the local airflow, which is adverse to dilution [38]. Hence, the higher concentration of UFP at Venue 2 might also be associated with the relatively low vehicle speed at Venue 2.
Meteorological factors have been reported as influential factors for air pollutants. Charron et al. studied the influences of meteorological factors on particle size distribution and found that low temperatures favoured the formation of new particles [39]. This is consistent with our temporal variation results, which showed that the variation pattern of concentrations of PM1.0 and UFP was opposite to that of wind speed and temperature at both venues (Figure 2). The EFA results of exploring meteorological factors revealed that wind speed and temperature presented a negative impact factor at both venues. A similar negative correlation between wind speed and the concentration of air pollutants was also reported by the studies conducted in China and Istanbul [40,41]. Another study conducted in the city of Elche also found that submicron (PM1.0) and fine (PM1.0–2.5) particles had significant negative correlations with wind speed [42]. The possible reason for the negative effect of wind speed is that a lower wind speed is not conducive to diluting pollutants [43]. In addition, the negative effect of temperature on air pollution in this study was confirmed by a recent study conducted in Peru [44]. This study reported that temperature had a negative relationship with the PM2.5 mass concentration. This may be related to slow air convection, less diffusion, and the dilution of air pollutants at lower temperatures [45].
In brief, comprehensive measurements were conducted in Hangzhou under different traffic conditions to identify the contribution of traffic flow, fuel type, patterns of air pollutants, and the impact of meteorological conditions on air quality. The relevant knowledge obtained in this study will serve as the scientific basis for future assessments of the air pollution situation and quantify the contributions of heavy diesel vehicles to air pollutants on a larger scale.
One limitation of this study was that the monitoring was only conducted in the spring and did not cover all four seasons. The pattern of air pollution is influenced by weather with seasonal variation and is site-specific. However, this limitation would not detract from the finding that meteorological conditions were important factors in affecting PMs. To illustrate the pattern of air pollution in different seasons and the specific association between the variation of UFP and traffic, further studies that cover a longer measurement time and more monitoring sites are needed to confirm the findings of this study.

5. Conclusions

The main conclusions from this study are as follows: (1) The PMs, in particular PM1.0 and UFP, were the main air pollutants on both busy traffic roads and significantly contributed to traffic-related air pollution. (2) The fuel type of vehicles, especially diesel exhaust, is an important contributor to air pollution, particularly fine and ultrafine particulate matter. (3) Vehicle speed is also an adjusting factor for air pollution level; the slower the speed, the higher the PMs in the monitoring venue. (4) Meteorological parameters, especially wind speed and temperature, are negatively correlated with the concentrations of fine and ultrafine particulate matter. The findings observed in this study may serve as a scientific basis for further assessing air pollution in modern urban areas with busy traffic flows and quantifying the contributions of heavy diesel vehicles to air pollutants on a larger scale. The outcomes of this study also provide useful information for the future with regard to efficiently managing air quality in urban areas and for future regulation of PM1.0 and UFP.

Author Contributions

Conceptualization, L.J.; Data curation, L.J., H.Z. and M.X.; Formal analysis, X.G. and Y.Z.; Funding acquisition, L.J.; Investigation, L.J., M.Z., Q.C., H.Z. and M.X.; Methodology, X.G., L.J., Y.Z., M.Z. and Q.C.; Project administration, L.J.; Resources, L.J. and M.Z.; Supervision, L.J.; Visualization, X.G.; Writing—original draft, X.G., L.J. and Y.Z.; Writing—review and editing, X.G., L.J., Y.Z., M.Z. and Q.C. All authors have read and agreed to the published version of the manuscript.

Funding

This work was supported by Curtin University as part of the project “Diesel exhausts exposure and health status: a model for assessing modifiable environmental factors of Health”.

Institutional Review Board Statement

Not applicable.

Informed Consent Statement

Not applicable.

Data Availability Statement

The data presented in this study are available on request from the corresponding author.

Acknowledgments

The authors would like to thank Yiping Zhu and other staff at Hangzhou Traffic Administration and Control Centre for their kind help in gaining access to the study venues for data collection.

Conflicts of Interest

The authors declare no conflict of interest.

References

  1. Ministry of Ecology and Environment of the People’s Republic of China. Circular of the Ministry of Ecology and Environment about Air Quality; Ministry of Ecology and Environment of the People’s Republic of China: Beijing, China, 2019. [Google Scholar]
  2. WHO. WHO Global Air Quality Guidelines: Particulate Matter (PM2.5 and PM10), Ozone, Nitrogen Dioxide, Sulfur Dioxide and Carbon Monoxide; WHO: Geneva, Switzerland, 2021. [Google Scholar]
  3. Shan, Y.; Wang, X.; Wang, Z.; Liang, L.; Li, J.; Sun, J. The pattern and mechanism of air pollution in developed coastal areas of China: From the perspective of urban agglomeration. PLoS ONE 2020, 15, e0237863. [Google Scholar] [CrossRef]
  4. Owoade, O.K.; Fawole, O.G.; Olise, F.S.; Ogundele, L.T.; Olaniyi, H.B.; Almeida, M.S.; Ho, M.D.; Hopke, P.K. Characterization and source identification of airborne particulate loadings at receptor site-classes of Lagos Mega-City, Nigeria. J. Air Waste Manag. Assoc. 2013, 63, 1026–1035. [Google Scholar] [CrossRef]
  5. Li, X.; Song, H.; Zhai, S.; Lu, S.; Kong, Y.; Xia, H.; Zhao, H. Particulate matter pollution in Chinese cities: Areal-temporal variations and their relationships with meteorological conditions (2015–2017). Environ. Pollut. 2019, 246, 11–18. [Google Scholar] [CrossRef]
  6. Guan, Q.; Cai, A.; Wang, F.; Yang, L.; Xu, C.; Liu, Z. Spatio-temporal variability of particulate matter in the key part of Gansu Province, Western China. Environ. Pollut. 2017, 230, 189–198. [Google Scholar] [CrossRef]
  7. Chen, T.; He, J.; Lu, X.; She, J.; Guan, Z. Spatial and Temporal Variations of PM2.5 and Its Relation to Meteorological Factors in the Urban Area of Nanjing, China. Int. J. Environ. Res. Public Health 2016, 13, 921. [Google Scholar] [CrossRef]
  8. Li, Z.; Wang, Y.; Xu, Z.; Cao, Y. Characteristics and sources of atmospheric pollutants in typical inland cities in arid regions of central Asia: A case study of Urumqi city. PLoS ONE 2021, 16, e0249563. [Google Scholar] [CrossRef]
  9. GB 3095-2012; Ambient Air Quality Standards. Ministry of Ecology and Environment the People’s Republic of China: Beijing China, 2012.
  10. ISO/TR 27628:2007; Workplace Atmospheres—Ultrafine, Nanoparticle and Nano-Structured Aerosols—Inhalation Exposure Characterization and Assessment. ISO: Geneva, Switzerland, 2007; p. 34.
  11. ISO 80004-1:2023; Nanotechnologies–Vocabulary—Part 1: Core Vocabulary. ISO: Geneva, Switzerland, 2023; p. 12.
  12. Ali, M.U.; Lin, S.; Yousaf, B.; Abbas, Q.; Munir, M.A.M.; Rashid, A.; Zheng, C.; Kuang, X.; Wong, M.H. Pollution characteristics, mechanism of toxicity and health effects of the ultrafine particles in the indoor environment: Current status and future perspectives. Crit. Rev. Environ. Sci. Technol. 2022, 52, 436–473. [Google Scholar] [CrossRef]
  13. Kan, H.; Chen, R.; Tong, S. Ambient air pollution, climate change, and population health in China. Environ. Int. 2012, 42, 10–19. [Google Scholar] [CrossRef] [PubMed]
  14. Cohen, A.J.; Brauer, M.; Burnett, R.; Anderson, H.R.; Frostad, J.; Estep, K.; Balakrishnan, K.; Brunekreef, B.; Dandona, L.; Dandona, R.; et al. Estimates and 25-year trends of the global burden of disease attributable to ambient air pollution: An analysis of data from the Global Burden of Diseases Study 2015. Lancet 2017, 389, 1907–1918. [Google Scholar] [CrossRef] [PubMed]
  15. Muñoz, X.; Barreiro, E.; Bustamante, V.; Lopez-Campos, J.L.; González-Barcala, F.J.; Cruz, M.J. Diesel exhausts particles: Their role in increasing the incidence of asthma. Reviewing the evidence of a causal link. Sci. Total Environ. 2019, 652, 1129–1138. [Google Scholar] [CrossRef] [PubMed]
  16. Beelen, R.; Hoek, G.; van den Brandt, P.A.; Goldbohm, R.A.; Fischer, P.; Schouten, L.J.; Jerrett, M.; Hughes, E.; Armstrong, B.; Brunekreef, B. Long-term effects of traffic-related air pollution on mortality in a Dutch cohort (NLCS-AIR study). Environ. Health Perspect. 2008, 116, 196–202. [Google Scholar] [CrossRef] [PubMed]
  17. Hangzhou Statistical Yearbook 2021; China Statistics Press: Beijing, China, 2021.
  18. Patton, A.P.; Perkins, J.; Zamore, W.; Levy, J.I.; Brugge, D.; Durant, J.L. Spatial and temporal differences in traffic-related air pollution in three urban neighborhoods near an interstate highway. Atmos. Environ. 2014, 99, 309–321. [Google Scholar] [CrossRef] [PubMed]
  19. He, H.D.; Gao, H.O. Particulate matter exposure at a densely populated urban traffic intersection and crosswalk. Environ. Pollut. 2021, 268, 115931. [Google Scholar] [CrossRef] [PubMed]
  20. Brown, L.; Barnes, J.; Hayes, E. Traffic-related air pollution reduction at UK schools during the COVID-19 lockdown. Sci. Total Environ. 2021, 780, 146651. [Google Scholar] [CrossRef] [PubMed]
  21. Lim, S.; Barratt, B.; Holliday, L.; Griffiths, C.J.; Mudway, I.S. Characterising professional drivers’ exposure to traffic-related air pollution: Evidence for reduction strategies from in-vehicle personal exposure monitoring. Environ. Int. 2021, 153, 106532. [Google Scholar] [CrossRef] [PubMed]
  22. Kwon, H.S.; Ryu, M.H.; Carlsten, C. Ultrafine particles: Unique physicochemical properties relevant to health and disease. Exp. Mol. Med. 2020, 52, 318–328. [Google Scholar] [CrossRef]
  23. Javed, Z.; Bilal, M.; Qium, Z.; Li, G.; Sandhu, O.; Mehmood, K.; Wang, Y.; Ali, A.; Liu, C.; Wang, Y.; et al. Spatiotemporal characterization of aerosols and trace gases over the Yangtze River Delta region, China: Impact of trans-boundary pollution and meteorology. Environ. Sci. Eur. 2022, 34, 86. [Google Scholar] [CrossRef] [PubMed]
  24. Zhao, Z.; Zhou, Z.; Russo, A.; Du, H.; Xiang, J.; Zhang, J.; Zhou, C. Impact of meteorological conditions at multiple scales on ozone concentration in the Yangtze River Delta. Environ. Sci. Pollut. Res. Int. 2021, 28, 62991–63007. [Google Scholar] [CrossRef]
  25. Coakes, S.J.O.; Ong, C. SPSS: Analysis without Anguish: Version 18.0 for Windows; John Wiley & Sons: Hoboken, NJ, USA, 2007; p. 278. [Google Scholar]
  26. Watkins, M.W. Exploratory Factor Analysis: A Guide to Best Practice. J. Black Psychol. 2018, 44, 219–246. [Google Scholar] [CrossRef]
  27. Phuc, N.H.; Oanh, N.T.K. Large spatio-temporal variations of size-resolved particulate matter and volatile organic compounds in urban area with heavy traffic. Environ. Sci. Pollut. Res. Int. 2022, 29, 21491–21507. [Google Scholar] [CrossRef]
  28. Zhu, Y.; Sulaymon, I.D.; Xie, X.; Mao, J.; Guo, S.; Hu, M.; Hu, J. Airborne particle number concentrations in China: A critical review. Environ. Pollut. 2022, 307, 119470. [Google Scholar] [CrossRef]
  29. Sahanavin, N.; Prueksasit, T.; Tantrakarnapa, K. Relationship between PM (10) and PM(2.5) levels in high-traffic area determined using path analysis and linear regression. J. Environ. Sci. 2018, 69, 105–114. [Google Scholar] [CrossRef]
  30. Chen, Y.C.; Hsu, C.K.; Wang, C.C.; Tsai, P.J.; Wang, C.Y.; Chen, M.R.; Lin, M.Y. Particulate Matter Exposure in a Police Station Located near a Highway. Int. J. Environ. Res. Public Health 2015, 12, 14541–14556. [Google Scholar] [CrossRef]
  31. Wei, T.; Wijesiri, B.; Li, Y.; Goonetilleke, A. Particulate matter exchange between atmosphere and roads surfaces in urban areas. J. Environ. Sci. 2020, 98, 118–123. [Google Scholar] [CrossRef] [PubMed]
  32. Forehead, H.; Huynh, N. Review of modelling air pollution from traffic at street-level-The state of the science. Environ. Pollut. 2018, 241, 775–786. [Google Scholar] [CrossRef] [PubMed]
  33. Long, E.; Carlsten, C. Controlled human exposure to diesel exhaust: Results illuminate health effects of traffic-related air pollution and inform future directions. Part. Fibre Toxicol. 2022, 19, 11. [Google Scholar] [CrossRef] [PubMed]
  34. Huang, C.; Lou, D.; Hu, Z.; Tan, P.; Yao, D.; Hu, W.; Li, P.; Ren, J.; Chen, C. Ultrafine particle emission characteristics of diesel engine by on-board and test bench measurement. J. Environ. Sci. 2012, 24, 1972–1978. [Google Scholar] [CrossRef]
  35. Holmen, B.A.; Ayala, A. Ultrafine PM emissions from natural gas, oxidation-catalyst diesel, and particle-trap diesel heavy-duty transit buses. Environ. Sci. Technol. 2002, 36, 5041–5050. [Google Scholar] [CrossRef] [PubMed]
  36. Xu, J.; Tu, R.; Wang, A.; Zhai, Z.; Hatzopoulou, M. Generation of spikes in ultrafine particle emissions from a gasoline direct injection vehicle during on-road emission tests. Environ. Pollut. 2020, 267, 115695. [Google Scholar] [CrossRef] [PubMed]
  37. Wang, G.; Cheng, S.; Lang, J.; Li, S.; Tian, L. On-board measurements of gaseous pollutant emission characteristics under real driving conditions from light-duty diesel vehicles in Chinese cities. J. Environ. Sci. 2016, 46, 28–37. [Google Scholar] [CrossRef]
  38. Rönkkö, T.; Timonen, H. Overview of Sources and Characteristics of Nanoparticles in Urban Traffic-Influenced Areas. J. Alzheimers Dis. 2019, 72, 15–28. [Google Scholar] [CrossRef]
  39. Charron, A.; Harrison, R.M. Primary particle formation from vehicle emissions during exhaust dilution in the roadside atmosphere. Atmos. Environ. 2003, 37, 4109–4119. [Google Scholar] [CrossRef]
  40. Rupakheti, D.; Yin, X.; Rupakheti, M.; Zhang, Q.; Li, P.; Rai, M.; Kang, S. Spatio-temporal characteristics of air pollutants over Xinjiang, northwestern China. Environ. Pollut. 2021, 268, 115907. [Google Scholar] [CrossRef]
  41. Yavuz, V.; Özen, C.; Çapraz, Ö.; Özdemir, E.T.; Deniz, A.; Akbayır, İ.; Temur, H. Analysing of atmospheric conditions and their effects on air quality in Istanbul using SODAR and CEILOMETER. Environ. Sci. Pollut. Res. Int. 2022, 29, 16213–16232. [Google Scholar] [CrossRef] [PubMed]
  42. Galindo, N.; Varea, M.; Gil-Moltó, J.; Yubero, E.; Nicolás, J. The Influence of Meteorology on Particulate Matter Concentrations at an Urban Mediterranean Location. Water Air Soil Pollut. 2011, 215, 365–372. [Google Scholar] [CrossRef]
  43. Kong, L.; Tan, Q.; Feng, M.; Qu, Y.; An, J.; Liu, X.; Cheng, N.; Deng, Y.; Zhai, R.; Wang, Z. Investigating the characteristics and source analyses of PM (2.5) seasonal variations in Chengdu, Southwest China. Chemosphere 2020, 243, 125267. [Google Scholar] [CrossRef]
  44. Romero, Y.; Diaz, C.; Meldrum, I.; Arias Velasquez, R.; Noel, J. Temporal and spatial analysis of traffic-Related pollutant under the influence of the seasonality and meteorological variables over an urban city in Peru. Heliyon 2020, 6, e04029. [Google Scholar] [CrossRef] [PubMed]
  45. Wang, X.; Zhang, R. Effects of atmospheric circulations on the interannual variation in PM2.5 concentrations over the Beijing-Tianjin-Hebei region in 2013–2018. Atmos. Chem. Phys. 2020, 20, 7667–7682. [Google Scholar] [CrossRef]
Figure 1. Map of Hangzhou and the location of the sampling sites. Atmosphere 14 01394 i001 is the sampling site.
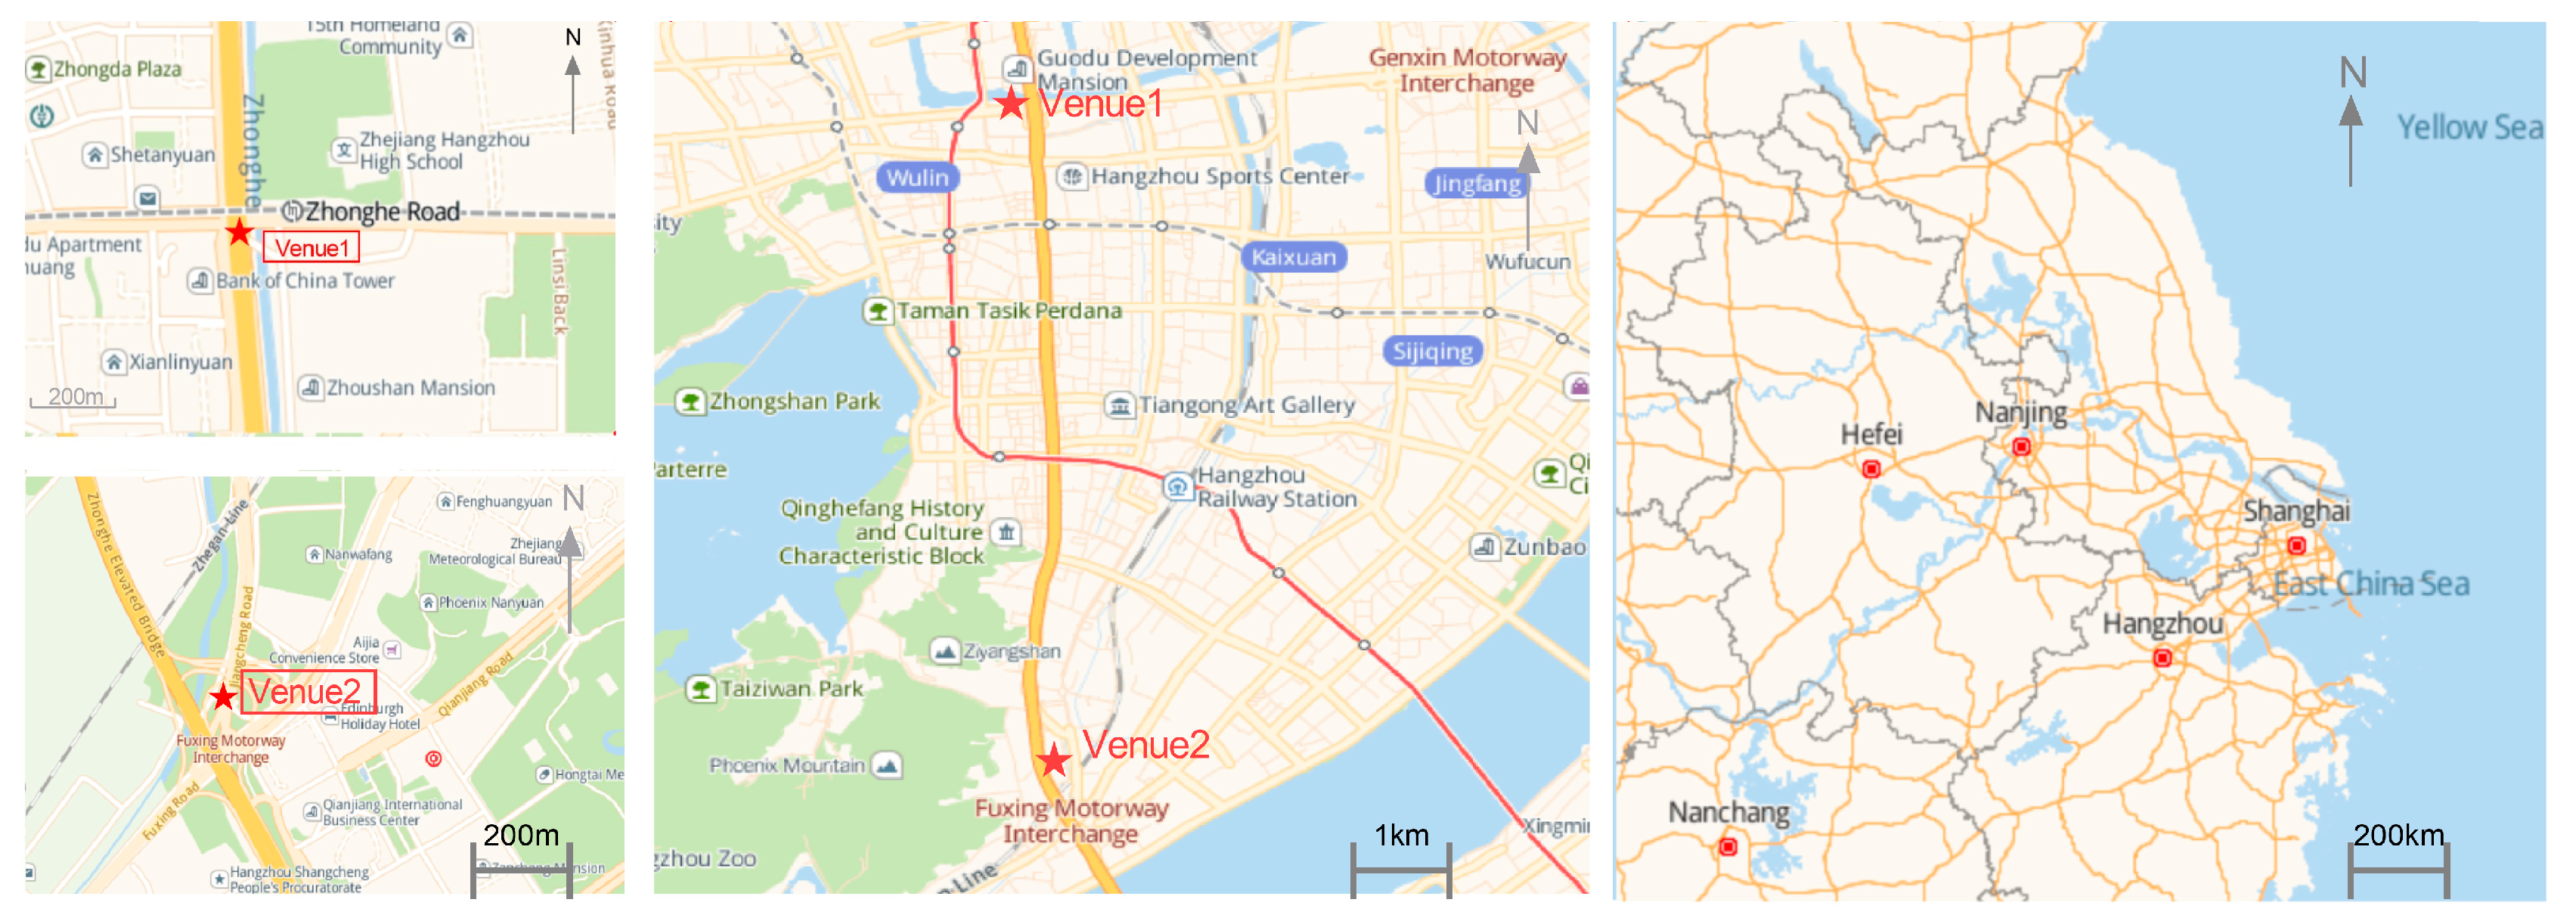
Atmosphere 14 01394 g001
Figure 2. The hourly average of UFPs, PM1.0, total traffic, temperature, humidity, wind speed, and pressure for (A) overall and at (B) Venue 1 and (C) Venue 2. In all the graphs, UFP and PM1.0 were plotted on the primary axis (in the left hand), and the rest of the parameters were plotted on the secondary axis (in the right hand).
Atmosphere 14 01394 g002
Figure 3. Hourly average ratios for PM2.5 to PM10 (A), PM1.0 to PM10 (B), and PM1.0 to PM2.5 (C) at two venues.
Atmosphere 14 01394 g003
Table 1. Concentrations of air pollutants, meteorological parameters, and traffic flow at two sampling sites in Hangzhou.
LocationsVenue 1Venue 2The Ratios for Venue 2 to Venue 1p
Factors
[Median (min, max)]
UFP (104 pt/cm3) 4.29 (1.95, 9.53)5.45 (1.05, 18.2)1.27˂0.01
PM1.0 (102 ug/cm3)1.44 (0.534, 4.87)2.25 (0.284, 5.93)1.56˂0.01
PM2.5 (102 ug/cm3) 1.46 (0.544, 4.95)2.28 (0.286, 6.07)1.56˂0.01
PM10 (102 ug/cm3) 1.58 (0.600, 5.32)2.57 (0.324, 6.52)1.63˂0.01
O3 (ppm)0.004 (0.00, 0.02)0.04 (0.00, 0.11)10.0˂0.01
NO (ppm)0.13 (0.00, 0.88)0.38 (0.00, 1.25)2.92˂0.01
SO2 (ppm) 0.02 (0.00, 0.18)0.01 (0.00, 0.07)0.50˂0.01
CO (ppm)1.40 (0.20, 14.00)0.40 (0.00, 2.00)0.29˂0.01
Temperature (℃) 24.2 (14.7, 29.4)23.7 (18.9, 32.0)0.980.69
Pressure (kPa)1.02 (1.01, 1.02)1.01 (1.01, 1.01)0.99˂0.01
Humidity (%)70.0 (37.1, 98.5)64.2 (30.0, 91.0)0.920.02
Wind speed (m/s)0.45 (0.16, 1.74)0.40 (0.03, 1.57)0.89˂0.01
Traffic (vehicle numbers per hour)115 (55, 488)24 (14, 90)0.21˂0.01
Note: p-value obtained based on the Wilcoxon Mann–Whitney test.
Table 2. The results of factor analysis for air pollutants and influencing factors.
CategoriesVariablesOverallVenue 1Venue 2
Factor 1Factor 2Factor 1Factor 2Factor 3Factor 1Factor 2Factor 3
Air pollutantsPM1.0 (ug/cm3)0.98 0.93 0.99
PM2.5 (ug/cm3)0.98 0.93 0.99
PM10 (ug/cm3)0.98 0.93 0.99
UFP (pt/cm3)0.52 0.73 0.55
CO (ppm) 0.80 0.89 0.75
SO2 (ppm) 0.74 0.89 0.74
NO (ppm) −0.65 0.65−0.74
O3 (ppm) −0.81 0.79 −0.82
Traffic 0.74 0.58 0.93
Variance explained (%)40.8530.4634.9626.4012.4350.9316.1412.00
Cumulative variance explained (%)71.3176.3079.07
KMO0.7180.610.70
Bartlett’s Testp < 0.001p < 0.001p < 0.001
Air pollutants and meteorological parametersVariablesOverallVenue 1Venue 2
Factor 1Factor 2Factor 3Factor 1Factor 2Factor 3Factor 1Factor 2Factor 3
PM1.0 (ug/cm3)0.98 0.99 0.97
PM2.5 (ug/cm3)0.98 0.98 0.97
PM10 (ug/cm3)0.98 0.98 0.97
UFP (pt/cm3) 0.78 0.73 0.78
CO (ppm) 0.65 0.87 0.79
SO2 (ppm) 0.58 0.82 −0.60
NO (ppm) −0.83 0.60−0.81
O3 (ppm) −0.82 0.64 −0.83
Traffic 0.61 0.44 0.52
Humidity 0.86 −0.830.90
Wind speed −0.75 −0.42 −0.67
Pressure−0.67 0.56 −0.83
Temp −0.89 −0.92 −0.68
Variance explained (%)39.1425.6312.0129.1921.6716.0045.5520.259.08
Cumulative variance explained (%)76.7866.8674.88
KMO0.7590.6810.727
Bartlett’s Testp < 0.001p < 0.001p < 0.001
Disclaimer/Publisher’s Note: The statements, opinions and data contained in all publications are solely those of the individual author(s) and contributor(s) and not of MDPI and/or the editor(s). MDPI and/or the editor(s) disclaim responsibility for any injury to people or property resulting from any ideas, methods, instructions or products referred to in the content.

