Abstract
The impact of air pollution on people and the environment is a severe issue that has recently been the subject of extensive research. This study has looked at the factors that contribute to the seasonal and spatial variability of pollutant concentration over Delhi NCR from 2019 to 2021. Additionally, the causes of changes in air quality during the COVID-19’s lockdown period in 2020 have been discussed, along with comparisons to the pre-lockdown year (2019) and the post-lockdown year (2021). Seven pollutant parameters, viz., (PM2.5, PM10, NOx, CO, SO2, NH3, and O3) were retrieved from the air quality monitoring stations spread over Delhi NCR. The results show a significant temporal (seasonal) and spatial variability in the air pollutants’ concentration. The highest pollutant level was observed in winter and the lowest in summer seasons. The results suggest that the concentration of atmospheric pollutants was already lower (20–30%) before the implementation of the lockdown. Meteorology played an important role in emission reduction during the lockdown, in particular, and seasonal, in general. The results also suggest that Bhiwadi is not the most polluted city, as claimed in the World Air Quality Report 2022. The most polluted sites in terms of pollutant concentration were observed over Delhi in all the years considered.
1. Introduction
Air pollution (ambient/outdoor and household/indoor) caused by natural as well as anthropogenic activities is one of the most serious environmental health risks faced by mankind today [1]. The World Health Organization (WHO) claims that air pollution is the fourth-leading cause of mortality worldwide and is responsible for more than 7 million premature deaths annually caused by pulmonary, cardiovascular, and cancer diseases. Approximately 3 million deaths every year are completely attributable to outdoor air pollution. One out of every nine fatalities worldwide occur as a result of the poisonous air that more than 99% of the world’s population breathes [2]. Air pollution is a threat to health in all countries, but it affects people in low- and middle-income countries the hardest. Countries can lessen the burden of diseases, long-term illnesses, and short-term illnesses by reducing air pollution levels. Air pollution causes 9% of deaths worldwide, with rates ranging from 2% in high-income nations to around 15% in several South and East Asian nations. India is one of the top five most polluted countries in the world, with Delhi being the most polluted capital city [3]. The lifespan in Delhi NCR is shortened by more than 10 years because of the poor air quality.
Particulate matter (PM) is a complex mixture of microscopic solid or liquid particles of organic and inorganic substances suspended in the atmosphere [4]. PM10 with an aerodynamic diameter of 10 micrometres (µm) or less are considered “thoric” airborne particles that can enter the lower respiratory tract. The most dangerous pollutants for human health are PM2.5, which has an aerodynamic diameter of 2.5 micrometres (µm) or less. These are referred to as “respirable” airborne particles and can penetrate deeply into the gas-exchange zone of the lungs [5,6]. In addition, nitrogen oxides, sulfur dioxide, volatile organic compounds (VOCs), dioxins, and polycyclic aromatic hydrocarbons (PAHs) are also considered air pollutants that are hazardous to humans. Ozone protects against ultraviolet light in the stratosphere, but its presence at ground level, where it is produced via photochemical reactions in the presence of sunlight and precursor pollutants (such as nitrogen oxides and volatile organic compounds) in high concentrations, is very harmful [7,8].
The Delhi National Capital Region (Delhi NCR) has been facing serious challenges linked to worrying levels of air pollution and the consequent health hazards. Delhi NCR is one of the world’s most polluted areas due to rapid industrialization and urbanization, rising vehicle density, the substantial use of coal in thermal power plants, and the burning of waste and crops. Numerous efforts were made by several Government and Private Organizations in Delhi NCR to curb or mitigate the pollution levels. Air pollution in Delhi and the adjacent regions is a complex phenomenon that depends on various factors. First and foremost is the input of pollutants (industries, power plants, fossil fuel combustion from motor vehicles, construction sites, landfills and agriculture, the domestic combustion of coal and biomass, wind-blown dust from open lands, roads, and deserts), followed by meteorological conditions [9,10,11,12]. In addition, the burning of crop residues and the use of firecrackers prior to the start of the winter season also contribute significantly to the deterioration of air quality in Delhi NCR [13,14]. The sectoral contribution from the above-mentioned sources varies significantly from season to season. The level of particulate matter over Delhi and NCR never reaches (except only a couple of days in the monsoon season) within the revised permissible limit set by the World Health Organization in 2021 (PM2.5: 15 µg/m3 —24-h mean, 5 µg/m3 annual mean; PM10: 45 µg/m3 —24-h mean, 15 µg/m3 annual mean) [15]. The average annual particulate matter and gaseous pollutants concentration is several times higher than the revised WHO limits (PM2.5 ~18 times higher than the permissible limit).
Coronavirus (COVID-19) is a pandemic disease which was first reported from the Wuhan city of China [16]. To control the spread of the COVID-19 outbreak, a lockdown approach was followed in many nations worldwide including India. After four successive phases of the lockdown: I phase, 21 days from 25 March to 14 April 2020; II phase, 19 days from 15 April to 3 May 2020; III phase, 14 days from 4 May to 17 May 2020; and IV phase, 14 days from 18 May to 31 May 2020. With a gradual easing of restrictions, the lockdown was lifted in several phases. These lockdowns provided an opportunity window to study the behaviour and dynamics of air pollution in an artificial pristine environment. The lockdown, which was caused due to COVID-19, enforces restrictions and self-quarantine measures, which reduce anthropogenic activities (emissions especially from transportation, industries, and construction activities) not only in India but also worldwide, and it improved the air quality significantly.
Numerous studies suggested a decline in anthropogenic air pollution in nations responding to the COVID-19 pandemic. Satellite-based estimates by NASA (National Aeronautics and Space Administration) and ESA (European Space Agency) indicate that pollution in some nations responding to the COVID-19 pandemic (like Wuhan, Spain, Italy, and the USA etc.) has reduced up to 30% [17,18]. A global study over seven geographical regions of the world covering 25 countries coordinated by the World Meteorological Organization Global Atmospheric Watch (WMO/GAW) program suggested a decline of up to about 70% in mean NO2 and between 30% and 40% in mean PM2.5 concentrations during the 2020 lockdown time compared to the same period in 2015–2019 [19]. Several other regional or global studies also claimed a variable reduction in air pollutants during the lockdown due to COVID-19 in different countries like China, Canada, Bangladesh, Iran, Brazil, Italy, USA, Kazakhstan, Poland, Korea, Spain, Japan, Russia, Morocco, Thailand, and several others ([20,21,22,23,24,25,26,27,28,29,30,31,32,33,34,35,36,37,38], and several others).
Like other nations, studies over Indian regions have also reported a variable but significant effect of the restriction on air quality during the COVID-19 pandemic. Sharma et al. [39] stated that during the pre- and first lockdown period in 2020 (16 March to 14 April 2020), PM2.5, PM10, CO, and NO2 decreased by roughly 43, 31, 10, and 18% at 22 distinct places in India. The temporal and diurnal changes in the air pollutants’ concentration across 134 locations in India during the lockdown period of 2020 were studied and compared with the same period in 2017–2019 by Singh et al. [40]. They reported a variable but considerable reduction in PM2.5, PM10, NO2, and CO and a mixed behavior (increase/decrease) in SO2 and O3 concentration. Carbon monoxide (CO) emissions in Kolkata decreased by 24% to 45% during the lockdown as a result of a reduction in industrial pollutants and transport services [41]. There was an observed 40–50% drop in NO2 levels during this time in major cities (Mumbai and New Delhi) [42]. Likewise, numerous other studies in several parts of India have reported a variable but considerable reduction in particulate matter and gaseous pollutants due to COVID-19 restrictions [43,44,45,46,47,48,49,50,51,52,53,54].
On the contrary, few recent studies (globally/regionally) claim that air quality was not improved significantly due to COVID restrictions, as previously thought. According to new and revised satellite-derived PM2.5 data, there was little change in global particulate pollution. Despite the well-known, rapid slowdown in the global economy, the global population weighted average PM2.5 level only decreased from 27.7 to 27.5 µg/m3 between 2019 and 2020 [55]. Pei et al. [56] also claimed that the atmospheric quality in urban areas of China has not improved overall despite the lockdown’s restrictions. Most of the studies discussed above directly compared the pollutant levels during the lockdown periods of 2020 with the previous year (2019). However, there is little information in the literature about meteorological conditions and their effects on the variance of pollutant concentrations during the lockdown periods [23,39,53,54,57]. When comparing the decline to before the lockdown in the same year, the seasonal decline in pollution levels may also be taken into consideration [40]. In addition, the variability and comparison of air pollutant concentration during the closure period (2020) and the year after closure (2021) are sparse in the literature [58]. The aim of the present paper is to study the impact of the lockdown on the concentration of pollutants (particulate matter and gaseous pollutants) in 2020 and to compare the year before (2019) and the year after the lockdown (2021) over Delhi and the adjacent region.
2. Methodology and Study Area
To investigate the cause of variation in air pollution, the daily (24-h) concentrations of seven pollutants, namely PM2.5, PM10, NOx, CO, SO2, NH3, and O3, were downloaded from the Central Pollution Control Board’s (CPCB) online portal over Delhi NCR (https://app.cpcbccr.com/ccr/#/caaqm-dashboard/caaqm-landing/data, accessed on 1 April 2022). The data was collected from 65 air quality monitoring stations located across the Delhi NCR region during the years 2019, 2020, and 2021. These stations are spread across four states and are classified as follows based on their respective states:
- Delhi (36): Anand Vihar, Bawana, ITO, Vivek Vihar, Lodhi road, RK Puram, Nehru Nagar, Chandni Chowk, Jahangirpuri, Mandir Marg, Dilshad Garden, North Campus-DU, DTU, Alipur, Ashok Vihar, Aya Nagar, Dr. Karni Singh, Dwarka Sector-8, NSIT-Dwarka, IGI Airport, Major Dhayan Chand stadium, CRRI-Mathura Road, Narela, Patparganj, Okhla Vihar-Phase II, Punjabi Bagh, Pusa Road, Rohini, Sonia Vihar, Wazirpur, Shadipur, Najafgarh, Jawahar Lal Nehru Stadium, Mundka, Siri fort, and Sri-Aurobindo Marg
- Haryana (14): IMT-Manesar, Sector-51 Gurugram, Sonipat, Panipat, New Industrial town, Sector-16-A, and Sector-11 Faridabad, Palwal, Teri-Gram, Vikas Sadan, Bahadurgarh, Dharuhera, Jind, and Rohtak.
- Rajasthan (1): Bhiwadi
- Uttar Pradesh (14): Noida Sector 1, 62 and 125, Sanjay Nagar, Vasundhara, Indirapuram, Hapur, Bulandshahar, Meerut (Ganga Nagar-phase 2), Knowledge Park-Greater Noida, Loni, Baghpat, and Park-5 Greater Noida.
The locations of all the above-mentioned sites are shown in Figure 1. Before processing, the data was thoroughly reviewed several times. There were locations where the data was either not accessible or continuous for a few to several days in different years from 2019 to 2021. Such data sets were excluded after rigorous observation and analyses. The average value before and after the missing day was used, processed, and compared with the closest CPCB station data available if one day’s worth of data was missing. Monitoring stations that had more than 60% valid data during the analysis period were taken into consideration. Additionally, we performed an outlier analysis on each pollutant data set to remove any odd data. We noted that Delhi’s data on air quality monitoring stations is superior in terms of the number of parameter observations and the consistency of the data sets. To guarantee the accuracy of the measured data, the CPCB maintains a Quality Assurance/Quality Control program that comprises instrument calibration and maintenance, training, standards for monitoring ambient air quality, and the evaluation of monitoring stations (https://cpcb.nic.in/quality-assurance-quality-control/, accessed on 5 April 2022). Monthly average values from individual monitoring stations were used for map preparation. Maps were created using the Kriging interpolation method in Arc GIS software.
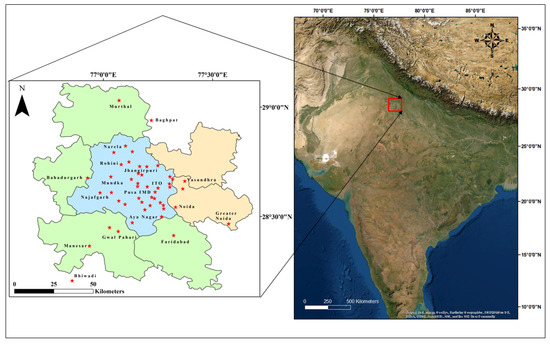
Figure 1.
Map showing the location of the study area (Delhi NCR). Blue: Delhi, Green: studied regions of Haryana, and Pink: studied regions of Uttar Pradesh.
To study the effect of rainfall on air quality variability over Delhi NCR, satellite-retrieved daily average precipitation was used. The National Aeronautics and Space Administration (NASA) and the Japan Aerospace Exploration Agency (JAEA) launched the Global Precipitation Measurement (GPM) satellite mission on 28 February 2014. The level 3 multi-satellite precipitation method of GPM is called IMERG (Integrated Multi-satellite Retrievals for GPM), and it combines monthly gauge precipitation data with precipitation information acquired from the microwave sensor and infrared sensor onboard the GPM constellations [59,60]. In this study, we used GPM IMERG Final Precipitation 1 day 0.1° × 0.1° V06 (GPM_3IMERGDF v06) as the daily satellite precipitation products.
The National Capital Region (NCR) is a region of dense population (800/km2) that spans four states—National Capital Territory—Delhi, Haryana, Uttar Pradesh, and Rajasthan—with a total of twenty-three districts [61]. It is geographically located between the coordinates 27.60° N to 29.30° N and 76.20° E to 78.40° E. India’s capital city, Delhi, has the highest registered motor vehicles in India. Delhi had roughly 6.93 million automobiles on the roads in 2011 and is projected to have 25.6 million by 2030 [62]. The study area experiences a semi-arid climate having four major seasons: Summer/pre-monsoon (March–June), Monsoon (July–Mid-September), Post-monsoon (Mid-September–November), and Winter (December–February). Temperature ranges between 4 °C to 10 °C in winter and 42 °C to 48 °C in summer [63]. In this location, December and January are the two coldest months of the year, and May and June are the two hottest. Despite slight spatial variability, Delhi and the adjacent regions receive the majority of rainfall (about 80 to 85%) during the southwest monsoon season [64]. Except during the monsoon season, the climate in the study area is characterized by low humidity, hot summer, and cold foggy winter [65]. Dust storms and thunderstorms are very common before or during the monsoon season. The studied sites also receive dust pollution via long-range transport processes from the Thar desert and from road dust. The influence of westerlies in the form of winter showers is also a common phenomenon in the studied regions.
3. Results and Discussion
3.1. Variability of Air Pollution
The time series of daily mean PM2.5 and PM10 over Delhi and the adjacent regions during the years 2019, 2020, and 2021 are shown in Figure 2 and Figure 3, respectively. Particulate matters showed great temporal variability with the highest concentration in the winter (highest in November, followed by January/December) and the relatively lower concentration in summer. The lowest annual particulate matter concentration was seen during monsoon seasons over all the studied regions (Figure 2a–d and Figure 3a–d).
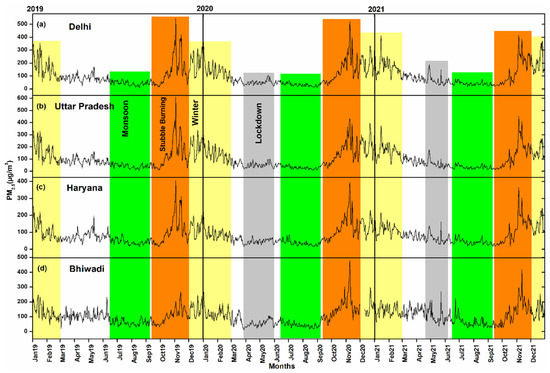
Figure 2.
Graphs showing day to day variations of daily average PM2.5 mass concentration over (a) Delhi, (b) studied regions of Uttar Pradesh, (c) studied regions of Haryana, and (d) Bhiwadi from the year 2019 to 2021. The highlighted grey region represents lockdown periods (25 March to 31 May 2020 and 20 April to 7 June 2021), the green color represents monsoon seasons (July to September), the light yellow color represents winter seasons, and the orange color represents the stubble burning period over the study area.
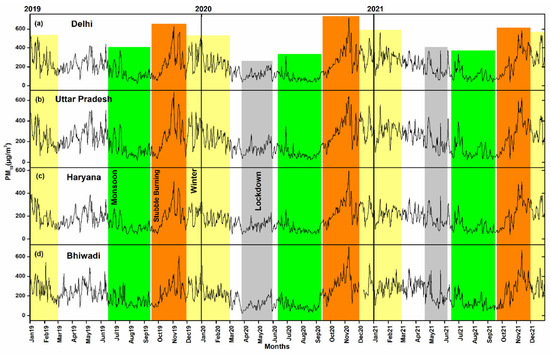
Figure 3.
Graphs showing day to day variations of daily average PM10 mass concentration over (a) Delhi, (b) studied regions of Uttar Pradesh, (c) studied regions of Haryana, and (d) Bhiwadi from the year 2019 to 2021. The highlighted grey region represents lockdown periods (25 March to 31 May 2020 and 20 April to 7 June 2021), the green color represents monsoon seasons (July to September), the light yellow color represents winter seasons, and the orange color represents the stubble burning period over the study area.
The annual average PM2.5 concentration was found to be 108.2 ± 18.5 µg/m3 in 2019 (highest), 94.8 ± 19.2 µg/m3 in 2020 (lowest), and 105.7 ± 21.1µg/m3 in 2021 over Delhi; 108.2 ± 18.4 µg/m3 in 2019 (highest), 98.1 ± 20.5 µg/m3 in 2020, and 97.4 ± 19.7 µg/m3 in 2021 (lowest) over the studied regions of Uttar Pradesh; 84.1 ± 11.2 µg/m3 in 2019, 77.3 ± 13.1 in 2020 (lowest), and 85.2 ± 13.4 µg/m3 in 2021 (highest) over Haryana; and 101.9 ± 10.0 µg/m3 in 2019, 97.7 ± 15.5 in 2020 (lowest), and 111.1 ± 13.2 µg/m3 in 2021 (highest) at Bhiwadi (Table 1). In terms of PM10, the annual average concentration was found to be 217.6 ± 22.8 µg/m3 in 2019 (highest), 180.5 ± 28.4 µg/m3 in 2020 (lowest), and 214.0 ± 28.6 µg/m3 in 2021 over Delhi; 225.6 ± 24.3 µg/m3 in 2019 (highest), 191.2 ± 29.9 µg/m3 in 2020 (lowest), and 221.9 ± 28.9 µg/m3 in 2021 over the studied regions of Uttar Pradesh; 167.5 ± 16.5 µg/m3 in 2019, 162.9 ± 21.4 in 2020 (lowest), and 185.2 ± 21.1 µg/m3 in 2021 (highest) over Haryana; and 224.3 ± 17.5 µg/m3 in 2019, 191.9 ± 28.1 in 2020 (lowest), and 231.3 ± 25.6 µg/m3 in 2021 (highest) at Bhiwadi. The monthly average PM2.5 and PM10 values of the studied regions in all the years are compiled in Table 1.

Table 1.
Compilation of monthly and annual average concentration of pollutants over Delhi, selected. The minimum and maximum in a year are marked with bold.
Monthly averaged particulate matter showed a strong seasonal variation. A significantly higher PM2.5 level was observed particularly during the winter seasons (November–January) in all the considered years. With a few peaks of relatively higher concentration during pre-monsoon seasons, there is a gradual declining trend in PM2.5 mass concentration from the month of February over all the studied sites in all the years. The concentration was further reduced to its lowest level in the monsoon seasons (July to September). The PM2.5 mass concentration shows an increasing trend from October onwards over all the studied sites (Figure 2 and Figure 3). At this time, a significant increase of 205% in 2019, 176% in 2020, and 132% in 2021 was observed in the monthly mean concentration of PM2.5. compared to September. In terms of PM10, several peaks of relatively higher concentration were seen during pre-monsoon/monsoon seasons. PM10 concentration showed a steep increasing trend immediately after the monsoon seasons. A considerable increase of 144% in 2019, 130% in 2020, and 145% in the mean monthly concentration of PM10 was observed over Delhi in the month of October compared to September (Table 1). A similar trend of particulate matter seasonal variability was seen over the studied regions of Uttar Pradesh, Haryana, and Bhiwadi (Figure 2 and Figure 3; Table 1). The increasing trend of particulate matter continues in November and reaches its highest concentration in this month over all the studied regions.
Time series of the daily mean of NOx and CO concentration over Delhi, the studied regions of Uttar Pradesh, Haryana, and Bhiwadi from 2019 to 2021 are plotted in Figure 4a–d and Figure 5a–d. Like particulate matter, the higher concentration of gaseous pollutants during winter starts to decrease with the onset of summer and reaches its lowest level in monsoon depending on the amount of rainfall over the years. The concentration of gaseous pollutants also starts increasing after the monsoon seasons. A significant increase of 113% in 2019, 150% in 2020, and 91% in 2021 in the mean monthly concentration of NOX, and a 60% increment in 2019, 98% in 2020, and 22% in 2021 over Delhi in October compared to September were observed (Table 1). Among all the studied sites, the highest NOX distribution was found in Bhiwadi, followed by Delhi, the studied locations of Uttar Pradesh, and Haryana (Figure 4a–d).
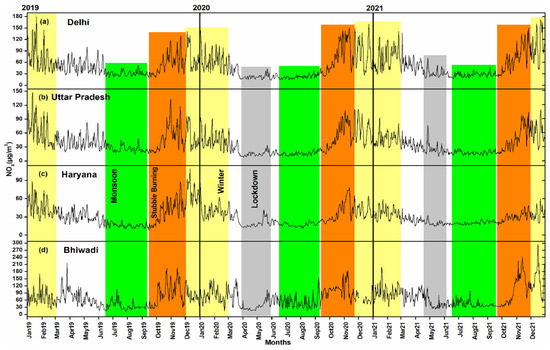
Figure 4.
Graphs showing day to day variations of NOx concentration over (a) Delhi, (b) studied regions of Uttar Pradesh, (c) studied regions of Haryana, and (d) Bhiwadi from the year 2019 to 2021. The highlighted grey region represents lockdown periods (25 March to 31 May 2020 and 20 April to 7 June 2021), the green color represents monsoon seasons (July to September), the light yellow color represents winter seasons, and the orange color represents the stubble burning period over the study area.
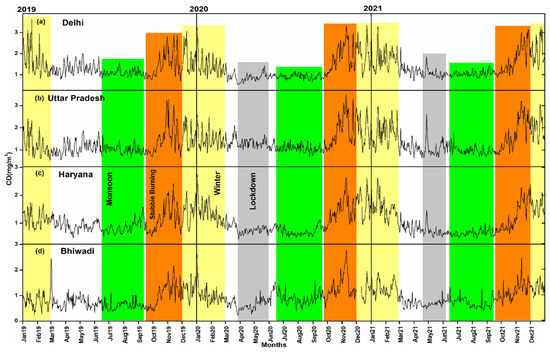
Figure 5.
Graphs showing day to day variations of CO concentration over (a) Delhi, (b) studied regions of Uttar Pradesh, (c) studied regions of Haryana, and (d) Bhiwadi from the year 2019 to 2021. The highlighted grey region represents lockdown periods (25 March to 31 May 2020 and 20 April to 7 June 2021), the green color represents monsoon seasons (July to September), the light yellow color represents winter seasons, and the orange color represents the stubble burning period over the studied area.
The increasing trend of NOx and CO continues in November and relatively higher concentrations persist during the winter seasons. But, unlike particulate matters, the highest NOx concentration was observed during December/January in all the years except during the lockdown year (2020) (Figure 4). In 2020, the highest NOx concentration coincided with the parali burning time (October–November). The highest CO level was seen during the post-monsoon parali burning period over almost all the studied sites except Delhi and Bhiwadi in the year 2019. This year, the highest CO distribution was found during January in Delhi. In 2019, the highest NOx and CO in Bhiwadi was found during the summer season (Figure 4 and Figure 5). The annual average NOx level was found to be 51.9 ± 5.1 µg/m3 in 2019, 47.2 ± 8.1 µg/m3 in 2020 (lowest), and 53.7 ± 8.2 µg/m3 (highest) in 2021 over Delhi; 43.1 ± 4.5 µg/m3 in 2019 (highest), 33.6 ± 6.1 µg/m3 in 2020 (lowest), and 35.3 ± 5.2 µg/m3 in 2021 over the studied regions of Uttar Pradesh; 34.3 ± 0.12 µg/m3 (highest) in 2019, 29.8 ± 3.4 µg/m3 in 2020, and 26.8 ± 2.1 µg/m3 in 2021 (lowest) over Haryana; and 65.1 ± 7.4 µg/m3 (lowest) in 2019, 67.7 ± 11.5 µg/m3 in 2020, and 75.9 ± 11.5 µg/m3 in 2021 (highest) at Bhiwadi. With slight variability among the years, the average annual CO concentration level was found to be 1.4 ± 0.1 mg/m3 in 2019, 1.2 ± 0.1 mg/m3 in 2020 (lowest), and 1.40 ± 0.1 mg/m3 (highest) in 2021 over Delhi, and 1.2 ± 0.1 mg/m3 in 2019 (lowest), 1.4 ± 0.1 mg/m3 in 2020 (highest), and 1.39 ± 0.1 mg/m3 in 2021 over the studied regions of Uttar Pradesh. A slightly lower average annual CO concentration was found over the studied regions of Haryana (1.0 ± 0.1 in 2019, 1.1 ± 0.1 in 2020, and 1.0 ± 0.1 in 2021), and Bhiwadi (0.82 ± 0.1 mg/m3 in 2019, 0.96 ± 0.1 mg/m3 in 2020, and 0.95 ± 0.1 mg/m3 in 2021).
Due to the large data gaps in Haryana and UP, NH3 and SO2 distributions were studied only for Delhi and Bhiwadi from 2019 to 2021. The time series of the daily mean of SO2 and NH3 over Delhi and Bhiwadi are shown in Figure 6a–d. Considerable variation was observed in the mean monthly concentration of SO2 between Delhi and Bhiwadi (Figure 6a,b). A significantly higher SO2 concentration was found in Bhiwadi compared to Delhi in almost all the years. Relatively higher SO2 values were observed during summer/pre-monsoon time, and the lower SO2 concentration was found during monsoon, followed by post-monsoon/winter seasons. In 2020, the SO2 concentration was consistently lower during pre-monsoon (lockdown period) and monsoon seasons in Bhiwadi. In terms of NH3, a relatively higher concentration was found during post-monsoon/winter seasons and a lower NH3 level was observed during pre-monsoon/monsoon seasons (Figure 6c,d). The average annual SO2 level was found to be 14.8 ± 1.2 µg/m3 in 2019 (highest), 13.2 ± 0.7 ± 0.7 µg/m3 in 2020, and 12.1 ± 1.2 µg/m3 (lowest) in 2021 over Delhi, and 31.95 µg/m3 in 2019 (highest), and 30.80 µg/m3 in 2020, and 30.74 in 2021(lowest) over Bhiwadi. In terms of NH3, the annual mean concentration was found to be 37.02 ± 2.1 µg/m3 in 2019, 34.8 ± 2.3 µg/m3 in 2020 (lowest), and 44.4 ± 2.7 µg/m3 (highest) in 2021 over Delhi, and 27.6 ± 4.2 µg/m3 in 2019 (lowest), 39.7 ± 4.1µg/m3 in 2020 (highest), and 37.2 ± 5.3 µg/m3 in 2021 over Bhiwadi (Table 1).
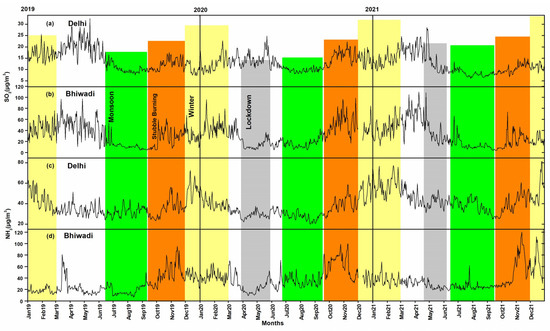
Figure 6.
Graphs showing day to day variations of SO2 over (a) Delhi, (b) Bhiwadi, and NH3 concentration over (c) Delhi and (d) Bhiwadi. The highlighted grey region represents lockdown periods (25 March to 31 May 2020 and 20 April to 7 June 2021), the green color represents monsoon seasons (July to September), the light yellow color represents winter seasons, and the orange color represents the stubble burning period over the study area.
Unlike other pollutants, the monthly mean concentration of O3 exhibited significant variability (increase and decrease) over the studied regions. Figure 7 shows the time series of daily average ozone values over Delhi, Uttar Pradesh, Haryana, and Bhiwadi from 2019 to 2021. Month-wise average O3 distribution shows a strong seasonal variation. In all the years, the O3 level was significantly lower in winter seasons (November–January) and Monsoon seasons (July to September) due to a lesser amount of insolation and cloud cover. The surface ozone concentration starts increasing gradually from March onwards due to the rise in temperature and reaches its maximum concentration during pre-monsoon seasons (May and June). The O3 level starts decreasing in monsoon seasons and reaches its lowest values during peak-monsoon seasons. After the monsoon seasons, the surface O3 level again starts increasing in October (again due to clear sky conditions and a higher amount of insolation), and a further decrease in November and similar lower values continues up to February (Figure 7).
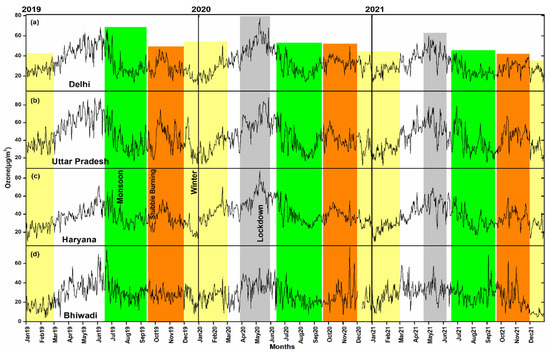
Figure 7.
Graphs showing day to day variations of surface ozone (O3) concentration over (a) Delhi, (b) studied regions of Uttar Pradesh, (c) studied regions of Haryana, and (d) Bhiwadi from the year 2019 to 2021. The highlighted grey region represents lockdown periods (25 March to 31 May 2020 and 20 April to 7 June 2021), the green color represents monsoon seasons (July to September), the light yellow color represents winter seasons, and the orange color represents the stubble burning period over the study area.
An almost similar trend was seen over the studied regions of Uttar Pradesh (Figure 7b) with slight variation in Haryana and Bhiwadi (Figure 7c,d). The average annual surface ozone level was found to be 33.0 ± 3.0 µg/m3 in 2019, 34.5 ± 2.9 µg/m3 in 2020 (highest), and 30.1 ± 2.1 µg/m3 (lowest) in 2021 over Delhi; 45.6 ± 4.1 µg/m3 in 2019 (highest), 43.0 ± 3.6 µg/m3 in 2020, and 41.5 ± 3.2 µg/m3 in 2021 (lowest) over the studied regions of Uttar Pradesh; 34.9 ± 2.5 µg/m3 in 2019 (lowest), 42.7 ± 3.0 µg/m3 in 2020 (highest), and 36.4 ± 2.8 µg/m3 in 2021 over Haryana; and 28.6 ± 2.5 µg/m3 in 2019 (highest), 27.7 ± 1.8 µg/m3 in 2020 (lowest), and 27.1 ± 2.2 µg/m3 in 2021 (lowest) at Bhiwadi. Significant changes were not seen in the average annual O3 surface level over the years. Contrary to Delhi and Bhiwadi, a relatively higher average surface O3 concentration was found over the studied regions of Uttar Pradesh and Haryana in all the years.
The estimated average annual particulate matter concentration (PM2.5 and PM10) over the studied regions were ~2.5 to 3.5 times higher than the National Air Quality Standards (PM2.5: 40 μg/m3) and PM10: 60 μg/m3) (NAQS; http://cpcb.nic.in/airquality-standard). With slight temporal and spatial variability, the above estimates were ~20 times (for PM2.5) and ~15 (for PM10) times higher than the revised annual limits set by the World Health Organization (WHO) for PM2.5 (10 μg/m3) and PM10 (20 μg/m3) [15]. However, the estimated annual average gaseous concentration was either only slightly higher (for NOx) or within (for SO2, and NH3) the National Air Quality Standard (NOx: 40; SO2: 50; and NH3: 100). We also calculated how many days in a year the average concentration of particulate matter fell below the NAQS. For PM2.5, we found 117 days in 2019 (lowest), 172 days in 2020 (highest), and 150 days in 2021 in Delhi, and 120 days in 2019 (lowest), 161 days in 2020 (highest), and 155 days in 2021 in the studied location of Uttar Pradesh. Likewise, there were 140 days (2019, lowest), 185 (2020, highest), and 151 days in the studied site of Haryana, and 78 days in 2019 (lowest), 133 days in 2020 (highest), and 84 days in 2021 in Bhiwadi. In terms of PM10 concentration, the number of days is lower than the fine particulate matter (PM2.5). For PM10, 64, 112, and 75 days were observed in Delhi; 63, 102, and 82 days in the studied location of Uttar Pradesh; 76, 103, and 81 days in the studied sites of Haryana; and 33, 101, and 48 days in Bhiwadi. Like PM2.5, the highest number of days when PM10 was under the National Air Quality Standard was observed in 2020 only. The majority of these days, when the particulate matter concentration was under the NAQS category, were found during summer seasons (Monsoon/pre-monsoon).
A combination of many factors was behind the high particulate matter, and most of the gaseous pollutants’ levels during post-monsoon and winter seasons, including prolonged and intense stubble burning in the neighboring states (Punjab and Haryana), which coincided with the setting off of fireworks and a meteorological event. During this time, the unfavorable meteorological conditions (lower temperature, lower planetary boundary layer (PBL) height, and very low amount of rainfall) restrict vertical turbulent transport and increase the surface pollution level [66,67]. After the stubble burning stopped (November end), there was a slight reduction in particulate matter, and this trend continues up to January. As the temperature starts increasing in summer, the height of PBL increases, which enhances the convection and eventually the reduction in particulate matter and gaseous pollutants concentration over the study area. In monsoon seasons, rainwater washes out (wet scavenging) the atmospheric pollutants and improves the air quality significantly over the study area [68].
Several peaks of a relatively higher PM10 concentration during pre-monsoon/monsoon seasons compared to PM2.5 clearly suggest the natural source of pollution. Frequent occurrences of dust storms are a very common phenomenon during this time over the studied sites and could be the possible source of higher coarse particulate matter. The higher SO2 concentration in Bhiwadi compared to Delhi is obvious due to (a) Bhiwadi is a well-known industrial site, and (b) there is only one monitoring station in Bhiwadi. However, for Delhi, we have used the average SO2 values of 35 monitoring stations including industrial and nonindustrial sites. This explanation also applied for the other pollutants’ variability. Using only one or two air quality monitoring station data of Bhiwadi and an average value of 35 monitoring stations of Delhi, a recently published World Air Quality report (2022) [69], which claimed that Bhiwadi is the most polluted city in the world. Our research unequivocally shows that Delhi has the highest levels of pollution among all cities. Further details on this matter will be presented in the upcoming sections.
The cause of the relatively lower pollutants’ concentration after the lockdown till September was attributed to higher rainfall and a greater number of rainy days in 2020 compared to 2019 and 2021. From October onwards, the pollution level was higher in 2020 compared to 2019 and 2021 due to intensive stubble burning, firecracker activities, and unfavorable meteorological conditions. In 2020, farm fires started early and continued till late November. In addition, in the year 2019, Diwali was early (27 October) as compared to the 2020 (14 November).
3.2. Lockdown Activities
Due to the spread of the COVID-19 pandemic, four phase-wise lockdowns were implemented in India from 25 March to 31 May 2020. A significant reduction in almost all the pollutants level was noted during the lockdown 2020 period. Despite a significant monthly variation, a considerable dip in average monthly PM2.5 was observed in 2020 compared to 2019 (pre-lockdown) and 2021 (post-lockdown). But, it has been noted here that pollutant levels were already lower (improved) in 2020 over Delhi before the implementation of the lockdown (1 March to 23 March 2020) (PM2.5 = 65.36 µg/m3, PM10 = 206.8 µg/m3, NOx = 58 µg/m3, CO =1.29 mg/m3, SO2 = 13.4 µg/m3, and NH3 = 38.6 µg/m3) compared to 2019 (PM2.5 = 83.79 µg/m3, PM10 = 243.7 µg/m3, NOx = 64.5 µg/m3, CO = 1.5 mg/m3, SO2 = 16.7 µg/m3, and NH3 = 54.7 µg/m3) and 2021 (PM2.5 = 99.46 µg/m3, PM10 = 285.7 µg/m3, NOx = 70 µg/m3, CO = 1.64 mg/m3, SO2 = 15.8 µg/m3, and NH3 = 56.3 µg/m3). Over Delhi, during this period, the levels of PM2.5 were 22% and 35% lower, and PM10 was 15% and 27% lower than the levels recorded in 2019 and 2021, respectively. Likewise, NOX was 10% and 7%, CO was 14% and 21%, SO2 was 20% and 15%, and NH3 was 30% lesser than 2019 and 2021, respectively. A similar reduction in pollutant concentration was observed over the studied regions of Uttar Pradesh, Haryana, and Bhiwadi (Table 2).

Table 2.
Monthly and annual changes in pollutant concentration in terms of percentage during the years 2019 and 2021 compared to 2020 (lockdown year).
The implementation of the lockdown coincides with favorable meteorological conditions, further reducing the pollutants’ concentration over Delhi and the adjacent regions. During the first phase of the lockdown (25 March to 14 April 2020), PM2.5 concentration showed a significant reduction of 54% compared to 2019, and 48% compared to 2021 over Delhi. During the second phase of the lockdown (15 April to 3 May 2020), a similar reduction of 40% and 48% compared to 2019 and 2021, respectively, was observed. In terms of PM10, a significant reduction of more than 60% and 50% during the first and second phases of the lockdown was observed (Table 2). During the third phase of the lockdown, between 4 May to 17 May 2020, no considerable changes in particulate matter concentration were noticed compared to 2021, but there was a significant reduction of 50% for PM2.5 and 59% for PM10 compared to 2019. During the last phase of the lockdown of 2020 (18 to 31 May), the influence of the lockdown was not reflected in PM2.5 distribution over Delhi. During this time, a slight reduction of 16% was noticed compared to 2019, with a 26% increment compared to 2021.
NOx concentration showed a significant reduction of 65% during the first phase, 56% and 39% during the second phase, 63% and 31% during the third phase, and 52% and 16% during the last phase of the lockdown compared to 2019 and 2021, respectively, in Delhi (Table 2). In terms of CO, there was a 49% and 41% reduction during the first phase, 36% and 22% during the second phase, 40% and 18% during the third, and a 21% reduction and 12% increment during the last phase of the lockdown compared to 2019 and 2021. NH3 showed a considerable dip of 28% and 40% during the first phase of the lockdown in 2020 compared to 2019 and 2021, respectively, in Delhi. During the latter phases of the lockdown, there was no considerable reduction in NH3 compared to 2019, but there was a marked reduction of 33% during the last two phases. SO2 concentration also showed a decreasing trend in all the phases compared to 2019, with the highest reduction in the initial phases (37% and 39% in the I and II phases) than in the later phases (32% and 14% in the III and IV phases). The SO2 level was found to decrease during the first two phases of the lockdown compared to 2021 (~30%) (Table 2). Unlike other pollutants, the O3 concentration was slightly decreased in the first phase of the lockdown (7%), followed by a slight increment in the second phase (4%) to a considerable increment of 28% during the third phase of the lockdown in Delhi compared to the 2019 data. However, compared to 2021, a slight increment in O3 was seen in Delhi (Table 2). Almost similar, but a variable trend of reduction in pollutant concentration was observed over the other studied regions of UP, Haryana, and Bhiwadi. Over the studied regions of Uttar Pradesh, the reduction is slightly more than Delhi. Here, a significant reduction of PM2.5: 58% and 47%, PM10: 63%, and NOX: 70% and 63% during the first phase, and PM2.5: 34% and 39%, PM10: 48%, and NOx: 62% and 52% during the second phase of the lockdown in 2020 compared to 2019 and 2021, respectively, was observed. In the third phase of the closure at UP, PM2.5, PM10, and NOx levels were reduced by 53%, 65%, and 69%, respectively, compared to 2019 and 2021 (Table 2). The effect of the lockdown was not seen in CO concentration in UP (15% to 30% increase during the initial phases of the lockdown). Over the studied sites of Uttar Pradesh, the O3 level slightly dipped in the first phase (11% and 6%), with a considerable reduction in the second phase (20%), followed by a slight increment of 4% in the third phase of the lockdown compared to 2019. Over Haryana, a reduction of PM2.5: 52%, PM10: 57% and 61%, NOX: 54% and 38%, and CO: 29% and 20% during the first phase and PM2.5: 41% and 43%, PM10: 43% and 46%, NOx: 51% and 28%, and CO: 8% and 12% was observed during the second phase of the lockdown in 2020 compared to 2019 and 2021, respectively (Table 2). Furthermore, a considerable reduction of 50% in terms of particulate matter and a slight reduction close to 20% for NOX and CO during the third phase of the lockdown was noted over the studied sites in Haryana (Table 2). During the first to third phases of the lockdown in 2020, O3 concentration was observed to rise by 26%, 38%, and 76%, respectively, compared to 2019 (Table 2). At this time in Haryana, no considerable changes in the O3 values were seen in 2021. The distribution of pollutant concentration showed that the influence of the lockdown was highest over Bhiwadi, particularly during the first two phases of the lockdown. During the first lockdown phase, a significant dip of 64% and 74% in PM2.5, 70% and 77% in PM10, 73% and 69% in NOx, 38% and 35% in CO, and 29% and 48% in NH3 concentration compared to 2019 and 2021, respectively, was observed. Similarly, a considerable reduction of 57% and 67% in PM2.5, 65% in PM10, 65% and 68% in NOx, 41% and 17% in CO, and 23% and 53% in NH3 concentrations compared to 2019 and 2021, respectively, during the second phase of the lockdown was observed (Table 2). SO2 concentration was found to decrease significantly in Bhiwadi during all the lockdown phases of 2020 compared to the pre-lockdown (2019) and post-lockdown years (2021). Here, a reduction of 74% and 80% in the I phase, ~85% in the II phase, 65% and 47% in the III phase, and 52% and 5% in the IV phase of the lockdown was observed (Table 2). No considerable changes in O3 were seen during the different phases of the lockdown in Bhiwadi (Table 2).
A variable but declining trend in the PM2.5 level following the lockdown period continues up to June, July, and August over Delhi and the adjacent regions in 2020 compared to 2019 and 2021. During these months, there is a reduction of PM2.5 (26% and 10% in June, 26% and 12% in July, and 29% and 38% in August over Delhi; 29% and 11% in June, 17% and 7% in July, and 20% and 36% in August over the studied regions of Haryana; and 30% and 36% in June, 19% and 14% in July, and 42% and 40% in August over Bhiwadi) compared to 2019 and 2021, respectively (Table 2). Over the studied regions of Uttar Pradesh, a reduction of 28% in June, 27% in July, and 33% in August was observed in 2020 compared to 2019, and an increment of 7% in June and 2% in July 2020 compared to 2021 was observed (Figure 2 and Figure 3; Table 2). Likewise, the decreasing trend of the mean monthly concentration of PM10 in 2020 compared to 2019 and 2021 continued even after the lockdown. Here, a considerable reduction of 42% and 22% in June, 45% and 28% in July, and a 33% and 50% were noticed over Delhi. Similar but relatively less variation was observed over the studied regions of Uttar Pradesh (44% and 18% dip in June, 42% and 30% reduction in July, and 37% and 51% reduction in August), Haryana (28% and 16% dip in June, 14% and 8% decrease in July, and 27% and 41% decrease in August), and Bhiwadi (37% and 30% reduction in June, 37% and 24% dip in July, and 45% and 46% reduction in August) in 2019 and 2021, respectively (Figure 2 and Figure 3; Table 2). Our results suggest a considerable reduction of 16% and 6% in terms of the annual average PM2.5, and 18% and 12% in terms of the annual mean PM10 levels in 2020 compared to 2019 and 2021, respectively. The monthly and annual average changes in the concentration of particulate matter in 2019 and 2021 compared to 2020 are compiled in Table 2.
Like particulate matter, the decreasing trend of NOx levels continued over Delhi (45% in June, 30% in July, and 29% in August) and UP (50% in June and July, and 38% in August) in 2020 compared to 2019 (Figure 3). However, during the same period, the observed concentration of NOx was higher over Haryana (17% in June, 4% in July, and 29% in August) and Bhiwadi (66%, 27%, and 42% in June, July, and August, respectively). Compared to 2021, a slight reduction in the NOX level (23% in June, 19% in July, and 20% in August) over Delhi, (20% in June, 16% in July, and only 1% in August over UP) was observed in 2020. Over Haryana and Bhiwadi, variable changes were observed in the NOx concentration (Figure 4 and Table 2). Compared to 2021, there was a 15% increment in June and a 10% and 7% fall in July and August, respectively, over Haryana, and a 40%, 1%, and 17% increment over Bhiwadi in 2021. In terms of CO, the decreasing trend continued after the lockdown (20% and 8% in June, 17% and 9% in July, and 17% and 13% in August compared to 2019 and 2021, respectively. Over the studied sites in UP, there was a decrease of only 3% and 10% in June, followed by an increment of 10% and 18% in July and 5% and 13% in August 2020 compared to 2019 and 2021, respectively. Similarly, a variable change in the monthly mean CO concentration was observed in Haryana and Bhiwadi (Table 2). Unlike other pollutants, a decreasing trend for NH3, SO2, and O3 after the lockdown was not seen in any of the years (except in 2021 for NH3) (Table 2). After the monsoon seasons and the onset of winter, the concentration of particulate matter and gaseous pollutants increases significantly (several folds), as shown in Table 1 and Table 2 and briefed in the previous sections. In terms of the average annual concentration, our results suggest a considerable reduction of 12% and 13% in NOx levels in Delhi, and 24% and 7% over the studied location of Uttar Pradesh in 2020 compared to 2019 and 2021, respectively. The annual mean NOx concentration was found to be higher in Bhiwadi in 2020 (16% and 7% compared to 2019 and 2021). There were only slight changes over Haryana in the NOx annual average level (5% decrease in 2019 and 10% increase in 2021 compared to the 2020 estimates. The variations in the monthly and annual average concentrations of particulate matter and gaseous pollutants in 2020 compared to 2019 and 2021 over Delhi and the studied regions of UP, Haryana, and Bhiwadi are compiled in Table 2.
In 2021, the government again imposed a lockdown from 19 April to 07 June 2021 over Delhi NCR. During this period also (Figure 2, Figure 3, Figure 4, Figure 5, Figure 6 and Figure 7), there was a considerable reduction of 25% in PM2.5, 34% in PM10, 39% in NOX, 24% in CO, 19% in NH3, 37% in SO2 and 13% in O3 concentrations over Delhi compared to the non-lockdown year (2019). Likewise, a reduction of 29% in PM2.5, 34% in PM10, 41% in NOX and 19% in O3 over the studied regions of UP. During this time, the influence of lookdown was not strong in the studied regions of Haryana and Bhiwadi. A slight reduction of close to 25% in PM, 29% in NOx and 25% in CO with a slight increment of 10% in O3 concentration. Similarly, 7% reduction in PM2.5, 23% reduction in PM10, 20% reduction in NOx, and 17% in O3 with a significant increment of 50% in NH3 concentration compared to the non-lockdown year (2019).
Meteorology played an important role in emission reduction during the lockdown, in particular, and seasonal, in general. By comparing the pre-lockdown (2019), lockdown (2020), and post-lockdown years’ (2021) analysis, we found that the concentration of atmospheric pollutants was already lower (20% to 30%) due to a significantly higher amount of rainfall in March 2020 (81.1 mm; 500% more than the non-lockdown years) compared to March 2019 (13.4 mm) and March 2021 (5.4 mm). The rainfall was relatively higher in May 2020 (44.3 mm) compared to May 2019 (24.4 mm) and significantly lower compared to May 2021 (123 mm). No significant differences in the monthly average temperature were seen in 2020 compared to 2019. However, a slightly higher temperature was observed in March 2021 (25.6 °C) compared to 2020 (20.8 °C) and 2019 (21.1 °C). Also, the study area experienced relatively more dust storm incidents in 2019 compared to 2020 during the lockdown period. Thus, our results suggest that the lockdown’s impact in Delhi NCR was not as significant as prior workers had stated. It was found that the pollutants were greatly reduced only during the first two phases of the lockdown by comparing the air pollution figures from the year before the lockdown (2019) and the year after the lockdown (2021), as well as the rainfall estimates.
After careful evaluation, our findings suggest that the concentration of gaseous pollutants (apart from surface ozone) decreased by only 20–30% during the initial phases of the lockdown. The amount of ozone at the surface, however, increased even as the other contaminants were reduced. Thus, the concentration of air pollutants over Delhi NCR during the lockdown period of 2020 was significantly lowered due to minimum anthropogenic activities as well as favorable meteorological conditions (especially rainfall) before and during the lockdown, as well as by minimum anthropogenic activities.
3.3. Spatial Variability
Significant spatial variability is clearly seen in month-wise averaged PM2.5 distribution maps in 2019, 2020, and 2021. In all the years, despite considerable seasonal variation, the highest pollution concentration was mostly found in the North and East Delhi regions (DTU, Bawana, and Jahangirpuri), Ghaziabad, Noida, Faridabad, IMT-Manesar, and Bhiwadi (Figure 8a–c).
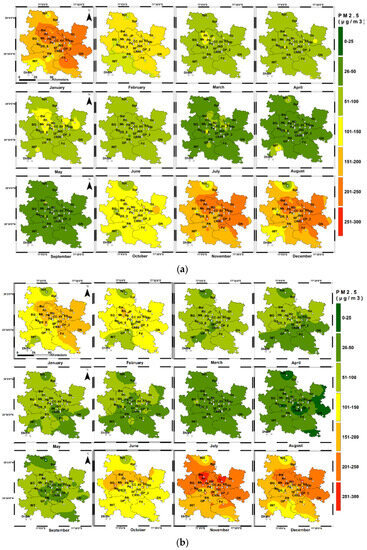
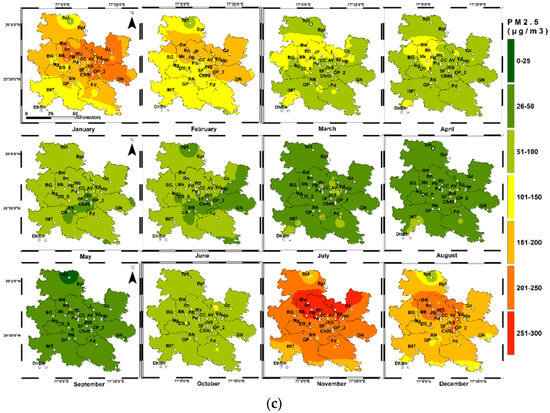
Figure 8.
Map showing the month-wise spatial distribution of PM2.5 over the study area (Delhi NCR) in (a) 2019, (b) 2020, and (c) 2021.
The concentration of PM2.5 varies from 82.5 ± 3.6 µg/m3 over Pusa Road/Bahadurgarh to 134.8 ± 5.6 µg/m3 at Wazirpur in 2019 and from 46.7 ± 8.2 µg/m3 at Sonipat to 124.2 ± 5.8 µg/m3 over Bahadurgarh in 2020. In 2021, the lowest concentration was seen over Shadipur (76 ± 2.9 µg/m3) and the highest over Jahangirpuri (136 ± 6.3 µg/m3). Higher concentration and variability were seen during winter seasons and lower variability and concentration during summer, particularly in monsoon (Figure 8a–c). Among the studied locations of Delhi NCR, the most polluted sites in terms of PM2.5 was found to be Wazirpur (134.8 ± 5.6 µg/m3), followed by Bawana (130.8 ± 5.2 µg/m3), Rohini (128.1 ± 5.4 µg/m3), Anand Vihar (128.4 ± 5.4 µg/m3), and Jahangirpuri (128.0 ± 5.0 µg/m3) in 2019. Vasundhara was the most polluted site in UP in 2019.
In 2020, the most polluted sites were Bahadurgarh (124.2 ± 5.8 µg/m3), Jahangirpuri (122.7 ± 5.7 µg/m3), Loni (119.7 ± 5.6 µg/m3), Bawana (119.1 ± 5.2 µg/m3), and Rohini (115.8 ± 5.2 µg/m3). In 2021, the most polluted site was Loni (138.2 ± 5.9 µg/m3), Jahangirpuri (136.2 ± 6.3 µg/m3), Mundka (130.4 ± 5.6 µg/m3), Anand Vihar (129.2 ± 5.1 µg/m3), and Bawana (128.5 ± 4.9 µg/m3). The most polluted site in Haryana was found to be Sector 51 Gurugram (112.1 ± 4.9 µg/m3) in 2021. The annual average PM2.5 over Bhiwadi was found to be 102 ± 2.4 µg/m3 in 2019, 97.6 ± 3.4 µg/m3 in 2020, and 111.2 ± 3.0 µg/m3, which is much lesser than the average PM2.5 concentration in most of the locations in Delhi.
Unlike PM2.5, relatively less spatial variability was observed in the PM10 mass concentration during the three years over the study area (Figure 9a–c) The higher concentration of PM10 was mostly found in the North and East Delhi regions (Bawana, Jahangirpuri, Wazirpur, Mundka, Rohini, and Anand Vihar), Ghaziabad (Loni and Vasundhara), Greater Noida, Faridabad, Gurugram and Bhiwadi, which can be clearly seen in Figure 9.
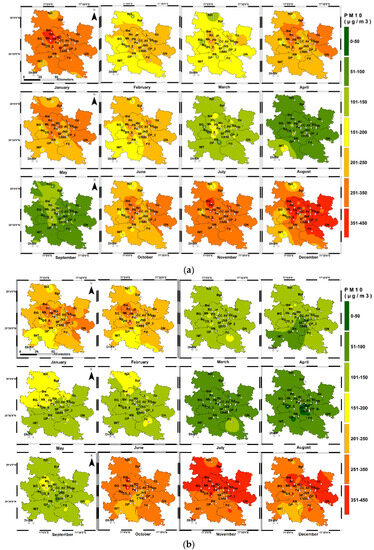
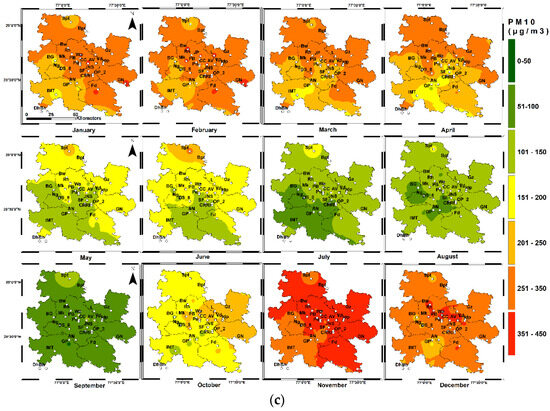
Figure 9.
Map showing the month-wise spatial distribution of PM10 over the study area (Delhi NCR) in (a) 2019, (b) 2020, and (c) 2021.
Relatively higher concentration and variability were seen during winter seasons and lower variability and concentration during summer (particularly in monsoon) (Figure 9a–c). Among the studied locations of Delhi NCR, the most polluted sites in terms of PM10 was found to be Dwarka Sector 8 (294.7 ± 7.1 µg/m3), followed by Wazirpur (286.9 ± 7.2 µg/m3), Sirifort (282.5 ± 6.5 µg/m3), Mundka (281.2 ± 7.9 µg/m3), and Anand Vihar (273.2 ± 7.7 µg/m3) in 2019. During this time, Loni (265 ± 8.8 µg/m3) was the most polluted site in Uttar Pradesh and Gwal Pahari and Gurugram (189.5 ± 6.2 µg/m3) in Haryana. In 2020, the most polluted sites were Loni (231.63 ± 7.7 µg/m3), Park 5-Greater Noida (226.87 ± 7.7 µg/m3), Bawana (227.22 ± 7.5 µg/m3), Jahangirpuri (224.94 ± 8.0 µg/m3), and Mundka (224.66 ± 7.4 µg/m3). During this time, Panipat (206.16 ± 5.7 µg/m3) was the most polluted in PM10 levels. In 2021, the most polluted site was Chandni Chowk (301.5 ± 7.9 µg/m3), Anand Vihar (274.4 ± 7.8 µg/m3), Loni (267.1 ± 7.7 µg/m3), Wazirpur (265.7 ± 9.3 µg/m3, ten months average), Mundka (260.4 ± 7.4 µg/m3), and Dwarka Sector 8 (250.6 ± 7.2 µg/m3) in 2021. During this time, the new industrial town, Faridabad, was the most polluted in Haryana. The annual average PM10 over Bhiwadi was found to be 224.3 ± 5.0 µg/m3 in 2019, 191.8 ± 6.1 µg/m3 in 2020, and 231.3 ± 5.7 µg/m3 in 2021, which is much lesser than the average PM10 concentration over most of the locations in Delhi and UP.
Like particulate matter, the spatial distribution of the monthly average NOx level shows considerable variability (Figure 10a–c). Higher NOx concentration with lesser variability was in winter seasons, and less concentration with relatively more variability in summer seasons over the study area. In 2019, the highest annual average NOX concentration was seen at Anand Vihar (126.98 ± 3.6 µg/m3), followed by CRRI Mathura Road (98.79 ± 3.8 µg/m3), JN stadium (84.3 ± 2.9 µg/m3), IGI Airport (81 ± 3.1 µg/m3), and MCDN stadium (79.6 ± 2.9 µg/m3). In 2019, the highest NOx concentration was over Indirapuram (60.50 ± 2.1 µg/m3) in UP and in Panipat (62.17 ± 3.5 µg/m3) in Haryana.
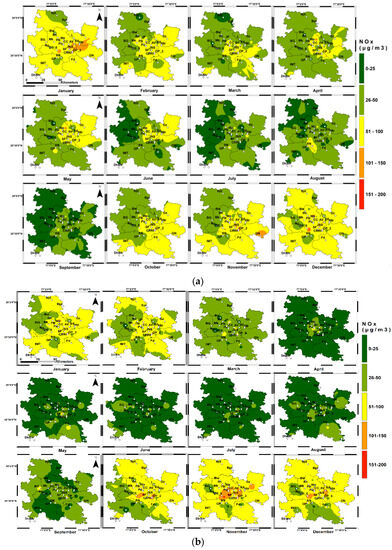
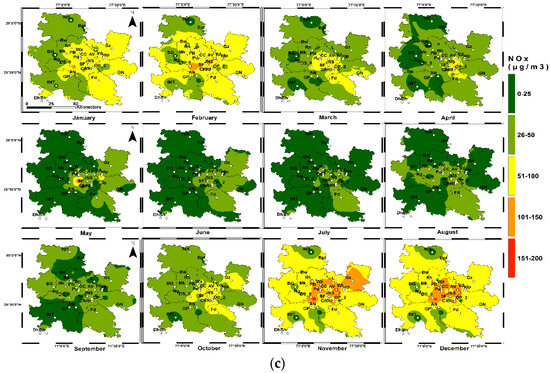
Figure 10.
Map showing the month-wise spatial distribution of NOx over the study area (Delhi NCR) in (a) 2019, (b) 2020, and (c) 2021. High-quality images can be retrieved from the previous version of the revised manuscript.
In 2020, the highest annual average NOx concentration was seen at CRRI Mathura Road (94.7 ± 4.0 µg/m3), followed by Anand Vihar (81.4 ± 3.5 µg/m3), IGI Airport (72.5 ± 3.4 µg/m3), Jahangirpuri (66.3 ± 2.7 µg/m3), and MCDN stadium (64.8 ± 3.5 µg/m3). In 2021, the highest annual average NOx concentration was seen at Anand Vihar (123.1 ± 3.9 µg/m3), followed by CRRI Mathura Road (112.6 ± 4.6 µg/m3), IGI Airport (97.5 ± 4.9 µg/m3), MCDN stadium (81.1 ± 3.2 µg/m3), and Pusa Road (72 ± 4.0 µg/m3). The annual average NOx concentration over Bhiwadi was found to be 65.1 ± 1.9 µg/m3 in 2019, 67.7 ± 1.8 µg/m3 in 2020, and 75.2 ± 2.5 µg/m3 in 2021, which is much lesser than the average NOx concentration over most of the locations in Delhi.
Like other pollutants, a relatively higher concentration of CO was seen mostly in winter and a relatively lower concentration during summer (Figure 11a–c). The highest annual average concentration was found over North Campus Delhi University (2.22 ± 0.07 mg/m3), followed by Anand Vihar (2.16 ± 0.04 mg/m3), JN stadium (1.91 ± 0.04 mg/m3), Jahangirpuri (1.92 ± 0.03 mg/m3), and Punjabi Bagh (1.73 ± 0.03 mg/m3) in 2019.
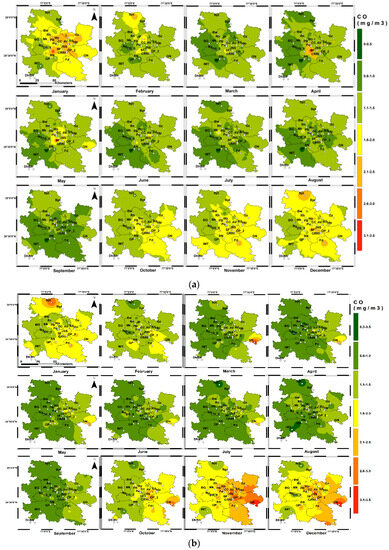
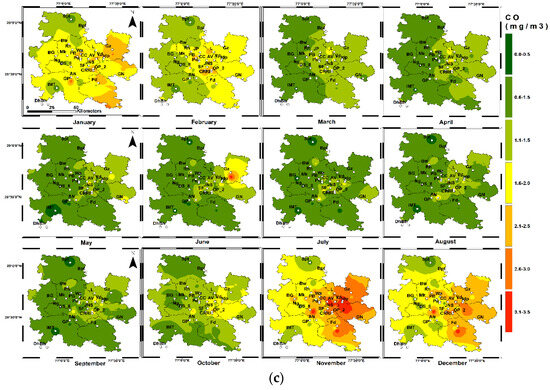
Figure 11.
Map showing the month-wise spatial distribution of CO over the study area (Delhi NCR) in (a) 2019, (b) 2020, and (c) 2021. High-quality images can be retrieved from the previous version of the revised manuscript.
In 2020, the highest CO pollutants’ concentration was over Park 3-Greater Noida (2.320.03 mg/m3), followed by Anand Vihar (2.28 ± 0.05 mg/m3), ITO (2.26 ± 0.06 mg/m3), Sector 1 Noida (1.95 ± 0.01 mg/m3), and Wazirpur (1.95 ± 0.04 mg/m3). However, in 2021, CRRI Mathura Road (2.33 ± 0.06 mg/m3) was the most polluted site in terms of CO pollutants, followed by ITO (2.21 ± 0.07 mg/m3), Anand Vihar (2.17 ± 0.03 mg/m3), IGI Airport (1.84 ± 0.07 mg/m3), and Sector 62 Noida (1.95 ± 0.06 mg/m3). The average annual CO concentration over Bhiwadi was found to be 0.82 ± 0.01 mg/m3 in 2019, 0.96 ± 0.02 mg/m3 in 2020, and 0.95 ± 0.34 mg/m3 in 2021, which is much lesser than the average CO concentration over most of the locations in Delhi (Table 1).
The highest surface O3 concentration was seen over Loni (55.16 ± 0.01 ten months average), followed by Baghpat/Bulandshahar (52.0 ± 1.13 µg/m3), Najafgarh (50.0 ± 1.39 µg/m3), Faridabad Sector 16A (49.73 ± 1.26 µg/m3), and Sri Aurobindo Park (48.8 ± 1.49 µg/m3) in 2019 over the study area. In 2020, the highest surface O3 concentration was found over Sirifort (69.58 ± 2.01 µg/m3), followed by Bahadurgarh (65.0 ± 1.01 µg/m3), Dr. Karni Singh Shooting Range (DKSSR) (65.7 ± 1.31 µg/m3), Sector 16A, Faridabad (58.8 ± 1.36 µg/m3), and Bulandshahar (57.1 ± 1.08 µg/m3). The highest pollutant sites in terms of the surface ozone concentration during 2021 were found to be Sector 16A, Faridabad (68.88 ± 1.96 µg/m3), Rohtak (53.46 ± 1.48 µg/m3), East Arjun Nagar (52.9 ± 1.77 µg/m3), DKSSR (52.6 ± 1.20 µg/m3), and Bulandshahar (51.4 ± 1.07 µg/m3). In 2019, the average annual O3 concentration over Bhiwadi was 28.65 ± 0.59 µg/m3. In 2020, it was 27.79 ± 0.55 µg/m3, and in 2021, it was 27.07 ± 0.58 µg/m3. These concentrations were significantly lower than the annual average surface ozone concentration measured in most locations in Delhi, Uttar Pradesh, and Haryana. (Table 1). Most of the locations with relatively higher or the highest pollutant concentration (particulate matters, NOX, and SO2) were found in industrial/residential sites in all the years considered (Figure 9, Figure 10 and Figure 11). This trend clearly suggests a strong influence of industrial pollution on the air quality over Delhi NCR. Additionally, these already polluted areas became worse throughout the winter because of additional pollutants and smoke from parali burning, fireworks, and unfavorable meteorological conditions.
In terms of PM2.5 distribution, Wazirpur (Delhi), Bahadurgarh (Haryana), and Loni (Ghaziabad) were the most polluted sites in 2019, 2020, and 2021, respectively. In terms of PM10, Dwarka Sector 8 (Delhi) in 2019, Loni (Ghaziabad) in 2020, and Chandni Chowk (Delhi) were the most polluted sites. Anand Vihar, in 2019 and 2021, and CRRI Mathura road were the most polluted sites in terms of the average annual NOX concentration. According to our findings, the location of Bhiwadi did not exhibit the highest levels of pollution in regard to both particulate matter and gaseous pollutants in 2021. This contrasts with the assertions made in the IQ Air report from 2022 [69].
4. Conclusions
The present study examined the temporal and spatial variability of seven pollutants (PM2.5, PM10, NOx, CO, NH3, SO2, and O3), over Delhi and the adjacent regions from 2019 to 2021. We have also analyzed the variability of the concentration of pollutants during the pre, lockdown, and post-lockdown periods of the year 2019, 2020, and 2021. We summarized the findings of the present work as follows:
- There was a significant temporal and spatial variability in the particulate matter and gaseous pollutants concentrations over the Delhi NCR regions. The highest pollutant concentration was during winter while the lowest was during the summer (least in monsoon), suggesting the strong influence of meteorology on the atmospheric pollutants’ variability. Our estimates are in close agreement with other studies [70,71]. Among the three years, 2020 was the least polluted year compared to 2019 and 2021.
- There was a considerable reduction of more than 10% in terms of annual average PM2.5, 15% in annual average PM10 levels, and 10% in annual average NOx level in 2020 compared to 2019 and 2021, respectively, over Delhi.
- Our findings suggest that the lockdown’s impact in Delhi NCR was not as significant as earlier workers had claimed via a direct comparison of the pre- and lockdown year. By comparing air pollution statistics from the year before (2019) and the year after the lockdown (2021), as well as the rainfall estimates, it was found that the pollutants were significantly reduced only during the first two phases of the lockdown. In due consideration, our findings imply that the concentration of particulate matter and gaseous pollutants (except surface ozone) fell only 30% during the first stages of the lockdown due to COVID-19 restrictions. However, even as other pollutants decreased, the concentration of ozone at the surface increased.
- The concentration of atmospheric pollutants was already lower (20% to 30%) due to favorable meteorological conditions for pollution dispersion before the lockdown started in 2020. Furthermore, a significantly higher amount of rainfall in March 2020 (>500% more than 2019 and 2021), May 2020 (80% more rainfall compared to 2019), and a greater number of rainy days in these two months considerably reduced the pollutant concentration over the study area. Our findings are supported by a recently published report by the Commission for Air Quality Management on 31 July 2023 [72]. According to this report, the average value of particulate matter from January to July 2023, (which was not a lockdown year) almost exactly matches with the average value of particulate matter in 2020 (lockdown year) during the same time period.
- In terms of PM2.5 mass concentration, Wazirpur in Delhi, Bahadurgarh in Haryana, and Loni in Ghaziabad were the most polluted sites in 2019, 2020, and 2021, respectively. In terms of PM10, Dwarka Sector 8 in Delhi, Loni in Ghaziabad, and Chandni Chowk in Delhi were the most polluted sites in 2019, 2020, and 2021, respectively.
- The most polluted sites in terms of particulate matter and gaseous pollutants distribution were in Delhi only in all three years (2019–2021).
- Bhiwadi was not the most polluted site both in terms of particulate matter and gaseous pollutants in 2021, which is contrary to what was recently claimed by IQ Air report, 2022.
Author Contributions
Conceptualization, A.A.K.; Data curation, A.A.K. and K.G.; Formal analysis, K.G.; Funding acquisition, P.J.; Investigation, K.G.; Methodology, A.A.K. and P.J.; Project administration, P.C.S.D. and S.T.; Resources, K.G. and S.T.; Supervision, P.B.S.; Visualization, A.A.K. and P.J.; Writing—original draft, A.A.K.; Writing—review and editing, P.J. and P.C.S.D. All authors have read and agreed to the published version of the manuscript.
Funding
The APC was funded by the Delft University of Technology.
Institutional Review Board Statement
Not Applicable.
Informed Consent Statement
Not Applicable.
Data Availability Statement
The datasets generated during and/or analyzed during the current study are available on the CPCB portal (https://app.cpcbccr.com/ccr/#/caaqm-dashboard/caaqm-landing/data).
Acknowledgments
The above study was possible due to the vision, kind support, and encouragement from Aseem Chauhan, the Honorable Chancellor of Amity University Haryana (AUH), Manesar-Gurugram. The authors would like to express their sincere gratitude to CPCB and NASA’s Giovanni for providing data through their website. The authors are highly grateful to the editor and anonymous reviewers for their critical comments and valuable suggestions which improved the clarity and quality of the original manuscript.
Conflicts of Interest
The authors declare no conflict of interest.
References
- Ukaogo, P.O.; Ewuzie, U.; Onwuka, C.V. Environmental pollution: Causes, effects, and the remedies. In Microorganisms for Sustainable Environment and Health; Elsevier: Amsterdam, The Netherlands, 2020; pp. 419–429. [Google Scholar]
- WHO. 2018. Available online: https://www.who.int/news/item/02-05-2018-9-out-of-10-people-worldwide-breathe-polluted-air-but-more-countries-are-taking-action (accessed on 2 May 2023).
- Lee, K.; Greenstone, M. Air Quality Life Index; Annual Update; University of Chicago: Chicago, IL, USA, 2021. [Google Scholar]
- Zhang, L.; Ou, C.; Magana-Arachchi, D.; Vithanage, M.; Vanka, K.S.; Palanisami, T.; Kirkham, M.B. Indoor particulate matter in urban households: Sources, pathways, characteristics, health effects, and exposure mitigation. Int. J. Environ. Res. Public Health 2021, 18, 11055. [Google Scholar] [CrossRef]
- Fierro, M. Particulate matter. Air Info Now 2000, 1–11. [Google Scholar]
- Brunekreef, B.; Holgate, S.T. Air pollution and health. Lancet 2002, 360, 1233–1242. [Google Scholar] [CrossRef]
- Jenkin, M.E.; Clemitshaw, K.C. Ozone and other secondary photochemical pollutants: Chemical processes governing their formation in the planetary boundary layer. Atmos. Environ. 2000, 34, 2499–2527. [Google Scholar] [CrossRef]
- Calvert, J.G.; Orlando, J.J.; Stockwell, W.R.; Wallington, T.J. The Mechanisms of Reactions Influencing Atmospheric Ozone; Oxford University Press: Oxford, MS, USA, 2015. [Google Scholar]
- Chowdhury, Z.; Zheng, M.; Schauer, J.J.; Sheesley, R.J.; Salmon, L.G.; Cass, G.R.; Russell, A.G. Speciation of ambient fine organic carbon particles and source apportionment of PM2.5 in Indian cities. J. Geophys. Res. Atmos. 2007, 112, D15303. [Google Scholar] [CrossRef]
- Mohan, M.; Kandya, A. An analysis of the annual and seasonal trends of air quality index of Delhi. Environ. Monit. Assess. 2007, 131, 267–277. [Google Scholar] [CrossRef] [PubMed]
- Garg, A.; Shukla, P.A.; Kapshe, M. The sectoral trends of multigas emissions inventory of India. Atmos. Environ. 2006, 40, 4608–4620. [Google Scholar] [CrossRef]
- Guttikunda, S.K.; Gurjar, B.R. Role of meteorology in seasonality of air pollution in megacity Delhi, India. Environ. Monit. Assess. 2012, 184, 3199–3211. [Google Scholar] [CrossRef]
- Kulkarni, S.H.; Ghude, S.D.; Jena, C.; Karumuri, R.K.; Sinha, B.; Sinha, V.; Khare, M. How much does large-scale crop residue burning affect the air quality in Delhi? Environ. Sci. Technol. 2020, 54, 4790–4799. [Google Scholar] [CrossRef]
- Khan, A.A.; Garsa, K.; Jindal, P.; Devara, P.C.S. Effects of stubble burning and firecrackers on the air quality of Delhi. Environ. Monit. Assess. 2023; in press. [Google Scholar]
- World Health Organization. WHO Global Air Quality Guidelines: Particulate Matter (PM2.5 and PM10), Ozone, Nitrogen Dioxide, Sulfur Dioxide and Carbon Monoxide; World Health Organization: Geneva, Switzerland, 2021. [Google Scholar]
- WHO Announces COVID-19 Outbreak a Pandemic. Europe: World Health Organization, 2020. Available online: http://www.euro.who.int/en/health-topics/health-emergencies/coronavirus-covid-19/news/news/202 (accessed on 18 April 2023).
- Patel, H.; Talbot, N.; Salmond, J.; Dirks, K.; Xie, S.; Davy, P. Implications for air quality management of changes in air quality during lockdown in Auckland (New Zealand) in response to the 2020 SARS-CoV-2 epidemic. Sci. Total Environ. 2020, 746, 141129. [Google Scholar] [CrossRef] [PubMed]
- Muhammad, S.; Long, X.; Salman, M. COVID-19 pandemic and environmental pollution: A blessing in disguise? Sci. Total Environ. 2020, 728, 138820. [Google Scholar] [CrossRef] [PubMed]
- Sokhi, R.S.; Singh, V.; Querol, X.; Finardi, S.; Targino, A.C.; de Fatima Andrade, M.; Pavlovic, R.; Garland, R.M.; Massagué, J.; Kong, S.; et al. A global observational analysis to understand changes in air quality during exceptionally low anthropogenic emission conditions. Environ. Int. 2021, 157, 106818. [Google Scholar] [CrossRef] [PubMed]
- Dantas, G.; Siciliano, B.; França, B.B.; da Silva, C.M.; Arbilla, G. The impact of COVID-19 partial lockdown on the air quality of the city of Rio de Janeiro, Brazil. Sci. Total Environ. 2020, 729, 139085. [Google Scholar] [CrossRef]
- Adam, M.; Schikowski, T.; Carsin, A.E.; Cai, Y.; Jacquemin, B.; Sanchez, M.; Vierkötter, A.; Marcon, A.; Keidel, D.; Sugiri, D.; et al. Adult lung function and long-term air pollution exposure. ESCAPE: A multicentre cohort study and meta-analysis. Eur. Respir. J. 2015, 45, 38–50. [Google Scholar] [CrossRef]
- Kerimray, A.; Baimatova, N.; Ibragimova, O.P.; Bukenov, B.; Kenessov, B.; Plotitsyn, P.; Karaca, F. Assessing air quality changes in large cities during COVID-19 lockdowns: The impacts of traffic-free urban conditions in Almaty, Kazakhstan. Sci. Total Environ. 2020, 730, 139179. [Google Scholar] [CrossRef]
- Li, H.; Xu, X.L.; Dai, D.W.; Huang, Z.Y.; Ma, Z.; Guan, Y.J. Air pollution and temperature are associated with increased COVID-19 incidence: A time series study. Int. J. Infect. Dis. 2020, 97, 278–282. [Google Scholar] [CrossRef]
- Nakada, L.Y.K.; Urban, R.C. COVID-19 pandemic: Impacts on the air quality during the partial lockdown in São Paulo state, Brazil. Sci. Total Environ. 2020, 730, 139087. [Google Scholar] [CrossRef]
- Sicard, P.; De Marco, A.; Agathokleous, E.; Feng, Z.; Xu, X.; Paoletti, E.; Rodriguez, J.J.D.; Calatayud, V. Amplified ozone pollution in cities during the COVID-19 lockdown. Sci. Total Environ. 2020, 735, 139542. [Google Scholar] [CrossRef]
- Wu, X.; Nethery, R.C.; Sabath, M.B.; Braun, D.; Dominici, F. Exposure to air pollution and COVID-19 mortality in the United States: A nationwide cross-sectional study. Sci. Adv. 2020, 6, eabd4049. [Google Scholar] [CrossRef]
- Otmani, A.; Benchrif, A.; Tahri, M.; Bounakhla, M.; El Bouch, M.; Krombi, M.H. Impact of COVID-19 lockdown on PM10, SO2 and NO2 concentrations in Salé City (Morocco). Sci. Total Environ. 2020, 735, 139541. [Google Scholar] [CrossRef] [PubMed]
- Mejia, S.A. Global environmentalism and the world-system: A cross-national analysis of air pollution. Sociol. Perspect. 2020, 63, 276–291. [Google Scholar] [CrossRef]
- Wang, P.; Chen, K.; Zhu, S.; Wang, P.; Zhang, H. Severe air pollution events not avoided by reduced anthropogenic activities during COVID-19 outbreak. Resour. Conserv. Recycl. 2020, 158, 104814. [Google Scholar] [CrossRef]
- Travaglio, M.; Yu, Y.; Popovic, R.; Selley, L.; Leal, N.S.; Martins, L.M. Links between air pollution and COVID-19 in England. Environ. Pollut. 2021, 268, 115859. [Google Scholar] [CrossRef]
- Broomandi, P.; Karaca, F.; Nikfal, A.; Jahanbakhshi, A.; Tamjidi, M.; Kim, J.R. Impact of COVID-19 event on the air quality in Iran. Aerosol Air Qual. Res. 2020, 20, 1793–1804. [Google Scholar] [CrossRef]
- Abdullah, S.; Mansor, A.A.; Napi, N.N.L.M.; Mansor, W.N.W.; Ahmed, A.N.; Ismail, M.; Ramly, Z.T.A. Air quality status during 2020 Malaysia Movement Control Order (MCO) due to 2019 novel coronavirus (2019-nCoV) pandemic. Sci. Total Environ. 2020, 729, 139022. [Google Scholar] [CrossRef]
- Bao, R.; Zhang, A. Does lockdown reduce air pollution? Evidence from 44 cities in northern China. Sci. Total Environ. 2020, 731, 139052. [Google Scholar] [CrossRef]
- Chauhan, A.; Singh, R.P. Decline in PM2.5 concentrations over major cities around the world associated with COVID-19. Environ. Res. 2020, 187, 109634. [Google Scholar] [CrossRef]
- Ju, M.J.; Oh, J.; Choi, Y.H. Changes in air pollution levels after COVID-19 outbreak in Korea. Sci. Total Environ. 2021, 750, 141521. [Google Scholar] [CrossRef]
- Filonchyk, M.; Hurynovich, V.; Yan, H. Impact of COVID-19 lockdown on air quality in the Poland, Eastern Europe. Environ. Res. 2021, 198, 110454. [Google Scholar] [CrossRef]
- Hoang, T.; Tran, T.T.A. Ambient air pollution, meteorology, and COVID-19 infection in Korea. J. Med. Virol. 2021, 93, 878–885. [Google Scholar] [CrossRef]
- Rahman, M.S.; Azad, M.A.K.; Hasanuzzaman, M.; Salam, R.; Islam, A.R.M.T.; Rahman, M.M.; Hoque, M.M.M. How air quality and COVID-19 transmission change under different lockdown scenarios? A case from Dhaka city, Bangladesh. Sci. Total Environ. 2021, 762, 143161. [Google Scholar] [CrossRef]
- Sharma, S.; Zhang, M.; Gao, J.; Zhang, H.; Kota, S.H. Effect of restricted emissions during COVID-19 on air quality in India. Sci. Total Environ. 2020, 728, 138878. [Google Scholar] [CrossRef]
- Singh, V.; Singh, S.; Biswal, A.; Kesarkar, A.P.; Mor, S.; Ravindra, K. Diurnal and temporal changes in air pollution during COVID-19 strict lockdown over different regions of India. Environ. Pollut. 2020, 266, 115368. [Google Scholar] [CrossRef]
- Mitra, A.; Ray Chadhuri, T.; Mitra, A.; Pramanick, P.; Zaman, S. Impact of COVID-19 related shutdown on atmospheric carbon dioxide level in the city of Kolkata. Parana J. Sci. Educ. 2020, 6, 84–92. [Google Scholar]
- Shehzad, K.; Sarfraz, M.; Shah, S.G.M. The impact of COVID-19 as a necessary evil on air pollution in India during the lockdown. Environ. Pollut. 2020, 266, 115080. [Google Scholar] [CrossRef]
- Mahato, S.; Pal, S.; Ghosh, K.G. Effect of lockdown amid COVID-19 pandemic on air quality of the megacity Delhi, India. Sci. Total Environ. 2020, 730, 139086. [Google Scholar] [CrossRef]
- Jain, S.; Sharma, T. Social and travel lockdown impact considering coronavirus disease (COVID-19) on air quality in megacities of India: Present benefits, future challenges and way forward. Aerosol Air Qual. Res. 2020, 20, 1222–1236. [Google Scholar] [CrossRef]
- Srivastava, A.K.; Bhoyar, P.D.; Kanawade, V.P.; Devara, P.C.; Thomas, A.; Soni, V.K. Improved air quality during COVID-19 at an urban megacity over the Indo-Gangetic Basin: From stringent to relaxed lockdown phases. Urban Clim. 2021, 36, 100791. [Google Scholar] [CrossRef]
- Singh, R.P.; Chauhan, A. Impact of lockdown on air quality in India during COVID-19 pandemic. Air Qual. Atmos. Health 2020, 13, 921–928. [Google Scholar] [CrossRef]
- Devara, P.C.S.; Kumar, A.; Sharma, P.B.; Banerjee, P.; Khan, A.A.; Sonbawne, S.M. Multi-sensor study of the impact of air pollution on COVID-19. J. Infect. Dis. Res. 2020, 3, 22. [Google Scholar]
- Kumari, P.; Toshniwal, D. Impact of lockdown measures during COVID-19 on air quality—A case study of India. Int. J. Environ. Health Res. 2022, 32, 503–510. [Google Scholar] [CrossRef] [PubMed]
- Selvam, S.; Muthukumar, P.; Venkatramanan, S.; Roy, P.D.; Bharath, K.M.; Jesuraja, K. SARS-CoV-2 pandemic lockdown: Effects on air quality in the industrialized Gujarat state of India. Sci. Total Environ. 2020, 737, 140391. [Google Scholar] [CrossRef] [PubMed]
- Mandal, I.; Pal, S. COVID-19 pandemic persuaded lockdown effects on environment over stone quarrying and crushing areas. Sci. Total Environ. 2020, 732, 139281. [Google Scholar] [CrossRef]
- Sahu, S.K.; Tyagi, B.; Beig, G.; Mangaraj, P.; Pradhan, C.; Khuntia, S.; Singh, V. Significant change in air quality parameters during the year 2020 over 1st smart city of India: Bhubaneswar. SN Appl. Sci. 2020, 2, 1–8. [Google Scholar] [CrossRef]
- Sahu, S.K.; Mangaraj, P.; Beig, G.; Tyagi, B.; Tikle, S.; Vinoj, V. Establishing a link between fine particulate matter (PM2.5) zones and COVID-19 over India based on anthropogenic emission sources and air quality data. Urban Clim. 2021, 38, 100883. [Google Scholar] [CrossRef]
- Tyagi, B.; Vissa, N.K.; Ghude, S.D. Evolution of Pollution Levels from COVID-19 Lockdown to Post-Lockdown over India. Toxics 2022, 10, 653. [Google Scholar] [CrossRef]
- Ravindra, K.; Singh, T.; Biswal, A.; Singh, V.; Mor, S. Impact of COVID-19 lockdown on ambient air quality in megacities of India and implication for air pollution control strategies. Environ. Sci. Pollut. Res. 2021, 28, 21621–21632. [Google Scholar] [CrossRef]
- Greenstone, M.; Hasenkopf, C.; Lee, K. Air Quality Life Index (AQLI). 2022. Available online: https://aqli.epic.uchicago.edu/wp-content/uloads/2022/06/AQLI_2022_Report-Global.pdf (accessed on 18 August 2023).
- Pei, Z.; Han, G.; Ma, X.; Su, H.; Gong, W. Response of major air pollutants to COVID-19. Sci. Total Environ. 2020, 743, 140879. [Google Scholar] [CrossRef]
- Gautam, S. COVID-19: Air pollution remains low as people stay at home. Air Qual. Atmos. Health 2020, 13, 853–857. [Google Scholar] [CrossRef]
- Mahato, S.; Pal, S. Revisiting air quality during lockdown persuaded by second surge of COVID-19 of megacity Delhi, India. Urban Clim. 2022, 41, 101082. [Google Scholar] [CrossRef] [PubMed]
- Hou, A.Y.; Kakar, R.K.; Neeck, S.; Azarbarzin, A.A.; Kummerow, C.D.; Kojima, M.; Iguchi, T. The global precipitation measurement mission. Bull. Am. Meteorol. Soc. 2014, 95, 701–722. [Google Scholar] [CrossRef]
- Huffman, G.J.; Stocker, E.F.; Bolvin, D.T.; Nelkin, E.J.; Tan, J. GPM IMERG Final Precipitation L3 1 day 0.1 degree × 0.1 degree V06; Savtchenko, A., Ed.; Goddard Earth Sciences Data and Information Services Center (GES DISC): Greenbelt, MD, USA, 2019. [Google Scholar]
- Hazarika, N.; Das, A.; Kamal, V.; Anwar, K.; Srivastava, A.; Jain, V.K. Particle phase PAHs in the atmosphere of Delhi-NCR: With spatial distribution, source characterization and risk approximation. Atmos. Environ. 2019, 200, 329–342. [Google Scholar] [CrossRef]
- Kumar, P.; Gulia, S.; Harrison, R.M.; Khare, M. The influence of odd–even car trial on fine and coarse particles in Delhi. Environ. Pollut. 2017, 225, 20–30. [Google Scholar] [CrossRef]
- Kumar, M.; Ramanathan, A.L.; Tripathi, R.; Farswan, S.; Kumar, D.; Bhattacharya, P. A study of trace element contamination using multivariate statistical techniques and health risk assessment in groundwater of Chhaprola Industrial Area, Gautam Buddha Nagar, Uttar Pradesh, India. Chemosphere 2017, 166, 135–145. [Google Scholar] [CrossRef]
- Perrino, C.; Tiwari, S.; Catrambone, M.; Dalla Torre, S.; Rantica, E.; Canepari, S. Chemical characterization of atmospheric PM in Delhi, India, during different periods of the year including Diwali festival. Atmos. Pollut. Res. 2011, 2, 418–427. [Google Scholar] [CrossRef]
- Malik, V.K.; Singh, R.K.; Singh, S.K. Impact of urbanization on ground water of Gurgaon District, Haryana, India. Int. J. Rural Dev. Manag. Stud. 2010, 5, 45–57. [Google Scholar]
- Chai, F.; Gao, J.; Chen, Z.; Wang, S.; Zhang, Y.; Zhang, J.; Ren, C. Spatial and temporal variation of 726 particulate matter and gaseous pollutants in 26 cities in China. J. Environ. Sci. 2014, 26, 75–82. [Google Scholar] [CrossRef]
- He, J.; Gong, S.; Yu, Y.; Yu, L.; Wu, L.; Mao, H.; Li, R. Air pollution characteristics and their relation 728 to meteorological conditions during 2014–2015 in major Chinese cities. Environ. Pollut. 2017, 223, 484–496. [Google Scholar] [CrossRef]
- Liu, Z.; Shen, L.; Yan, C.; Du, J.; Li, Y.; Zhao, H. Analysis of the Influence of Precipitation and Wind on PM2.5 and PM10 in the Atmosphere. Adv. Meteorol. 2020, 2020, 1–13. [Google Scholar] [CrossRef]
- IQAir. World Air Quality Report: Region and City PM2.5 Ranking; IQAir: Goldach, Switzerland, 2022. [Google Scholar]
- Gorai, A.K.; Tchounwou, P.B.; Biswal, S.S.; Tuluri, F. Spatio-temporal variation of particulate matter (PM2.5) concentrations and its health impacts in a mega city, Delhi in India. Environ. Health Insights 2018, 12, 1178630218792861. [Google Scholar] [CrossRef] [PubMed]
- Hama, S.M.; Kumar, P.; Harrison, R.M.; Bloss, W.J.; Khare, M.; Mishra, S.; Sharma, C. Four-year assessment of ambient particulate matter and trace gases in the Delhi-NCR region of India. Sustain. Cities Soc. 2020, 54, 102003. [Google Scholar] [CrossRef]
- Commission for Air Quality Management Report, 31 July 2023. Available online: https://caqm.nic.in/WriteReadData/LINKS/CAQM%20PR%203107202397589965-0cea-46ef-963e-cd0eb1bfad1d.pdf (accessed on 18 August 2023).
Disclaimer/Publisher’s Note: The statements, opinions and data contained in all publications are solely those of the individual author(s) and contributor(s) and not of MDPI and/or the editor(s). MDPI and/or the editor(s) disclaim responsibility for any injury to people or property resulting from any ideas, methods, instructions or products referred to in the content. |
© 2023 by the authors. Licensee MDPI, Basel, Switzerland. This article is an open access article distributed under the terms and conditions of the Creative Commons Attribution (CC BY) license (https://creativecommons.org/licenses/by/4.0/).