Article

Characteristics of Water Vapor Transport for Extreme Summer Precipitation in the Eastern Southwest China and Its Impact Mechanism

1
China Meteorological Administration Key Open Laboratory of Transforming Climate Resources to Economy, Chongqing Climate Center, Chongqing 401147, China
2
Institute of Atmospheric Physics Chinese Academy of Sciences, International Center for Climate and Environment Sciences, Beijing 100029, China
3
Sanming Meteorological Bureau, Sanming 365000, China
*
Author to whom correspondence should be addressed.
Atmosphere 2023, 14(9), 1328; https://doi.org/10.3390/atmos14091328
Submission received: 25 July 2023 / Revised: 18 August 2023 / Accepted: 18 August 2023 / Published: 23 August 2023

Abstract

:
To improve understanding of the characteristics of extreme summer rainfall and its water vapor transport in the eastern part of southwestern China (ESWC), this study analyzed data on daily precipitation from 118 meteorological stations in the ESWC from 1979 to 2020, as well as daily reanalysis data from ERA5 and daily reanalysis data from NCEP/NCAR. The study employed polynomial fitting, correlation, regression, clustering, and mixed single-particle Lagrangian trajectory (HYSPLITv5.0) modeling methods to simulate extreme summer precipitation and its water vapor transport characteristics in the ESWC and its possible formation mechanism. The results show that: (1) The contribution rate of extreme precipitation in the ESWC from 1979 to 2020 varied significantly on the interannual time scale. When the number of extreme precipitation days is high (low), the contribution rate of extreme precipitation is also high (low), while the contribution rate of general precipitation (the percentage of the sum of general precipitation to the total summer precipitation of that year) is often low (high). (2) When extreme precipitation occurs in the ESWC, compared with general precipitation, the high-level potential vortices are stronger, and the cold air from higher latitude is more likely to move southward. Meanwhile, the amount of water vapor input to the region is significantly larger than that of general precipitation. (3) There are four channels of water vapor sources in the ESWC during the period of extreme precipitation: the Bay of Bengal, the Arabian Sea, the western Pacific, and the northwest. The contribution of water vapor from the Bay of Bengal is the highest. The number of extreme summer precipitation days in the ESWC is significantly negatively correlated with the water vapor budget of the eastern boundary and positively correlated with Indian Ocean Basin-Wide (IOBW) index in the previous winter. (4) When the winter SST is high in the IOBW mode, it can cause the western Pacific subtropical high and the South Asian high to be stronger and shifted southward in summer, resulting in an increase in the number of extreme precipitation days in the ESWC.

1. Introduction

Extreme precipitation refers to rare rainfall events in a certain area that, due to their extreme nature, often lead to disasters such as floods, debris flows, landslides, and waterlogging, resulting in severe loss of life and property [1]. With the background of global warming, extreme precipitation events are becoming more frequent. On 21 July 2012, Beijing experienced the strongest heavy rainstorm since 1951. From 19 to 21 July 2016, large-scale heavy rainstorms occurred in North China, with some areas experiencing extremely heavy rainfalls, causing significant casualties and property losses [2,3]. On 20–21 July 2021, a severe rainstorm hit the central and northern parts of Henan province, with the maximum hourly rainfall in Zhengzhou reaching 201.9 mm, which is the highest hourly rainfall in mainland China’s history. This extreme rainfall caused severe flooding and urban waterlogging in cities such as Zhengzhou, resulting in pronounced loss of life and property [4,5]. In fact, extreme precipitation events have attracted widespread attention. And experts and scholars have conducted some meaningful research on this topic [6,7,8,9,10,11,12]. Studies have shown that in most parts of China, the frequency and intensity of heavy precipitation and extreme precipitation events have increased, while light rain has decreased [13,14,15]. The changes in extreme precipitation in China exhibit significant regional differences, with most extreme precipitation indices showing an increasing trend in northwest China, southeast China, and the middle and lower reaches of the Yangtze River, while a decreasing trend is observed in North China, Northeast China, and Southwest China [16,17,18,19,20]. In general, the formation of strong water vapor transport channels is an important prerequisite for the occurrence of heavy rainstorms in eastern China during the summer, with the entire layer of water vapor flux usually exceeding 200 kg m−1s−1 [21,22,23]. Chen and Xu [24] pointed out that the water vapor transport in extreme precipitation events can be traced upstream to the Arabian Sea and West Asia, and the topography of the Qinghai-Tibet Plateau and the subtropical high-pressure system have an important influence on the water vapor transport path. Bu et al. [25] analyzed the water vapor transport characteristics, water vapor sources, and key weather scale systems of the 20 July 2021, Henan rainstorm and emphasized that on the 20th, a stratospheric anticyclone breaking event occurred over the western region of Henan, which, together with the typhoon, triggered a strong meridional water vapor flux on the southern side of Henan, leading to this extreme rainstorm event.
The ESWC (referring to the area between 27° N–32° N and 105° E–110° E, covering parts of eastern Sichuan, Chongqing, northern Guizhou, and western Hunan and Hubei) is located on the eastern side of the Qinghai-Tibet Plateau, with complex terrain and landforms. This region is one of the areas in China with relatively abundant summer precipitation. Due to its special geographical location, the weather and climate are influenced by both the Qinghai-Tibet Plateau and the South Asian (Indian) monsoon and the East Asian monsoon. Precipitation in this region affects the Three Gorges Reservoir water storage scheduling and is located near the boundary of China’s large-scale rainy (less rainy) areas. Therefore, extreme (heavy) precipitation in summer is of great concern. Research has shown that extreme (heavy) summer precipitation in the eastern region of Southwest China and its adjacent areas are closely related to water vapor transport. Huang and Cui [26] studied the water vapor sources of extreme precipitation in the Sichuan Basin in July 2013 and found that they were mainly concentrated in the lower and middle levels of the troposphere, and the sources could be traced back to the Arabian Sea. More than 80% of the total water vapor came from the source region, and the largest contribution came from the Indian Peninsula-Bay of Bengal-Central and Southern Peninsula region. Li et al. [27] analyzed the water vapor transport characteristics of nine extreme rainstorms in the upper reaches of the Yangtze River in the summer of 1998. The results showed that the water vapor of the extreme rainstorms in the upper reaches of the Yangtze River mainly came from the Bay of Bengal, the South China Sea, and the western Pacific. There also existed a water vapor pathway from the northern Arabian Sea, through the northern part of the Indian Peninsula, and then through the southeastern part of the Qinghai-Tibet Plateau, into the upper reaches of the Yangtze River. Li et al. [28,29] analyzed the sources, pathways, and contributions of water vapor for summer precipitation in the eastern region of Southwest China, indicating that the water vapor pathway for summer precipitation mainly comes from the southern pathways of the Bay of Bengal, the South China Sea, and the Arabian Sea. Qi and Li [30,31] found that water vapor in the Sichuan Basin flows in from the southern and western boundaries, and flows out from the eastern and northern boundaries during the summer. The Sichuan Basin is a water vapor sink, and summer precipitation in this region is significantly positively correlated with the inflow of water vapor from the southern boundary. The spatial and temporal distribution of extreme rainstorms in the Sichuan Basin is the result of the interaction between the special terrain and different water vapor transport characteristics at low latitudes. The intensity of extreme rainstorms is mainly influenced by the dynamic effects of regional and local terrain.
Some previous studies have also been conducted on the characteristics of extreme precipitation in the ESWC [32,33], indicating a slight increase and strengthening trend of extreme precipitation in this region during summer. However, most of these studies focus on the analysis of the change patterns of extreme precipitation or the characteristics of water vapor transport in summer. This article aims to comprehensively analyze the change patterns of extreme summer precipitation and its water vapor transport characteristics in the ESWC. From the perspective of climate prediction, it will analyze the factors affecting extreme precipitation and its water vapor transport, and a physical conceptual model based on the influence mechanism will be preliminarily discussed to provide a technical reference for predicting extreme summer precipitation trends in this region. In this paper, the water vapor characteristics (including water vapor budget, water vapor source and contribution) of the summer extreme precipitation in ESWC are systematically and quantitatively analyzed, and then a conceptual model of the factors affecting the interannual variation of extreme precipitation days is established.

2. Data and Methods

2.1. Data

The data used in this article mainly include:
(1) The precipitation is from China Surface Daily Meteorological Elements Dataset (V3.0) provided by the National Meteorological Information Center of the China Meteorological Administration, which has undergone strict quality control. In this article, we selected the 24 h accumulated precipitation data from 20:00 to the next day’s 20:00 (Beijing time, same below) from 1979 to 2020 at 118 meteorological stations (Figure 1) uniformly distributed, representative, and complete in data in the ESWC (27° N to 32° N, 105° E to 110° E) for analysis.
(2) Monthly ERA5 reanalysis data from 1979 to 2020 provided by the European Centre for Medium-Range Weather Forecasts (ECMWF) were used, including potential height, temperature, meridional wind, zonal wind, vertical velocity, specific humidity, etc. The horizontal resolution is 0.25° × 0.25°, and there are 37 vertical pressure layers from 1000 hPa to 1 hPa.
(3) Trajectory simulation data come from the reanalysis data provided by the National Centers for Environmental Prediction/National Center for Atmospheric Research (NCEP/NCAR) in the United States, which includes four times a day from 1991 to 2020. The variables include geopotential height, temperature, meridional wind, zonal wind, and vertical velocity. The horizontal resolution is 2.5° × 2.5°, and the vertical level is 17 layers.

2.2. Methods

(1) Definition of extreme precipitation and general precipitation
The method of defining extreme precipitation events is as follows: the daily precipitation sequence (≥1 mm) of all individual stations is arranged in ascending order, and the daily precipitation corresponding to the 95th percentile is defined as the extreme precipitation threshold. Precipitation exceeding the threshold is considered an extreme precipitation event [34,35]. The two extreme precipitation indices used are: the number of extreme precipitation days (R95d), defined as the number of days on which extreme precipitation occurs (daily precipitation >95th percentile); and the contribution rate of extreme precipitation (R95r), defined as the percentage of the sum of extreme precipitation (daily precipitation >95th percentile) to the total summer precipitation in a given year.
To study the difference between extreme precipitation and general precipitation, this paper defines a rainy day as a day in which at least 54 of the 118 stations in the eastern part of Southwest China experience precipitation (daily precipitation ≥ 1 mm) within 1 day. The choice of 54 stations is based on the fact that the resulting number of rainy days (31 days) calculated in this way is the same as the average number of rainy days for all 118 stations over many years (31 days). Correspondingly, if at least 16 stations experience extreme precipitation within 1 day (the choice of 16 stations is based on the fact that the resulting number of extreme precipitation days (2 days) calculated in this way is the same as the average number of extreme precipitation days for all the 118 stations over many years (2 days)), the day is considered an extreme precipitation day. The number of general precipitation days (R5d) is defined as the number of remaining rainy days in summer after extreme precipitation days are excluded, and the contribution rate of general precipitation (R5r) is defined as the percentage of the sum of general precipitation to the total summer precipitation in a given year.
(2) Calculation of water vapor budget using the Eulerian method
The formula for calculating the unit column atmospheric water vapor flux vector is:
Q = 1 g p t o p p s V × q   d p
The zonal and meridional water vapor flux is:
Q λ = 1 g p t o p p s ( u q ) d p
Q ϕ = 1 g p t o p p s ( v q ) d p
The boundary integration of water vapor transportation can be expressed as:
F u = Q λ a d ϕ
F v = Q ϕ a cos ϕ d λ
Finally, the regional water vapor budget is:
D s = ( F u , F v ) = F i F o
In the above Equations (1)–(6), g represents the acceleration of gravity, V represents the wind velocity vector of the atmosphere in each unit air column. F i is the total amount of water vapor flowing into the unit air column, F o is the total amount of water vapor flowing out of the unit air column, a is the radius of the Earth, ϕ is the latitude, λ is the longitude, p s is the surface air pressure, and p t o p is the pressure at the top of the model layer.
(3) Trajectory mode
Trajstat [36] software and the HYSPLIT [37] model were used for water vapor trajectory analysis in this paper. The trajectory simulation method of HYSPLIT involves integrating the position vectors of the moving path of the mass point, using the average velocity between the initial position of the mass point and the first estimated position to calculate the tracking position of the air mass. Therefore, backward integration of the air mass can be used to determine the source of water vapor [38,39,40].
In this paper, the simulation area was selected as the ESWC (27° N to 32° N, 105° E to 110° E). The initial height for the simulation was selected as 1500 m (approximately 850 hPa) in the vertical direction. Three initial trajectory points were selected for the entire simulation space, with latitude and longitude coordinates of (30.00° N, 105.00° E), (30.00° N, 107.50° E), and (30.00° N, 110.00° E). The three-dimensional motion trajectories of these points were simulated backward for 10 days, with trajectory points output every hour and corresponding atmospheric fields (such as temperature, height, pressure, and relative humidity) interpolated. Every 6 h, all initial trajectory points were re-simulated backward for 10 days to track the water vapor trajectory of extreme precipitation from 1979 to 2020, and a large number of trajectories were clustered to determine the final number of trajectories.

3. Extreme Precipitation Changes and Atmospheric Circulation Features

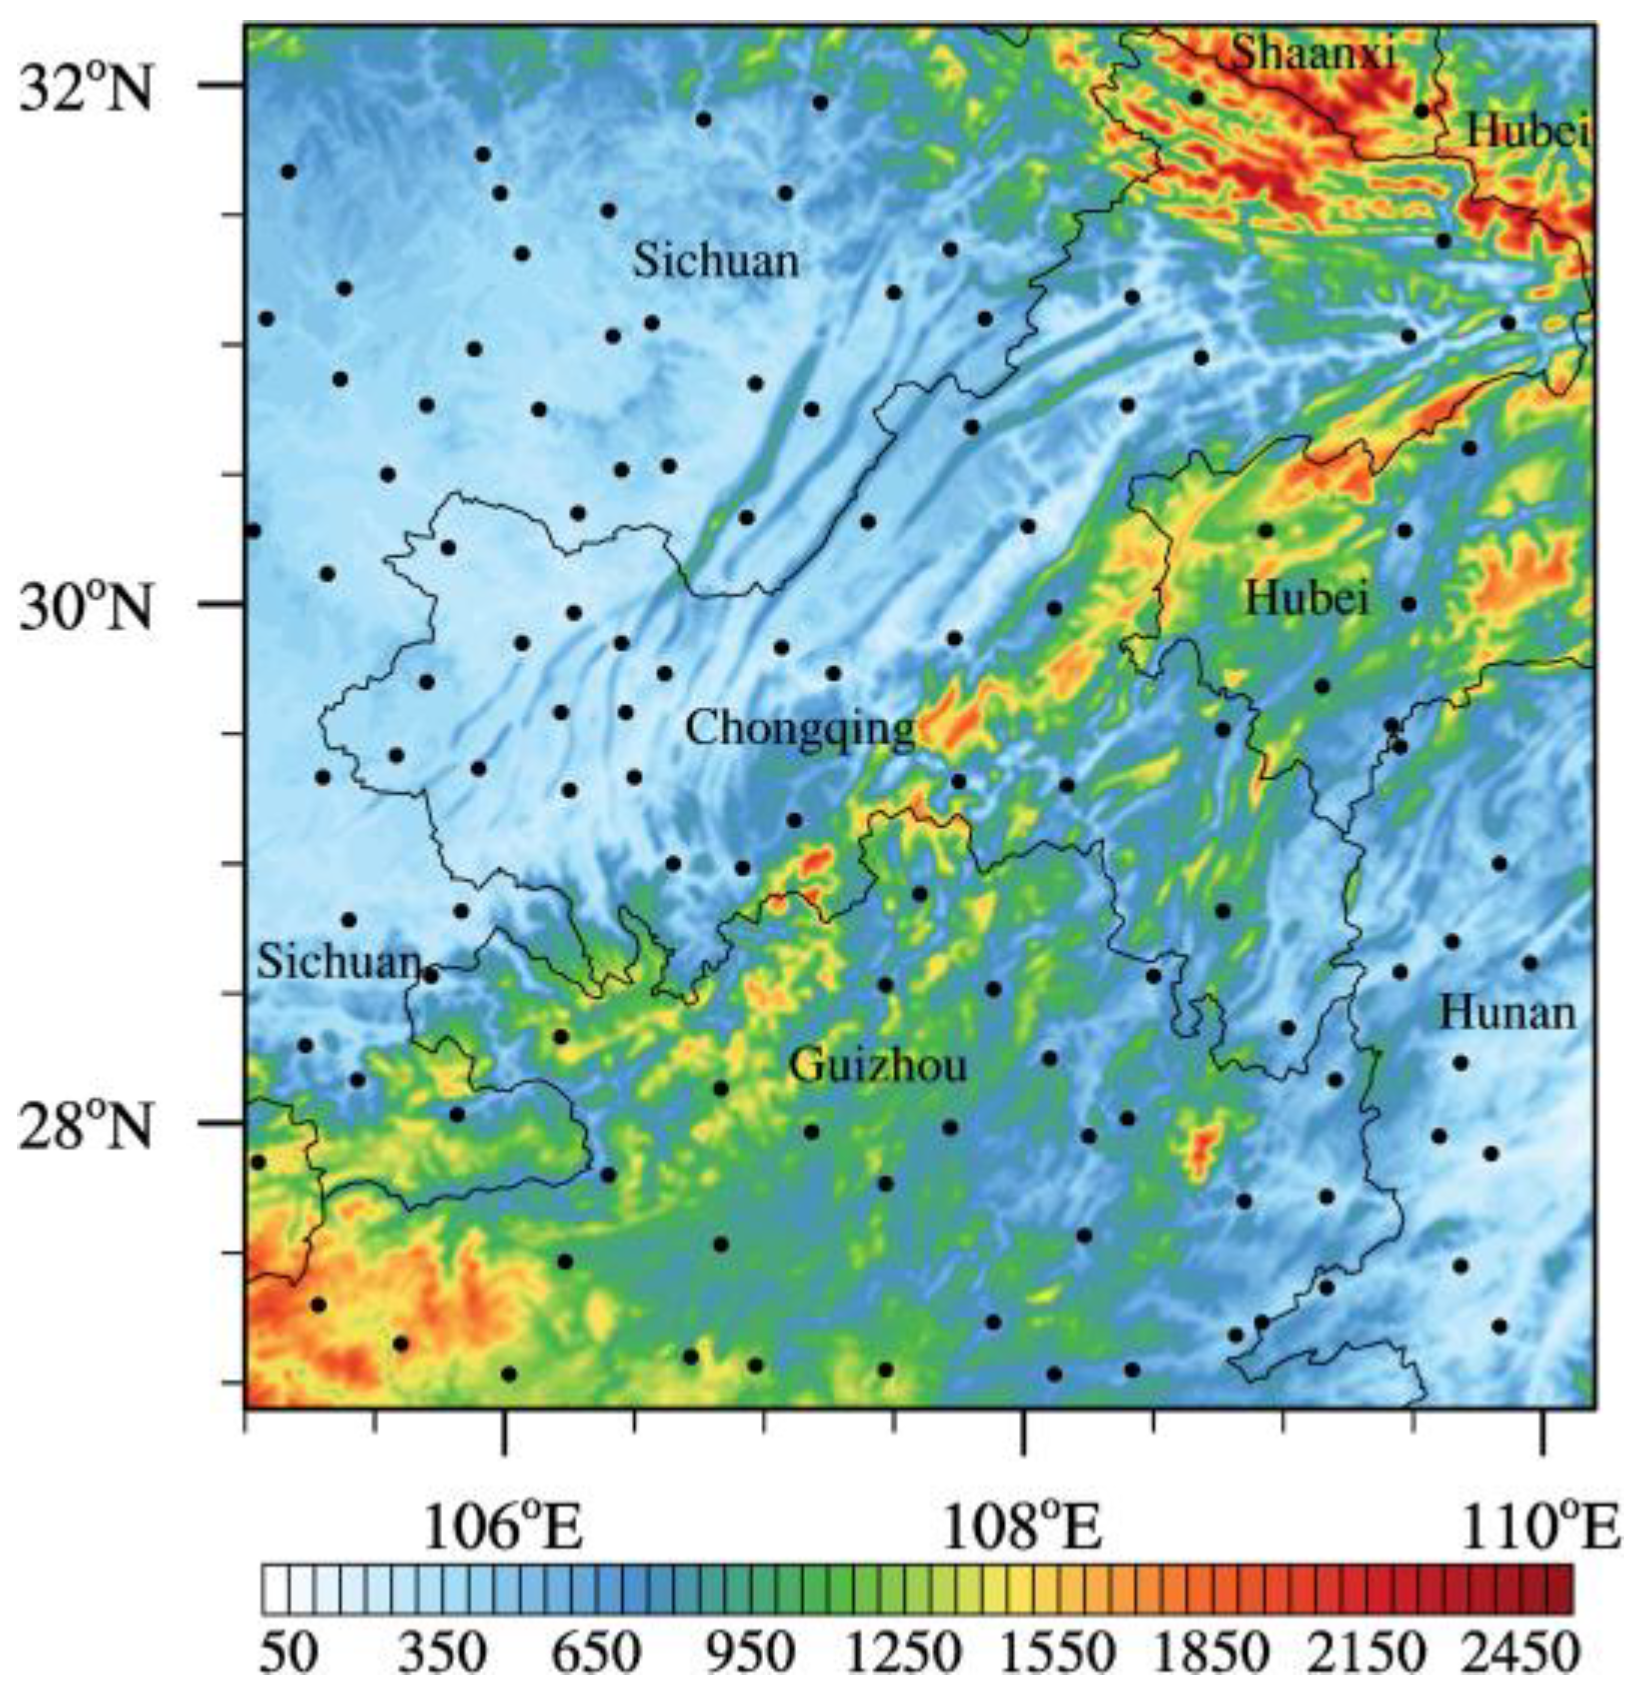
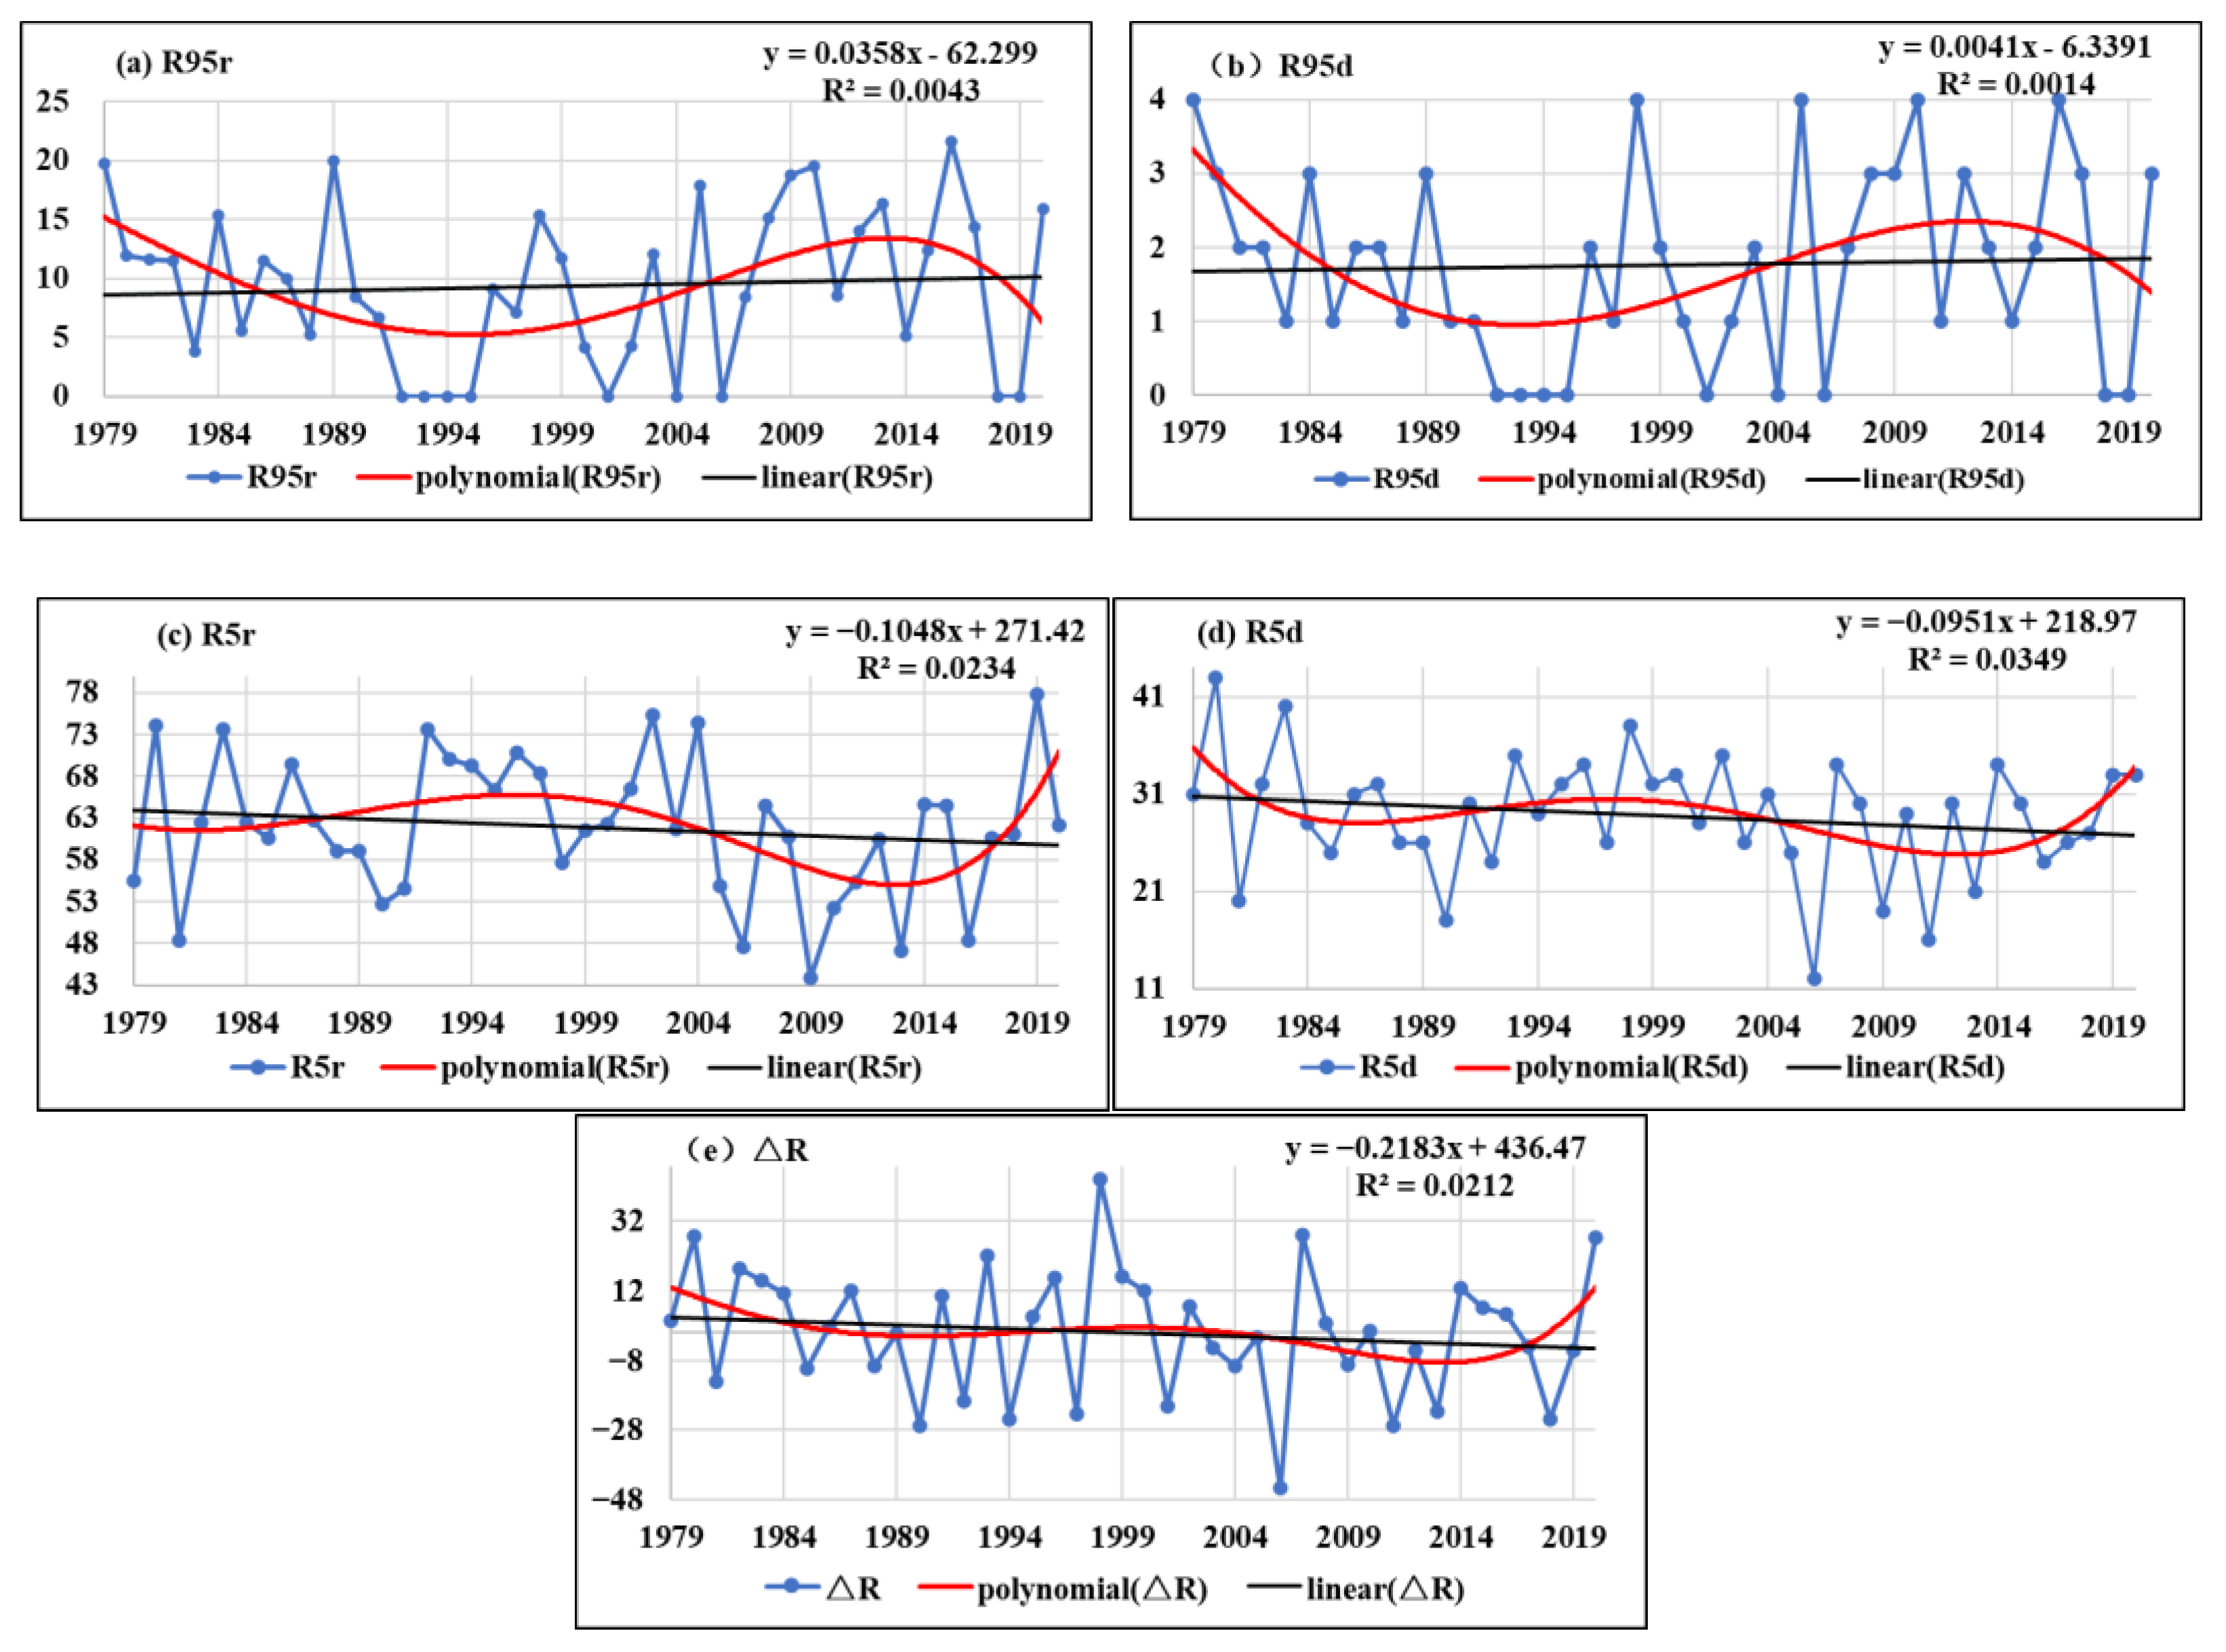
3.1. Extreme Precipitation Characteristics in the ESWC

Figure 2 shows the interannual and decadal variations of the contribution rate of extreme precipitation (R95r), the number of extreme precipitation days (R95d), the contribution rate of general precipitation (R5r), the number of general precipitation days (R5d), and the regional precipitation anomaly percentage (△R, relative to the average value from 1979 to 2020) in the ESWC from 1979 to 2020. The interannual variation of the contribution rate of extreme precipitation in this region is significant, with 26% of years (11 years) exceeding 15%, and the highest year reaching 22% (2016), while 21% of years (9 years) did not experience extreme precipitation. From a decadal perspective, the contribution rate of extreme precipitation was relatively large in the 1980s, the mid-late 1990s, the late 2000s to the 2010s. The contribution rate of extreme precipitation slightly increased but was not significant (Figure 2a). In terms of the number of extreme precipitation days, there were more than 3 days in 13 years, with 5 years (1979, 1998, 2005, 2010, and 2016) having 4 days. The decadal variation of extreme precipitation days was similar to that of the contribution rate. And the number of extreme precipitation days slightly increased but was not significant (Figure 2b). The contribution rate of general precipitation varied between 44% and 78%, and was higher than the contribution rate of extreme precipitation each year, especially in the late 1990s, early 2000s, and since 2014. From the linear trend of the entire period, the contribution rate of general precipitation slightly decreased but was not significant (Figure 2c). The number of general precipitation days ranged from 12 to 43 days, with the most in the 1980s and the least in 2006. From the linear trend of the entire period, the number of general precipitation days also slightly decreased but was not significant (Figure 2d). The interannual variation of the regional precipitation anomaly percentage was significant, with the most in 1998 (45%) and the least in 2006 (−44%). The precipitation was relatively high in the early 1980s, 1990s, and since 2014. Moreover, the percentage of summer precipitation anomaly slightly decreased but was not significant (Figure 2e).
According to the correlation coefficients (Table 1) between the contribution rate of extreme precipitation (R95r), the number of extreme precipitation days (R95d), the contribution rate of general precipitation (R5r), the number of general precipitation days (R5d), and the percentage deviation of regional precipitation (△R), the R95r and R95d are significantly positively correlated with each other, and both are significantly positively correlated with △R, while they are significantly negatively correlated with R5r and not closely related to R5d. Therefore, when the number of extreme precipitation days in the summer in the ESWC is relatively high (low), the contribution rate of extreme precipitation is also relatively high (low), and the contribution rate of general precipitation tends to be low (high), which may result in an overall increase (decrease) in precipitation.

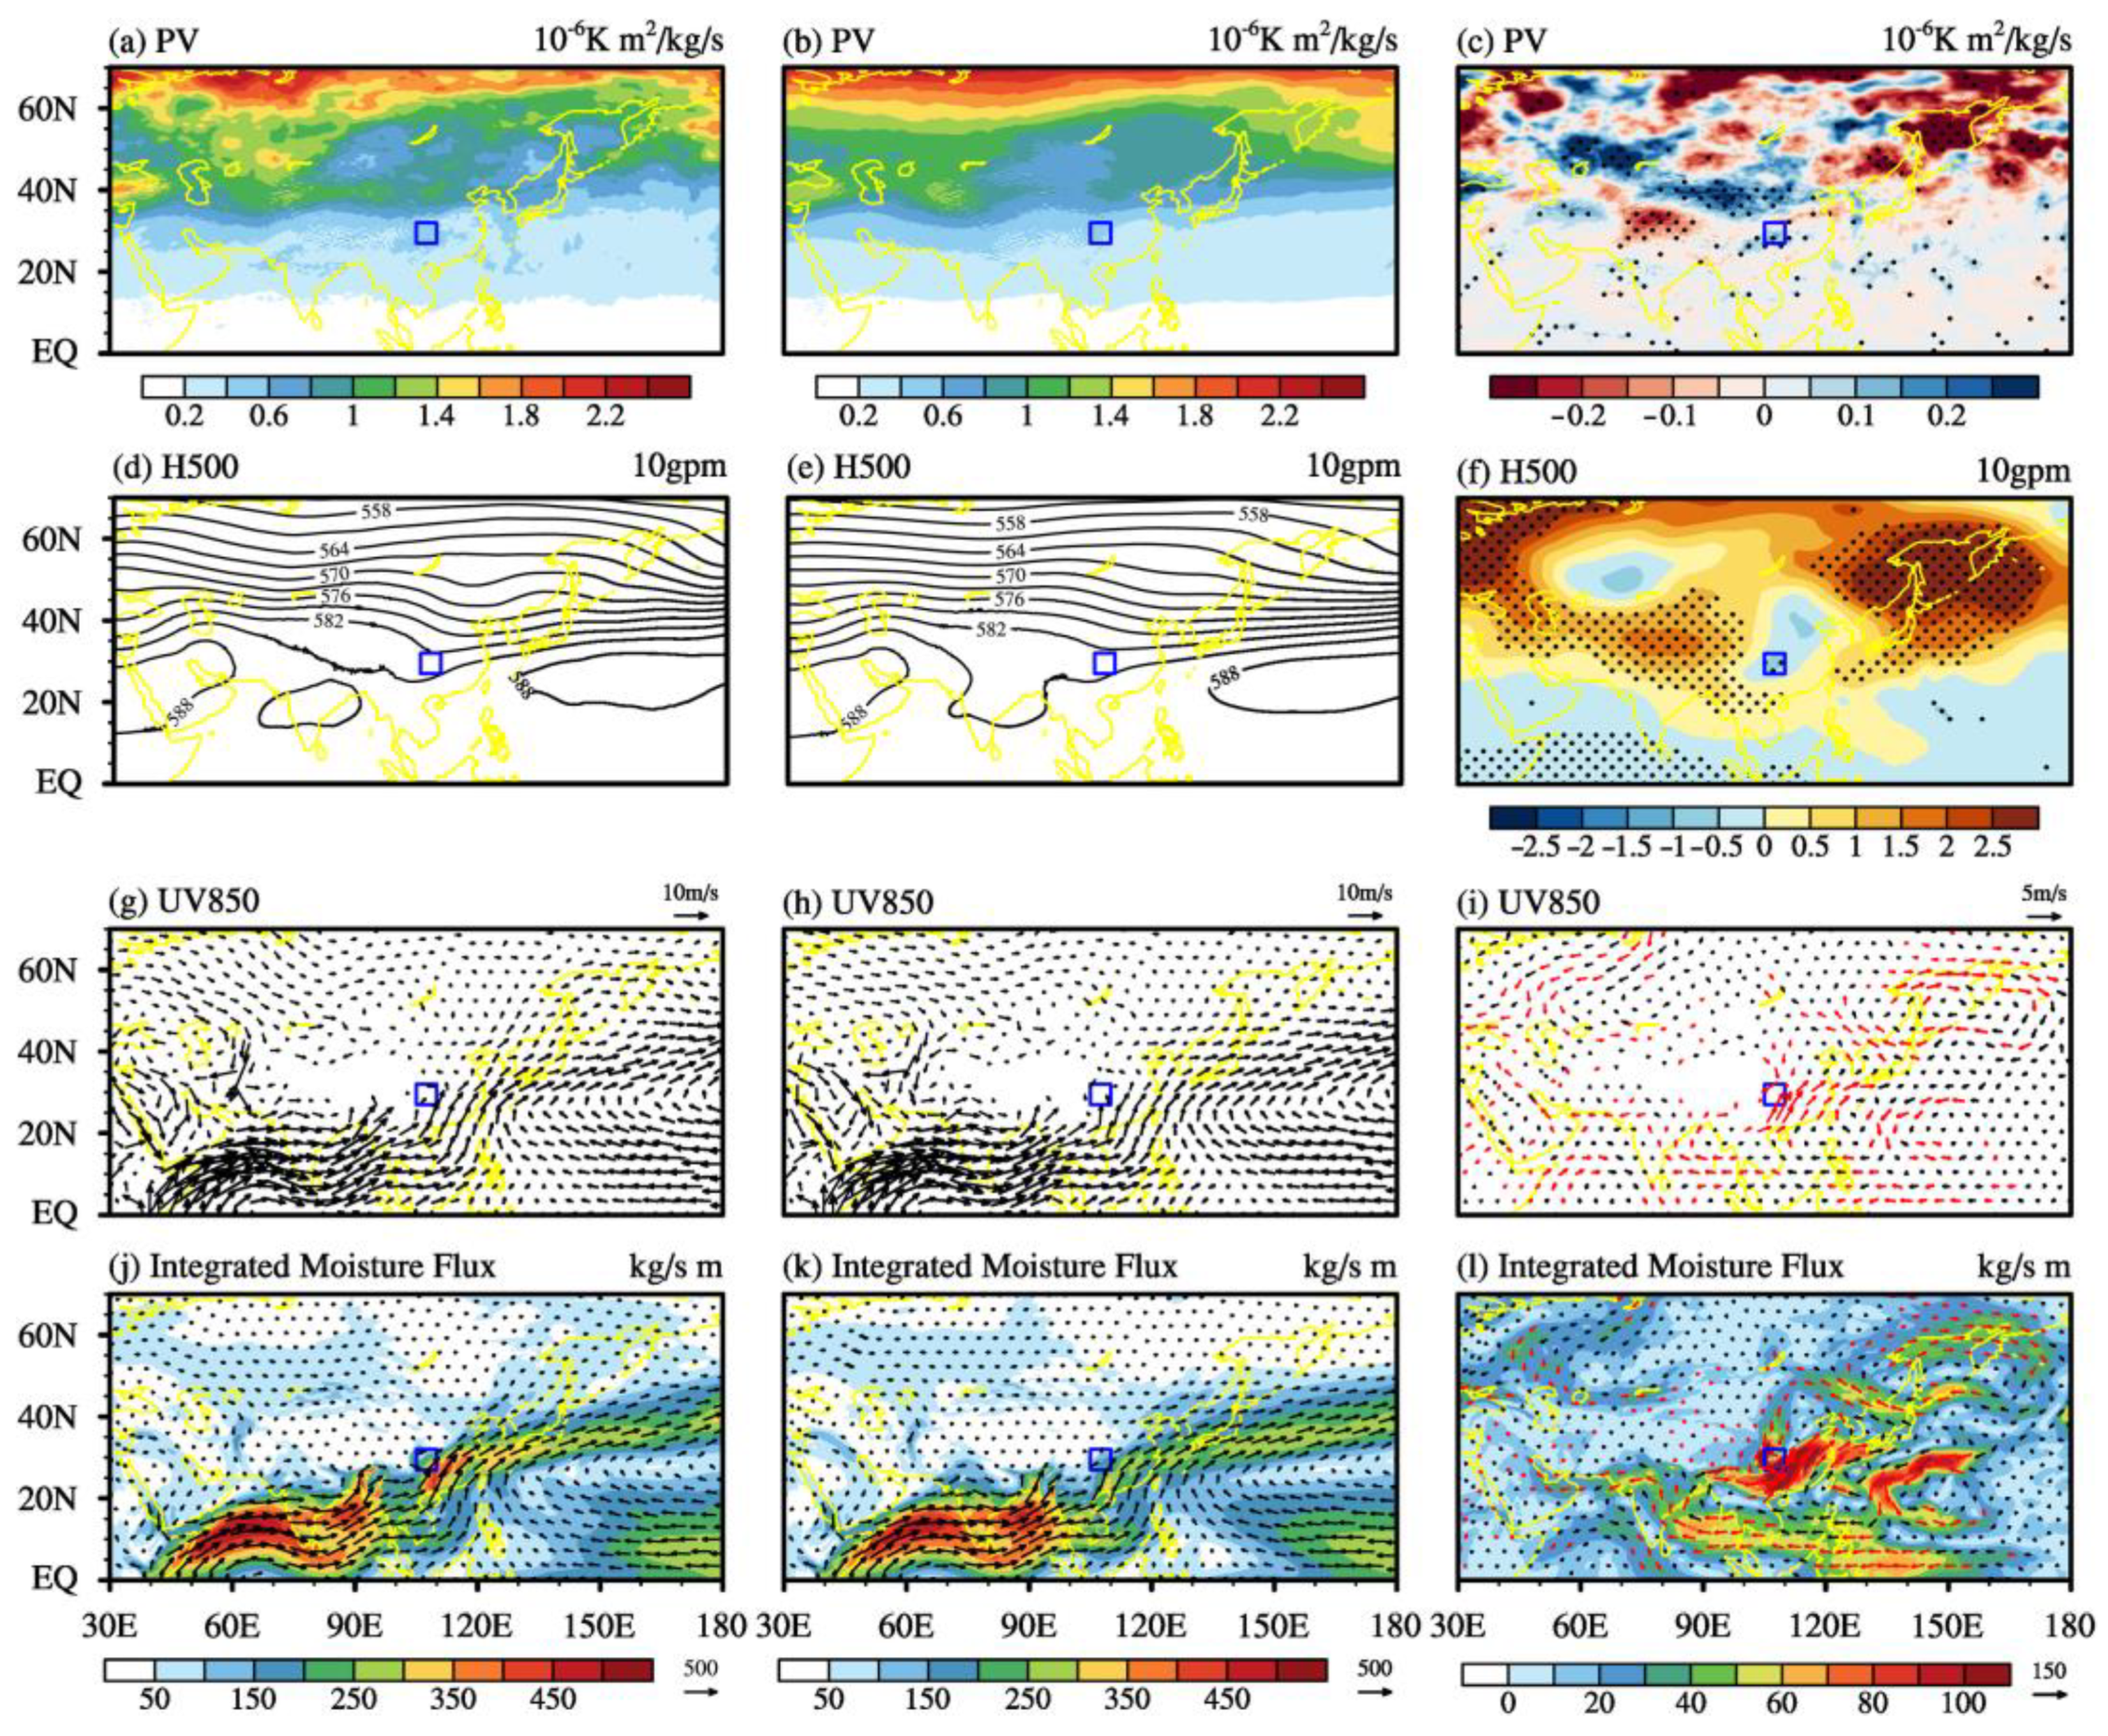
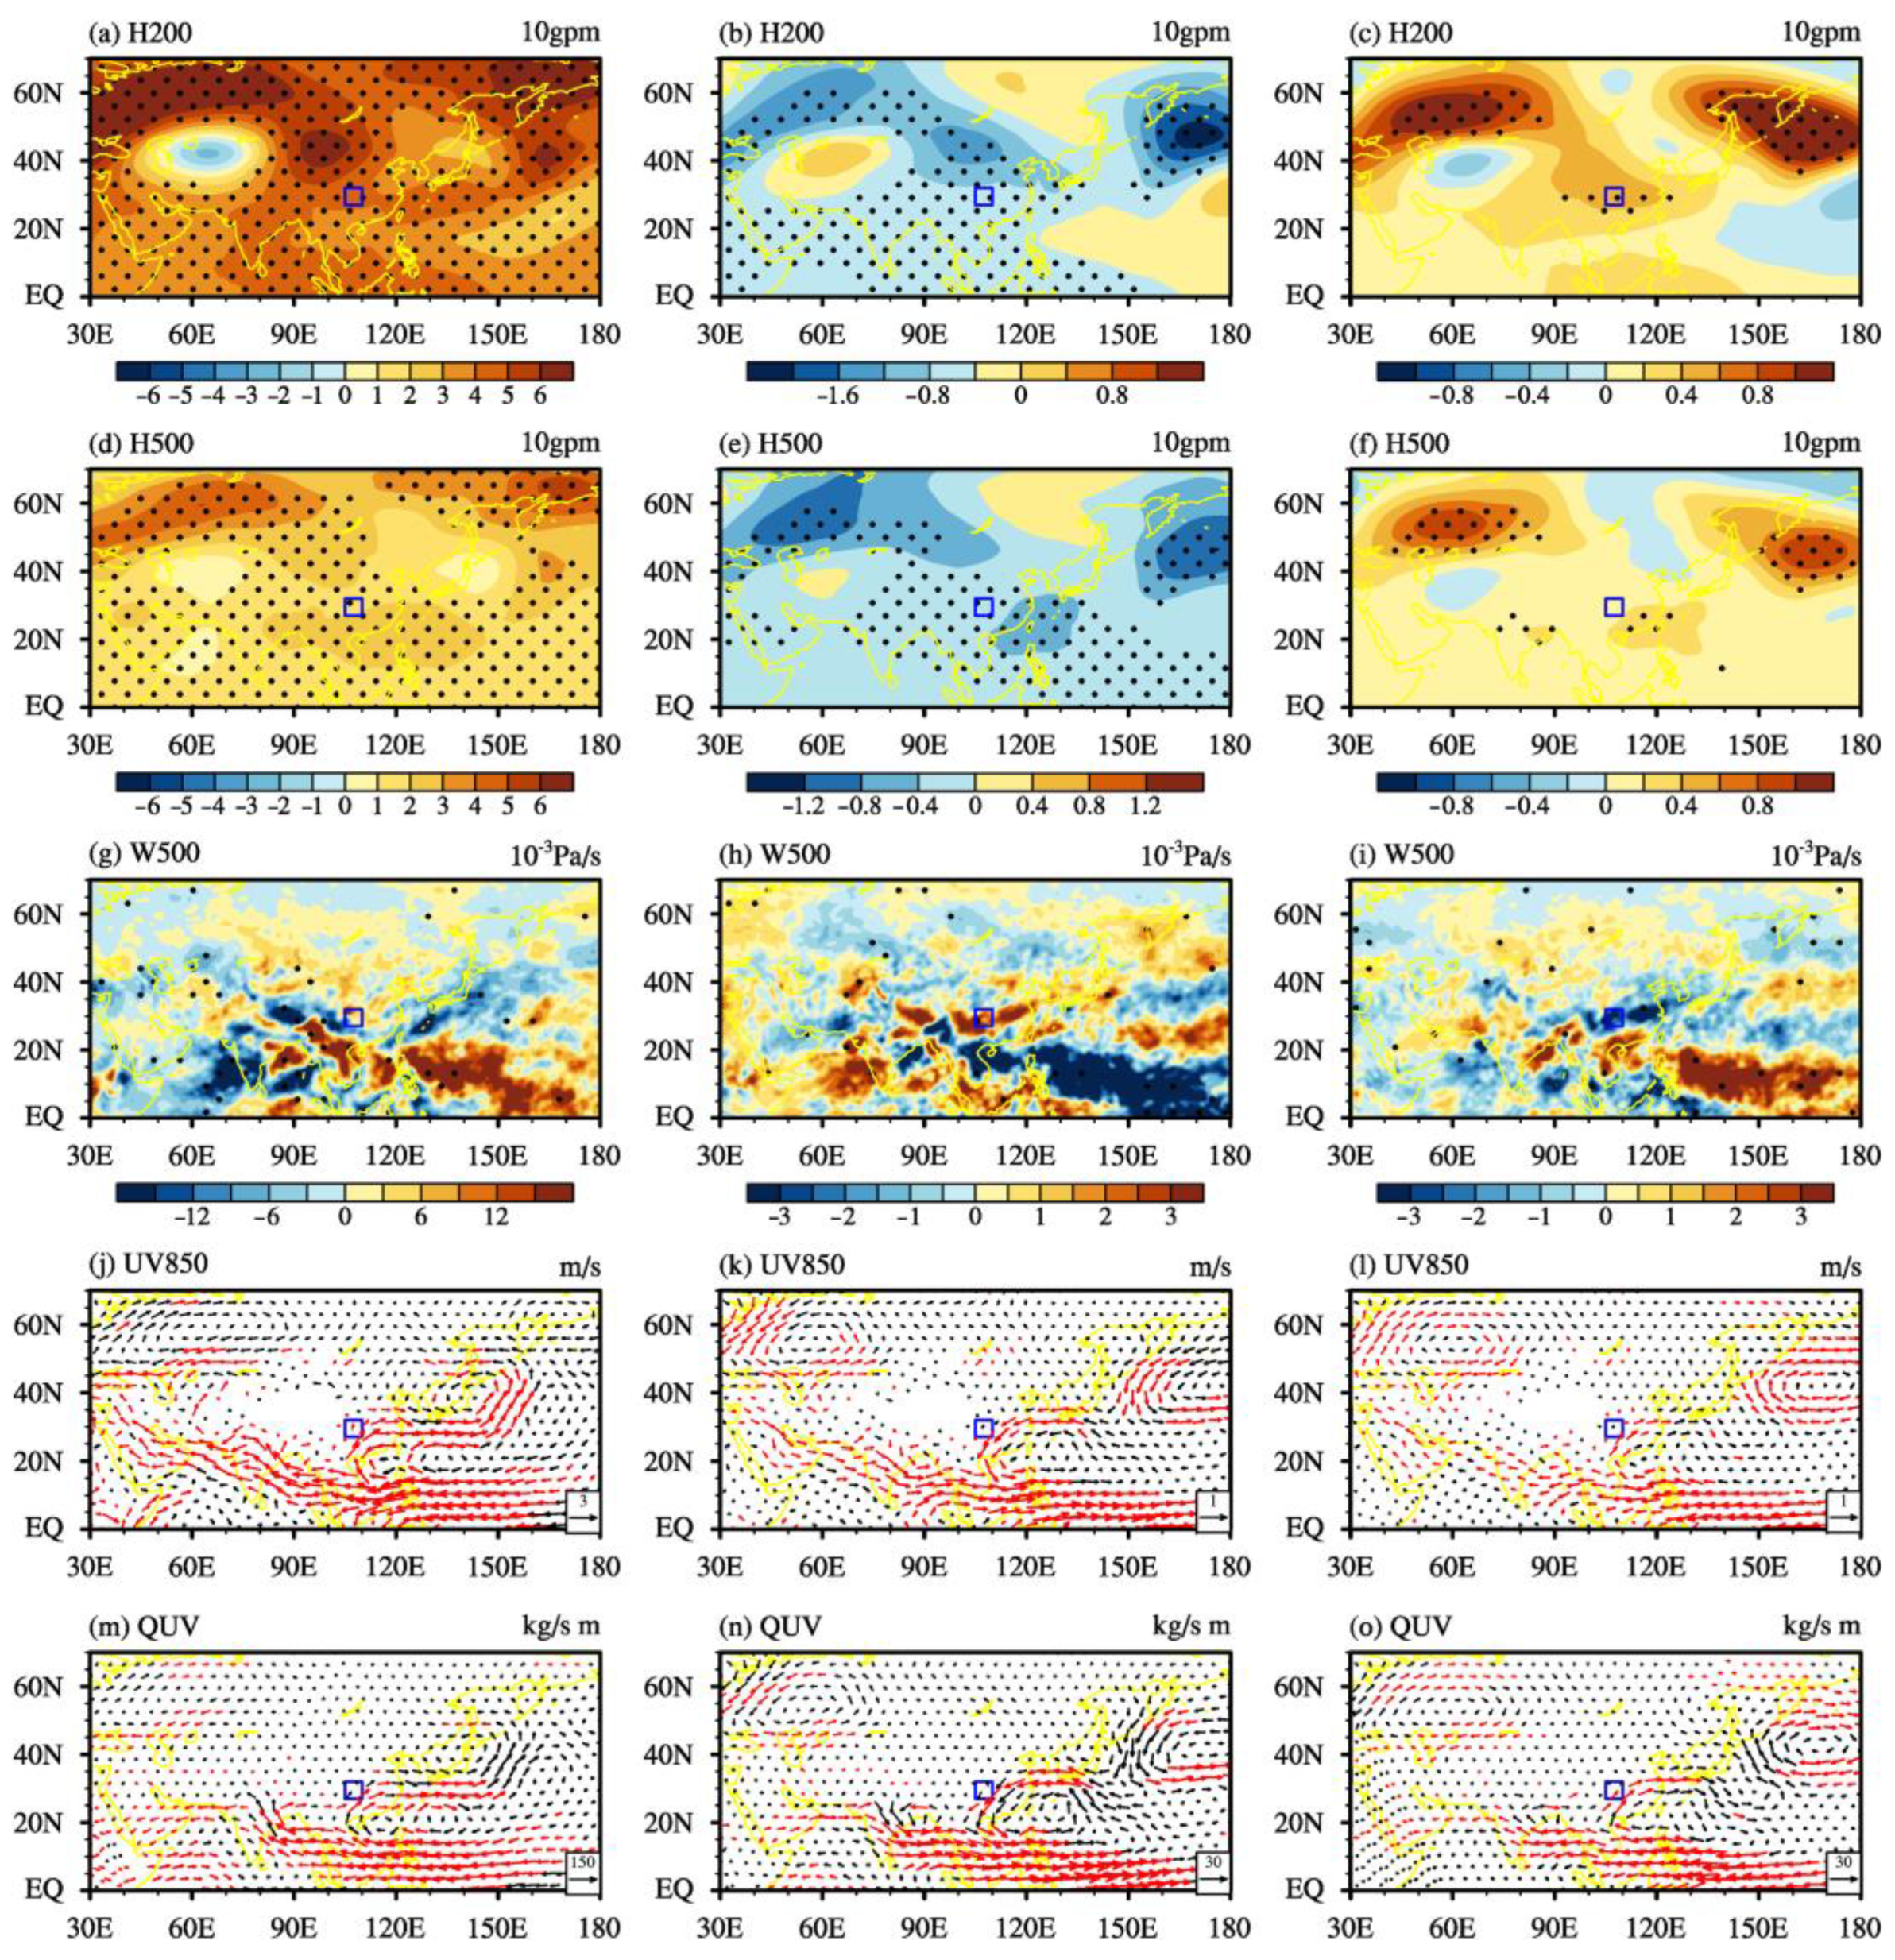
3.2. Characteristics of Associated Circulation

To analyze the differences in atmospheric circulation characteristics between extreme precipitation and general precipitation, we calculated the composite distribution of the 300 hPa potential vorticity (PV), 500 hPa geopotential height (Z), 850 hPa wind field, and 1000–300 hPa vertically integrated water vapor transport for extreme precipitation events and general precipitation events from 1979 to 2020 (Figure 3). From the 300 hPa PV fields (Figure 3a–c), it can be seen that the high-level PV during extreme precipitation events is significantly stronger than that during general precipitation events. According to the PV theory, the high-level PV of cold air can promote the increase in low-level PV and the development of cyclones [41]. When combined with water vapor and other conditions, this can cause heavy or extreme precipitation. On the 500 hPa height field (Figure 3d–f), compared with general precipitation, during extreme precipitation events, the height field over the northeast Asia region, such as the Sea of Okhotsk, is significantly higher, forming a blocking high, which guides cold air southward. At the same time, the height field over the ESWC is lower, and there is low trough activity to the west of it, and the ESWC is located in front of the trough, which is conducive to the occurrence of heavy precipitation events. On the 850 hPa wind field (Figure 3g–i), during extreme precipitation events, the southwest wind is significantly stronger than that during general precipitation events, which leads warm and moist airflow from the south to transport more water vapor to the ESWC. From the vertically integrated water vapor transport field (Figure 3j–l), it can be seen that during extreme precipitation events, the water vapor transported to the ESWC is more apparent than that during general precipitation events. In summary, when extreme precipitation events occur in the ESWC, compared with general precipitation events, the high-level PV is stronger. Stronger cold air invades from the higher latitudes to the ESWC, and the southward flow of water vapor is stronger.

4. Characteristics of Water Vapor Transport during Extreme Precipitation

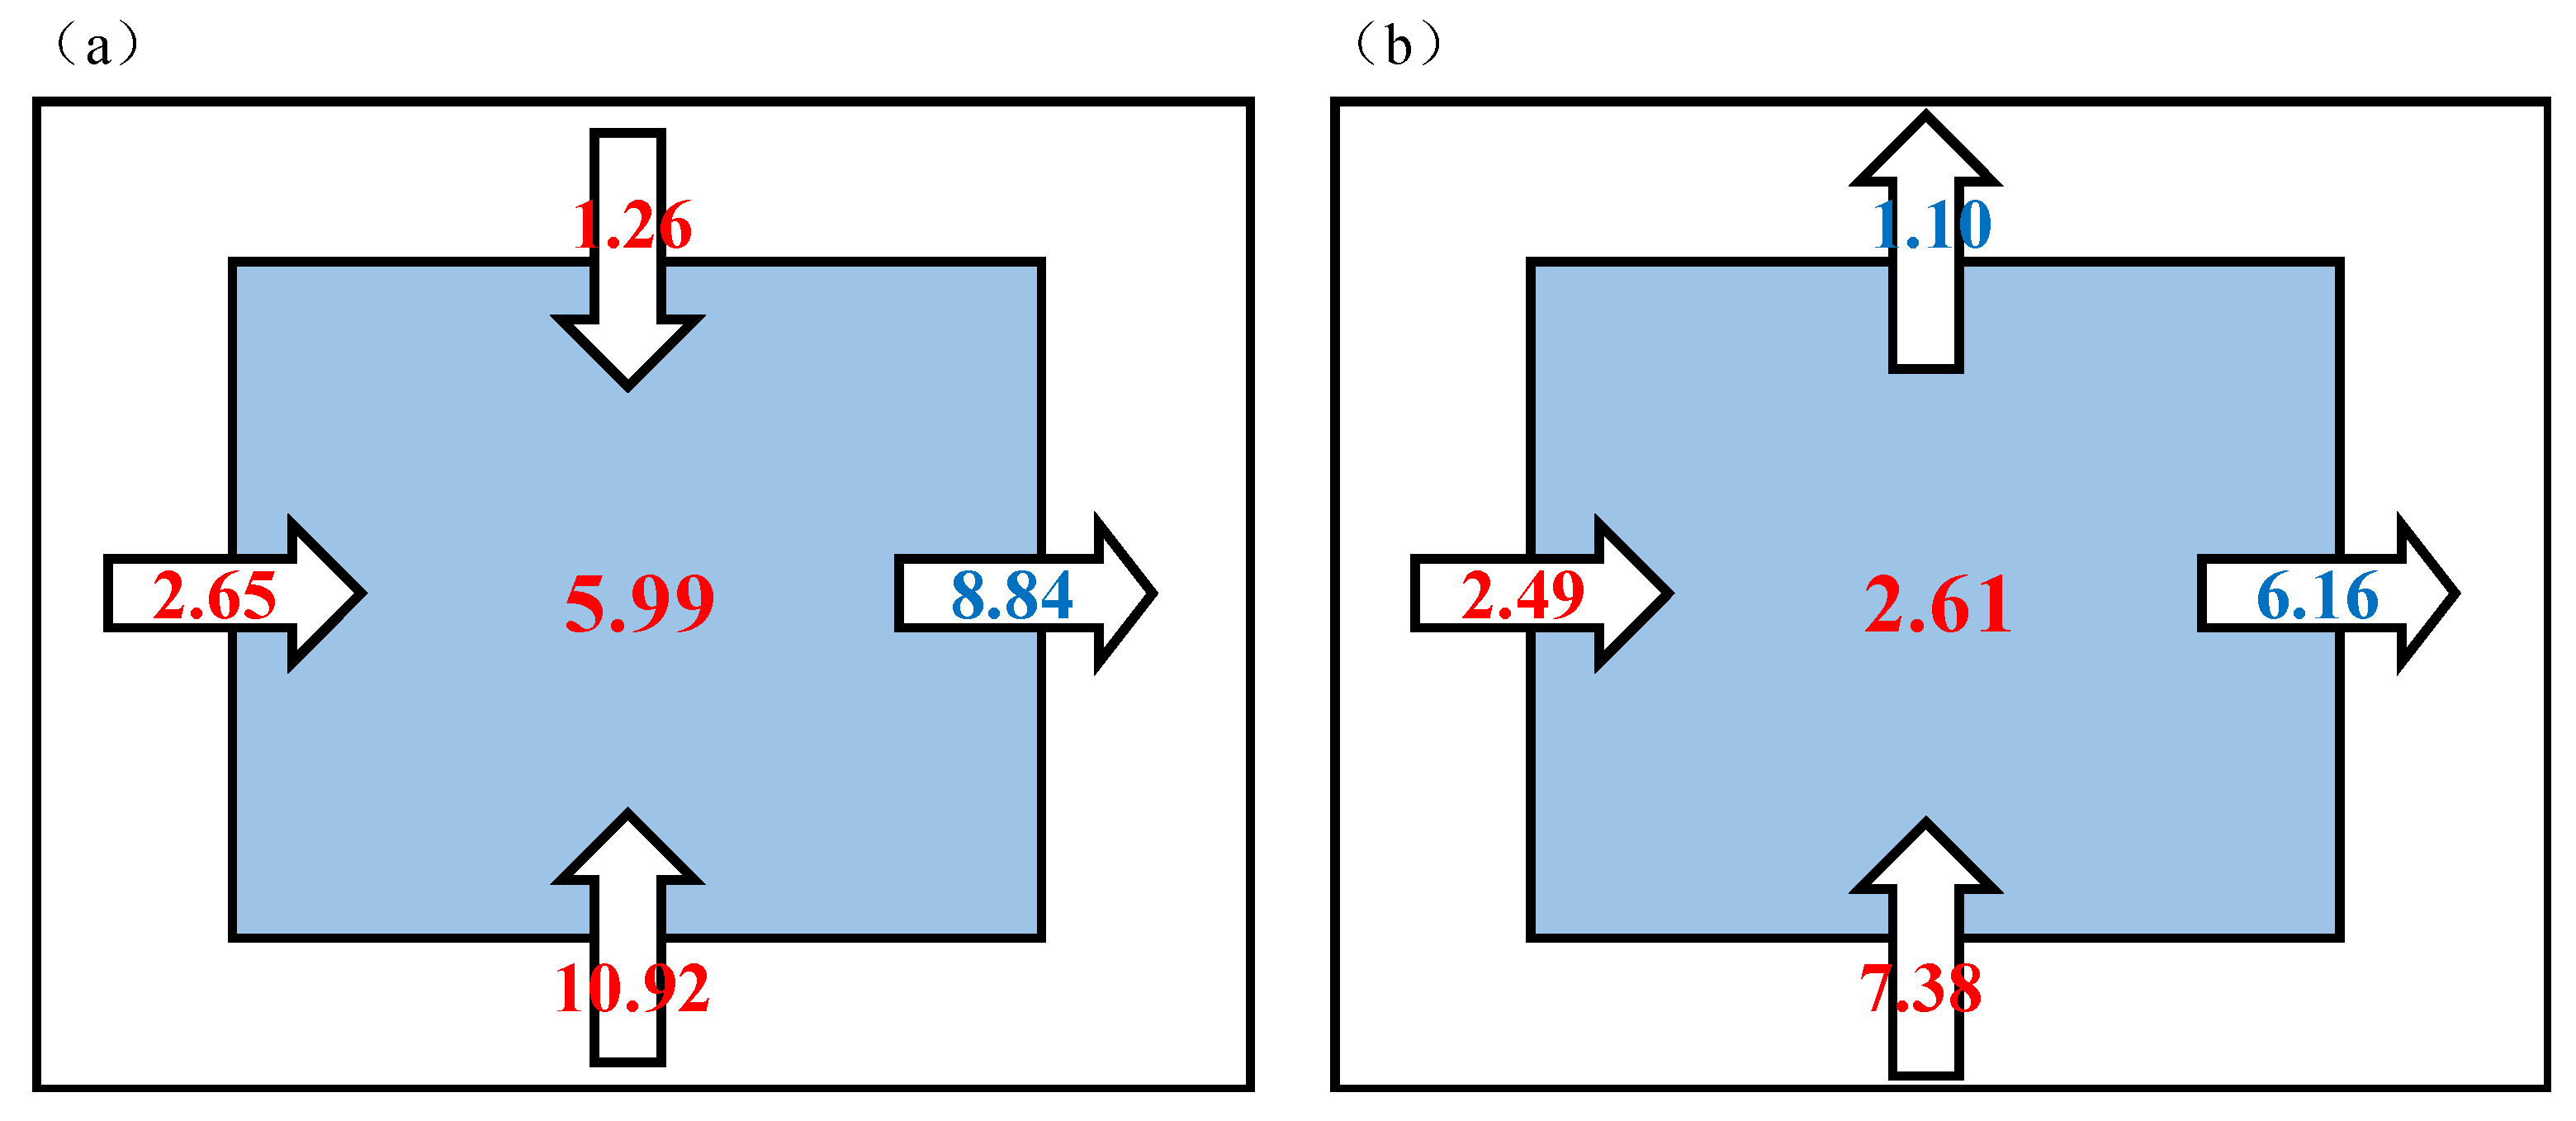
4.1. Water Vapor Budget

Figure 4 shows the average water vapor budget for extreme precipitation and general precipitation in the summer of ESWC from 1979 to 2020. In the case of extreme precipitation (Figure 4a), the total water vapor convergence is 5.99 × 10⁷ kg/s, with water vapor inflow from the south, west, and north boundaries, which are 10.92 × 10⁷ kg/s, 2.65 × 10⁷ kg/s, and 1.26 × 10⁷ kg/s, respectively, and outflow from the east boundary (8.84 × 10⁷ kg/s). In contrast, for general precipitation (Figure 4b), the total water vapor convergence is 2.61 × 10⁷ kg/s, which is only 44% of that during extreme precipitation. Water vapor inflow occurs from the south and west boundaries, which are 7.38 × 10⁷ kg/s and 2.49 × 10⁷ kg/s, respectively. The water vapor inflow from the south boundary is significantly less than that during extreme precipitation, while that from the west boundary remains relatively stable. Water vapor outflows occur from the east and north boundaries, which are 6.16 × 10⁷ kg/s and 1.10 × 10⁷ kg/s, respectively. It can be seen that during extreme precipitation events in the ESWC, more water vapor is transported into this region than during general precipitation events.
Table 2 shows the correlation coefficients between R95r, R95d of extreme precipitation events and the water vapor budget at different boundaries and overall. It can be seen that the contribution rate of extreme precipitation and the number of extreme precipitation days are significantly positively correlated with the water vapor income at the boundary of south and west, as well as the overall water vapor budget, while significantly negatively correlated with the outflow at the eastern boundary. This indicates that there is a significant water vapor input from the south and west boundaries during extreme precipitation events in the ESWC during summer.

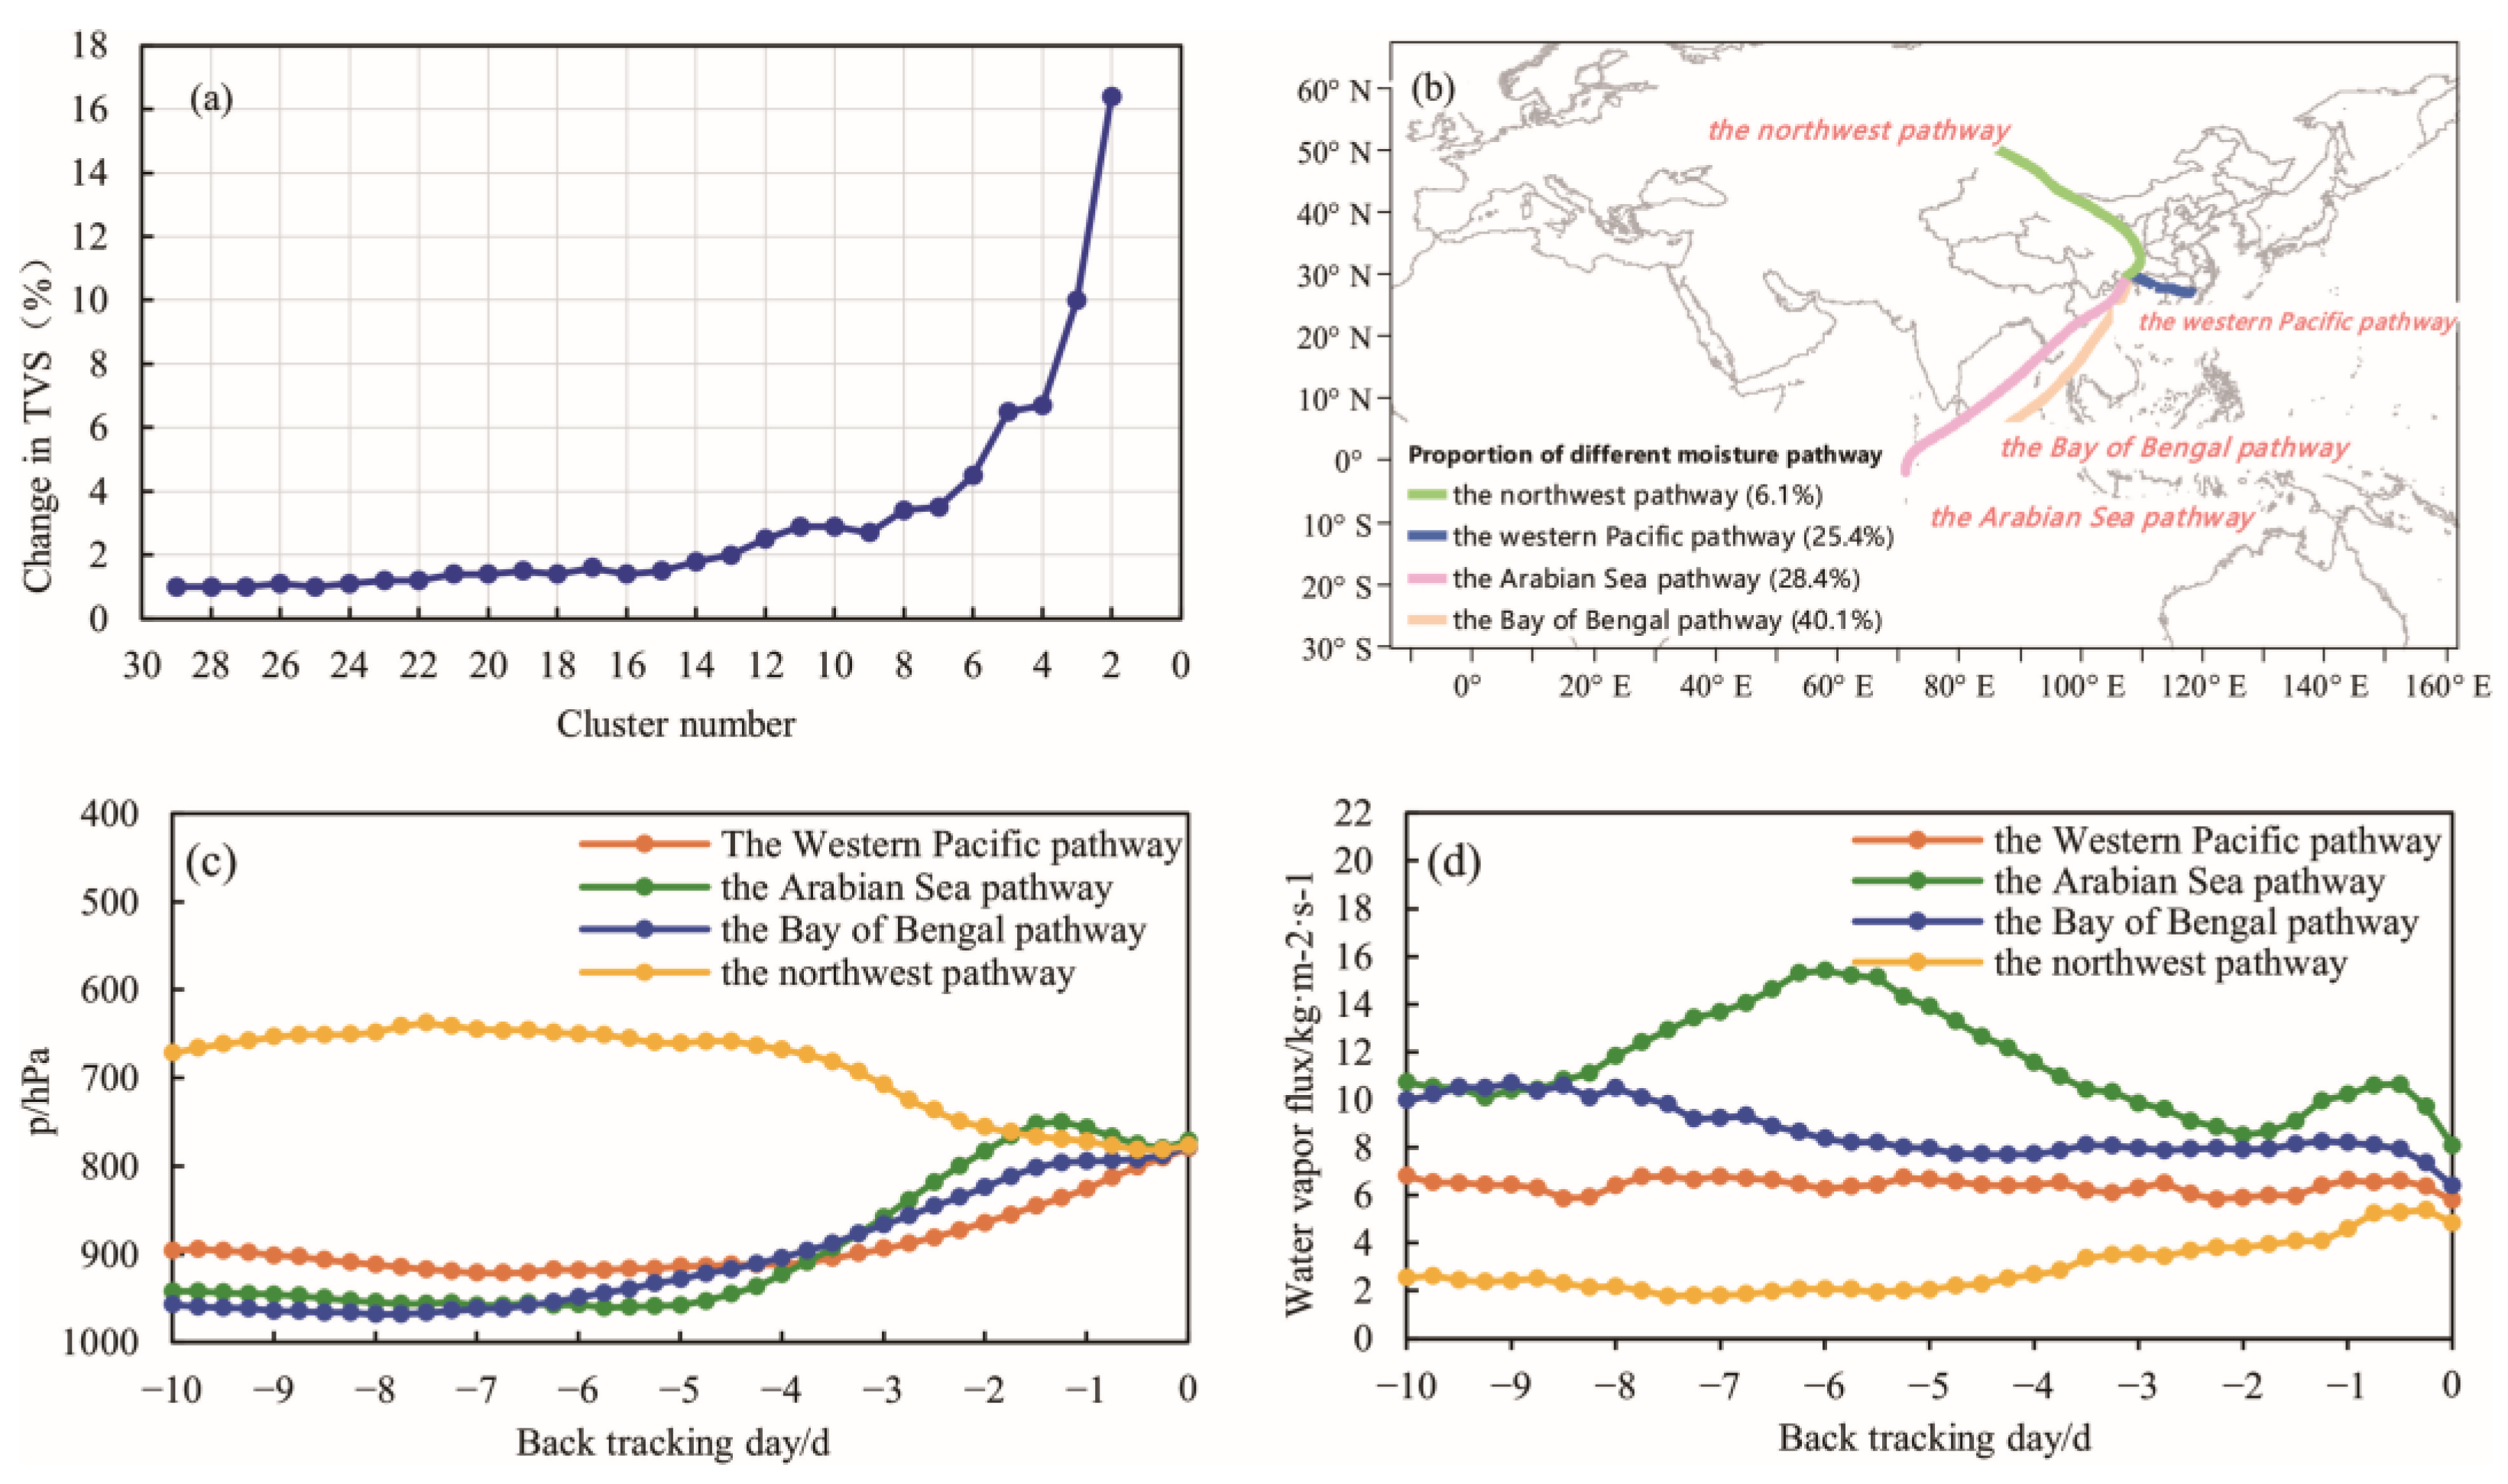
4.2. Source of Water Vapor

To further understand the characteristics of external water vapor source paths and contributions during extreme precipitation events in the ESWC during summer, we used the HYSPLIT model to simulate the backward trajectory of extreme precipitation events from 1979 to 2020.
By simulating the water vapor path of extreme precipitation events during the summer from 1979 to 2020 and clustering the obtained trajectories using cluster analysis, the spatial variance growth rate during the clustering process was analyzed (Figure 5a). It can be seen that the spatial variance growth rate of the trajectory increases rapidly after the number of clusters is less than four; therefore, the simulated trajectories were finally clustered into four categories. Figure 5b shows the four water vapor pathways during extreme precipitation events in the ESWC: the first pathway is the Bay of Bengal pathway, where water vapor mainly comes from the cross-equatorial flow in the middle and east of the Indian Ocean, passes through the Bay of Bengal and Indochina, and enters the ESWC; the second pathway is the Arabian Sea pathway, where water vapor mainly comes from the Somali Peninsula east of Africa, passes through the Bay of Bengal and northern Indochina, and enters the ESWC through Yunnan; the third pathway is the western Pacific pathway, where water vapor mainly comes from the coastal areas of eastern China and the western Pacific, moves westward from northern Fujian, passes through Jiangxi and Hunan before entering the ESWC; the fourth pathway is from the northwest, where water vapor mainly comes from West Siberia, passes through Kazakhstan and enters Xinjiang, then enters the ESWC through Gansu, Shaanxi, Sichuan, which is consistent with previous research results [42,43,44].
From the variation of the height of water vapor channels (Figure 5c), it can be seen that the heights of water vapor channels from the Bay of Bengal, Arabian Sea, and western Pacific are mostly below 900 hPa, and they undergo varying degrees of uplift before entering the ESWC. The height uplift is more apparent for the Bay of Bengal and Arabian Sea channels due to the need to pass through the Yunnan-Guizhou Plateau, and the water vapor is transported to the vicinity of 800 hPa above the ESWC. The vertical variation of water vapor channels from the northwest channel is small, basically maintained at around 750 hPa to 650 hPa, and it decreases slightly after reaching the ESWC, finally merging with the water vapor from the Bay of Bengal, Arabian Sea, and western Pacific at around 800 hPa above southwestern China. From the variation of water vapor flux (Figure 5d), it can be seen that the water vapor flux from low-latitude oceanic channels (Bay of Bengal and Arabian Sea channels) is significantly greater than that from high-latitude inland channels (northwest channel), and the water vapor flux from the western Pacific channel is between the two. The water vapor flux of the Arabian Sea channel undergoes an apparent increase when over the ocean and then decreases slightly after entering the land and crossing the Yunnan-Guizhou Plateau. The water vapor flux of the other three water vapor channels does not change much over time.
Comparing the quantities of the water vapor channels that finally arrive at the ESWC (Table 3), it is found that among the four channels, the trajectory number from the Bay of Bengal channel has the largest proportion (40.1%), followed by the Arabian Sea channel and the western Pacific channel (28.4% and 25.4%, respectively), and the northwest channel has the smallest proportion (6.1%). In terms of the specific humidity contribution rate of each channel, the Bay of Bengal channel has the largest specific humidity contribution rate, accounting for 42.12% of the total contribution rate, followed by the Arabian Sea channel (30.13%), the western Pacific channel (23.09%), and the northwest channel (4.66%). In terms of the water vapor flux contribution rate of each channel, the water vapor flux contribution rate of the Bay of Bengal channel is still the largest, reaching 38.88%, followed by the Arabian Sea channel (34.82%), the western Pacific channel (21.91%), and the northwest channel still has the smallest water vapor flux contribution rate, accounting for only 4.39%. It can be seen that the trajectory number from the Bay of Bengal channel has the largest proportion and the greatest contribution to water vapor, followed by the Arabian Sea. In summary, during the summer of 1979–2020, the water vapor contribution to extreme precipitation in the ESWC was the largest from the Bay of Bengal, followed by the Arabian Sea, the western Pacific, and a small amount from the north. In addition, it can be seen from the equivalent potential temperature that the water vapor from the ocean (Bay of Bengal, Arabian Sea, and western Pacific) has a warm and humid characteristic (large equivalent potential temperature), while the water vapor from the north has a dry and cold characteristic (small equivalent potential temperature).

5. Driven Factors of Interannual Variability of Extreme Precipitation and Physical Conceptual Model

Accurately predicting the inter-annual variation in extreme precipitation days is crucial for disaster prevention and relief decision making. In this section, we use the number of extreme precipitation days in summer as the object of analysis to investigate the factors affecting its interannual variability and to preliminarily establish a physical conceptual model of its influencing mechanism.

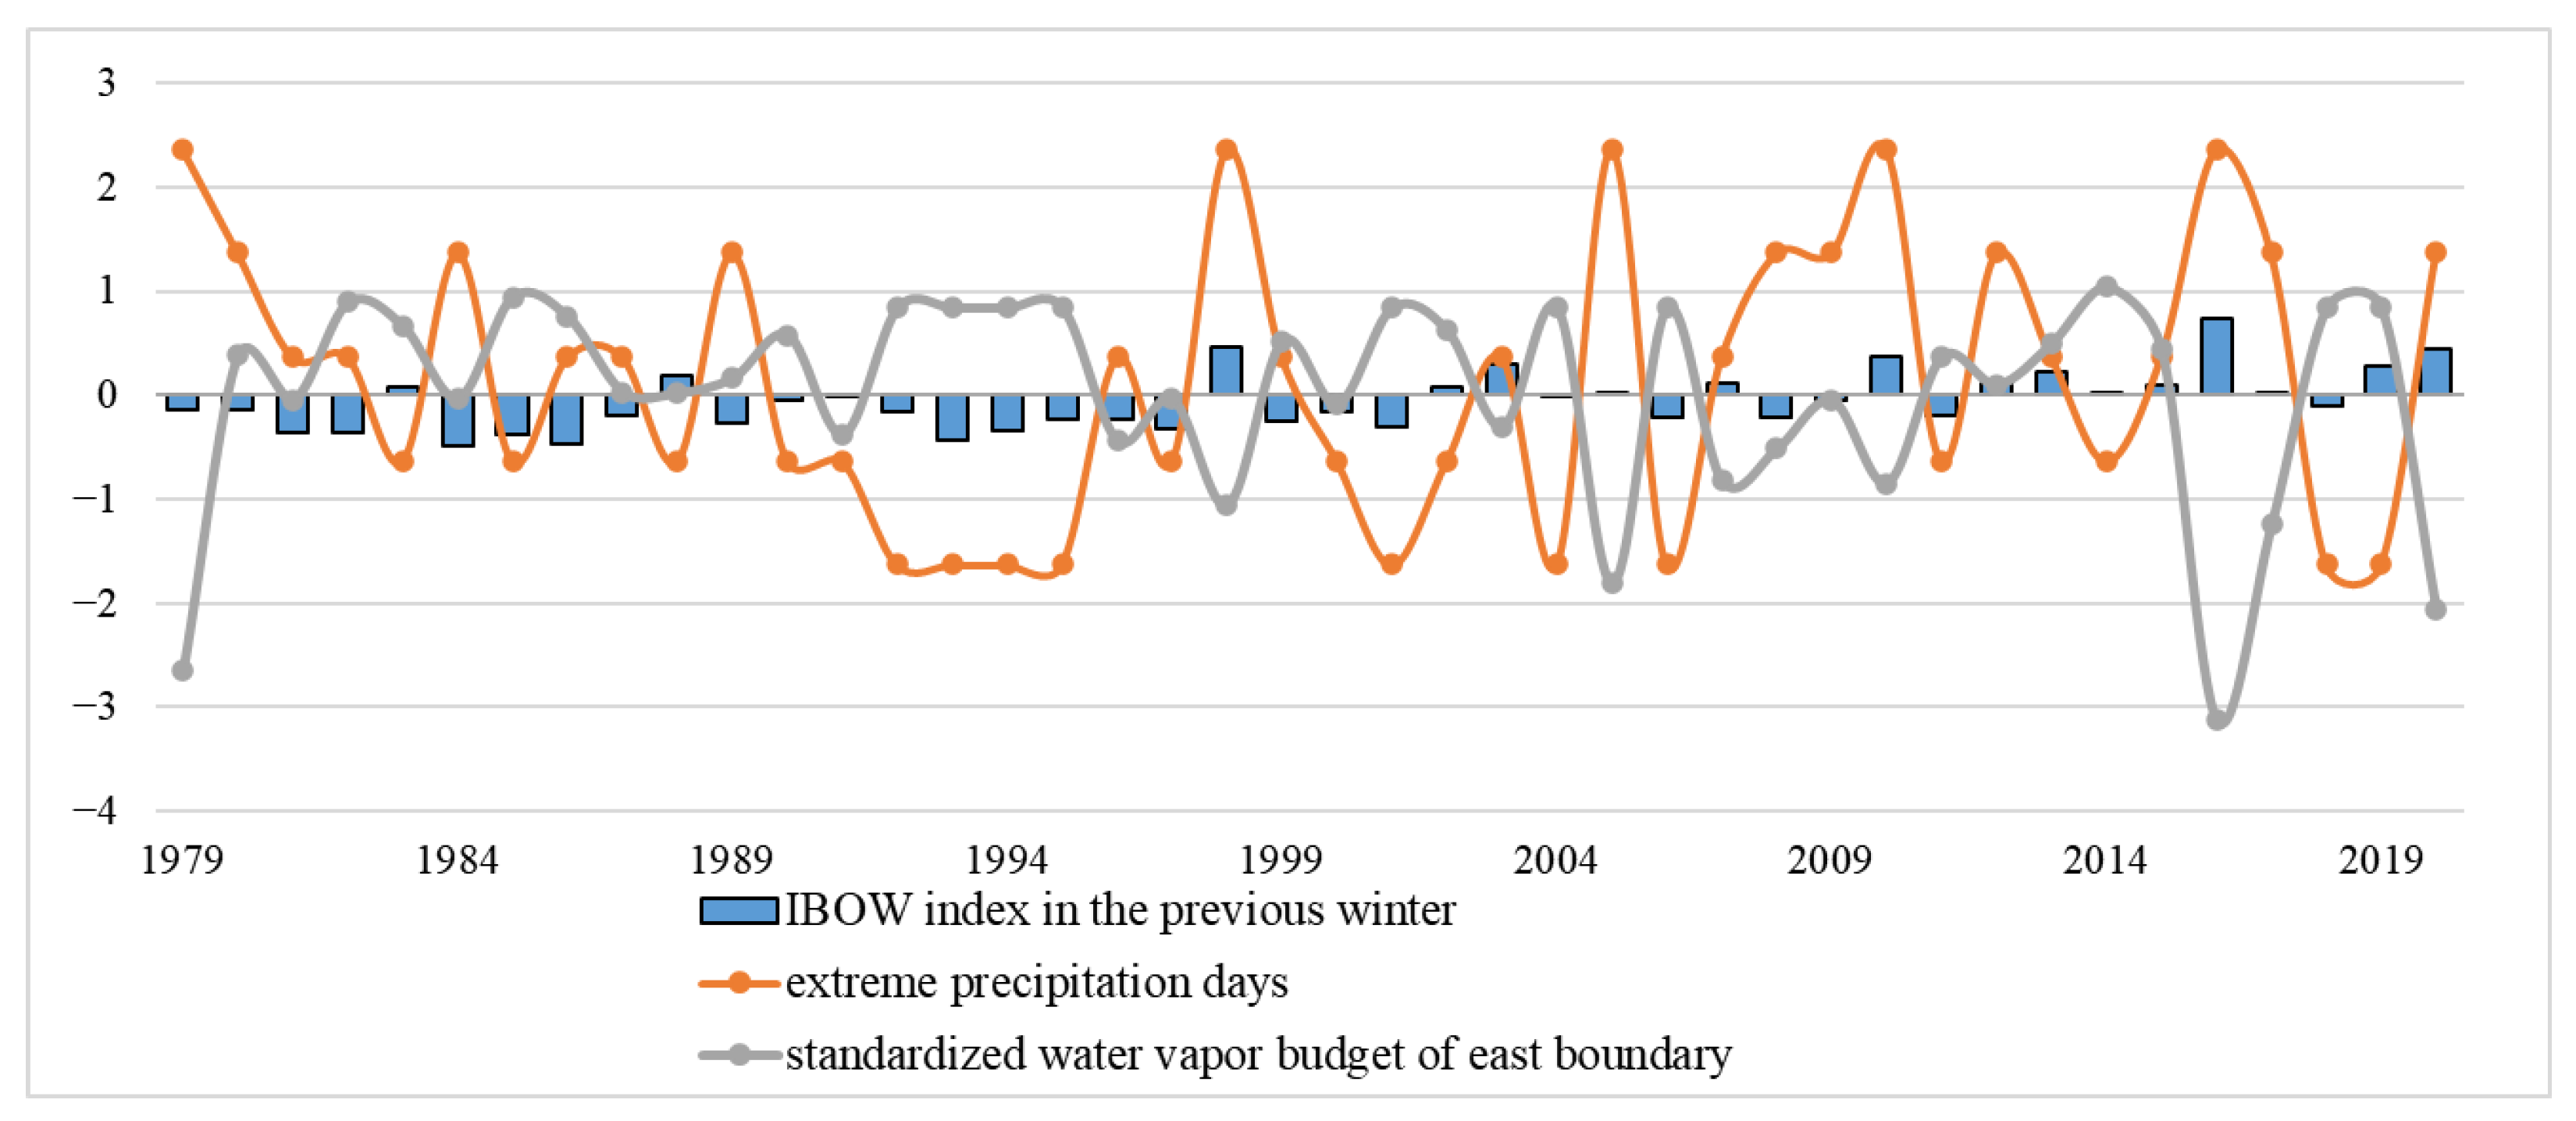
5.1. Relationship between the Number of Extreme Precipitation Days and the IOBW Index, Water Vapor Budget

Previous analyses have shown that the largest contribution to extreme precipitation in the eastern part of the southwest region comes from the Bay of Bengal, followed by the Arabian Sea, the western Pacific, and the northwest region. The variation in the strength of water vapor transport in the water vapor channel is closely related to changes in sea surface temperature and atmospheric circulation. Sea surface temperature mainly affects the transport path and strength of the water vapor channel by influencing atmospheric circulation. Previous studies have shown that Indian Ocean sea surface temperature has an important impact on East Asian water vapor transport and climate [45,46,47,48,49]. In this section, we calculate the correlation coefficient between the IOBW index in the previous winter and R95d, water vapor budget of the four boundaries and total water vapor budget (Table 4). It can be seen that the correlation coefficient between IOBW index and R95d reached 0.37, passing the 95% significance test. IOBW index is most closely related to the eastern boundary, with correlation coefficient reaching −0.53, passing the significance test of 99.9%. The correlation coefficient with the southern and western boundaries also passed the significance test. This indicates that when the IOBW index in winter has a positive (negative) value and outflow of the water vapor budget of east boundary is weak (strong), the number of extreme precipitation days in the ESWC in summer is more (less).

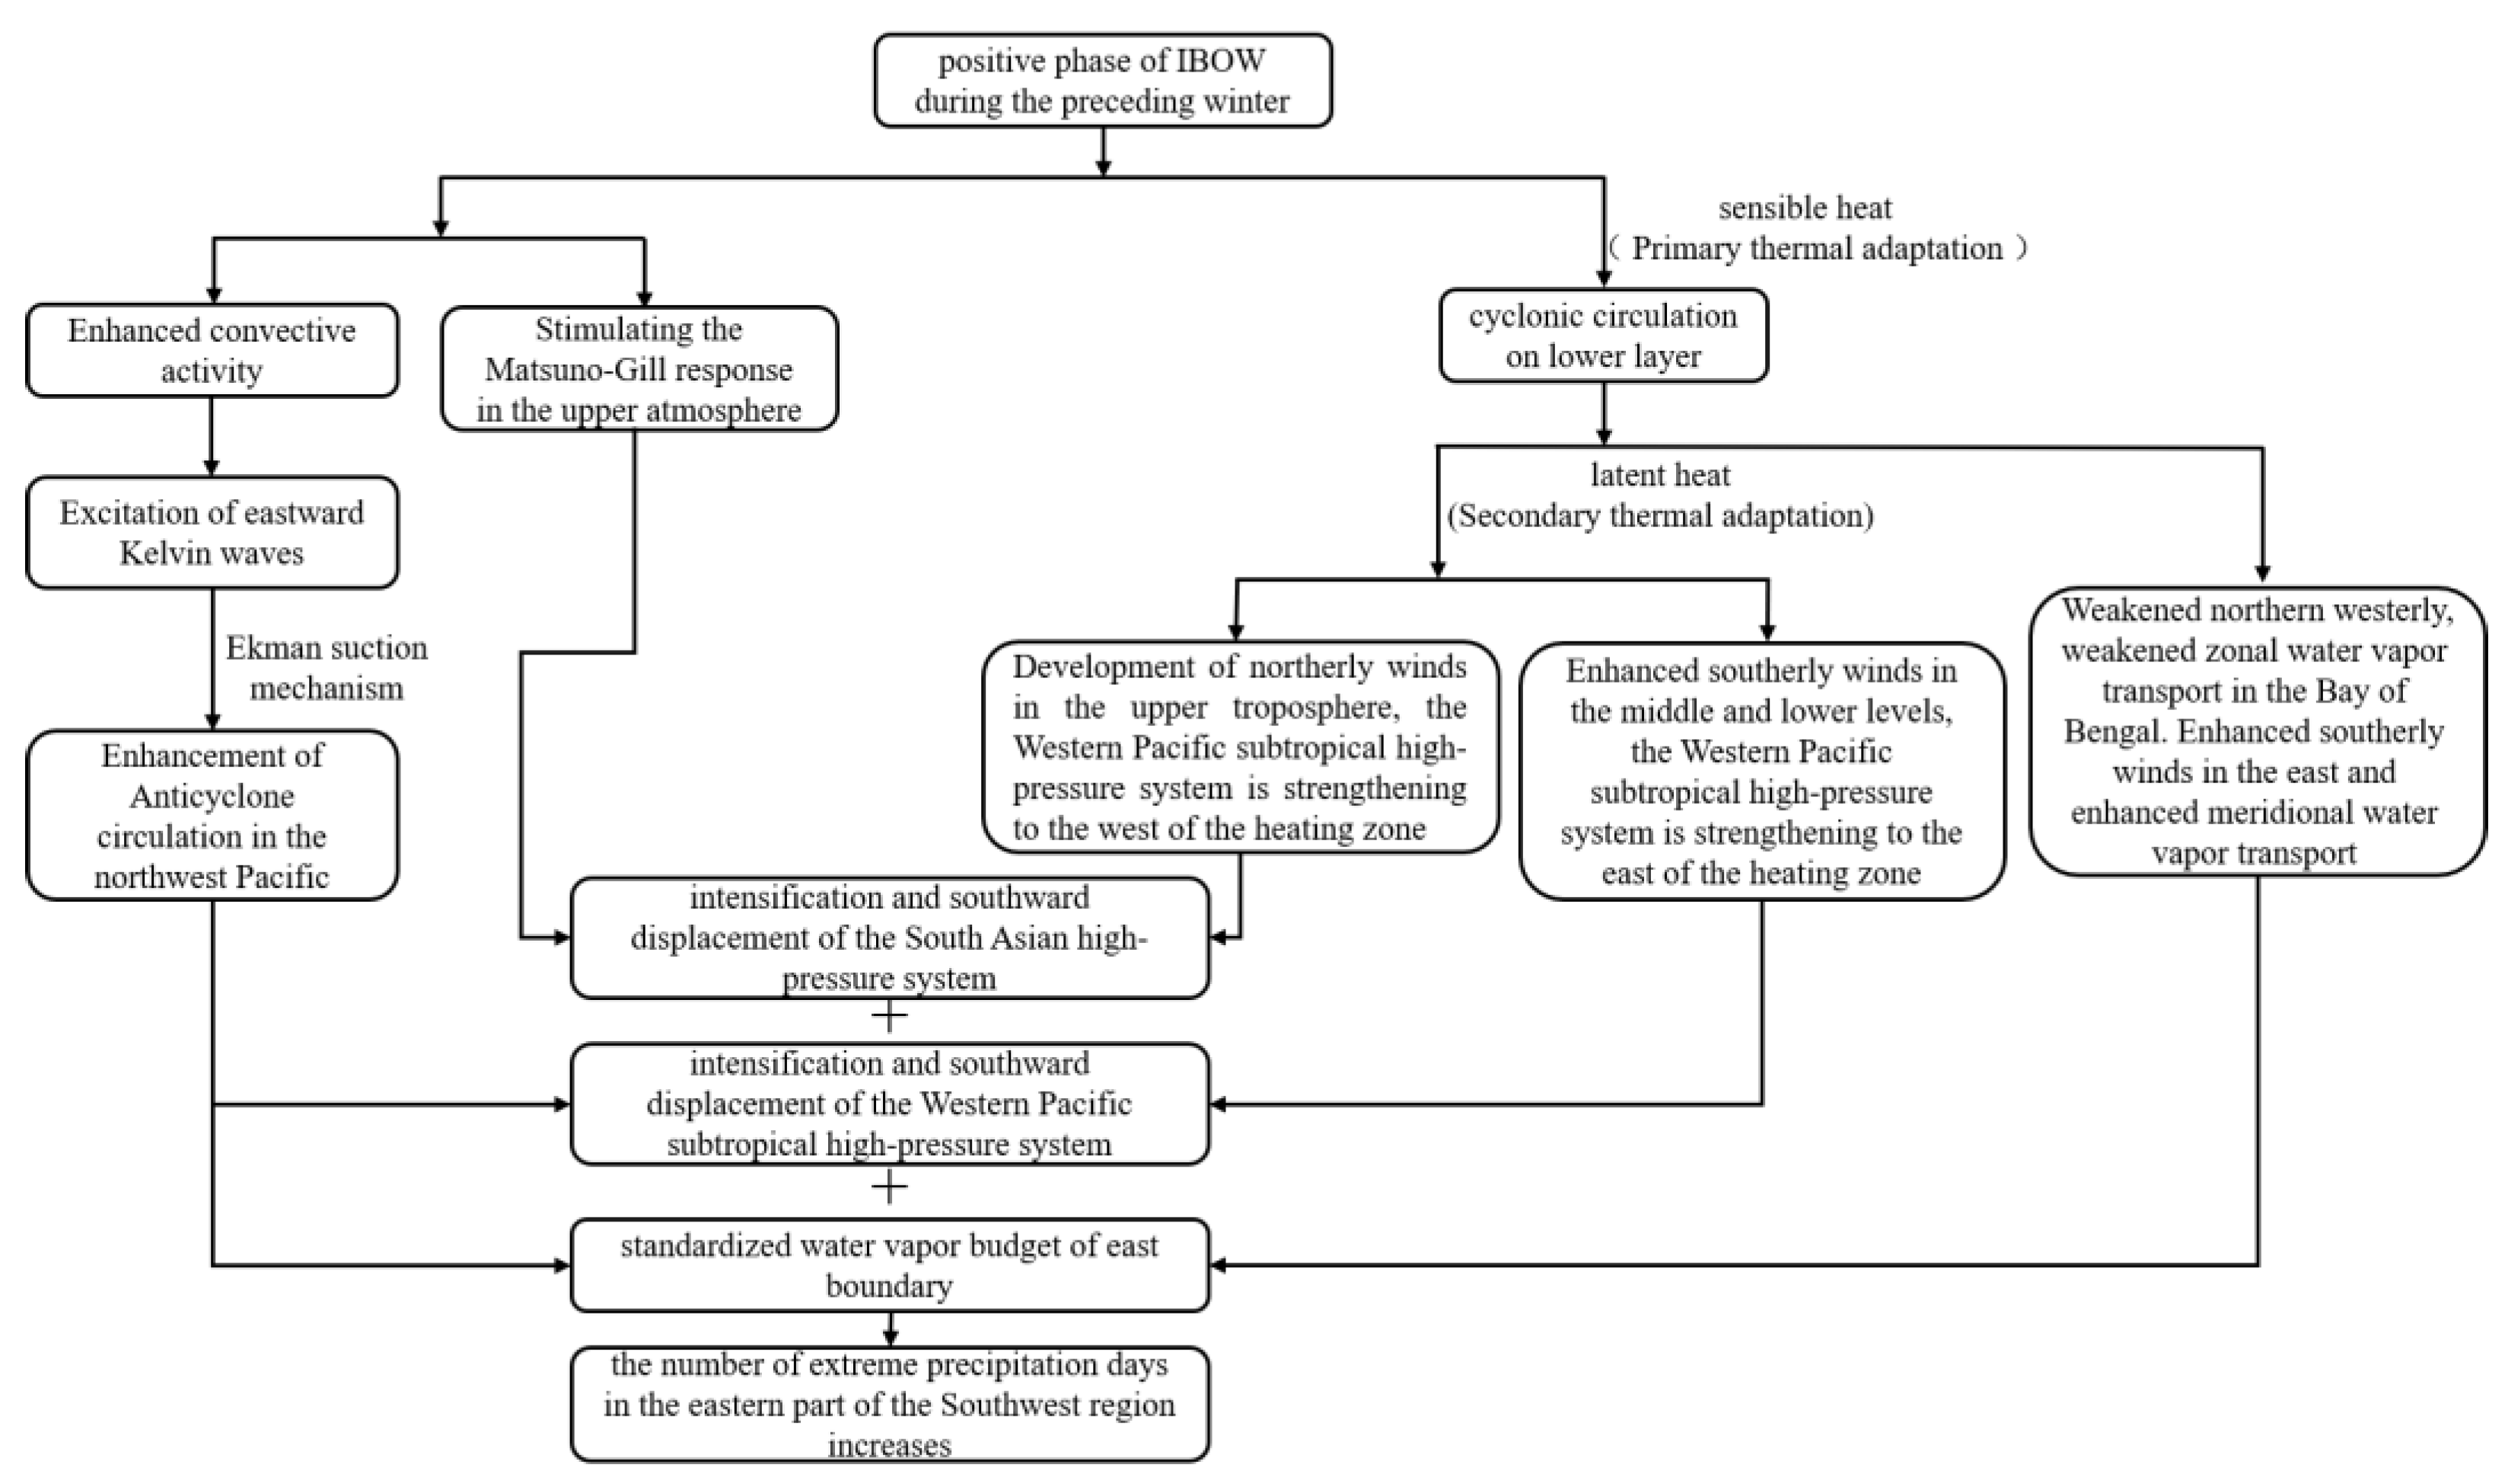
5.2. Physical Concept Model of the Impact of Extreme Summer Precipitation

Figure 6 shows the linear regression against the IOBW index in winter, water vapor budget of east boundary, extreme precipitation days in the ESWC of the summer atmospheric fields. When the current period’s winter IOBW mode is in a positive (negative) phase, the South Asian high pressure is significantly stronger (weaker) in summer (Figure 6a). The 500 hPa western Pacific subtropical high is stronger (weaker), and the height field is stronger (weaker) in the middle and high latitudes of the Ural Mountains and Lake Baikal region. In the entire Yangtze River basin including Chongqing, there is a prevalent upward (downward) airflow (Figure 6d,g). In China’s middle and lower reaches of the Yangtze River and its south region, there is a prevalent southwest-northeast (northeast-southwest) airflow and water vapor transport (Figure 6j,m). When outflow of the water vapor budget of east boundary in the ESWC is weaker, the intensity changes in the South Asian high pressure, western Pacific subtropical high, and other factors are relatively insignificant (Figure 6b,e). There is a prevalent downward airflow in the middle and lower reaches of the Yangtze River and its south region (Figure 6h), and the southwest-northeast airflow and water vapor transport are relatively weak (Figure 6k,n). When the summer extreme precipitation days in the eastern part of the Southwest region are more, the intensity of the South Asian high pressure and western Pacific subtropical high is stronger (Figure 6c,f), there is a prevalent upward airflow in the middle and lower reaches of the Yangtze River and Jiangnan region (Figure 6i), and the southwest-northeast airflow and water vapor transport are more significant (Figure 6l,o). This is consistent with the atmospheric circulation and water vapor transport characteristics when the IOBW mode is in a positive phase and the water vapor budget of east boundary is weaker.
At the same time, we calculated the correlation coefficient between the IOBW index in the previous winter and the IOBW index in spring and summer, which reached 0.91 in spring and 0.73 in summer, both passing the significance test of 99.9%, showing that the SST of the Indian Ocean in winter will continue to affect the SST of the Indian Ocean in spring or summer.
The abnormal winter Indian Ocean sea surface temperature affects summer water vapor transport and atmospheric circulation, thus affecting extreme summer precipitation in the ESWC. Previous studies [50] have shown that if the sea surface temperature of the Indian Ocean is warm, it will intensify water vapor evaporation and the sea–air temperature difference, resulting in an abnormal increase in sensible heat, the formation of cyclonic circulation in the lower atmosphere, a weakening of the westerly winds in the northern part, a reduction in meridional water vapor transport in the Bay of Bengal, and an intensification of zonal water vapor transport. The strong southward wind on the eastern side of the abnormal development area transports a large amount of water vapor northward, resulting in anomalous precipitation. These anomalous precipitation events, while extending northeastward, are accompanied by deep convective latent heating. In the lower troposphere, heating increases with height, leading to the development of southerly wind and the strengthening of the subtropical high-pressure system on the eastern side of the heating region. In the upper troposphere, heating decreases with height, resulting in the development of a northern wind and the strengthening of the subtropical high-pressure system on the western side of the heating region. Therefore, when the northern Indian Ocean exhibits positive sea surface temperature anomalies, the western Pacific subtropical high-pressure system at the 500 hPa level and below will anomalously develop and intensify in a southward direction, and the South Asian high-pressure system at the 200 hPa level will also anomalously develop and strengthen. Additionally, the warm anomalies in the tropical Indian Ocean can induce a Matsuno–Gill response in the upper atmosphere, causing abnormal height field anomalies in the troposphere, which in turn, lead to an intensified South Asian high-pressure system. At the same time, enhanced convective activity in the upper atmosphere can excite eastward propagating Kelvin waves to the western Pacific region. Under the Ekman pumping effect, this leads to an anomalous intensification of anticyclones over the northwest Pacific (Kelvin wave–Ekman pumping effect), which favors the strengthening of eastward water vapor transport in East Asia [51,52,53,54,55,56].
Figure 7 shows the anomaly variations of the winter IOBW index, standardized water vapor budget of east boundary, and summer extreme precipitation days in the ESWC. It can be observed that when the winter sea surface temperature in the tropical Indian Ocean is higher (lower), the outflow of water vapor budget of east boundary is weaker (stronger) (correlation coefficient −0.53, above a 99.9% confidence level), and the summer extreme precipitation days in the ESWC are more (less) (correlation coefficient 0.37, reaching a 95% confidence level).
Based on the above analysis, it can be concluded that a higher sea surface temperature (SST) in the tropical Indian Ocean during the preceding winter (positive phase of IOBW) can lead to the intensification and southward displacement of the western Pacific subtropical high-pressure system and the South Asian high-pressure system during the summer. This result has led to an increase in water vapor transport at the eastern boundary of the southwestern region. Consequently, the number of extreme precipitation days in the ESWC increases. The physical conceptual model illustrating these relationships is presented in Figure 8.

6. Conclusions and Discussion

Through the analysis of extreme precipitation and water vapor transport characteristics in the ESWC during summer, followed by a preliminary diagnostic analysis of the relationship between extreme precipitation days and preceding winter sea surface temperature (SST) in the tropical Indian Ocean, the following main conclusions are drawn:
(1) Since 1979, the contribution rate and number of extreme precipitation days in the ESWC during summer have shown a slight increasing trend. When there are more (fewer) extreme precipitation days in this region, the contribution rate of extreme precipitation also tends to be higher (lower), while the contribution rate of general precipitation tends to be lower (higher). This may result in a higher (lower) total precipitation amount. During extreme precipitation events in this region, the upper-level potential vorticity is stronger, and the northward movement of cold air is more likely to occur, while the southward water vapor transport is stronger compared to general precipitation events. The amount of water vapor input to this region during extreme precipitation events is significantly higher than that during general precipitation events.
(2) During periods of extreme precipitation event, there are four main pathways for water vapor transport in the ESWC: the Bay of Bengal, the Arabian Sea, the western Pacific, and the northwest direction. The largest contribution of water vapor comes from the Bay of Bengal, followed by the Arabian Sea, then the western Pacific, and there is also a small amount coming from the northwest direction. Water vapor from the oceans has warm and humid characteristics, while water vapor from the north has dry and cold characteristics.
(3) Preceding winter SST in the tropical Indian Ocean affects summer water vapor transport and atmospheric circulation, thereby influencing extreme precipitation in the ESWC. Higher SST in the tropical Indian Ocean during the preceding winter (positive phase of IOBW) can lead to the intensification and southward displacement of the western Pacific subtropical high-pressure system and the South Asian high-pressure system, as well as the weakening of outflow of the water vapor budget of the eastern boundary. This, in turn, results in an increase in the number of extreme precipitation days in the ESWC during summer.
This study analyzed the water vapor transport characteristics of extreme precipitation in the ESWC during summer and preliminarily established a conceptual model to understand the factors influencing the number of extreme precipitation events. In this paper, the clustering method and mixed single-particle Lagrange integrated trajectory (HYSPLITv5.0) model was used to simulate the water vapor characteristics of extreme precipitation in the ESWC, and the quantitative and objective water vapor budget and water vapor sources and contributions were obtained. However, further verification and quantitative modeling work are required before its practical application in forecasting operations. Regarding the cross-seasonal mechanism of how preceding winter sea surface temperature (SST) in the tropical Indian Ocean affects the number of extreme precipitation days in the ESWC during summer, it involves aspects such as SST persistence, which requires further dynamical diagnostic analysis using numerical modeling and other methods. Due to the complexity of factors influencing extreme precipitation events, future research and application verification work should focus on studying and understanding other influencing factors, such as the Qinghai-Tibet Plateau, and their comprehensive interactive mechanisms, as well as the development of quantitative prediction models.

Author Contributions

Conceptualization, Y.L., Y.W., J.Z. and B.X.; methodology, Y.L., Y.W. and J.Z.; writing—original draft preparation, Y.L. and Y.W.; writing—review and editing, Y.L., J.H. and D.H. All authors have read and agreed to the published version of the manuscript.

Funding

This work was supported by the National Natural Science Foundation of China (Grant 41875111), Special program for innovation and development of China Meteorological Administration (Grants CXFZ2022J031, CXFZ2021J018).

Institutional Review Board Statement

Not applicable.

Informed Consent Statement

Not applicable.

Data Availability Statement

Not applicable.

Conflicts of Interest

The authors declare no conflict of interest.

References

  1. Sun, J.; Zhang, F. Daily extreme precipitation and trends over China. Sci. China Earth Sci. 2017, 60, 2190–2203. [Google Scholar] [CrossRef]
  2. Zhou, Y.; Liu, L.; Zhu, K.; Li, J. Simulation and evolution characteristics of mesoscale systems occurring in Beijing on 21 July 2012. Chin. J. Atmos. Sci. 2014, 38, 885–896. (In Chinese) [Google Scholar]
  3. Lei, L.; Sun, J.S.; He, N.; Liu, Z.; Zeng, J. A study on the mechanism for the vortex system evolution and development during the torrential rain event in North China on 20 July 2016. Acta Meteorol. Sin. 2017, 75, 658–699. (In Chinese) [Google Scholar]
  4. Sun, Y.; Xiao, H.; Yang, H.L.; Ding, J.; Fu, D.; Guo, X.; Feng, L. Analysis of dynamic conditions and hydrometeor transport of Zhengzhou superheavy rainfall event on 20 July 2021 based on optical flow field of remote sensing data. Chin. J. Atmos. Sci. 2021, 45, 1384–1399. (In Chinese) [Google Scholar]
  5. Ran, L.K.; Li, S.W.; Zhou, Y.S.; Yang, S.; Ma, S.; Zhou, K.; Shen, D.D.; Jiao, B.F.; Li, N. Observational Analysis of the Dynamic, Thermal, and Water Vapor Characteristics of the “7.20” Extreme Rainstorm Event in Henan Province, 2021. Chin. J. Atmos. Sci. 2021, 45, 1366–1383. (In Chinese) [Google Scholar]
  6. Chen, Y.; Chen, X.; Ren, G. Variation of extreme precipitation over large river basins in China. Adv. Clim. Chang. Res. 2010, 6, 265–269. [Google Scholar] [CrossRef]
  7. Seneviratne, S.I.; Nicholls, N.; Easterling, D.; Goodess, C.M.; Kanae, S.; Kossin, J.; Luo, Y.; Marengo, J.; McInnes, K.; Rahimi, M.; et al. Changes in climate extremes and their impacts on the natural physical environment. In Managing the Risks of Extreme Events and Disasters to Advance Climate Change Adaptation: A Special Report of Working Groups I and II of the Intergovernmental Panel on Climate Change; Field, C.B., Barros, V., Stocker, T.F., Qin, D., Dokken, D.J., Ebi, K.L., Mastrandrea, M.D., Mach, K.J., Plattner, G.K., Allen, et al., Eds.; Cambridge University Press: Cambridge, UK, 2012; pp. 109–230. [Google Scholar] [CrossRef]
  8. Ivancic, T.J.; Shaw, S.B. Examining why trends in very heavy precipitation should not be mistaken for trends in very high river discharge. Clim. Chang. 2015, 133, 681–693. [Google Scholar] [CrossRef]
  9. Wasko, C.; Nathan, R. Influence of changes in rainfall and soil moisture on trends in flooding. J. Hydrol. 2019, 575, 432–441. [Google Scholar] [CrossRef]
  10. Chen, Y.; Liao, Z.; Shi, Y.; Tian, Y.; Zhai, P. Detectable increases in sequential flood–heatwave events across china during 1961–2018. Geophys. Res. Lett. 2021, 48, e2021GL092549. [Google Scholar] [CrossRef]
  11. Lu, C.; Jiang, J.; Chen, R.; Ullah, S.; Yu, R.; Lott, F.C.; Tett, S.F.B.; Dong, B. Anthropogenic influence on 2019 May–June extremely low precipitation in southwestern China. Bull. Am. Meteorol. Soc. 2021, 102, S97–S102. [Google Scholar] [CrossRef]
  12. Jiang, J.; Zhou, T.; Zhang, W. Temporal and Spatial Variations of Extreme Precipitation in the Main River Basins of China in the Past 60 Years. Chin. J. Atmos. Sci. 2022, 46, 707–724. (In Chinese) [Google Scholar]
  13. Ma, S.; Zhou, T.; Stone, D.A.; Polson, D.; Dai, A.; Stott, P.A.; von Storch, H.; Qian, Y.; Burke, C.; Wu, P.; et al. Detectable anthropogenic shift toward heavy precipitation over eastern China. J. Clim. 2017, 30, 1381–1396. [Google Scholar] [CrossRef]
  14. He, B.; Zhai, P. Characteristics of the persistent and nonpersistent extreme precipitation in China from 1961 to 2016. Clim. Change Res. 2018, 14, 437–444. (In Chinese) [Google Scholar]
  15. Li, W.; Chen, Y. Detectability of the trend in precipitation characteristics over China from 1961 to 2017. Int. J. Climatol. 2021, 41, E1980–E1991. [Google Scholar] [CrossRef]
  16. Zhai, P.; Zhang, X.; Wan, H.; Pan, X. Trends in total precipitation and frequency of daily precipitation extremes over China. J. Clim. 2005, 18, 1096–1108. [Google Scholar] [CrossRef]
  17. Chen, H.; Fan, S.; Zhang, X. Seasonal differences of variation characteristics of extreme precipitation events over China in the last 50 years. Trans. Atmos. Sci. 2009, 32, 744–751. (In Chinese) [Google Scholar] [CrossRef]
  18. Ma, S.; Zhou, T.; Dai, A.; Han, Z. Observed changes in the distributions of daily precipitation frequency and amount over China from 1960 to 2013. J. Clim. 2015, 28, 6960–6978. [Google Scholar] [CrossRef]
  19. Zhou, B.; Xu, Y.; Wu, J.; Dong, S.; Shi, Y. Changes in temperature and precipitation extreme indices over China: Analysis of a highresolution grid dataset. Int. J. Climatol. 2016, 36, 1051–1066. [Google Scholar] [CrossRef]
  20. Wang, Y.; Zhou, B.; Qin, D.; Wu, J.; Gao, R.; Song, L. Changes in mean and extreme temperature and precipitation over the arid region of northwestern China: Observation and projection. Adv. Atmos. Sci. 2017, 34, 289–305. [Google Scholar] [CrossRef]
  21. Xie, Y.; Dai, W. Certain computational results of water vapor transport over eastern China for a selected synoptic case. Acta Meteor. Sin. 1959, 30, 173–185. (In Chinese) [Google Scholar] [CrossRef]
  22. Wang, X.; Ding, Y.; Zhang, Q. Circulation pattern and moisture transport for summertime persistent heavy precipitation in eastern China. Clim. Environ. Res. 2017, 22, 221–230. (In Chinese) [Google Scholar] [CrossRef]
  23. Ding, Y.; Liu, Y.; Song, Y. East Asian summer monsoon moisture transport belt and its impact on heavy rainfalls and floods in China. Adv. Water Sci. 2020, 31, 629–643. (In Chinese) [Google Scholar]
  24. Chen, B.; Xu, X.; Shi, X. Estimating the water vapor transport pathways and associated sources of water vapor for the extreme rainfall event over east of China in July 2007 using the Lagrangian method. Acta Meteorol. Sin. 2011, 69, 810–818. (In Chinese) [Google Scholar]
  25. Bueh, C.; Zhuge, A.R.; Xie, Z.W.; Gao, Z.; Lin, D. Water Vapor Transportation Features and Key Synoptic-scale Systems of the “7.20” Rainstorm in Henan Province in 2021. Chin. J. Atmos. Sci. 2022, 46, 725–744. (In Chinese) [Google Scholar] [CrossRef]
  26. Huang, Y.; Cui, X. Moisture sources of an extreme precipitation event in Sichuan, China, based on the Lagrangian method. Atmos. Sci. Lett. 2015, 16, 177–183. [Google Scholar] [CrossRef]
  27. Li, Y.; Jiang, X. Characteristics of water vapor transportation during summer heavy rainfall at the upper reaches of Yangtze River in 1998. Torrential Rain Disasters 2007, 26, 37–41. (In Chinese) [Google Scholar]
  28. Li, Y.; Xu, H.; Gao, Y.; Li, Q. The characteristics of moisture transport associated with drought/flood in summer over the east of the southwestern China. Acta Meteorol. Sin. 2010, 6, 932–943. (In Chinese) [Google Scholar] [CrossRef]
  29. Li, Y.; Zhou, J.; He, J.; Lu, C.; Xiang, B. Characteristics of Water Vapor Transport Associated with Abnormal Precipitation over the East of Southwestern China in June and July 2020. Chin. J. Atmos. Sci. 2022, 46, 309–326. (In Chinese) [Google Scholar]
  30. Qi, D.; Li, Y.; Zhou, C. Variation Characteristics of Summer Water Vapor Budget and Its Relationship with the Precipitation over the Sichuan Basin. Water 2021, 13, 2533. [Google Scholar] [CrossRef]
  31. Qi, D.; Li, Y.; Zhou, C.; Dan, C. Climatic Change of Summer Rainstroms and the Water Vapor Budget in the Sichuan Basin. J. Appl. Meteorol. Climatol. 2022, 61, 537–557. [Google Scholar] [CrossRef]
  32. Tang, H.; Gu, J.; Yu, S.; Zhang, H.; He, H. Analysis on diurnal variation of precipitation in Southwest China. Plateau Meteorol. 2011, 30, 376–384. (In Chinese) [Google Scholar]
  33. Ma, Z.; Li, Y.; Wu, Z.; Zhu, Y.; Du, J. Climate Change Assessment Report in Southwest China: 2020; Sichuan Nationalities Publishing House: Chengdu, China, 2021. (In Chinese) [Google Scholar]
  34. Peterson, T.; Folland, C.; Gruza, G.; Hogg, W.; Mokssit, A.; Plummer, N. Report on the Activities of the Working Group on Climate Change Detection and Related Rapporteurs; World Meteorological Organization: Geneva, Switzerland, 2001. [Google Scholar]
  35. Li, X.; Fan, K.; Xu, Z. Decrease in Extreme Precipitation in Summer over East Northern China and the Water-Vapor Transport Characteristics after Year 2000. Chin. J. Atmos. Sci. 2019, 43, 1109–1124. (In Chinese) [Google Scholar] [CrossRef]
  36. Wang, Y.Q.; Zhang, X.Y.; Draxler, R. TrajStat: GIS-based software that uses various trajectory statistical analysis methods to identify potential sources from long-term air pollution measurement data. Environ. Model. Softw. 2009, 24, 938–939. [Google Scholar] [CrossRef]
  37. Draxler, R.R.; Hess, G.D. An overview of the HYSPLIT_4 modeling system for trajectories, dispersion and deposition. Aust. Meteorol. Mag. 1998, 47, 295–308. [Google Scholar]
  38. Jiang, Z.; Liang, Z.; Liu, Z.; Zhu, Y. A diagnostic study of water vapor transport and budget during heavy precipitation over the Huaihe River Basin in 2007. Chin. J. Atmos. Sci. 2011, 35, 361–371. (In Chinese) [Google Scholar]
  39. Zhou, Y.; Yan, L.; Wu, T.; Xie, Z. Comparative analysis of two rainstorm processes in Sichuan Province affected by the Tibetan Plateau vortex and Southwest vortex. Chin. J. Atmos. Sci. 2019, 43, 813–830. (In Chinese) [Google Scholar] [CrossRef]
  40. Li, Y.; Huang, D.; Lu, C.; Xiang, B.; Zhou, J.; He, J. Moisture Sources and Their Contributions to Summer Precipitation in the East of Southwest China. J. Trop. Meteorol. 2023, 29, 153–167. [Google Scholar] [CrossRef]
  41. Hoskins, B.J.; Ambrizzi, T. Rossby wave propagation on a realistic longitudinally varying flow. J. Atmos. Sci. 1993, 50, 1661–1671. [Google Scholar] [CrossRef]
  42. Zhou, C.; Li, Y.; Li, W.; Chen, L. Climatological characteristics of water vapor transport over eastern part of Qinghai-Xizang Plateau and tts surroundings. Plateau Meteorol. 2005, 24, 880–888. (In Chinese) [Google Scholar]
  43. Zhou, C.; Jiang, X.W.; Li, Y.; Wei, G.C. Features of climate change of water vapor resource over eastern region of the Tibetan Plateau and its surroundings. Plateau Meteorol. 2009, 28, 55–63. (In Chinese) [Google Scholar]
  44. Zhou, C.; Li, Y.; Bu, Q.; Peng, J. Features of drought-flood coexistence in west and east of Sichuan-Chongqing Basin in midsummer and its relating background of atmospheric circulation. Plateau Meteorol. 2011, 30, 620–627. (In Chinese) [Google Scholar]
  45. Li, Y.; Lu, C.; Xu, H.; Cheng, B. Anomalies of sea surface temperature in Pacific-Indian Ocean and effects on drought/flood in summer over eastern of Southwest China. J. Trop. Meteorol. 2012, 28, 145–156. (In Chinese) [Google Scholar]
  46. Qiu, Y.; Cai, W.; Guo, X.; Ng, B. The asymmetric influence of the positive and negative IOD events on China’s rainfall. Sci. Rep. 2014, 4, 4943. [Google Scholar] [CrossRef] [PubMed]
  47. Ren, Q.; Zhou, C.; He, J.; Cen, S.; Deng, M. Impact of preceding Indian Ocean sea surface temperature anomaly on water vapor content over the Tibetan Plateau moist pool in summer and its possible reason. Chin. J. Atmos. Sci. 2017, 41, 648–658. (In Chinese) [Google Scholar] [CrossRef]
  48. Takaya, Y.; Ishikawa, I.; Kobayashi, C.; Endo, H.; Ose, T. Enhanced Meiyu-Baiu rainfall in early summer 2020: Aftermath of the 2019 super IOD event. Geophys. Res. Lett. 2020, 47, e2020GL090671. [Google Scholar] [CrossRef]
  49. Li, S.; Gong, Z.; Zhang, S.; Yang, J.; Qiao, S.; Feng, G. Decadal variation of the precipitation relationship between June and August over South China and its mechanism. Clim. Dyn. 2022, 59, 1863–1882. [Google Scholar] [CrossRef]
  50. Wu, G.; Liu, P.; Liu, Y.; Li, W. Impacts of the sea surface temperature anomaly in the Indian Ocean on the subtropical anticyclone over the western Pacific—Two-stage thermal adaptation in the atmosphere. Acta Meteorol. Sin. 2000, 58, 513–522. (In Chinese) [Google Scholar] [CrossRef]
  51. Matsuno, T. Quasi-geostrophic motion in the equatorial area. J. Meteor. Soc. Jpn. 1966, 44, 25–43. [Google Scholar] [CrossRef]
  52. Gill, A.E. Some simple solutions for heat-induced tropical circulation. Q. J. R. Meteorol. Soc. 1980, 106, 447–462. [Google Scholar] [CrossRef]
  53. Wu, B.; Zhou, T.J.; Li, T. Seasonally evolving dominant interannual variability modes of East Asian climate. J. Clim. 2009, 22, 2992–3005. [Google Scholar] [CrossRef]
  54. Wu, B.; Li, T.; Zhou, T.J. Relative contributions of the Indian Ocean and local SST anomalies to the maintenance of the western North Pacific anomalous anticyclone during the El Niño decaying summer. J. Clim. 2010, 23, 2974–2986. [Google Scholar] [CrossRef]
  55. Huang, G.; Hu, K.; Qu, X.; Tao, W.C.; Yao, S.L.; Zhao, G.J.; Jiang, W.P. A review about Indian Ocean basin mode and its impacts on East Asian summer climate. Chin. J. Atmos. Sci. 2016, 40, 121–130. (In Chinese) [Google Scholar] [CrossRef]
  56. Sun, B.; Wang, H.; Zhou, B.; Li, H.; Zhu, B. A review on the interannual and interdecadal variations of water vapor transport over China during past decades. Adv. Water Sci. 2020, 31, 644–653. (In Chinese) [Google Scholar]
Figure 1. Distribution of 118 meteorological stations in the ESWC.
Atmosphere 14 01328 g001
Figure 2. Interannual and interdecadal changes in the contribution rate of extreme summer precipitation ((a) R95r; unit: %), extreme precipitation days ((b) R95d; unit: day), general precipitation contribution rate ((c) R5r; unit: %), general precipitation days ((d) R5d; unit: day), and regional precipitation anomaly percentage ((e) △R, relative to the average value of 1979–2020) in ESWC from 1979 to 2020. (The black line represents the linear trend, while the red line represents the 5-term polynomial fit).
Atmosphere 14 01328 g002
Figure 3. Circulation characteristics of extreme summer precipitation processes (a,d,g,j), general precipitation processes (b,e,h,k), and the difference in vortex (c), 500 hPa geopotential height (f), 850 hPa wind fields (i), and 1000–300 hPa integrated water vapor transport flux fields (l) in ESWC from summer 1979 to 2020. The blue box in the figure represents ESWC region.
Atmosphere 14 01328 g003
Figure 4. Water vapor budget of summertime mean extreme precipitation (a) and general precipitation (b) in the ESWC from 1979 to 2020 (unit: 107 kg/s). The red font in the figure indicates the amount of water vapor inflow, and the blue font indicates the amount of water vapor outflow.
Atmosphere 14 01328 g004
Figure 5. Spatial variance increase rate of water vapor trajectory clustering in extreme precipitation processes in summer from 1979 to 2020 ((a) unit: %); spatial distribution and proportion of water vapor channels ((b) unit: %); height change in water vapor channels ((c) unit: hPa); change in water vapor flux ((d) unit: kg/(m²·s)).
Atmosphere 14 01328 g005
Figure 6. Linear regression of the 200 hPa and 500 hPa geopotential height, 500 hPa vertical velocity, 850 hPa wind, and 1000–300 hPa water vapor transport flux field in summer against the IOBW index in winter (a,d,g,j,m), water vapor budget of east boundary (b,e,h,k,n) and extreme precipitation days in the ESWC (c,f,i,l,o). The blue box in the figure represents ESWC region. (The dotted and red vectors in the figure represent areas that have passed the 90% significance test, respectively).
Atmosphere 14 01328 g006
Figure 7. Variation of the IOBW index in the previous winter, summer zonal water vapor intensity index in the Bay of Bengal, and extreme precipitation days in the ESWC during summer.
Atmosphere 14 01328 g007
Figure 8. Mechanism pattern illustrating the impact of sea surface temperature (SST) in the tropical Indian Ocean during the previous winter on the frequency of extreme summer precipitation events in the ESWC.
Atmosphere 14 01328 g008
Table 1. Correlation coefficients between R95r, R95d, R5r, R5d, and △R in the ESWC during the summer period from 1979 to 2020.
R95dR5rR5d△R
R95r0.96 ***−0.55 ***−0.090.30 *
R95d1.00−0.44 ***0.090.44 **
Note: *, **, and *** passed the 90%, 95%, and 99% significance tests, respectively.
Table 2. Correlation coefficients of R95r and R95d with the boundary and total water vapor budget of extreme summer precipitation processes in ESWC from 1979 to 2020.
R95rR95d
East boundary−0.44 ***−0.46 ***
South boundary0.45 ***0.44 ***
West boundary0.34 **0.32 **
North boundary0.110.11
Total water vapor budget0.46 ***0.40 ***
Note: ** and *** passed the 95% and 99% significance tests, respectively.
Table 3. Total number of water vapor channel trajectories, specific humidity, water vapor flux contribution rates, and potential pseudo-equivalent temperature during extreme precipitation.
Physical QuantityBay of BengalArabian SeaWestern PacificNorthwest
Total number of trajectories/tracks40.128.425.46.1
Specific humidity contribution rate/%42.1230.1323.094.66
Moisture flux contribution rate/%38.8834.8221.914.39
Potential pseudo-equivalent temperature/K349.59351.48337.78330.98
Table 4. Correlation coefficients of IOBW index in the previous winter and R95d with the boundary water vapor budget in ESWC from 1979 to 2020.
R95dEast BoundarySouth BoundaryWest BoundaryNorth Boundary
IOBW0.37 **−0.53 ***0.43 ***0.38 **0.14
Note: ** and *** passed the 95% and 99% significance tests, respectively.
Disclaimer/Publisher’s Note: The statements, opinions and data contained in all publications are solely those of the individual author(s) and contributor(s) and not of MDPI and/or the editor(s). MDPI and/or the editor(s) disclaim responsibility for any injury to people or property resulting from any ideas, methods, instructions or products referred to in the content.

