Abstract
The Yangtze River Delta (YRD) is an important economic region in China. Heavy winter rainfall may pose serious threats to city operations. To ensure the safe operation of the city, meteorological departments need to provide forecast results for the Spring Festival travel rush weather service. Therefore, the extended-range forecast of winter rainfall is of considerable importance. To solve this problem, based on the analysis of low-frequency rainfall and the intra-seasonal oscillation of atmospheric circulation, an extended-range forecast model for winter rainfall is developed using spatiotemporal projection methods and is applied to a case study from 2020. The results show that: (1) The precipitation in the YRD during the winter has a significant intra-seasonal oscillation (ISO) with a periodicity of 10–30 d. (2) The atmospheric circulations associated with winter rainfall in the YRD have a significant characteristic of low-frequency oscillation. From a 30-day to a 0-day lead, large modifications appear in the low-frequency atmospheric circulations at low, mid, and high latitudes. At low latitudes, strong wet convective activity characterized by a negative OLR combined with a positive RH700 correlation coefficient moves northwestward and covers the entire YRD. Meanwhile, the Western Pacific subtropical high (WPSH) characterized by a positive Z500 anomaly enhances and lifts northward. At mid and high latitudes, the signal of negatively correlated Z500 northwest of Lake Balkhash propagates southeastward, indicating the cold is air moving southward. Multiple circulation factors combine together and lead to the precipitation process in the YRD. (3) Taking the intra-seasonal dynamical evolution process of the atmospheric circulation as the prediction factor, the spatiotemporal method is used to build the model for winter mean extended-range precipitation anomaly tendency in the YRD. The hindcast for the recent 10 years shows that the ensemble model has a higher skill that can reach up to 20 days. In particular, the skill of the eastern part of the YRD can reach 25 days. (4) The rainfall in the 2019/2020 winter has a significant ISO. The ensemble model could forecast the most extreme precipitation for 20 days ahead.
1. Introduction
Extreme weather events have increased in recent years. An accurate weather forecast is an important method for disaster prevention and reduction, which can reduce economic and social losses [1]. In the winter, heavy rainfall may pose serious threats to city operations [2,3]. In addition, winter rainfall or snowstorms in the winter have caused great losses to agriculture. Winter rainfall has raised human attention in recent years. As one of the most urbanized and economically developed regions, the YRD region is of strategic importance in China’s modernization and development [4]. Heavy rainfall occurred in this place occasionally in the winter of recent years [5]. If we are able to predict such precipitation for 10 days or even longer prior, actions can be taken in advance so that a large amount of social losses can be reduced and much damage to cities can be avoided. However, the extended-range forecasts of winter rainfall are scarce in the YRD.
The winter climate in the YRD is significantly influenced by both seasonal and intra-seasonal signals [5]. Large-scale SST anomalies lead to atmospheric circulation anomalies, which in turn affect winter precipitation. El Niño–Southern Oscillation (ENSO) is one of the most important reasons. In El Niño winters, an anomalous large-scale anticyclone over the tropical western North Pacific carries the ENSO impacts to East Asia. This anomalous anticyclone caused by a combined effect of the local air–sea interaction mechanism is one of the possible cases of rainy winters [6]. In addition, intra-seasonal modes can also alter large-scale circulation and cause winter precipitation anomalies [7,8,9,10,11]. For example, the long-lasting rain and snow disaster in January 2008 lasted for more than 20 days. The four peaks during the rainfall process were related to significant intra-seasonal modes. This indicated that the precipitation had complex multiscale characteristics and ISO is an important mode of atmospheric circulation during the rainfall process [12,13,14].
The extended-range forecast period is between 10 and 30 days, which lies between a weather forecast and a short-term climate forecast, also being one of the keys to active disaster prevention and reduction. In terms of predictability, the initial value of the extended-range forecast is constrained by the rapid growth of prediction errors over 10 days. The operational forecasting models developed by weather forecasting institutions (ECMWF, NCEP, BCC, etc.) generally have the ability to perform extended-range forecasts for summer precipitation in the East Asian monsoon region and are able to make predictions for about two weeks ahead, then the accuracy quickly decreases, resulting in a significant gap for operational demand [15,16]. For example, Climate Forecast System version 2 (CFSv2) predictions show a warm bias for the climatological mean surface air temperature over the Yangtze River valley [17]. At the same time, the reception of the slowly varying signals from underlying surfaces such as the ocean, sea ice, and land surface is insufficient. Therefore, the difficulty in extended-range forecasts mainly comes from the lack of predictable sources [18,19]. In recent years, the prediction performance of ISO in dynamic models has been largely improved, but its intra-seasonal forecasting skills are still not high [20,21]. Therefore, under current conditions, statistical forecasting methods based on predictable sources such as ISOs still play an important role in extended-range forecasts. Chinese scholars have successively developed several statistical forecasting methods, such as the low-frequency synoptic map [22,23] and the dynamical–statistical model [24,25,26], which have achieved much progress. The spatiotemporal projection method proposed by Hsu et al. focuses on the impact of the evolutions of the atmospheric circulation on precipitation on the extended-range timescale, providing a new inspiration for the extended-range forecast [27,28].
Many circulation factors can affect precipitation in the YRD, and the statuses of the factors vary. In fact, predictable signals of the extended-range timescale often come from the continuous propagation and coupling of the atmosphere ISO signals from different sources at different latitudes. Due to the complexity of the ISO in periodicity, spatial structure, and moving characteristics, dynamical models are still unable to reflect the propagation characteristics of East Asian ISO signals [29,30,31,32]. It is still difficult to predict the precipitation in this region solely by dynamical models. In order to solve the problem of winter precipitation forecasting for the YRD, this study analyzed the evolution process of atmospheric circulation at different latitudes before winter precipitation in this region. The spatial propagation process of the atmospheric circulations in key areas is used as the prediction factor, and the spatiotemporal projection method is used to build the forecast model of extended-range winter precipitation in the YRD. This model will provide new technical support for meteorological disaster prevention and reduction and serve major activities in the YRD.
Different from previous studies, in this study, we will focus on developing an extended-range forecast method for winter rainfall forecasting, which can be used by meteorological departments to provide forecast results for the Spring Festival travel rush weather service. Based on the relationship between winter rainfall and ISO in atmospheric circulation, we will search for precursor factors and establish an extended-range forecast model using statistical methods. Next, we will test the model and analyze a case from 2020. This paper is arranged as follows: The data sources and analysis techniques are described in Section 2. Section 3 presents the winter rainfall low-frequency oscillation, and Section 4 investigates the dominant ISO mode of atmospheric circulation associated with winter rainfall. In Section 5, the extended-range forecast model is constricted and evaluated. Section 6 presents the analysis case during the 2019/2020 winter . Section 7 summarizes the conclusions.
2. Data and Methodology
2.1. Observation Data and Reanalysis Data
The YRD includes Shanghai and the provinces of Jiangsu, Zhejiang, and Anhui; the total area is close to 358,000 km2 (Figure 1). The data used in this research are listed as follows. (1) The daily rainfall dataset from 62 observatories in the YRD from 1991 to 2020 is from the China Meteorological Administration (CMA) National Meteorological Information Center [33]. The distribution of the observatories is shown in Figure 1. (2) The daily atmospheric circulation data are supplied by the National Centers for Environmental Prediction National Center for Atmospheric Research (NCEP–NCAR) reanalysis of the U.S. data [30]. The following large-scale variables are selected as predictors. OLR and atmospheric variables from the NCEP–NCAR reanalysis, including relative humidity at 700 hPa (RH700) isobaric surface, the geopotential height at 200 hPa (Z200) and 500 hPa (Z500) isobaric surface, and horizontal and vertical wind components at 850 hPa (U850; V850) and 200 hPa (U200; V200) isobaric surface. All datasets span from 1991 to 2020, with a horizontal resolution of 2.5° × 2.5° (longitude × latitude).
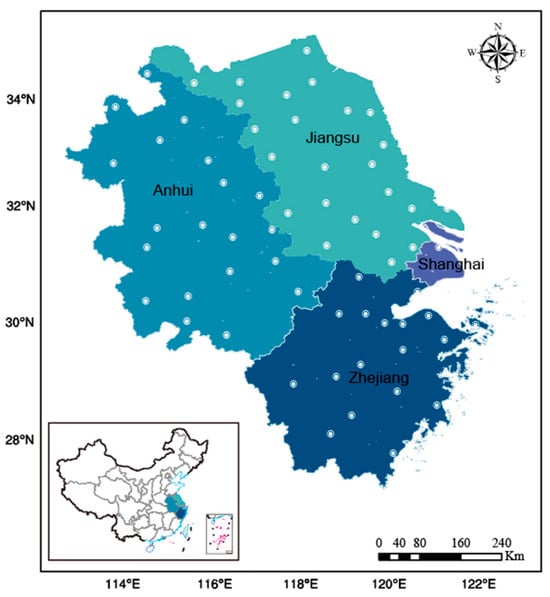
Figure 1.
The distribution of the 62 observatories in the YRD shown as white dots.
2.2. Statistical Analysis Methods
This study focuses on the extended-range forecast of winter rainfall in the YRD. The first goal of the current study is to determine the dominant period of intra-seasonal rainfall variation in the YRD. To accomplish this goal, the average of the observation data are calculated, and the daily average precipitation time series of the 62 observatories in the YRD is fetched. To illustrate the determining period of intra-season rainfall in the Yangtze River Delta, a power spectrum analysis is used to calculate the variance contribution of the waves at different frequencies. The Markov “red noise” spectrum is used to check the confidence of the power spectrum [32].
Once the dominant period is known, the dominant ISO signal needs to be extracted from the raw atmospheric data. Since our aim is to build a forecast model for real-time prediction, to avoid the tapering problem, we chose a non-filtering method by Hsu et al. [27] to obtain low-frequency signals. The advantage of this method is that it can immediately access the low-frequency signal for forecasting, and it has been applied in forecasting experiments on the low-frequency precipitation signal in different regions. The non-filtering method is divided into three main steps as follows. The first step is to remove the slowly varying climatologic annual cycle. In order to obtain the climatological annual cycle, a climatological 90-day low-pass-filtered component is subtracted from the original pentad-mean data. Secondly, to remove low frequency signals longer than 60 days, a 30-day running mean is removed to reserve the low-frequency component between 10 and 60 days. The third step aims to remove the high-frequency component such as synoptic-scale disturbances less than 10 days, so a 5-day running mean is calculated. The intra-seasonal variation component is retained after the three steps above.
In order to determine the variation characteristics of low-frequency systems associated with winter rainfall, we calculate the temporal correlation coefficients and use the t-test method of effective degrees of freedom to test the significance of the correlation coefficient [32].
After correlation analysis, the dominant large-scale variables are selected as predictors to forecast winter rainfall. The forecast model is based on a spatial–temporal projection model (STPM) [27]. The advantage of the STPM is the ability to extract the coupled patterns between the large-scale predictor and regional rainfall evolution. The calculation steps for the spatiotemporal projection method are listed as follows. For a specific forecast time T, the low-frequency components of the atmospheric circulation elements 1–5 pentads (5–30 days) before T is used as the predictand. The precipitation low-frequency component 2–6 pentads (10–40 days) after T is the forecast target. SVD is used to find the spatiotemporal coupling relationships. Then, hindcasts or independent forecasts are completed. The atmospheric circulation elements field in the key area 1–5 pentads before the forecast time T are projected into SVD left singular vector fields to obtain the time series for the left fields. Based on the high correlation between the time series for the left and right SVD fields, we use the time series for the left fields to substitute the time series for the right fields. Combined with the SVD right singular vector fields, we are able to predict the precipitation 2–6 pentads after the forecast time T.
The anomaly correlation coefficient (ACC) is used to test the effect of the method. The ACC is defined as (1)
where the symbol ‘ represents the difference in climatology, L(j) is the weight factor when the latitude is j, and L(j) is defined as (2)
The ACC can represent the similarity in two fields. The closer the absolute value of ACC is to 1, the more similar the two fields are.
3. Low-Frequency Characteristics of Winter Rainfall
In order to examine the intra-seasonal variation characteristic in winter rainfall, the spectrum of the daily rainfall time series averaged over the YRD is displayed in Figure 2. According to the power spectrum of the daily average precipitation of the observatories in the YRD in the winters (1 December–28 February) of 1991–2020, the winter rainfall has two significant peaks at 14–20 days and 25–35 days, respectively, which are statistically significant at the 90% confidence level. Considering inter-annual differences, we will focus on 10–30 d rainfall in the following analyses and its association with low-frequency atmospheric circulations.
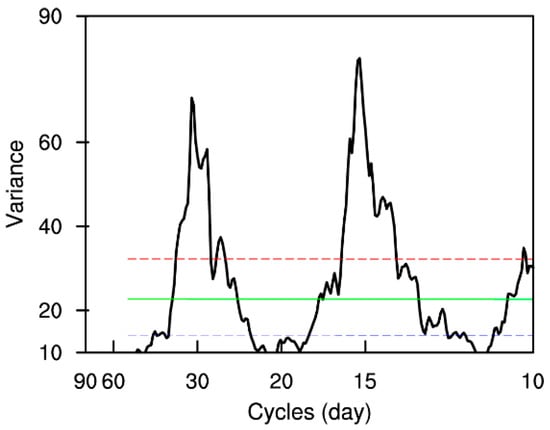
Figure 2.
The power spectrum (black curve) of the winter daily rainfall time series averaged over the YRD for the period from 1991 to 2020. (The green line denotes the spectrum for the Markov red noise. The blue and red lines denote the 10% and 90% significance test).
4. Dominant ISO Mode of Atmospheric Circulation Associated with Winter Rainfall
Previous research shows that continuous winter precipitation in the YRD is related to intra-seasonal circulations [6]. In this section, we focus on finding out the relationship between regional rainfall evolution and low-frequency atmospheric circulation. The first step in establishing a forecasting model for winter rainfall involves analyzing the dominant ISO mode of atmospheric circulation that is associated with regional rainfall evolution. The study of the correlation map of previous meteorological fields is the basis for the establishment of forecasting models. We carry out a temporal correlation coefficient analysis to reveal the large-scale intra-seasonal signals that could affect regional winter rainfall.
Figure 3 shows the correlation maps of the 30-day, 25-day, 15-day, 10-day, and 0-day lead gridded OLR and RH700 fields. From the 30-day to the 15-day lead, negative OLR and the positive RH700 correlation coefficient are maintained in the North Pacific Ocean, and they move westward and cover the entire YRD from the 10-day to the 0-day lead time. This indicates the characteristic of strong moist convective activity during rainfall.
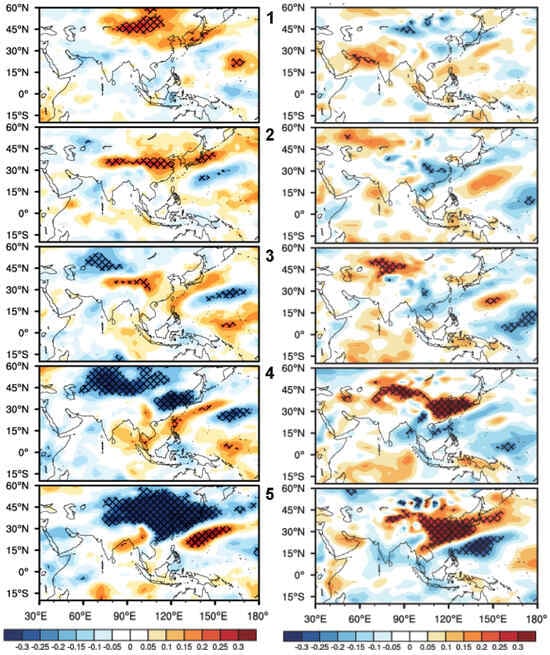
Figure 3.
Temporal correlation coefficients (color-shaded) maps of preceding outgoing longwave radiation (OLR) and 700-hPa relative humidity (RH700) with the intra-seasonal component of daily precipitation averaged from 30- to 0-day leads over the YRD. Cross areas denote values at the 95% confidence level determined by Student’s t-test. The numbers 1−5 denote leads of 30, 25, 15, 10, and 0 days, respectively.
Figure 4 shows the correlation pattern between the wind field and winter rainfall. It reflects the shifting characteristics of the atmospheric circulation related to precipitation. In the low level (850 hPa), anti-cyclonic and cyclonic correlations over the Western Pacific (WP) and the Yellow River region from the 25-day to the 15-day lead time are shown. From the 10-day to the 0-day lead time, the anti-cyclonic over the WP intensified and moved northwestward, and the cyclonic over the Yellow River region intensified and moved southeastward, resulting in a convergence center in the YRD, and the westerly strengthened. At the 0-day lead time, an anomalous convergence center was formed in the low troposphere over the YRD. An anti-cyclonic correlation of the upper level (200 hPa) was formed over the west of Lake Baikal at the 25-day lead time. Meanwhile, a cyclonic correlation was laid on the YRD. From the 10-day to the 0-day lead time, the anti-cyclone and cyclone moved southeastward. At the 0-day lead time, an anomalous divergence center was formed in the upper troposphere over the YRD.
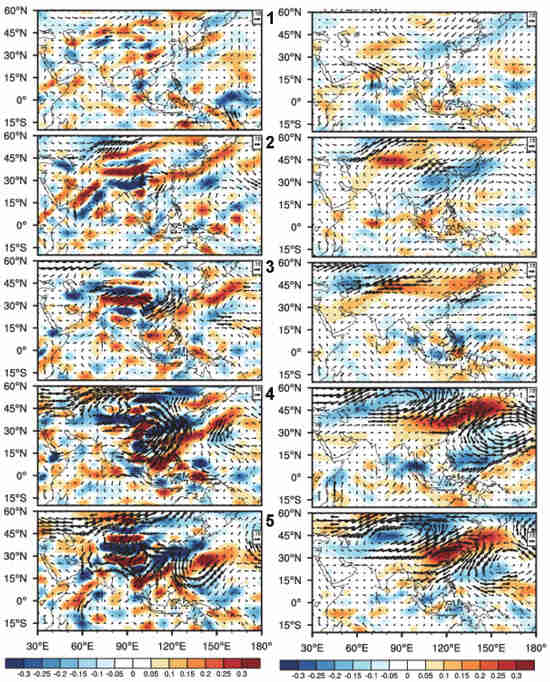
Figure 4.
Temporal correlation coefficient maps of 850-hPa (left) and 200-hPa (right) winds with the intra-seasonal component of daily precipitation averaged from 30- to 0-day leads over the YRD. The bold vector arrows indicate the vector correlation coefficients values at 95% confidence level by t-test. The numbers 1–5 denote leads 30, 25, 15, 10, and 0 days, respectively.
At the 25-day lead, the signal of the negatively correlated Z500 in the northwest of Lake Balkhash was identified. From the 25-day to the 10-day lead, the negative correlation propagated southeastward, indicating the cold air was moving southward. Meanwhile, a positive correlation strengthened in the WP, which indicates the enhancement of the Western Pacific subtropical high (WPSH). At the 0-day lead, the rainfall occurred with the negative and positively correlated Z500 signals in the YRD. The evolution characteristics of atmospheric circulation at Z200 are the same (Figure 5).
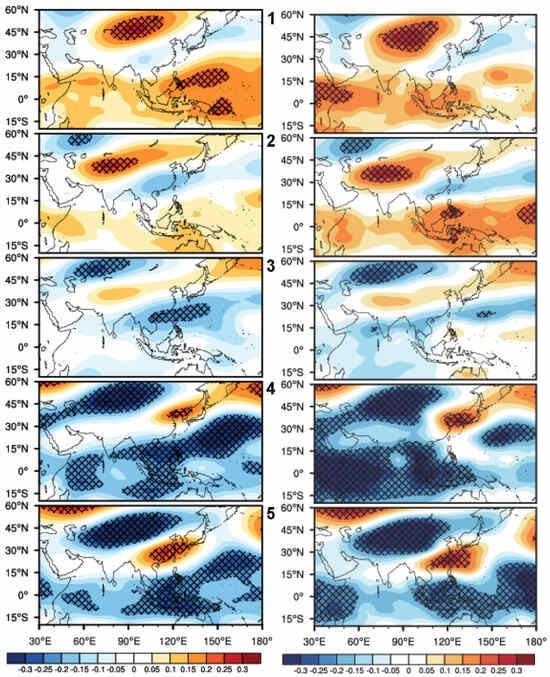
Figure 5.
Temporal correlation coefficient maps of 200 hPa and 500 hPa geopotential height with the intra-seasonal component of daily precipitation averaged from 30- to 0-day leads over the YRD. Cross areas denote values at the 95% confidence level determined by Student’s t-test. Red dashed lines with arrows indicate the movement of the key signals. The numbers 1–5 denote leads 30, 25, 15, 10, and 0 days, respectively.
5. The Construction and Evaluation of the Forecast Model
The above analysis showed that the winter rainfall is closely related to low-frequency atmospheric circulation. At high latitudes, there is a negative geopotential height anomaly east of the Ural Mountains, and it moves southeastwards, which favors the movement of cold air southward, reaching the YRD. Due to the positive geopotential height anomaly in the southern part, the cold and warm airflows converge and maintain over the YRD. Additionally, the relative humidity in 700 hPa turns from a dry phase into a wet phase, and the westerly in the lower troposphere (850 hPa) strengthens. The above factors combined together lead to precipitation in the YRD.
According to the evolution characteristic of the circulations affecting winter precipitation in the YRD, the key area of the forecast model is selected as 22.5–127.5° E, 0–55° N. Based on the correlation between rainfall and intra-seasonal atmospheric circulation, STPM is used to build the forecast models. All the datasets are processed to a 5-day mean to be transferred into pentad data. Then, winter rainfall data from 1991–2010 is taken as the training material. Based on the evolution characteristics of the circulation factors affecting winter precipitation in the YRD, we select 22.5–127.5° E, 0–55° N as the forecast key area. Based on the circulation factors in the key area and low-frequency precipitation in the YRD in 1991–2010, using SVD, a statistical forecast model for low-frequency precipitation in the YRD is trained. Taking the pentadly mean ISO component of the circulation factors 5–30 days ahead (1–5 pentads) in the forecast key area as the forecast factor and the pentadly mean low-frequency rainfall 10–30 days after (2–6 pentads) as the forecast target, referring to the spatiotemporal projection method, the pentadly extended-range forecast model for winter precipitation in the YRD is established and hindcasts for winters in 2011–2019 are calculated pentadly. The ACC between the hindcast results and ground truths is shown in Figure 6. The result shows that the score for model ensemble results is slightly higher than those for the single-factor models. Although the ACC score decreases as the lead time increases, the results for lead times less than 20 days still pass the 90% significance test, showing that the results for lead times less than 20 days are meaningful.
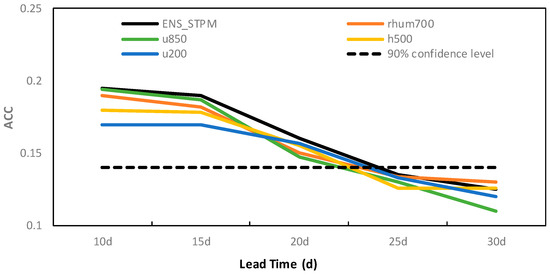
Figure 6.
Pentadly ACC between hindcast results and ground truths in the winters of 2011–2019 in the YRD.
To further assess the model performance, the rainfall is predicted every 5 days during the winters in the period of 2011–2019. The ACC at each point is computed to evaluate the spatial structure of predictive skill (Figure 6). The correlation coefficient for each member decreases with increasing lead times. However, most of the members’ forecasting skills still pass the significance test within 20 days. The most skillful member is the ensemble forecast: it passes the significance test almost at a lead time of 23 days.
The TCC between the hindcast results and ground truths with ensemble members is shown in Figure 7. The forecast skill decreases with lead time in the entire region. The skill in the eastern region, on the whole, surpasses that in the western region. This assessment indicates that the winter rainfall model is skillful for up to 10–20 days in the whole area, especially up to 25 days in the east.
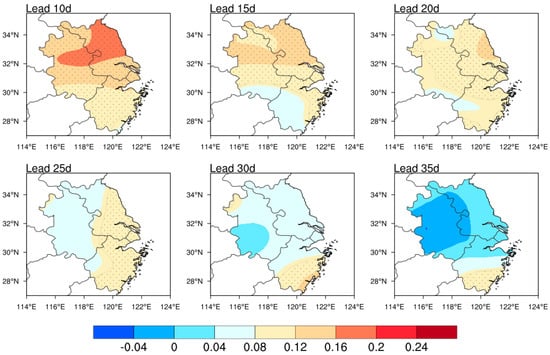
Figure 7.
TCC between the hindcast results and ground truths with ensemble members in the winters of 2011–2019 in the YRD. It show the results for lead times of 10, 15, 20, 25, 30, and 35 days. (The dotted area denotes the area passing the 90% significance test).
6. Case Study
Continuous rain happened during the 2019/2020 winter in the YRD. Taking Shanghai as an example, we analyze the low-frequency characteristics of the rain and present a forecasting example. Figure 8 is a power spectrum analysis of daily rainfall at the Shanghai Station during the 2019/2020 winter. A most significant peak appears at 10–20 days, which is statistically significant at the 90% confidence level. To illustrate the relationship between rainy events and their low-frequency characteristics, we plotted the daily rain amount and the low-frequency rain time series together in Figure 8b. It is worth noting that the identified winter precipitation occurred during the active phase of the ISO model, which means that the winter precipitation process in the winter of 2019/2020 is closely related to the ISO.
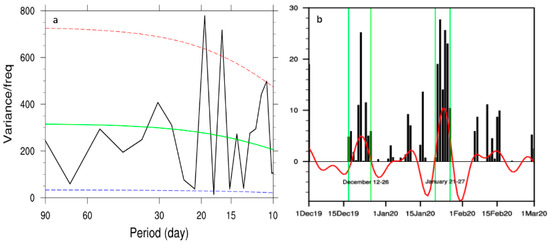
Figure 8.
(a) The power spectrum (black curve) of the winter daily rainfall time series averaged over the YRD for the period during the 2019/2020 winter. (The green line denotes the spectrum for Markov red noise. The blue and red lines denote the 10% and 90% significance tests). (b) Daily precipitation amount (bar), the persistent rainy events (green lines), and the 10–30-day filtered rainfall anomaly (red curve) in Shanghai.
The forecast method based on the winter rainfall forecast model was used, and the predictand was pentad average low-frequency rainfall. Figure 9 shows the forecast results for the pentad average low-frequency rainfall for the next 3–8 pentads starting from 1 January 2020. The forecast results indicated that there would be rain during the next 5–6 pentads in the YRD (Figure 9c,d), especially in the next sixth pentad. During the next seventh to eighth pentad, the precipitation phase changed. The forecast results for the 20-day lead were relatively close to the actual rainfall from 21 to 27 January (Figure 8b). This rainfall process was the most severe one during the 2019/2020 winter.
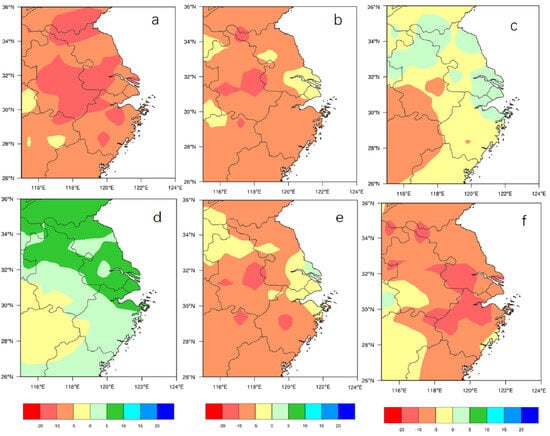
Figure 9.
The predictands based on the forecast model during the next 3−8 pentads starting from 1 January 2020. (a) is the third pentad, (b) is the fourth pentad, (c) is the fifth pentad, (d) is the sixth pentad, (e) is the seventh pentad, (f) is the eighth pentad.
7. Results and Conclusions
To ensure the safe operation of a city, meteorological departments need to provide forecast results for the Spring Festival travel rush weather service. Therefore, the extended-range forecasts of winter rainfall are of considerable importance to disaster mitigation. To establish an extended-range forecast model of winter rainfall, we focused on the relationship between rainfall and ISO in atmospheric circulation, and we searched for correlation factors and established an extended-range forecast model of winter rainfall using statistical methods. To assess model performance, the forecast skills for lead pentads were evaluated by computing the ACC and TCC at each point during the winters of 2011–2019. The results suggest that the best forecasting effect is achieved by the ensemble model, which can reach 23 days by testing.
To examine the intra-seasonal variation characteristic in winter rainfall, the power spectrum of daily rainfall time series averaged in the winters (1 December–February 28) of 1991–2020 over the YRD is displayed. The results show that the winter rainfall has two significant peaks at 14–20 days and 25–35 days, respectively, which are statistically significant at the 90% confidence level. The precipitation in the YRD during the winter has a significant intra-seasonal oscillation (ISO).
The atmospheric circulations associated with winter rainfall in the YRD have a significant characteristic of low-frequency oscillation. From the 30-day to the 0-day lead, large modifications appear in the low-frequency atmospheric circulations of low-, mid- and high-latitudes. From the 30-day to the 15-day lead, a negative OLR and the positive RH700 correlation coefficient are maintained in the North Pacific Ocean, and they move westward and cover the entire YRD from 10-day to 0-day lead times. This indicates the characteristic of strong moist convective activity during rainfall. In the low level (850 hPa), the anti-cyclonic and cyclonic correlations appear over the Western Pacific (WP) and the Yellow River region from the 25-day to the 15-day lead time. From the 10-day to the 0-day lead time, the anti-cyclonic over the WP intensified and moved northwestward, and the cyclonic over the Yellow River region intensified and moved southeastward, resulting in a convergence center in the YRD, and the westerly strengthened. At the 0-day lead time, an anomalous convergence center was formed in the low troposphere over the YRD. At the 25-day lead, the signal of the negatively correlated Z500 in the northwest of Lake Balkhash was identified. As time went on, the negative correlation propagated southeastward, indicating the cold air was moving southward Meanwhile, a positive correlation strengthened in the WP. which indicated an enhancement in the Western Pacific subtropical high (WPSH). Then, the rainfall occurred with the negative and positive-correlated Z500 signals meeting in the YRD. The above factors combined together led to precipitation in the YRD.
These large-scale intra-seasonal signals serve as potential predictors. According to the evolution characteristic of the circulations affecting winter precipitation in the YRD, the key area of the forecast model is selected as 22.5–127.5° E, 0–55° N. Taking the pentadly mean ISO component of the circulation factors 5–30 days ahead (1–5 pentads) in the forecast key area as the forecast factor and the pentadly mean low-frequency precipitation 10–30 days after (2–6 pentads) as the forecast target, referring to the spatiotemporal projection method, the pentadly extended-range forecast model for winter precipitation in the YRD is established, and hindcasts for winters in 2011–2019 are calculated pentadly. Although the correlation decreases for increasing lead times, the TCC still passes the significance test at lead times of 15–25 days. The assessment indicates that the winter rainfall model is skillful up to 10–25 days in the YRD.
Overall, the ensemble forecast showed a better performance than any individual predictions. The results show that the ensemble model is superior to single-factor models, and forecast results with a lead time within 20 days are meaningful. Especially, in the eastern part, this model shows certain skills forecasting 25 days ahead.
The precipitation process in the 2019/2020 winter showed two main periodicities of 10 days and 20 days. The time of the two most severe precipitation processes agreed with the peak phase of low-frequency precipitation. The ensemble model also predicted the most severe precipitation in the winter 20 days ahead. Therefore, this model can serve to forecast winter rainfall.
However, this method also has some shortcomings. Firstly, there are regional differences in the forecasting effect of the method in the Yangtze River Delta region. The poor forecast accuracy in the west may be due to topographic factors. Second, the predictand is pentad mean low-frequency precipitation anomalies, which is different from actual precipitation. These problems still remain unsolved in our model, and we will possibly work them out in our future work. On the other hand, in the process of applying the model, we noticed that as the parameterization schemes for the models gradually improved, the ability to predict the atmospheric ISO signal greatly increased. It is possible to use the ISO forecast information from the model to further improve forecast precision and lengthen effective lead time. Next, we will improve the prediction method based on the model forecast information.
Author Contributions
Conceptualization, F.X.; data curation, W.W.; investigation, W.W.; methodology, F.X.; writing—original draft, F.X. All authors have read and agreed to the published version of the manuscript.
Funding
This work was supported by the Fund of Fujian Key Laboratory of Disaster Weather (2023KFKT06), the National Natural Science Foundation of China (42375067) and Shanghai Science Committee (Grant No. 20dz1200400).
Institutional Review Board Statement
Not applicable.
Informed Consent Statement
Not applicable.
Data Availability Statement
The NCEP/NCAR data was provided by the NOAA-CIRES Climate Diagnostics Center, Boulder, CO, USA (http://www.cdc.noaa.gov, accessed on 28 December 2023).
Acknowledgments
The authors are thankful to the editor and reviewers for their kind feedback.
Conflicts of Interest
The authors declare no conflicts of interest.
References
- Efstathiou, M.N.; Varotsos, C.A. Intrinsic properties of Sahel precipitation anomalies and rainfall. Theor. Appl. Climatol. 2012, 109, 627–633. [Google Scholar] [CrossRef]
- Tao, S.Y.; Wei, J. Severe Snow and Freezing-Rain in January 2008 in the Southern China. Clim. Environ. Res. 2008, 13, 337–350. (In Chinese) [Google Scholar] [CrossRef]
- Gao, H.; Chen, L.; Jia, X.; Ke, Z.; Han, R.; Zhang, P.; Wang, Q.; Sun, C.; Zhu, Y.; Li, W.; et al. Analysis of the Severe Cold Surge Ice-snow and Frozen Disasters in South China During January 2008: II. Possible Climatic Causes. Meteorol. Mon. 2008, 34, 101–106. (In Chinese) [Google Scholar] [CrossRef]
- Lu, H.; Zhang, M.; Sun, W.; Li, W. Expansion Analysis of Yangtze River Delta Urban Agglomeration Using DMSP/OLS Nighttime Light Imagery for 1993 to 2012. ISPRS Int. J. Geo-Inf. 2018, 7, 52. [Google Scholar] [CrossRef]
- Wang, W.; Xin, F.; Pan, X.; Zhang, Y.; Li, T. Seasonal and Sub-Seasonal Circulation Anomalies Associated with Persistent Rainy Days in 2018/19 Winter in Shanghai, China. J. Meteorol. Res. 2020, 34, 1–11. [Google Scholar] [CrossRef]
- Li, T.; Wang, B.; Wu, B.; Zhou, T.; Chang, C.-P.; Zhang, R. Theories on formation of an anomalous anticyclone in western North Pacific during El Niño: A review. J. Meteorol. Res. 2017, 31, 987–1006. [Google Scholar] [CrossRef]
- Wang, L.; Jiang, J.; Li, T.; Zhou, X.; Chen, Z. Three distinct circulation patterns that induce enhanced intraseasonal precipitation events over South China in boreal winter. Clim. Dyn. 2022, 60, 2893–2905. [Google Scholar] [CrossRef]
- Gao, Q.; Zhang, Z.; Zhu, Y.; Chen, S. Analysis of Intraseasonal Oscillation Features of Winter Cold Precipitation Events in Southern China. Atmosphere 2022, 13, 1603. [Google Scholar] [CrossRef]
- Wang, B.; Wu, R.G.; Fu, X.H. Pacific-East Asian teleconnection: How does ENSO affect East Asian climate? J. Clim. 2000, 13, 1517–1536. [Google Scholar] [CrossRef]
- Li, T.; Wang, B. A review on the western North Pacific monsoon: Synoptic-to-interannual variabilities. Terr. Atmos. Ocean. Sci. 2005, 16, 285–314. [Google Scholar] [CrossRef]
- Zhu, Z.W.; Chen, S.J.; Yuan, K. Empirical subseasonal predicting summer rainfall anomalies over the middle and lower reaches of Yangtze River basin based on the atmospheric intra-seasonal oscillation. Atmosphere 2017, 8, 185. [Google Scholar] [CrossRef]
- Hong, C.C.; Li, T. The extreme cold anomaly over Southeast Asia in February 2008: Roles of ISO and ENSO. J. Clim. 2009, 22, 3786–3801. [Google Scholar] [CrossRef]
- Wen, M.; Yang, S.; Kumar, A.; Zhang, P. An analysis of the largescale climate anomalies associated with the snowstorms affecting China in January 2008. Mon. Weather Rev. 2009, 137, 1111–1131. [Google Scholar] [CrossRef]
- Shao, X.; Zhang, Z.; Tao, L. Influence analysis of quasibiweekly oscillation during the low temperature, rain and snow weather in South China in 2007/2008 winter. Meteorol. Environ. Sci. 2011, 34, 1–6. [Google Scholar]
- Chou, J.F.; Zheng, Z.H.; Sun, S.P. The think about 10~30 d extended-range numerical weather prediction strategy-facing the atmosphere chaos. Sci. Meteorol. Sin. 2010, 30, 569–573. (In Chinese) [Google Scholar] [CrossRef]
- He, J.H.; Liang, P.; Sun, G.W. Consideration on extended-range forecast and its application study. Adv. Meteorol. Sci. Technol. 2013, 3, 11–17. (In Chinese) [Google Scholar] [CrossRef]
- Tang, S.; Qiao, S.; Feng, T.; Jia, Z.; Zang, N.; Feng, G. Predictability of the mid-summer surface air temperature over the Yangtze River valley in the National Centers for Environmental Prediction Climate Forecast System. Int. J. Climatol. 2020, 41, 811–829. [Google Scholar] [CrossRef]
- Xu, B.Q.; Zang, Y.X.; Zhu, Z.W.; Li, T.M. Subseasonal-to-seasonal (S2S) prediction using the spatial-temporal projection model (STPM). Trans. Atmos. Sci. 2020, 43, 212–224. (In Chinese) [Google Scholar]
- Kim, H.M.; Webster, P.J.; Curry, J.A.; Toma, V.E. Asian summer monsoon prediction in ECMWF System 4 and NCEP CFSv2 retrospective seasonal forecasts. Clim. Dyn. 2012, 39, 2975–2991. [Google Scholar] [CrossRef]
- Vitart, F. Evolution of ECMWF sub-seasonal forecast skill scores. Q. J. R. Meteorol. Soc. 2014, 140, 1889–1899. [Google Scholar] [CrossRef]
- Buizza, R.; Bidlot, J.-R.; Wedi, N.; Fuentes, M.; Hamrud, M.; Holt, G.; Vitart, F. The new ECMWF VAREPS (Variable Resolution Ensemble Prediction System). Q. J. R. Meteorol. Soc. 2007, 133, 681–695. [Google Scholar] [CrossRef]
- Sun, G.W.; Li, Z.K.; Xin, F.; He, J.H. Low-frequency synoptic map: New method for extended range forecasting. Chin. J. Atmos. Sci. 2013, 37, 945–954. (In Chinese) [Google Scholar] [CrossRef]
- Xin, F.; Ma, Y.; Wang, W.; Wang, C. Analysis on the characteristics and extended range forecast of Meiyu anomaly in Shanghai in 2020. Torrential Rain Dis. 2020, 39, 578–585. (In Chinese) [Google Scholar] [CrossRef]
- Jie, W.H.; Vitart, F.; Wu, T.W.; Liu, X.W. Simulations of the Asian summer monsoon in the sub-seasonal to seasonal prediction project (S2S) database. Q. J. R. Meteorol. Soc. 2017, 143, 2282–2295. [Google Scholar] [CrossRef]
- Guo, Q.; Huang, A.; Fu, Z.; Tang, H.; Li, Y.; He, H. Evaluation and Bias Correction on the Subseasonal Forecast of Summer Precipitation over Southwestern China Forecasted by the Beijing Climate Center Sub-seasonal to Seasonal Predication System. Plateau Meteorol. 2021, 40, 644–655. (In Chinese) [Google Scholar] [CrossRef]
- Li, W.; Chen, L. Research on Reexplanation and Reanalysis Method of Dynamical Extended Range Forecast Products. Acta Meteorol. Sin. 1999, 57, 338–345. [Google Scholar] [CrossRef]
- Hsu, P.C.; Li, T.; Lin, Y.C.; Lu, M.M.; Lee, J.Y. A spatial-temporal projection method for seasonal prediction of spring rainfall in northern Taiwan. J. Meteorol. Soc. Jpn. 2012, 90, 179–190. [Google Scholar] [CrossRef][Green Version]
- Zheng, Z.H.; Huang, J.P.; Feng, G.L.; Chou, J.F. Forecast scheme and strategy for extended-range predictable components. Sci. China Earth Sci. 2013, 56, 878–889. [Google Scholar] [CrossRef]
- Wang, Q.; Liu, J.; Yan, M. Effects of mountain uplift on autumn rainfall over Southwest China. Terr. Atmos. Ocean. Sci. 2020, 31, 603–617. [Google Scholar] [CrossRef]
- Kalnay, E.; Kanamitsu, M.; Kistler, R.; Collins, W.; Deaven, D.; Gandin, L.; Iredell, M.; Saha, S.; White, G.; Woollen, J.; et al. The NCEP/NCAR 40-year reanalysis project. Bull. Am. Meteorol. Soc. 1996, 77, 437–471. [Google Scholar] [CrossRef]
- Yang, H.M.; Zhong, M.; Zhu, Y.Z. The determination of degrees of freedom for digital filtered time series—An application in the correlation analysis between length of day variation and SOI. Acta Astron. Sin. 2003, 44, 324–329. [Google Scholar]
- Markoff, A. Sur les formes quadratiques binaires ind’efinies. Math. Ann. 1879, 15, 381–406. [Google Scholar] [CrossRef]
- Wang, Y.; Xu, Y.; Tabari, H.; Wang, J.; Wang, Q.; Song, S.; Hu, Z. Innovative trend analysis of annual and seasonal rainfall in the Yangtze River Delta, eastern China. Atmos. Res. 2020, 231, 104673. [Google Scholar] [CrossRef]
Disclaimer/Publisher’s Note: The statements, opinions and data contained in all publications are solely those of the individual author(s) and contributor(s) and not of MDPI and/or the editor(s). MDPI and/or the editor(s) disclaim responsibility for any injury to people or property resulting from any ideas, methods, instructions or products referred to in the content. |
© 2024 by the authors. Licensee MDPI, Basel, Switzerland. This article is an open access article distributed under the terms and conditions of the Creative Commons Attribution (CC BY) license (https://creativecommons.org/licenses/by/4.0/).