Abstract
It is necessary to alleviate the high temperatures and heat wave disasters in cities in southwest China that are beginning to occur because of global warming. During this study, the spatial and temporal characteristics of heat waves in Nanchong from 1961 to 2022 are analyzed by using the signal smooth method and mutation test. Based on the meteorological data and socioeconomic statistics, the entropy value method is used to obtain the indicator weights to construct a heat wave social vulnerability evaluation index system and conduct vulnerability assessments and classifications. The results show that: ① The heat wave indicators in Nanchong show an increasing trend, although there is a low period of heat waves from 1980 to 1995. Additionally, there are significant mutations in the number of days, frequency, and intensity of high-temperature heat waves from 2009 to 2011, which may be caused by the abnormal high-pressure belt in the mid-latitude. ② The distribution of exposure, sensitivity, and adaptability in Nanchong City, under high temperatures, is uneven in space. Generally, the indicators in the north are lower than those in the south. ③ The high-vulnerability counties are mainly distributed in the east and west of Nanchong, the proportion of the medium social vulnerability index areas are more than a half, while the dominant factor in the distribution pattern is natural factors. ④ The Western Pacific Subtropical High (WPSH) anomaly directly led to the extremely high temperature in Nanchong in the summer of 2022, and the urbanization process index shows a significant positive correlation with the trend of high temperatures and heat waves in Nanchong.
1. Introduction
The world is currently dealing with global warming. Extreme heat wave events are becoming more frequent and intense [1], the coverage of heat waves has increased nearly three-fold in the 21st century and they may become even more widespread and frequent in the future [2,3]. As extreme weather events, there is a small probability of occurrence, yet they have a wide impact and affect our survival and health directly [4,5]. Extreme heat caused tens of thousands of deaths in Europe in 2003 [6], then it hit Pakistan in 2015 causing more than a thousand deaths, while the highest temperature in the USA exceeded 40 °C in the summer of 2022 [7,8]. In the 21st century, China has also been hit by heat waves. In 2006, heat waves occurred in Sichuan Province and the Chongqing regions [9]. The number of deaths from heat waves in China reached 20,431 in 2013, while in 2019, it reached 26,800 [10,11].
The risk of extreme heat waves to society is closely related to the natural environment, policies, demographic characteristics, and economic income levels [12,13,14]. Hirschi et al. [15] pointed out that climate warming leads to a greater susceptibility to extreme weather events. In order to counteract the risk, Inostroza et al. [16] developed a heat wave risk assessment model for the San Diego region and made risk analysis predictions. In recent years, researchers in China have also strengthened the research on the spatial and temporal characteristics of extreme heat and risk classifications [17,18,19,20]. Xing Pei et al. [21] analyzed the high-temperature trends in North China from 1961 to 2017 and found that the intensity of high-temperature heat waves has increased significantly since the 1990s. Li Weipeng et al. [22] combined the concept of degree days and pointed out that heating degree days (HDD) showed a decreasing trend while cooling degree days (CDD) showed an increasing trend from 1985 to 2015. Zheng Tianyuan and Huang Xiaojun [23] took the county as a whole and coupled social factors to conduct a comprehensive analysis of the population exposure to high temperatures in China.
With the new development pattern of dual circulation, Nanchong was integrated into the new Western Land–Sea Corridor (Nanchong Municipal Government Office [24]) and has close contact with Chengdu and Chongqing [25]. Since the development of Nanchong at a high level in Sichuan Province [26], exploring the characteristics and vulnerability of high-temperature heat waves in Nanchong is an important basis for ensuring socioeconomic operation in the context of high temperatures in the Chengdu–Chongqing Economic Circle.
However, there is rare research on this city. Moreover, two easily overlooked indicators were added: the proportion of rural populations and the number of air conditioners. With the development of cities in Southwestern China, the gap between rural and urban areas is expanding. The ability of rural populations to receive information is weaker than that of urban populations. Therefore, it is necessary to consider the proportion of rural populations under high temperatures since they are also distributed in this administrative region. In addition, the number of air conditioners is used to evaluate indicators for adaptability. Air conditioners can directly alleviate individual exposure to high temperatures; however, this important variable is not found in some studies.
Finally, the high-temperature characteristics and vulnerability of this region are considered from a macro perspective. This is different from focusing on a certain point (such as health issues under high temperatures). From a holistic perspective, we have explored the impact of high-temperature heat waves on the region from two aspects (historical changes in high temperatures and vulnerability in the region). This provides guidance for long-term residents living here to effectively reduce the impact of high-temperature disasters.
2. Materials and Methods
2.1. Study Area and Data Sources
Nanchong is located in the northeastern part of the Sichuan Basin, in the middle and lower reaches of the Jialing River, between 30°35′–31°51′ N, 105°27′–106°58′ E. The highest elevation within the area is 978 m, the lowest is 149 m, and the average elevation is 338 m. The topography is mainly mountainous and hilly, with the terrain sloping from north to south. The climate is subtropical monsoon, with high temperatures in summer and occasional summer droughts. According to the Nanchong Statistical Yearbook of 2021, Nanchong has a residential population of 5.61 million and had a total regional output value of RMB 240.11 billion at the end of 2020.
The meteorological data (daily maximum temperature in seven stations in Nanchong) used in this study were obtained from the Resource and Environmental Science Data Center of the Chinese Academy of Sciences (https://www.resdc.cn/Default.aspx (accessed on 19 February 2023)). After removing the missing data with long gaps, late establishment dates, and abnormal records, the daily temperature data from seven meteorological stations in Nanchong during the period of 1961–2022 (Figure 1) were selected as the raw data. The socioeconomic data (shown in lines 4–11 in Table 1) mainly came from social questionnaire surveys, the Nanchong Statistical Yearbook of 2021, and the seventh census bulletin of the local area. (https://www.nanchong.gov.cn/tjj/, accessed on 19 February 2023).
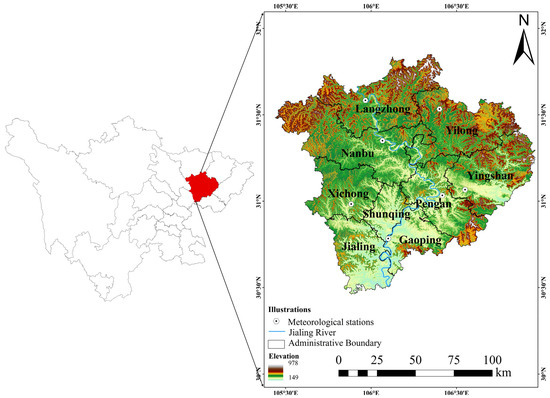
Figure 1.
Topographic features and station distribution in Nanchong. (The distribution of all stations in Nanchong is illustrated in the figure and the counties in the figure are divided according to administrative boundaries).
2.2. The High-Temperature Characterization Method
There are various global standards for defining heat waves. The Intergovernmental Panel on Climate Change (IPCC) defines heat waves as weather processes with continuous high temperatures above the 90th percentile, while the China Meteorological Administration defines them as daily maximum temperatures greater than or equal to 35 °C [27]. The relative threshold method is widely applicable, although computationally complex, while the absolute threshold method is simpler to compute and is mainly used in southern China. Since Nanchong belongs to the basin summer heat wave zone [28] and considering the climatic characteristics of Northeast Sichuan, this study used the absolute threshold method to identify heat waves. A heat wave process was identified when the daily maximum temperature was ≥35 °C for 3 consecutive days or more, and then, classified according to the duration of the heat wave [29]. The specific standards for heat wave classification are presented in Table 1.

Table 1.
The criteria of heat waves in different grades.
Table 1.
The criteria of heat waves in different grades.
| Grades | Judgment Criteria (Day, d) [29] |
|---|---|
| Mild | Daily maximum temperature ≥ 35 °C for 3–4 d |
| Moderate | Daily maximum temperature ≥ 35 °C for 5–7 d |
| Severe | Daily maximum temperature ≥ 35 °C for 8 d or more |
The high-temperature intensity is mainly used to indicate the severity and degree of harm by high-temperature heat waves. It is calculated based on the daily maximum temperature and its duration during the heat wave period. It represents the accumulated temperature above the absolute threshold (35 °C) for each day during the heat wave process [30]. The calculation formula is as follows:
where Q is the intensity of the high-temperature heat wave in a certain year, is the average value of the daily maximum temperature between the number i of heat waves in a certain year; m is the total number of frequencies for heat waves occurring in the region in a certain year; is the number of days ith heat wave lasts.
The Mann–Kendall method is an analysis method recommended by the World Meteorological Organization to be applied to time series, and the Mann–Kendall mutation test method was adopted to test for sudden changes in climate change, with reference to the literature [31]. The details are as follows.
For a time series, x with n samples, a rank sequence can be constructed:
The value of r is as follows:
defines statistics under the condition, where the time series is randomly independent:
where UF1 = 0, , and are the mean and variance of sk, respectively.
The above process is repeated according to the inverse time sequence to draw the UBk curve and provide a significance level of α = 0.05. The intersection of the above two curves is the starting time of the mutation.
2.3. High-Temperature Social Vulnerability Evaluation Index System
We constructed the simple urbanization process index K through a functional relationship using the study from Zhu et al. [32]. The equation is as follows:
K is the urbanization index, y1 is the population density, which represents the concentration of population in urbanization; y2 is the area of urban built-up area, which represents the state of urban land expansion; y3 is the quotient of urban population and total population and indicates the level of formal urbanization.
High-temperature exposure, social sensitivity, and adaptive capacity are three important dimensions in measuring social vulnerability to high-temperature disasters [33]. Therefore, social vulnerability can be seen as a comprehensive function of these three dimensions. Therefore, the three dimensions are used to design evaluation indicators, thereby constructing a high-temperature vulnerability evaluation index system for Nanchong (Table 2).

Table 2.
Vulnerability assessment index system of urban exposure to heat waves.
High-temperature exposure mainly refers to the degree a city is affected by high temperatures [23]. Xue et al. [34] believed that the degree of high-temperature exposure needs to be reflected through time, absolute accumulated temperature, and probability of disaster. Thus, three indicators were selected as the exposure evaluation standards: the number of high-temperature days, the heat wave frequency, and the high-temperature wave intensity. The proportion of the rural population, population density, the proportion of the population aged 65 and above, and the number of people engaged in the construction industry represent the main indicators that are used to form sensitivity dimensions because of the weaker ability to withstand high temperatures in elder and outdoor workers [27]. The number of beds and medical staff in a hospital within a region can reflect the region’s ability to treat high-temperature disasters. Jenerette et al. [35] also indicate that more wealth (or income) can enhance disaster reduction capabilities. Thus, the number of hospital beds, proportion of medical personnel, per capita GDP, green area of built-up areas, and the proportion of households with air conditioning facilities are used to describe the adaptive capacity.
To reduce subjectivity, more objective methods are used when calculating weights. The entropy weight method (EWM) is established based on the theory of information entropy. If the information entropy of an indicator is smaller, the amount of information it provides will be greater, and the weight will be higher. In this article, the basic data are normalized and logarithmically calculated to obtain the indicator weights (Table 2).
To solve the dimensional differences, the forward polarization standardization method was used to carry out the dimensionless standardization for each raw data. The formula is:
in the formula: Yij, Xij, Xjmax, and Xjmin are the standardized, original, maximum, and minimum values of the jth index of the ith research object, respectively. Here, the entropy value method is used to reduce subjectivity and determine the weights of each index using the data’s own characteristics (Table 2).
Since the additive–subtractive method can better reflect the synergistic relationship between the dimensional layers and is relatively easy to calculate [36], it is used to calculate the high-temperature vulnerability index, using the following formula:
It should be noted that the differences in some of the values may be attributed to factors such as differences in data quality control, data interpolation methods, number of stations used, differences in identification and calculation methods, and differences in the scope of the study. Overall, the characteristics of high-temperature changes in Nanchong are not unique. In the conclusion section, this study will be used to compare the high-temperature changes in Nanchong and Sichuan provinces with previous studies [28,37,38], for the readers to verify.
3. Results
Different studies on high-temperature days in Sichuan were used for comparison (Figure 2). They exhibit similar trends in high-temperature characteristics, with good overall consistency.
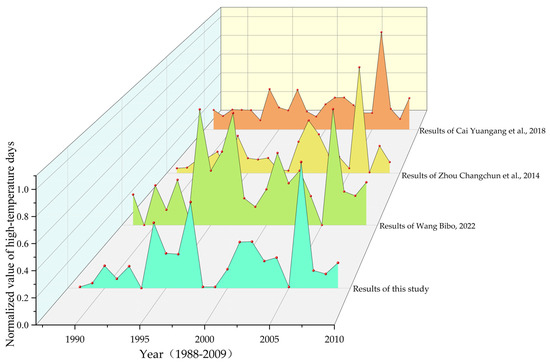
Figure 2.
Comparison of the normalized values of the number of high–temperature days counted in this study with other related literature [28,37,38].
3.1. Analysis of Variation Characteristics of Heat Wave Frequency, Duration, and Intensity in Nanchong
The average frequency of high-temperature heat waves at various meteorological stations in Nanchong from 1961 to 2022 is illustrated in Figure 3. The highest frequency of mild heat waves occurred in 2013, with a value of 2.57 times; the highest frequency of moderate heat waves occurred in 2014, with a value of 1.86 times; the highest frequency of severe heat waves occurred in 2022, with a value of 2.43 times. From the characteristics of the changes, the frequency of mild heat waves showed obvious fluctuation, experiencing four stages of “rise–fall–rise–fall”, with the period from the 1980s to the 1990s being the low point in the heat wave frequency occurrence. The frequency of moderate heat waves showed a small change before 1990 before a downward trend, reaching a peak around 2013 before rapidly decreasing. The frequency of severe heat waves showed an overall upward trend after 1990, and the rate of increase has been accelerating since 2014. The changes in the frequency of high-temperature heat waves in the past decade have been characterized by a decrease in the number of mild and moderate heat waves and an increase in the frequency of severe heat waves.
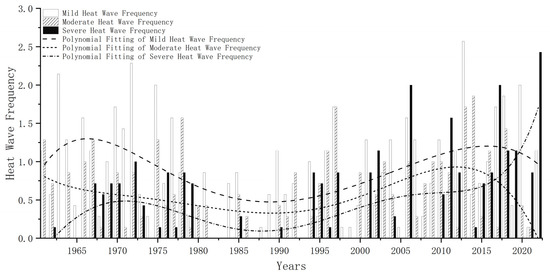
Figure 3.
Temporal distribution of heat waves of different intensity levels. (The r2 corresponding to mild, moderate, and severe grades are 0.1878, 0.1609, and 0.3211, respectively).
Based on the interannual changes in the number of hot days (Figure 4a), the average number of hot days in Nanchong over the past 62 years was 11.27 days, and the overall number of hot days has increased at a rate of 1.77 days per decade. This trend is highly consistent with the overall trend in Sichuan Province, although the rate of increase is slightly higher than the Sichuan and Chongqing averages (1.68 d/10 a) [39]. Specifically, the time variation in the number of hot days in Nanchong has gone through three phases of “rise–decline–rise”. The first phase was from 1961 to 1978, during which the 5-year sliding average showed a fluctuating upward trend, and the overall number of hot days was slightly higher than the 62-year average value. The second phase was from 1979 to 1993, during which the number of hot days sharply declined and formed a trough, and the overall number of hot days was lower than the total average value. This is highly consistent with previous studies [40], during which there were no hot days in 1982 and 1983, and the overall trend showed a slight decline, with only 3.25 days of average hot days. The third phase was from 1994 to 2022, during which the overall number of hot days showed an upward trend with fluctuations. The top three years with the highest number of hot days shown in this phase were 2022, 2006, and 2018.
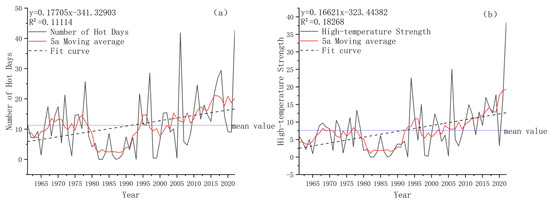
Figure 4.
Interannual variation of high−temperature days and strength ((a) shows the interannual variation of high temperature days and (b) shows the interannual variation of high− temperature strength).
As illustrated in Figure 4b, the interannual variation in the intensity of high-temperature heat waves in Nanchong from 1961 to 2022 reveals an increasing trend. The average intensity of high-temperature heat waves was 7.57 °C in the past 62 years, with an overall increase rate of 1.66 °C/10 a. The three highest years in terms of heat wave intensities were 2022, 2006, and 1994, with corresponding values of 38.36 °C, 25.05 °C, and 22.62 °C, respectively. In general, there are clear periodic changes in heat wave intensity in Nanchong. The intensity level of high-temperature heat waves remained relatively low during the 15-year period after 1980, which is similar to the frequency and duration characteristics illustrated in Figure 3 and Figure 4a. Subsequently, the intensity level showed fluctuating upward trends. It is noteworthy that the intensity of high-temperature heat waves has increased by about 35 °C in the three years from 2020 to 2022, with an interannual growth rate of 17.56 °C/a.
To further investigate the abrupt characteristics of the heat waves in Nanchong, this study used the Mann–Kendall mutation test to detect mutation points for heat wave frequencies, durations, and intensities at each station in Nanchong, with a significance level of 0.05 and a confidence interval of ± 1.96. The results are illustrated in Figure 5.

Figure 5.
Mann−Kendall change point test for high−temperature heat wave days (a), frequency (b) and intensity (c) in Nanchong. (UFk refers to calculating the rank sequence of sequential time series, while UBk refers to calculating the rank sequence of inverse time series).
Figure 5 shows the Mann–Kendall (MK) test results for the high-temperature days (Figure 5a), heat wave frequencies (Figure 5b), and intensities (Figure 5c) in Nanchong. It can be seen that all three variables changed significantly within the confidence intervals, and the mutation years for all three variables are within the interval of 2009–2011. The mutation time for the high-temperature days and heat wave frequency is in 2009 and 2010, while the mutation time for high-temperature heat wave intensity is slightly later, in 2011.
3.2. The Spatial Characteristics of High-Temperature Heat Wave Days, Frequency, and Intensity in Nanchong
From 1961 to 2022, the cumulative number of high-temperature days in Nanchong showed a gradually increasing trend from northeast to southwest. There are significant spatial distribution differences on a city scale, with the main urban area of Nanchong and Peng’an County having more cumulative high-temperature days (Figure 6a). Areas with more than 850 cumulative high-temperature days included Jialing District, Shunqing District, Gaoping District, Peng’an County, and Yingshan County. Among them, Gaoping Station had the highest number of high-temperature days, reaching 922 days, slightly higher than other stations, while Yilong County had the fewest cumulative high-temperature days, at only 125 days.
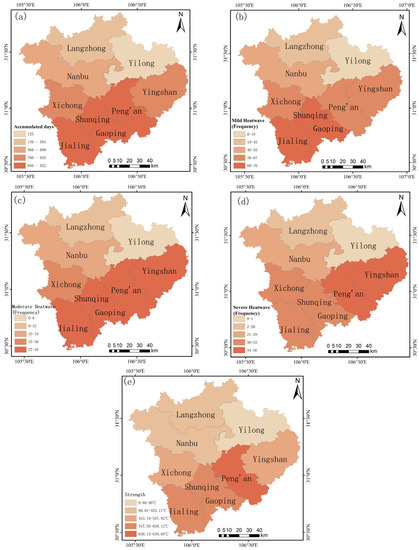
Figure 6.
Spatial distribution of cumulative high-temperature days, frequency, and intensity in Nanchong ((a) shows the cumulative days of high temperatures in the region; (b–d) show the frequency of mild, moderate, and severe heat waves in the region; (e) shows the strength of cumulative high temperatures).
Statistical analysis shows that seven monitoring stations in Nanchong recorded a total of 815 heat wave events of varying grades from 1961 to 2022. Among them, there were 386 mild heat waves, 243 moderate heat waves, and 186 severe heat waves, accounting for 47.36%, 29.82%, and 22.82% of all the high-temperature heat wave events, respectively. Although severe heat waves occurred relatively less frequently, an average of 2 out of every 10 high-temperature heat wave events were still classified as severe, and there has been an upward trend in recent years.
The spatial distribution in accumulated high-temperature heat wave frequencies of different grades at each station is illustrated in Figure 6b–d. The region where mild heat waves occurred most frequently was the Nanchong urban area, with a total of 76 occurrences. The areas with the highest frequency of moderate heat waves were the Nanchong urban area and Peng’an County, both of which had 45 occurrences. The region with the most frequent severe heat wave occurrences was Peng’an County, with a total of 36 occurrences. Notably, the frequencies of high-temperature heat waves at all levels in Yilong County were the lowest in the city, with 18, 8, and 1 occurrences for mild, moderate, and severe heat waves, respectively.
In addition, the intensity of high-temperature heat waves can comprehensively characterize the duration and highest temperature information of heat waves in a given year. By using Formula (1), the intensity of high-temperature heat waves at each station over the past 62 years was calculated and obtained (Figure 6e). The results showed that stations with high intensities were mainly distributed in the southeastern and southern regions of the urban area, with intensities generally exceeding 500 °C, while stations in the northern region had relatively lower intensities between 300 °C and 500 °C, and only the Yilong station had a high-temperature heat wave intensity lower than 100 °C.
3.3. Analysis of the Spatial Pattern of High-Temperature Vulnerability Differentiation in Nanchong
The Formulas (7) and (8) were used to calculate the indices, which were then classified into low, medium, and high levels using the natural break method. The spatial differentiation results for exposure, sensitivity, adaptation, and vulnerability in each region were indirectly obtained (as illustrated in Figure 7).
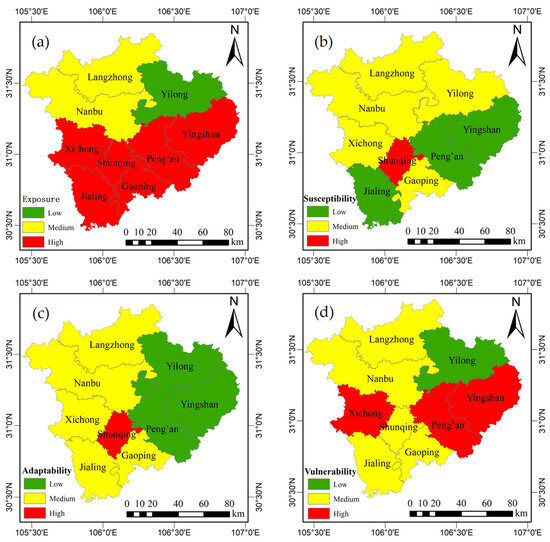
Figure 7.
Spatial differentiation patterns of various indices of high-temperature disasters (a–d).
From the distribution of exposure index in each city (Figure 7a), it can be seen that the city can be mainly divided into two parts, north and south, with the northern part being a medium-to-low exposure area and the southern part being a high exposure area. The medium-to-low exposure area includes Langzhong City, Nanbu County, and Yilong County, while the high exposure area includes Shunqing District, Gaoping District, Jialing District, Peng’an County, Xichong County, and Yingshan County, which account for 66.67% of the total number of districts and counties in Nanchong, with the high exposure area covering 52.90% of the total area of Nanchong. The main urban area of Nanchong is located in the south, where the heat island effect is strong, and the average altitude is low. The northern region is mountainous with a high average altitude, resulting in faster cooling. Therefore, the high-temperature exposure index of Nanchong shows an increasing trend from north to south.
From the spatial distribution of the sensitivity index (Figure 7b), the sensitivity index of Nanchong is mostly at a medium-to-low level, generally lower than 0.38. The sensitivity index of Jialing District is the lowest, at 0.191. The sensitivity index of Shunqing District is 0.69, indicating that Jialing District is least affected by high temperature and Shunqing District is most affected. Shunqing District, as the central district of Nanchong, has a large population and high population density, showing higher sensitivity to high-temperature heat waves.
According to the adaptation index distribution (Figure 7c), the area with the highest adaptation capacity is Shunqing District, with an adaptation index of 0.99. Then, come Gaoping District and Jialing District with corresponding adaptation indices of 0.52 and 0.47, respectively. The lowest adaptation capacity is found in Yilong County, with an adaptation index of 0.11.
The vulnerability index of each district in Nanchong was calculated in this study according to Equation (7), and the spatial distribution is presented in Figure 7d. The proportions of districts with high, medium, and low social vulnerability indices are 33.3%, 55.6%, and 11.1%, respectively. Yilong County, located in the northeast of Nanchong, has the lowest vulnerability index of 1.89. Districts with high vulnerability indices are mainly distributed to the east and west sides of Nanchong, including Peng’an County, Yingshan County, and Xichong County, with vulnerability indices of 1.03, 0.89, and 0.86, respectively. Districts with medium vulnerability indices are relatively widespread, including Shunqing District, Gaoping District, Jialing District, Langzhong City, and Nanbu County, with corresponding vulnerability indices of 0.70, 0.78, 0.72, 0.51, and 0.70, respectively. It is worth noting that the distribution of vulnerability and exposure in each district of Nanchong is roughly consistent. Under the influence of adaptation, the vulnerability level of the main urban area has decreased, whereas the vulnerability level of other districts remains unchanged. This suggests that the positive impact of natural climate factors on the vulnerability to high temperatures in Nanchong is still greater than the negative impact of socioeconomic factors.
4. Discussion on High-Temperature Changes and Characteristic Causes
4.1. Circulation Reason for the Extreme High Temperature in Nanchong in 2022
In 2022, the extremely high-temperature measurement indicators for Nanchong will surpass those for the same period in history. Therefore, some scholars proposed that the abnormal Western Pacific Subtropical High (WPSH) may have a greater impact on extreme temperatures [41,42].
As a permanently high system, the WPSH is in the middle troposphere of the Northwest Pacific region, and it directly affects the summer climate in China [43]. In meteorology, the 500 hPa layer, 5880 gpm geopotential contour line (hereinafter referred to as 588 line) is often used as the influence range for the WPSH. Within this range, the airflow performs a sinking motion. Therefore, abnormal WPSH locations can lead to abnormally high temperatures in China.
The following (Figure 8) shows the distribution of WPSH in the summer of 2022. In June, the location and scope of the WPSH were basically consistent with the climate state (Figure 8a, Table 3). In July, the WPSH intensity increased from 194.1 to 314.6 and the position of the western ridge point was about 10° west of the climate state, which started to prevent water vapor from entering the Northeast Sichuan region. In August, the strength increased to 456.5 and the western extension ridge point moved to the western edge of the Qinghai–Tibet Plateau at 90° E, more than 30° west of the 30 a climate state (Table 3). Here, the northeast of Sichuan is directly controlled by the abnormal anticyclone (Figure 8c). Therefore, the cooling effect of rainwater is invalid, the cloud decreases, the weakening effect on the solar short-wave radiation decreases, the radiation flux increases, and the ground long-wave radiation increases. It directly led to the severe high-temperature heat wave that broke through historical extremes in the Chengdu Chongqing urban agglomeration, including Nanchong, in August.
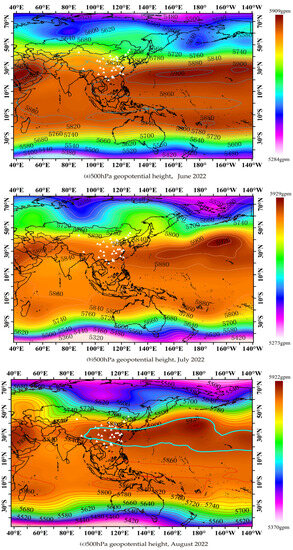
Figure 8.
The 500 hPa geopotential height field in summer of 2022 (gpm) (a–c); the white triangle represents the capital and provincial capital cities of China, and the blue curve in (c) shows the 5880 gpm contour line from August 2022.

Table 3.
Comparison between the subtropical high and climate states in the summer of 2022.
It should be noted that the abnormal WPSH in 2022 did not suddenly occur. The WPSH composite index shows an overall upward trend, and its range of change has increased since 1977 [44]. In addition, studies have pointed out that the northwest extension in the WPSH will lead to an increase in extreme climate events in the Indo–Pacific region [45,46]. Of course, there are also weather systems that cause extremely high temperatures, such as the South Asian High and Rossby waves, et al.
4.2. Cause of the Low-Temperature Period and Sudden Change Points in Nanchong in the 1980s
As mentioned earlier, there was a low period of high-temperature heat waves in Nanchong during the 1980s–1990s. According to previous studies [47,48,49], this phenomenon is not unique to Nanchong but a common occurrence in the Sichuan Basin and southwestern China during that period. Li Yueqing and Li Chongyin [50] pointed out that the correlation coefficient between the temperature anomaly original sequence in the Sichuan Basin and the tropical western Pacific Sea surface temperature anomaly original sequence is 0.96 for an 11-year sliding filter sequence. The sea surface temperature in the tropical western Pacific was at its coldest in the 1980s, indirectly causing the temperature in the Sichuan Basin to reach a low point during that period. Zhang Tianyu [51] found that the aerosol optical depth (AOD) and temperature trend are negatively correlated by analyzing the changes in the AOD and temperature. The AOD significantly increased in the Sichuan–Chongqing region in the 1980s and began to decrease around 1990 [51]. This period of change is highly consistent with the low period of high-temperature heat waves in this study. According to the research of the aforementioned scholars [48,49,50,51], the abnormal sea surface temperature in the tropical western Pacific and the cooling effect of aerosols can explain the phenomenon of lower temperatures in the Sichuan Basin, including Nanchong, during this period to a certain extent.
4.3. Regional-Scale Influences
The influence of urban development (heat island effect) within the regional scope on temperature cannot be ignored [52,53,54]. The increase in urban population and changes in land use types can affect local temperature changes, which may lead to the urban heat island effect [55]. The proportion of artificial surfaces in Nanchong increased from 6.11% in 2004 to 25.25% in 2019. In this study, we calculated the simple urbanization process index K based on the relevant data from 1993 to 2020 and explored the relationship between urban development and urban mean temperature change (Figure 9).
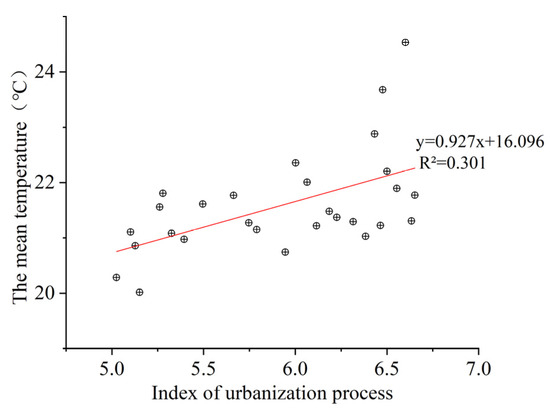
Figure 9.
Relationship between the process of urbanization within the region and changes in mean temperature.
The results show that the correlation coefficient (R) between the K value and the mean temperature in Nanchong is 0.548, which exhibits a significant positive correlation at the 0.01 level. This indicates that there is a significant positive relationship between the two factors.
However, the coefficient of determination value is not high and only shows similar trends. Therefore, although it can be considered that urban development is related to the average temperature in this region, the correlation strength has not yet reached a high level. However, the calculation of the urbanization process that we used is simplified because some data cannot be obtained, which may also lead to differences in results.
Not only in Nanchong, Jia et al. [56] pointed out that a large proportion of the warming in Wuhan can be attributed to the rapid urbanization in the past half-century. However, some studies have pointed out that the heat island effect brought about by urbanization does not directly cause an increase in maximum temperature, but only affects the average temperature [57]. Therefore, further research is needed to determine whether there are other mediating effects of the heat island effect of urbanization on heat waves and extremely high temperatures.
5. Conclusions
The historical changes and fragility of the high temperatures in Nanchong have been explored in this study and the conclusions are as follows.
- (1)
- The high-temperature weather events in Nanchong have shown a fluctuating upward trend. Significant mutations occurred in various indicators measuring high-temperature characteristics around 2010.
- (2)
- Exposure levels are high in the south and low in the north. The sensitivity index and adaptability decrease from the central urban area to the surrounding areas.
- (3)
- Vulnerability is pronounced in specific districts: one in the west and two in the east. Both social factors (e.g., urban surface properties and aerosol characteristics) and natural factors (e.g., solar radiation, cloud thickness, and global sea surface temperature) contribute to the vulnerability characteristics indicated here.
- (4)
- The abnormal westward movement of the WPSH and the increase in intensity are the main reasons for the breakthrough of various high-temperature indicators in 2022. The temperature trough period in the 1980s and the mutations in the high-temperature situation around 2010 are related to the global sea surface temperature change and urbanization process identified here.
However, there are some limitations to our study. The research on the spatiotemporal characteristics and mechanism of high-temperature heat waves needs to be improved. Moreover, insufficient consideration was given to factors such as terrain fluctuations and water system distributions. Therefore, further research is needed.
Author Contributions
Conceptualization, Z.Y.; methodology, W.L.; software, Z.C. and P.S.; validation, P.S. and X.L.; formal analysis, Z.Y.; investigation, Z.Y.; resources, Z.Y. and P.S.; visualization, C.Q.; supervision, W.L. and Z.C.; funding acquisition, W.L. All authors have read and agreed to the published version of the manuscript.
Funding
This research was funded by Regional Cultural Research Center of Sichuan Provincial Social Science Key Research Base Annual Project (No. CQYYJC2101); National Innovation and Entrepreneurship Training Program for College Students (No. 201910638025, S202010638090, 202110638013); Educational Reform Project of China West Normal University (No. 403995).
Institutional Review Board Statement
Not applicable.
Informed Consent Statement
Not applicable.
Data Availability Statement
Due to privacy and related policy factors, we will not provide relevant data now.
Conflicts of Interest
The authors declare no conflict of interest.
References
- Climate Change 2021: The Physical Science Basis. Available online: https://www.ipcc.ch/report/ar6/wg1/chapter/summary-for-policymakers/ (accessed on 28 January 2023).
- Zampieri, M.; Russo, S.; Sabatino, S.; Michetti, M.; Scoccimarro, E.; Gualdi, S. Global assessment of heat wave magnitudes from 1901 to 2010 and implications for the river discharge of the Alps. Sci. Total Environ. 2016, 571, 1330–1339. [Google Scholar] [CrossRef] [PubMed]
- Barlough, J.E.; Stoddart, C.A.; Sorresso, G.P.; Jacobson, R.H.; Scott, F.W. Future population exposure to US heat extremes. Nat. Clim. Chang. 2015, 5, 652–655. [Google Scholar] [CrossRef]
- Sun, Y.; Hu, T.; Zhang, X. Substantial increase in heat wave risks in China in a future warmer world. Earth’s Future 2018, 6, 1528–1538. [Google Scholar] [CrossRef]
- Gao, L.; Ren, H.; Zheng, J.; Chen, Q. Diagnosis features of extreme temperature variations in China based on the NCEP-GEFS reforecasts. Trans. Atmos. Sci. 2019, 42, 58–67. (In Chinese) [Google Scholar] [CrossRef]
- Robine, J.M.; Cheung, S.L.K.; Roy, S.L.; Oyen, H.V.; Griffiths, C.; Michel, J.P.; Herrmann, F.R. Death toll exceeded 70,000 in Europe during the summer of 2003. C. R. Biol. 2008, 331, 171–178. [Google Scholar] [CrossRef] [PubMed]
- Khan, N.; Shahid, S.; Ismail, T.; Ahmed, K.; Nawaz, N. Trends in heat wave related indices in Pakistan. Stoch. Env. Res. Risk. A 2019, 33, 287–302. [Google Scholar] [CrossRef]
- You, Q.; Jiang, Z.; Xu, Y.; Guo, W.; Liu, Y.; Cao, J.; Li, W.; Wu, F.; Cai, Z.; Zhu, H.; et al. Recent frontiers of climate changes in East Asia at global warming of 1.5 °C and 2 °C. NPJ Clim. Atmos. Sci. 2022, 5, 80. [Google Scholar] [CrossRef]
- Zhou, C.; Zhang, S.; Qi, D.; Tang, X.; Li, Y. Variation Features and Impact of High Temperature in Sichuan during Last 50 Years. Plateau Meteorol. 2013, 32, 1720–1728. (In Chinese) [Google Scholar] [CrossRef]
- Cai, W.; Zhang, C.; Suen, H.P.; Ai, S.; Bai, Y.; Bao, J.; Chen, B.; Cheng, L.; Cui, X.; Dai, H.; et al. The 2020 China report of the Lancet Countdown on health and climate change. Lancet Public Health 2021, 6, e64–e81. [Google Scholar] [CrossRef]
- Chen, H.; Zhao, L.; Dong, W.; Cheng, L.; Cai, W.; Yang, J.; Bao, J.; Liang, X.; Hajat, S.; Gong, P.; et al. Spatiotemporal variation of mortality burden attributable to heatwaves in China, 1979–2020. Sci. Bull. 2022, 67, 1340–1344. [Google Scholar] [CrossRef]
- Fouillet, A.; Rey, G.; Laurent, F.; Pavillon, G.; Bellec, S.; Guihenneuc-Jouyaux, C.; Clavel, J.; Jougla, E.; Hémon, D. Excess mortality related to the August 2003 heat wave in France. Int. Arch. Occup. Environ. Health 2006, 80, 16–24. [Google Scholar] [CrossRef]
- Wolf, J.; Adger, W.N.; Lorenzoni, I.; Abrahamson, V.; Raine, R. Social capital, individual responses to heat waves and climate change adaptation:An empirical study of two UK cities. Glob. Environ. Chang. 2010, 20, 44–52. [Google Scholar] [CrossRef]
- Klinenberg, E. Heat Wave: A Social Autopsy of Disaster in Chicago; University of Chicago Press: Chicago, IL, USA, 2015; pp. 121–130. [Google Scholar]
- Hirschi, M.; Seneviratne, S.I.; Alexandrov, V.; Boberg, F.; Boroneant, C.; Christensen, O.B.; Formayer, H.; Orlowsky, B.; Stepanek, P. Observational evidence for soil-moisture impact on hot extremes in southeastern Europe. Nat. Geosci. 2011, 4, 17–21. [Google Scholar] [CrossRef]
- Inostroza, L.; Palme, M.; De La Barrera, F. A heat vulnerability index: Spatial patterns of exposure, sensitivity and adaptive capacity for Santiago de Chile. PLoS ONE 2016, 11, e0162464. [Google Scholar] [CrossRef] [PubMed]
- Ye, D.; Yin, J.; Chen, Z.; Zheng, Y.; Wu, R. Spatiotemporal Change Characteristics of Summer Heatwaves in China in 1961–2010. Clim. Chang. Res. 2013, 9, 15–20. (In Chinese) [Google Scholar] [CrossRef]
- Zhang, X.; Huang, X.; Zheng, D. Temporal and Spatial Characteristics of Heat Waves and Assessment of Vulnerability in the Yangtze River Economic Belt. Resour. Environ. Yangtze Basin 2023, 32, 440–450. (In Chinese) [Google Scholar]
- Tong, L.; Li, X.; Si, Q.; Zhang, J. Risk assessment of population exposure to heat wave: A case of Baotou City, Inner Mongolia, China. Arid Land Geogr. 2017, 40, 284–292. (In Chinese) [Google Scholar] [CrossRef]
- He, M.; Xu, Y.; Li, N.; Bai, L. Assessing Heat Wave Risk in Beijing by Remote Sensing. Ecol. Environ. Sci. 2017, 26, 635–642. (In Chinese) [Google Scholar] [CrossRef]
- Xing, P.; Yang, R.; Du, W.; Dang, B.; Xuan, C.; Xiong, F. Spatiotemporal Variation of High Temperature Day and Heat Wave in North China During 1961−2017. Sci. Geogr. Sin. 2020, 40, 1365–1376. (In Chinese) [Google Scholar] [CrossRef]
- Li, W.; Wen, X.; Zhan, L.; Wang, J.; Chen, Z.; Li, W.; You, Y. The Variation of Cooling and Heating Degree Days and Its Response to Climate Warming in Nanchong. J. China West Norm. Univ. (Nat. Sci.) 2017, 38, 334–339. (In Chinese) [Google Scholar] [CrossRef]
- Zheng, D.; Huang, X. Population Exposure Risk of Heat Wave and Its Influencing Factors at County Level in China. Areal Res. Dev. 2022, 41, 143–149. (In Chinese) [Google Scholar] [CrossRef]
- Outline of the 14th Five Year Plan for National Economic and Social Development and the 2035 Long Range Goals of Nanchong City. Available online: https://nanchong.gov.cn/zwgk/fdzdgknr/ghxx/fzgh/202104/t20210409_748281.html (accessed on 28 March 2023).
- Wang, D. Thoughts on the Construction of Chengdu-Chongqing Economic Circle in Nanchong. J. China West Norm. Univ. (Philos. Soc. Sci.) 2020, 42, 99–102. (In Chinese) [Google Scholar] [CrossRef]
- Dong, C.; Luo, M.; Wang, Y.; Liu, S. Spatial Distribution of Typical Landuse Type in Underdeveloped Industrial Cities—A Case of Jialing District in Nanchong City, Sichuan Province. ISPRS—Int. Arch. Photogramm. Remote Sens. Spat. Inf. Sci. 2014, XL-4, 51–57. [Google Scholar] [CrossRef]
- Chen, H.; Zhao, L.; Cheng, L.; Zhang, Y.; Wang, H.; Gu, K.; Bao, J.; Yang, J.; Liu, Z.; Huang, J. Projections of heatwave-attributable mortality under climate change and future population scenarios in China. Lancet. Reg. Health. West. Pac. 2022, 28, 100582. [Google Scholar] [CrossRef]
- Cai, Y.; Wu, T.; Zhang, W.; Cai, Y.; Wang, J.; Pu, M. Spatial and temporal distribution characteristics of heatwave in Sichuan Province based on REOF. J. Nat. Disasters 2018, 27, 201–208. (In Chinese) [Google Scholar] [CrossRef]
- Kim, J.; Kwon, T.; Lee, J.; Kim, Y. Identifying Major Components of Extreme Heatwave Risk Assessment Indexes in Urban Areas. KIEAE J. 2019, 19, 5–10. [Google Scholar] [CrossRef]
- Deng, T.; Geng, G.; Yang, R.; Zhang, B. Temporal and spatial variation characteristics of high temperature and heat wave in the Weihe River Basin from 1980 to 2020. Arid Land Geogr. 2023, 46, 211–221. (In Chinese) [Google Scholar]
- Sutapa, C.; Debashree, D. Mann-Kendall trend of pollutants, temperature and humidity over an urban station of India with forecast verification using different ARIMA models. Environ. Monit. Assess 2014, 186, 4719–4742. [Google Scholar] [CrossRef]
- Zhu, Y.; Li, L.; He, S.; Li, H.; Wang, Y. Peak Year Prediction of Shanxi Province’s Carbon Emission Based on IPAT Modeling and Scenario Analysis. Resour. Sci. 2016, 32, 2316–2325. (In Chinese) [Google Scholar] [CrossRef]
- Adger, W.N. Vulnerability. Glob. Environ. Chang. 2006, 16, 268–281. [Google Scholar] [CrossRef]
- Xue, Q.; Xie, M.; Guo, Q.; Wang, Y.; Wu, R.; Liu, Q. Research Progress on Urban Heat Wave Vulnerability Assessment: A Geographical Perspective. Prog. Geogr. 2020, 39, 685–694. (In Chinese) [Google Scholar] [CrossRef]
- Jenerette, G.D.; Harlan, S.L.; Brazel, A.; Jones, N.; Larsen, L.; Stefanov, W.L. Regional relationships between surface temperature, vegetation, and human settlement in a rapidly urbanizing ecosystem. Landsc. Ecol. 2007, 22, 353–365. [Google Scholar] [CrossRef]
- Frazier, T.G.; Thompson, C.M.; Dezzani, R.J. A framework for the development of the SERV model: A Spatially Explicit Resilience-Vulnerability model. Appl. Geogr. 2014, 51, 158–172. [Google Scholar] [CrossRef]
- Zhou, C.; Wang, L.; Guo, S.; Song, Y.; Yang, Y. Spatiotemporal Characteristics and Prediction Model of Heat Waves in Sichuan Basin. Plateau Mt. Meteorol. Res. 2014, 34, 51–57. (In Chinese) [Google Scholar]
- Wang, B. Characteristics of Drought Disaster and Countermeasures of Artificial Rain Enhancement and Drought Resistance in Nanchong City. J. Smart Agric. 2022, 2, 47–49. (In Chinese) [Google Scholar] [CrossRef]
- Cheng, B.; Sun, W.; Guo, Q. Analyses of Climatological Features of the Summer High Temperature and Circulation Situation in Chongqing. J. Southwest Univ. (Nat. Sci. Ed.) 2010, 32, 73–80. [Google Scholar] [CrossRef]
- Sun, C.; Cheng, Z.; Mao, X.; Mei, S.; Yang, X. Analysis of Extreme Climate Change Trends and Characteristics in Sichuan Province in the Last 44 Years. J. Lanzhou Univ. (Nat. Sci.) 2017, 53, 119–126. (In Chinese) [Google Scholar] [CrossRef]
- Soledad, C.; Mariana, B.; Matilde, R. Association between El Nino and extreme temperatures in southern South America in CMIP5 models. Part 1: Model evaluation in the present climate. Clim. Res. 2021, 83, 111–132. [Google Scholar] [CrossRef]
- Cai, J.; Guan, Z.; Yu, T.; Lu, C. A classification of the summertime temperature patterns in the middle and lower reaches of the Yangtze River and their causes II: Interdecadal variations. Acta Meteorol. Sin. 2011, 69, 112–124. [Google Scholar] [CrossRef]
- Wang, Y.; Wang, F.; Sun, X. Sinuosity of Atmospheric Circulation over Southeastern China and Its Relationship to Surface Air Temperature and High Temperature Extremes. Atmosphere 2021, 12, 1139–1154. [Google Scholar] [CrossRef]
- Chen, S.; Xu, F.; Li, Y.; Du, J.; Tu, S.; Ji, Q.; Yang, J.; Zhang, S.; Zhang, Y.; Zhi, S. Summer SST in the Northwest Pacific in the Past 70 Years and Its Correlation with the Variation of the Western Pacific Subtropical High. J. Trop. Meteorol. 2020, 36, 846–854. [Google Scholar] [CrossRef]
- Chaluvadi, R.; Varikoden, H.; Mujumdar, M.; Ingle, S. Variability of West Pacific Subtropical High and its Potential Importance to the Indian Summer Monsoon Rainfall. Int. J. Climatol. 2021, 41, 4047–4060. [Google Scholar] [CrossRef]
- Roja, C.; Hamza, V.; Milind, M.; Lingle, S.T.; Kuttippurath, J. Changes in large-scale circulation over the Indo-Pacific region and its association with 2018 Kerala extreme rainfall event. Atmos. Res. 2021, 263, 105809. [Google Scholar] [CrossRef]
- Liang, L.; Chen, M.; Huang, D. Spatiotemporal change and non-stationarity of air temperature in China from 1959 to 2018. Sustain. Cities Soc. 2022, 87, 104227. [Google Scholar] [CrossRef]
- Wang, S.; Jiao, S.; Xin, H. Spatio-temporal characteristics of temperature and precipitation in Sichuan Province, Southwestern China, 1960–2009. Quat. Int. 2013, 286, 103–115. [Google Scholar] [CrossRef]
- Xia, F.; Zhao, J. Research on annual extreme temperature in recent 51 years in Leshan, Sichuan Province. J. Earth Environ. 2015, 6, 1–10. (In Chinese) [Google Scholar] [CrossRef]
- Li, Y.; Li, C. The Relationship between the Cooling of Air Temperature in Sichuan Basin and the Anomalies of SST over Tropical Western Pacific during the Last More Than 40 Years. Clim. Environ. Res. 1999, 4, 388–395. (In Chinese) [Google Scholar] [CrossRef]
- Zhang, T.; Wang, Y.; Cheng, B. Long-term Variation of Aerosol Optical Depth over Sichuan Basin of China During 1961—2013 and its Relationship with Temperature. Acta Sci. Circumstantiate 2017, 37, 793–802. (In Chinese) [Google Scholar] [CrossRef]
- Qin, X.; Wu, X.; Chiew, Y.M.; Li, Y. A Green Roof Test Bed for Stormwater Management and Reduction of Urban Heat Island Effect in Singapore. Br. J. Environ. Clim. Chang. 2013, 2, 410–420. [Google Scholar] [CrossRef]
- Van, T.T.; Bao, H.D.X. Study of the Impact of Urban Development on Surface Temperature Using Remote Sensing in Ho Chi Minh City, Southern Vietnam. Geogr. Res. 2010, 48, 86–96. [Google Scholar] [CrossRef]
- Senbore, S.; Oke, S.A.; Kirsten, M. Urban development impact on climate variability and surface water quality in part of Mangaung metropolis of South Africa. Dev. South. Afr. 2023, 40, 293–312. [Google Scholar] [CrossRef]
- Liu, Y. Study on Greenbelt System and Heat Island Effect in Main Urban Area of Nanchong. Master’s Thesis, Chengdu University of Technology, Chengdu, China, 2021. [Google Scholar]
- Jia, W.; Ren, G.; Suo, N.K.; Zhang, P.; Wen, K.; Ren, Y. Urban Heat Island Effect and its Contribution to Observed Temperature Increase at Wuhan Station, Central China. J. Trop. Meteorol. 2019, 25, 102–113. [Google Scholar] [CrossRef]
- Sun, T.; Sun, R.; Chen, L. The Trend Inconsistency between Land Surface Temperature and Near Surface Air Temperature in Assessing Urban Heat Island Effects. Remote Sens. 2020, 12, 1271. [Google Scholar] [CrossRef]
Disclaimer/Publisher’s Note: The statements, opinions and data contained in all publications are solely those of the individual author(s) and contributor(s) and not of MDPI and/or the editor(s). MDPI and/or the editor(s) disclaim responsibility for any injury to people or property resulting from any ideas, methods, instructions or products referred to in the content. |
© 2023 by the authors. Licensee MDPI, Basel, Switzerland. This article is an open access article distributed under the terms and conditions of the Creative Commons Attribution (CC BY) license (https://creativecommons.org/licenses/by/4.0/).