Article

Characteristics of Advection Fog at Qingdao Liuting International Airport

1
Unit No. 92192 of Chinese People’s Liberation Army, Ningbo 315000, China
2
College of Meteorology and Oceanography, National University of Defense Technology, Changsha 410073, China
3
High Impact Weather Key Laboratory of CMA, Changsha 410073, China
4
Laboratoire de Météorologie Dynamique, CNRS, Sorbonne Université, 75005 Paris, France
5
Unit No. 92859 of Chinese People’s Liberation Army, Tianjin 300000, China
*
Author to whom correspondence should be addressed.
Atmosphere 2023, 14(8), 1310; https://doi.org/10.3390/atmos14081310
Submission received: 18 July 2023 / Revised: 8 August 2023 / Accepted: 16 August 2023 / Published: 19 August 2023
(This article belongs to the Section Meteorology)

Abstract

:
The advection fog characteristics at Qingdao Liuting International Airport during 2000–2022 are studied based on surface observation, sounding and reanalysis data. Surface observation data show that there were two types of fog: evaporation fog (EF) dominated by northwesterly wind in winter and cooling fog (CF) dominated by southeasterly wind in spring and summer. CF is thicker than EF due to different planetary boundary layer (PBL) structures. For EF, the middle and low troposphere are affected by dry and cold air, while CF is affected by warm and moist air below 850 hPa. When EF formed, downdrafts and a positive vertical gradient of the pseudo-equivalent potential temperature indicate stable PBL, surface heat flux is upward from sea to atmosphere and surface wind diverges near the air–sea interface. When CF formed, these characteristics are reversed. Fog is significantly affected by sea–land–atmosphere interactions. The moisture source is mainly from surface fluxes released by the Yellow Sea in the case of EF, while it is from moist air at low latitudes and local land transpiration in the case of CF. The difference in temperature between the sea surface and surface air changes from the range of 0–8 K for EF but from −4–0 K for CF.

1. Introduction

Fog refers to the phenomenon of abundant droplets or crystals produced by water vapor condensation in the planetary boundary layer (PBL), resulting in a horizontal visibility of less than 1 km [1,2]. Coastal fog affects aircraft takeoff and landing operations [3,4,5]. Fog with reduced visibility is directly associated with an increase in deaths and accidents [6]. The coastal fog influence on ecosystems is also important for the water budget [7]. Previous studies have mainly focused on sea fog over the Yellow Sea (YS) and less on coastal fog near the sea.
The coastal areas of Qingdao and the YS are the most notorious fog areas in China [8,9]. Previous studies mainly investigated the YS fog formation mechanism and characteristics from March/April to August, the period of prevailing seasonal southeasterly winds [10]. Approximately 80–90% of YS area fog is advection fog [9]. Advection fog can be either evaporation fog (EF) or cooling fog (CF), with distinct formation mechanisms. EF forms when advected surface air temperature (SAT) becomes colder than sea surface temperature (SST), and it is frequently observed in the Arctic regions [11]. SST is much warmer than SAT in the Arctic regions, about 15–20 K, which is confined by strong temperature inversion (TI) at the EF top [12,13]. CF forms when SST becomes generally colder than SAT and is dominant in summer in the YS area [9,14]. Studies have shown that the local SST is the main driving factor of annual fog variation in the YS area, and the advection fog formation process is sensitive to SST [10,15]. The difference between SST and SAT is about 15–20 K when EF forms in the Arctic region, but what is the difference between SST and SAT when EF and CF form in the YS area? We are also curious about the difference between atmospheric circulation and PBL structure. Based on satellite observation data, surface observation data and Weather Research and Forecasting (WRF) model results, numerous studies targeted fog evolution features and large-scale circulation characteristics over the YS [16,17,18,19,20], but no comparative analysis has been made on the difference between EF and CF.
Liuting International Airport is located in southern Shandong Province along the coast of the YS, where southeasterly wind prevails in summer, and northwesterly wind prevails in winter. Numerous studies investigated the formation mechanism and PBL structure of CF, which is often accompanied by southeasterly winds in spring and summer [14,21,22,23,24], but few studies focused on fog in winter. However, surface observations show that fog also forms under northwesterly wind in winter at the airport. Like boundary layer clouds, such as stratocumulus clouds, which may respond differently to SST under different wind regimes [25,26], advection fog may behave similarly, with different formation mechanisms as a function of atmospheric circulation regimes. This question deserves a full investigation. The present study aims to reveal the common points and differences between EF and CF by comparing their characteristics and PBL structures.
The remainder of the manuscript is designed as follows. Following the introduction, Section 2 describes the datasets. Section 3 studies the characteristics and differences in EF and CF and the effects of sea–land–atmosphere interactions on the formation mechanism and diurnal variation in fog. Finally, the discussion and conclusions are summarized in Section 4 and Section 5.

2. Data and Methods

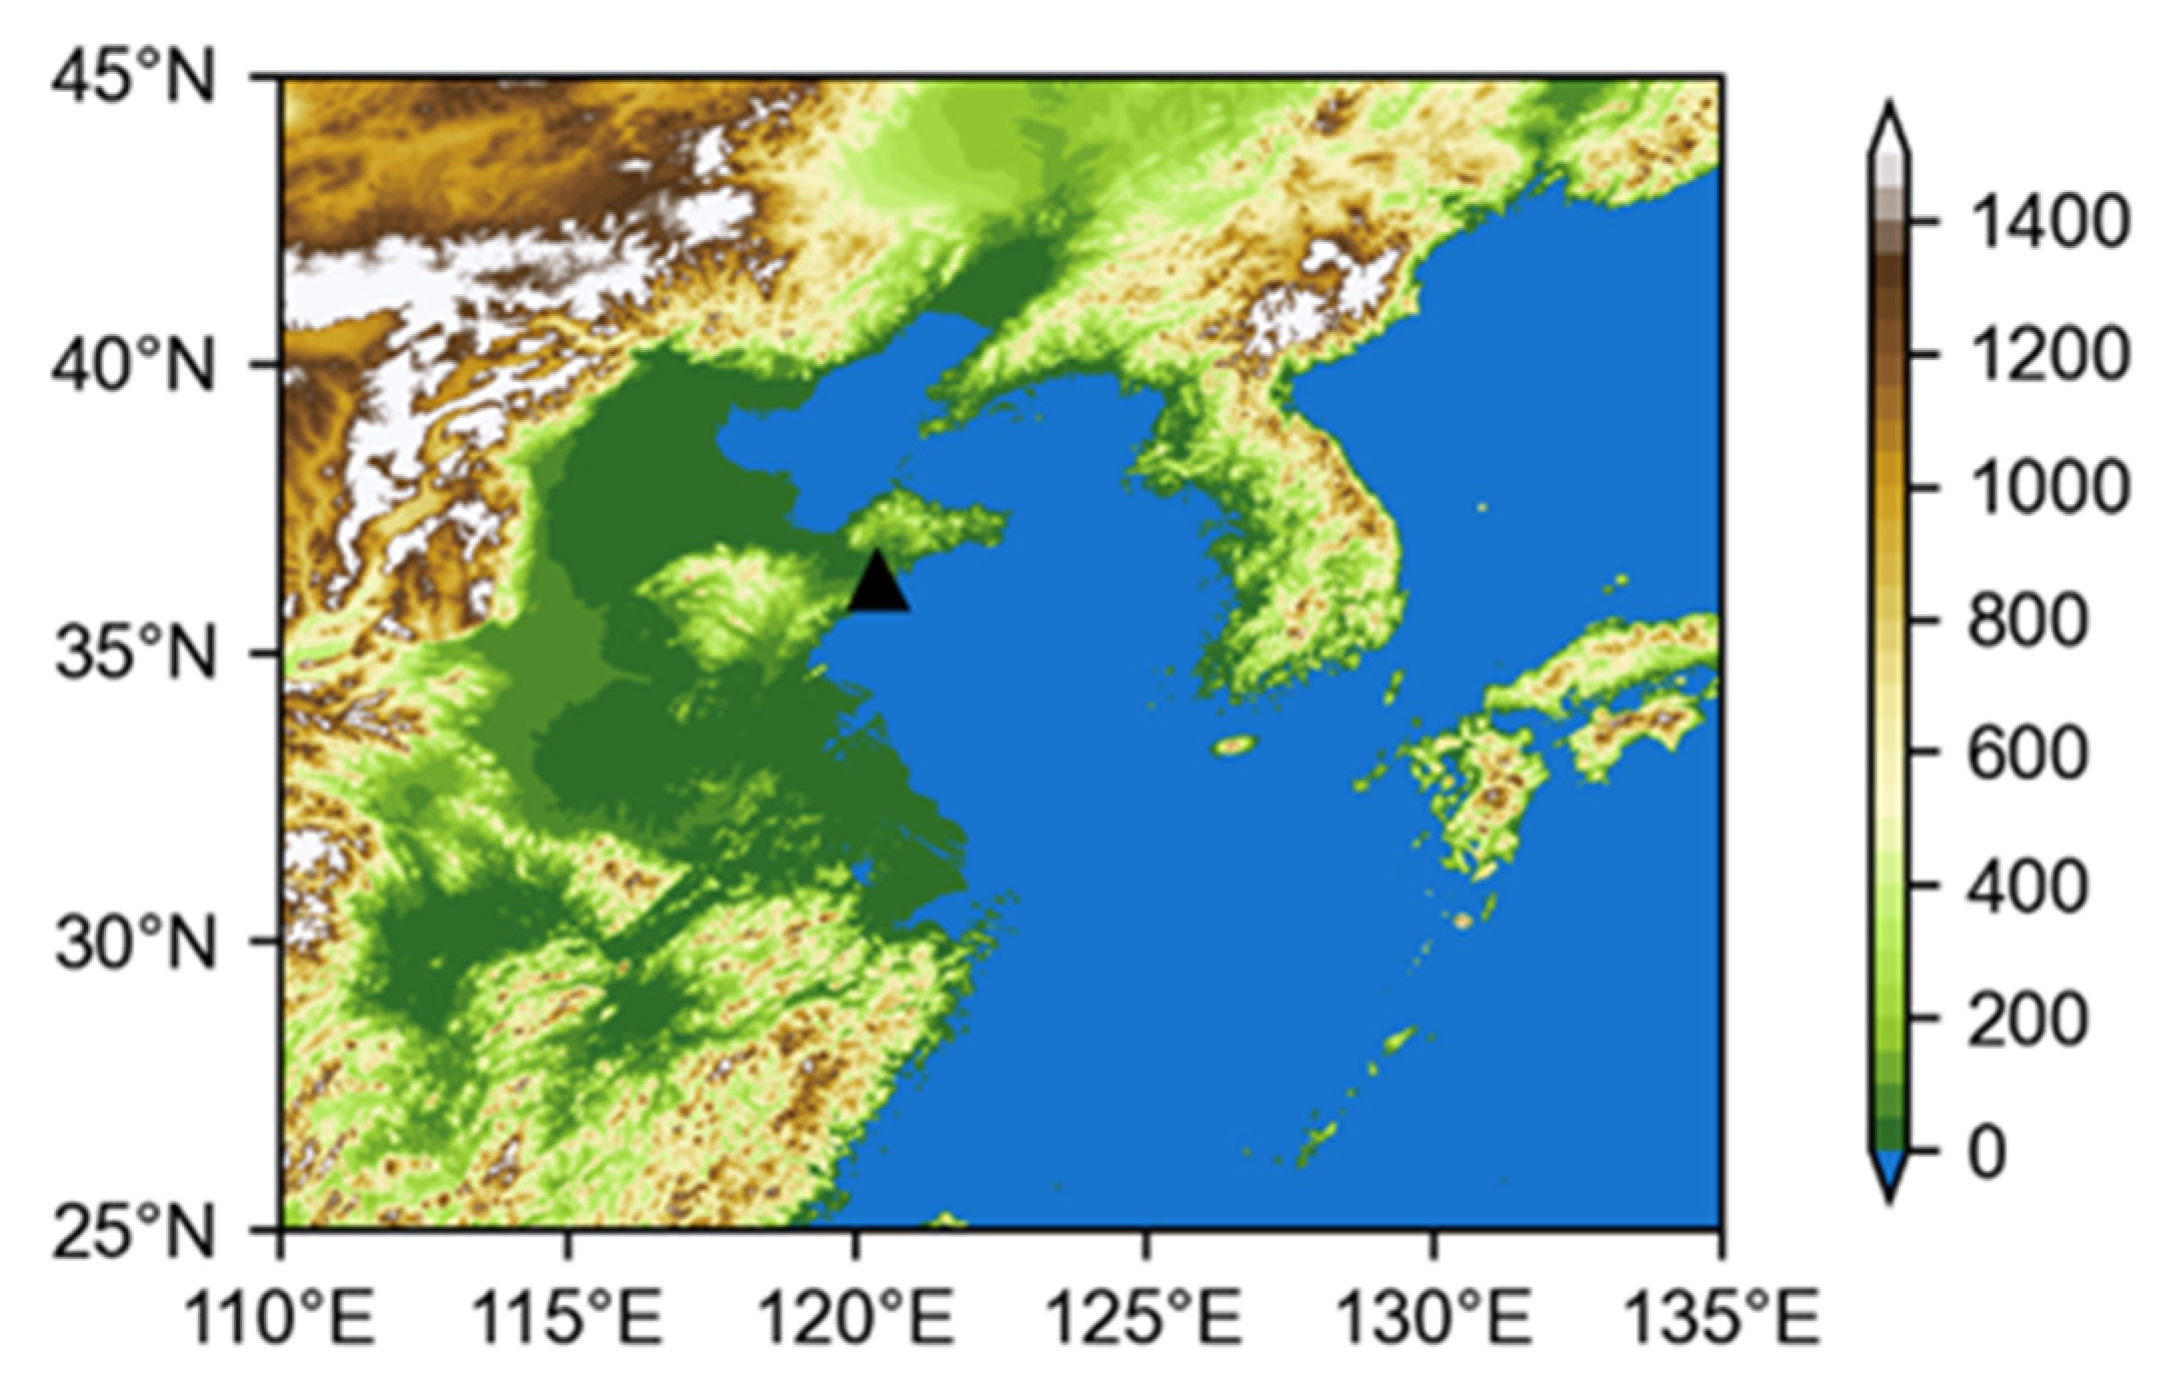
2.1. Surface Observation

Qingdao Liuting International Airport (120.3744° E, 36.2661° N) is located in southern Shandong Province, with an altitude above sea level of 10 m, and is located approximately 30 km from the shore. To the west of the airport is the Jiaozhou Bay, a major harbor in the region, and to the south is the YS (Figure 1). On 12 August 2021, the airport was closed, and its commercial activities moved to Qingdao Jiaodong International Airport, but surface observations continue to operate. Jiaodong International Airport is located 28 km northwest of Liuting International Airport. Analysis of the fog characteristics at Liuting International Airport has certain indicative significance for Jiaodong International Airport fog warning and forecasting.
Hourly surface observations are available from 2000 to 2022, including all weather information such as wind direction (°), wind speed (m s−1), visibility (m), surface air temperature (°C), dew point (°C), sea level pressure (SLP, hectopascals), and manually reported present weather (MW). All data in this study were recorded in UTC except for special statements, and the meteorological information was quality controlled. Fog was observed when the MW record ranged from 40 to 49. Fog is defined as visibility being less than 1000 m, with a life cycle lasting longer than 2 h, and MW records between 40 and 49. The formation time is defined as the first time when the visibility is less than 1000 m, the dominant wind direction of the fog is defined as the wind direction at formation time, and variations in wind direction are less than ±22.5°.

2.2. Sounding Data

Sounding data are gathered from the University of Wyoming where the radiosonde data of Qingdao station are archived. The Qingdao station is situated near the airport with an altitude above sea level of 77.0 m (120.33° E, 36.07° N). Radiosonde are launched twice a day at 00 and 12 UTC (08 and 20 Beijing Standard Time, BST) and the atmospheric profile obtained comprises air temperature, dew point, pressure, relative humidity (RH) and wind. There are approximately 4 pressure layers located below 1000 m in the sounding data before January 2020 and 12–15 layers after that. Only 4 layers are present in the reanalysis data. The fog thickness is usually smaller than 1000 m, and higher vertical resolution sounding data could be more beneficial to the study of the PBL structure. The TI is observed when the temperature at the upper level is warmer than that at an immediate lower level, implying a positive temperature gradient in the vertical [27]. The TI strength (TIS) is defined as the difference in temperature between the top and base of the inversion divided by the inversion thickness [27]. The height of the PBL (PBLH) is defined as the base height of the TI.

2.3. Reanalysis Data

This paper uses the fifth generation European Centre for Medium-range Weather Forecasts (ECMWF) global atmospheric reanalysis data (ERA5) to analyze the atmospheric circulation and the PBL structure [28]. The horizontal resolution of the hourly ERA5 data is 0.25° × 0.25°, with 16 layers in the vertical direction of 1000–500 hPa. The surface data used in this paper include SST, SLP, sensible heat flux (SHF), latent heat flux (LHF), SAT, and 10 m wind. Pressure level data include wind, RH, geopotential height and temperature.

3. Results

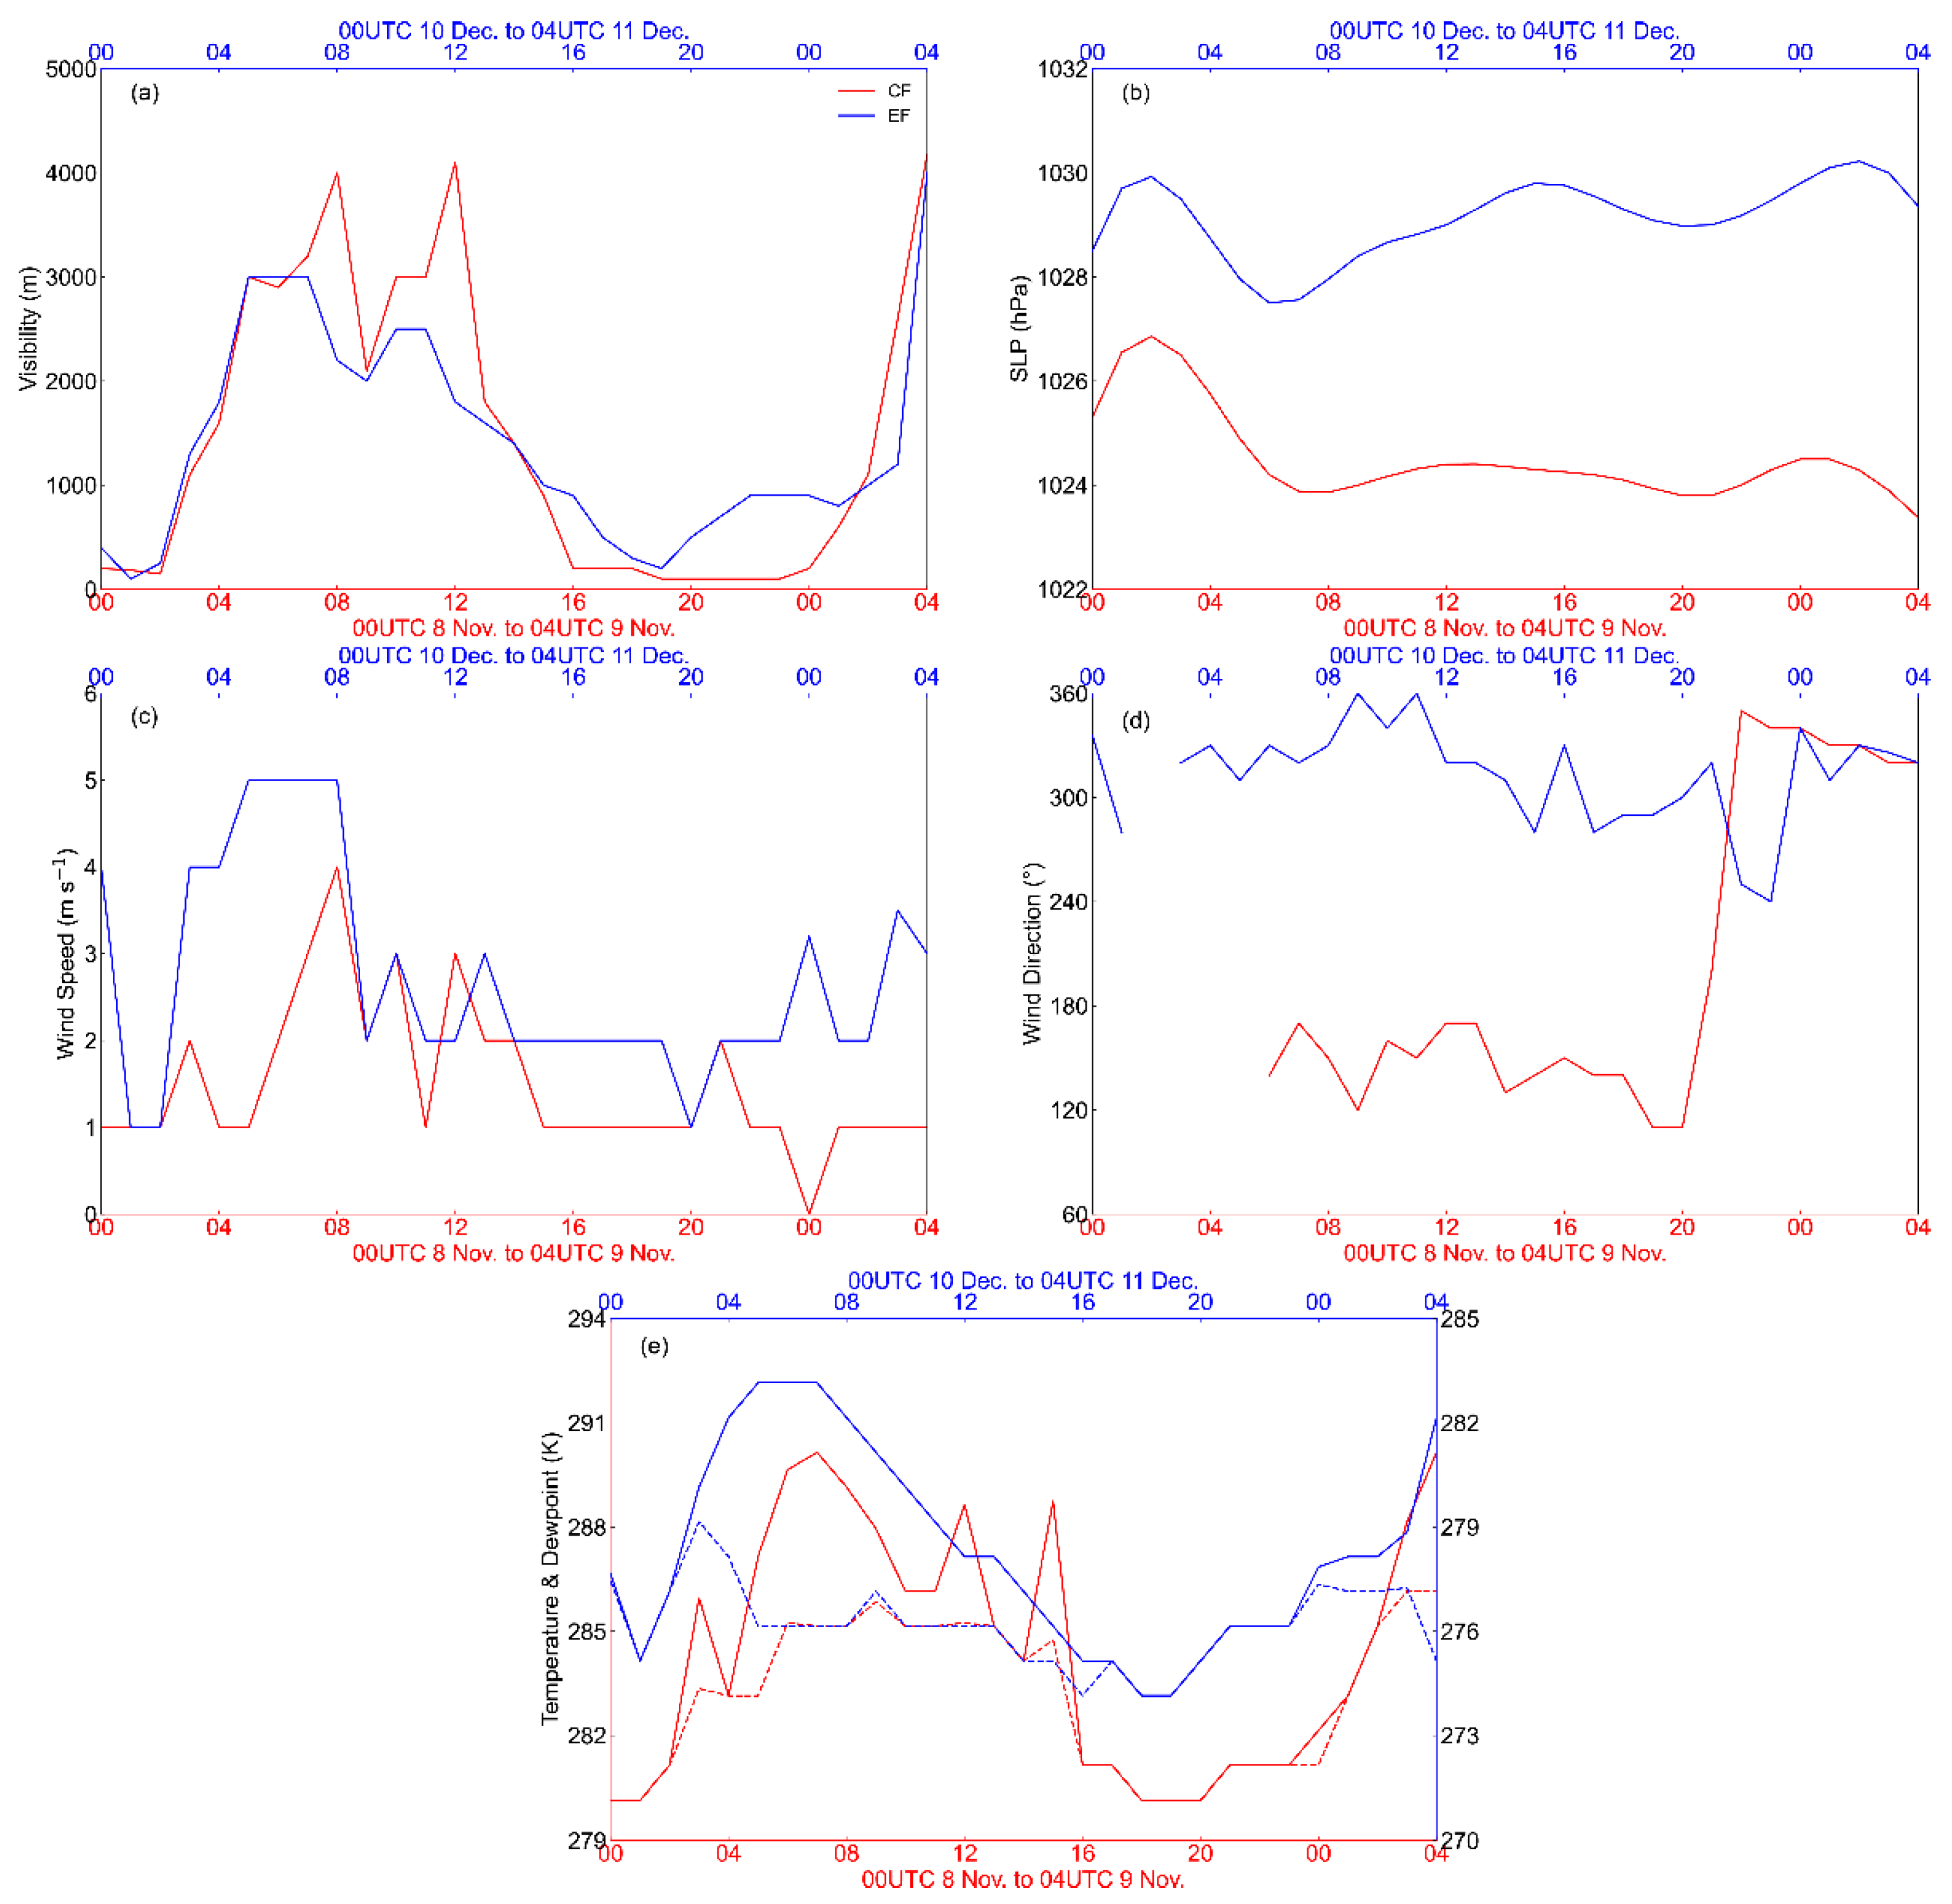
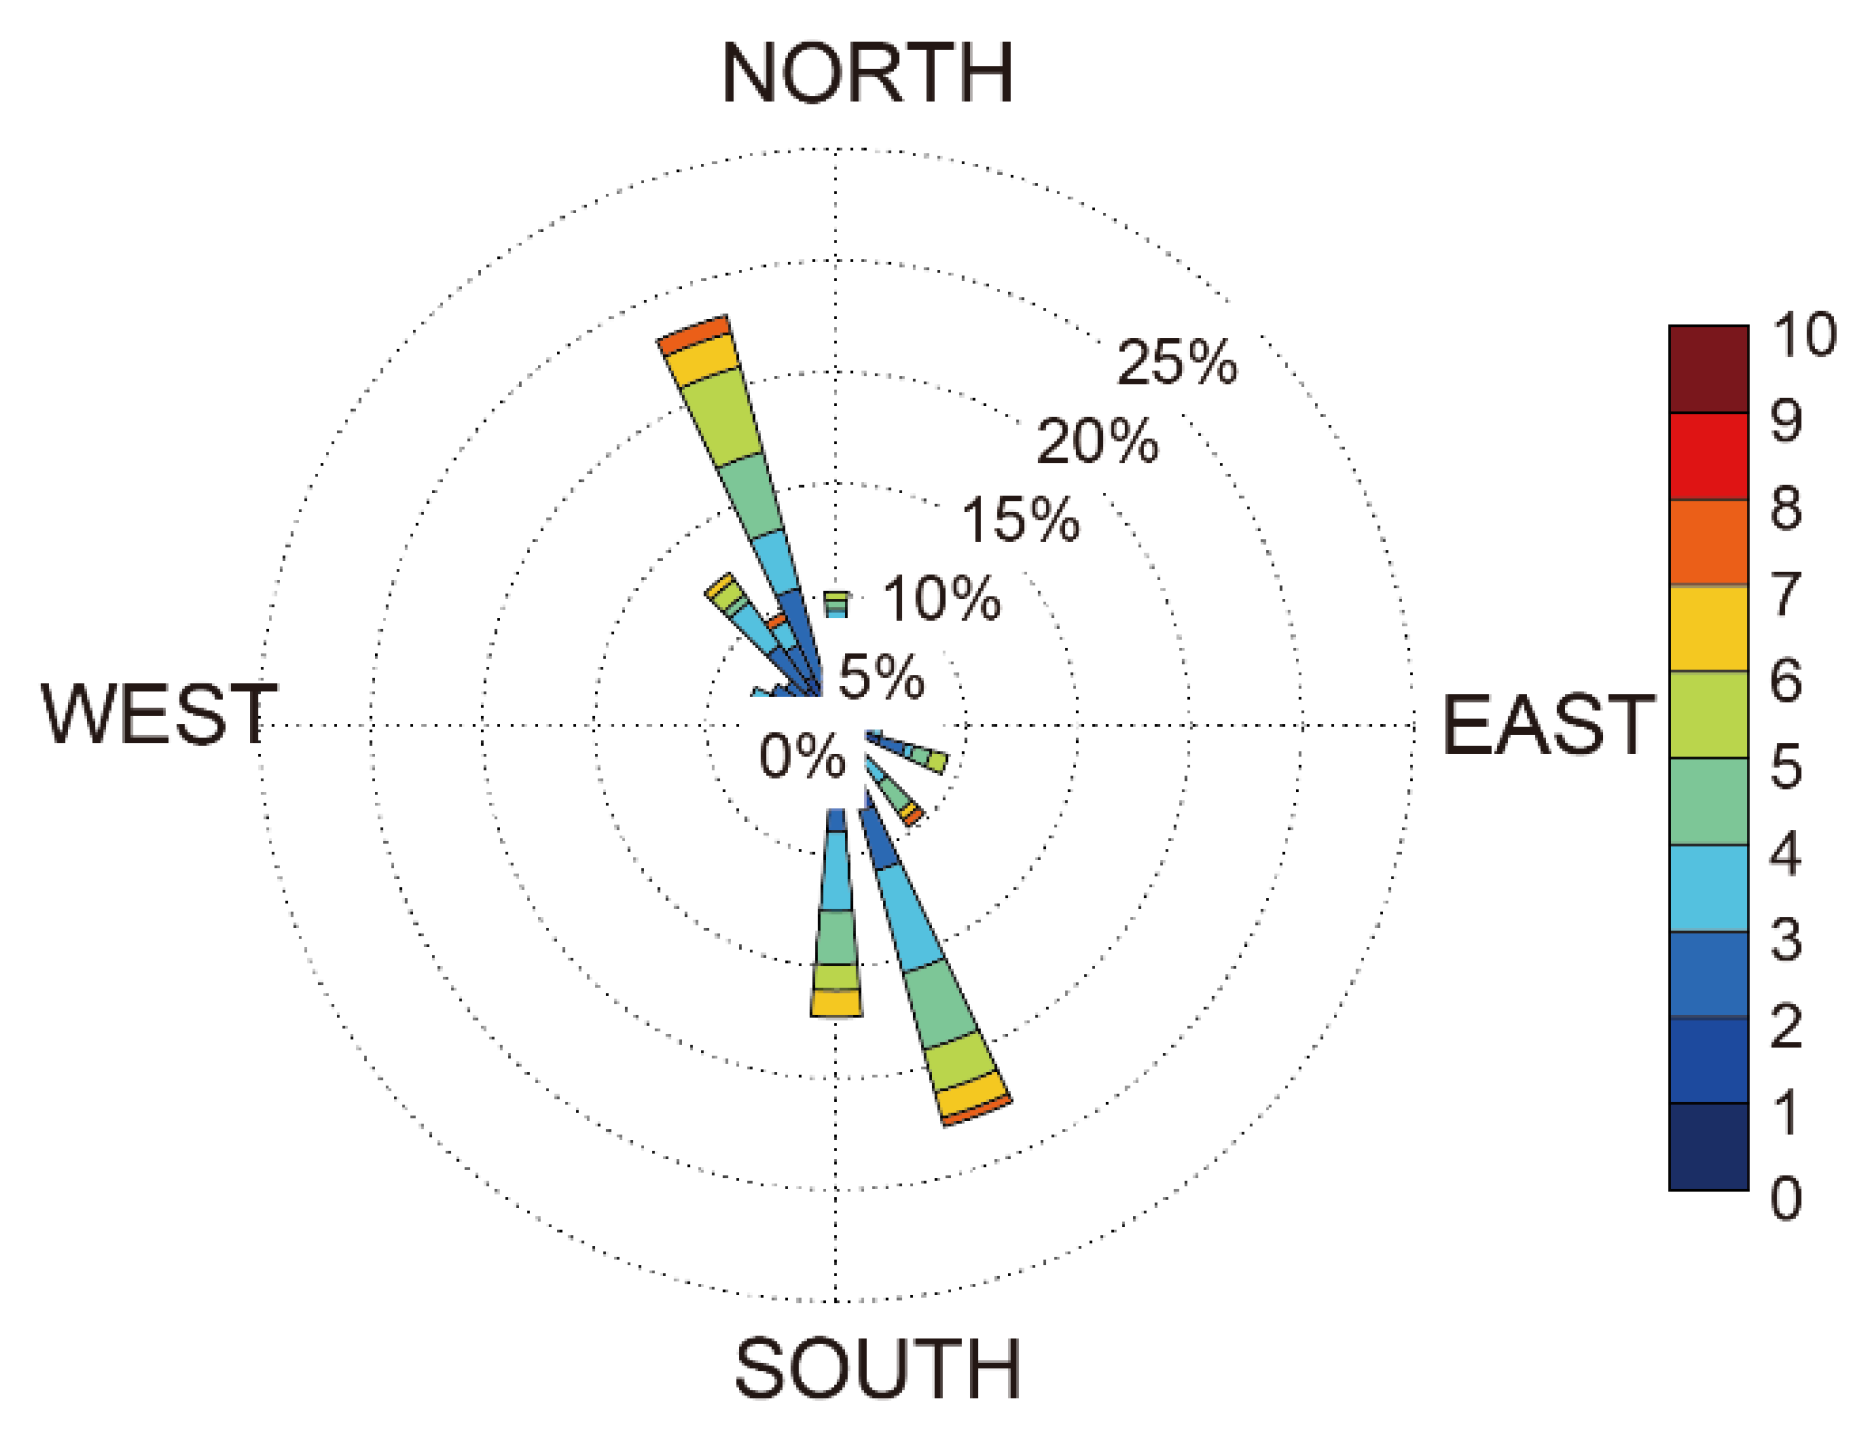
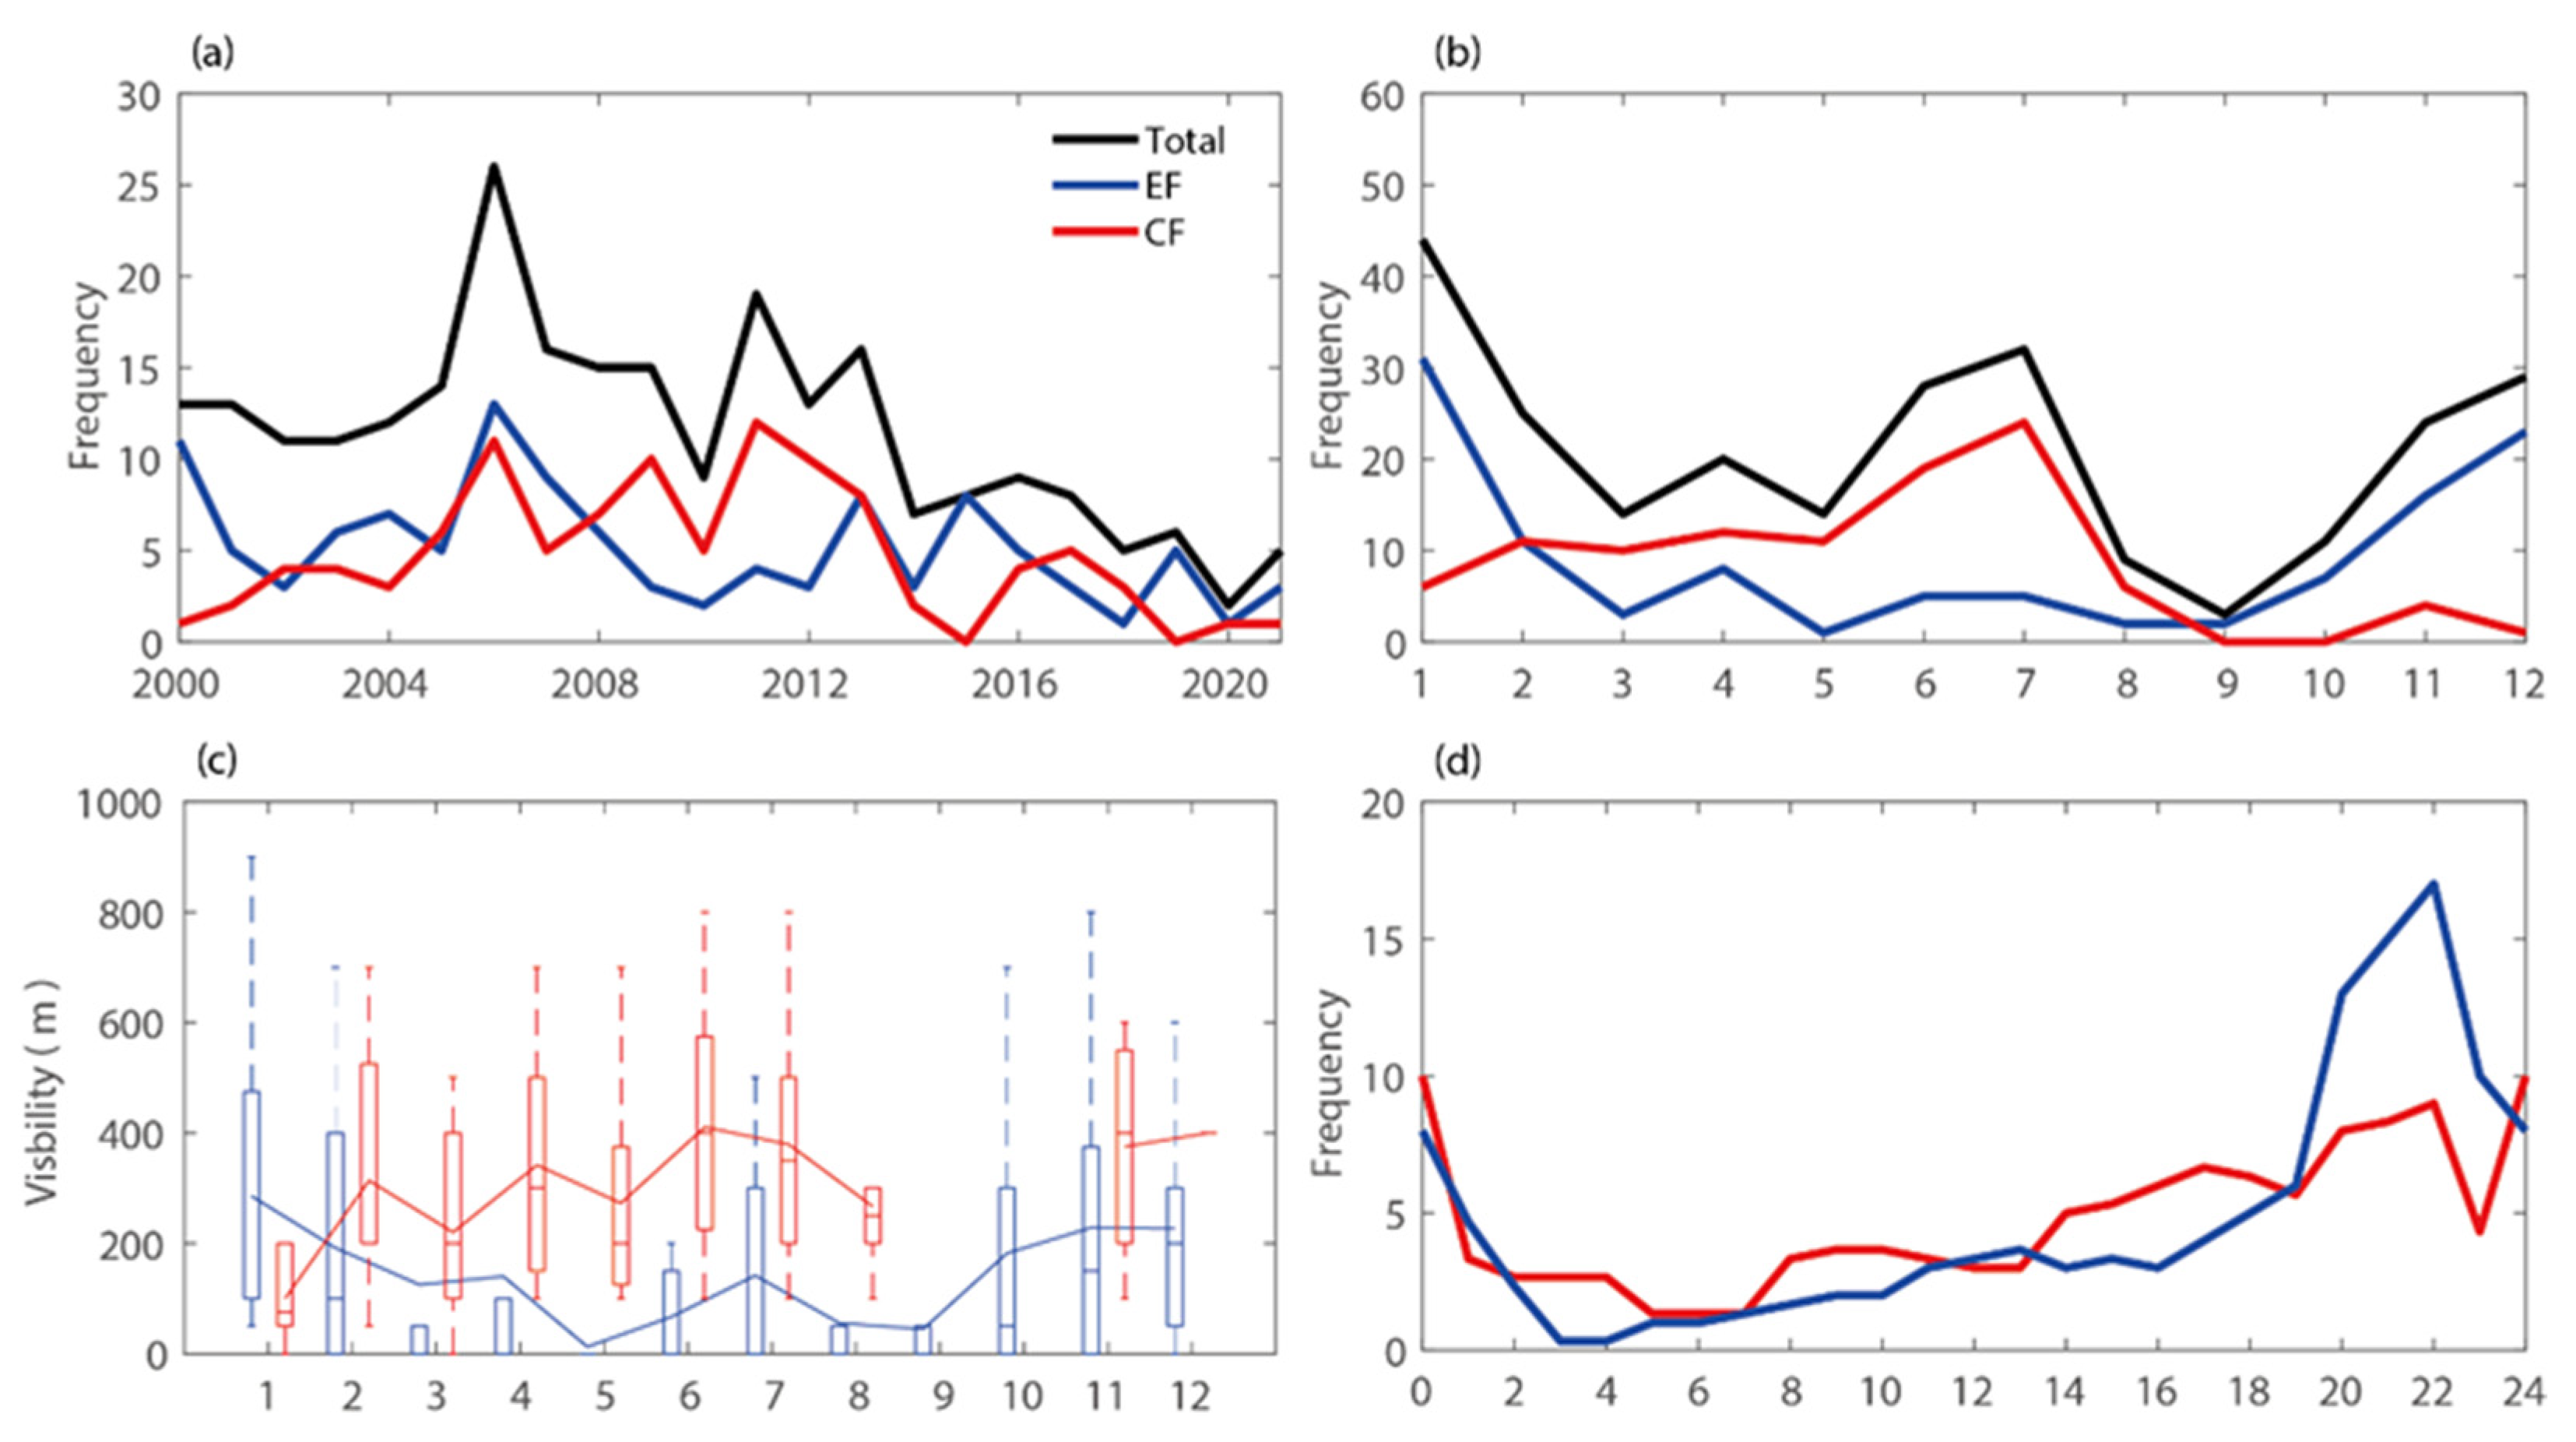
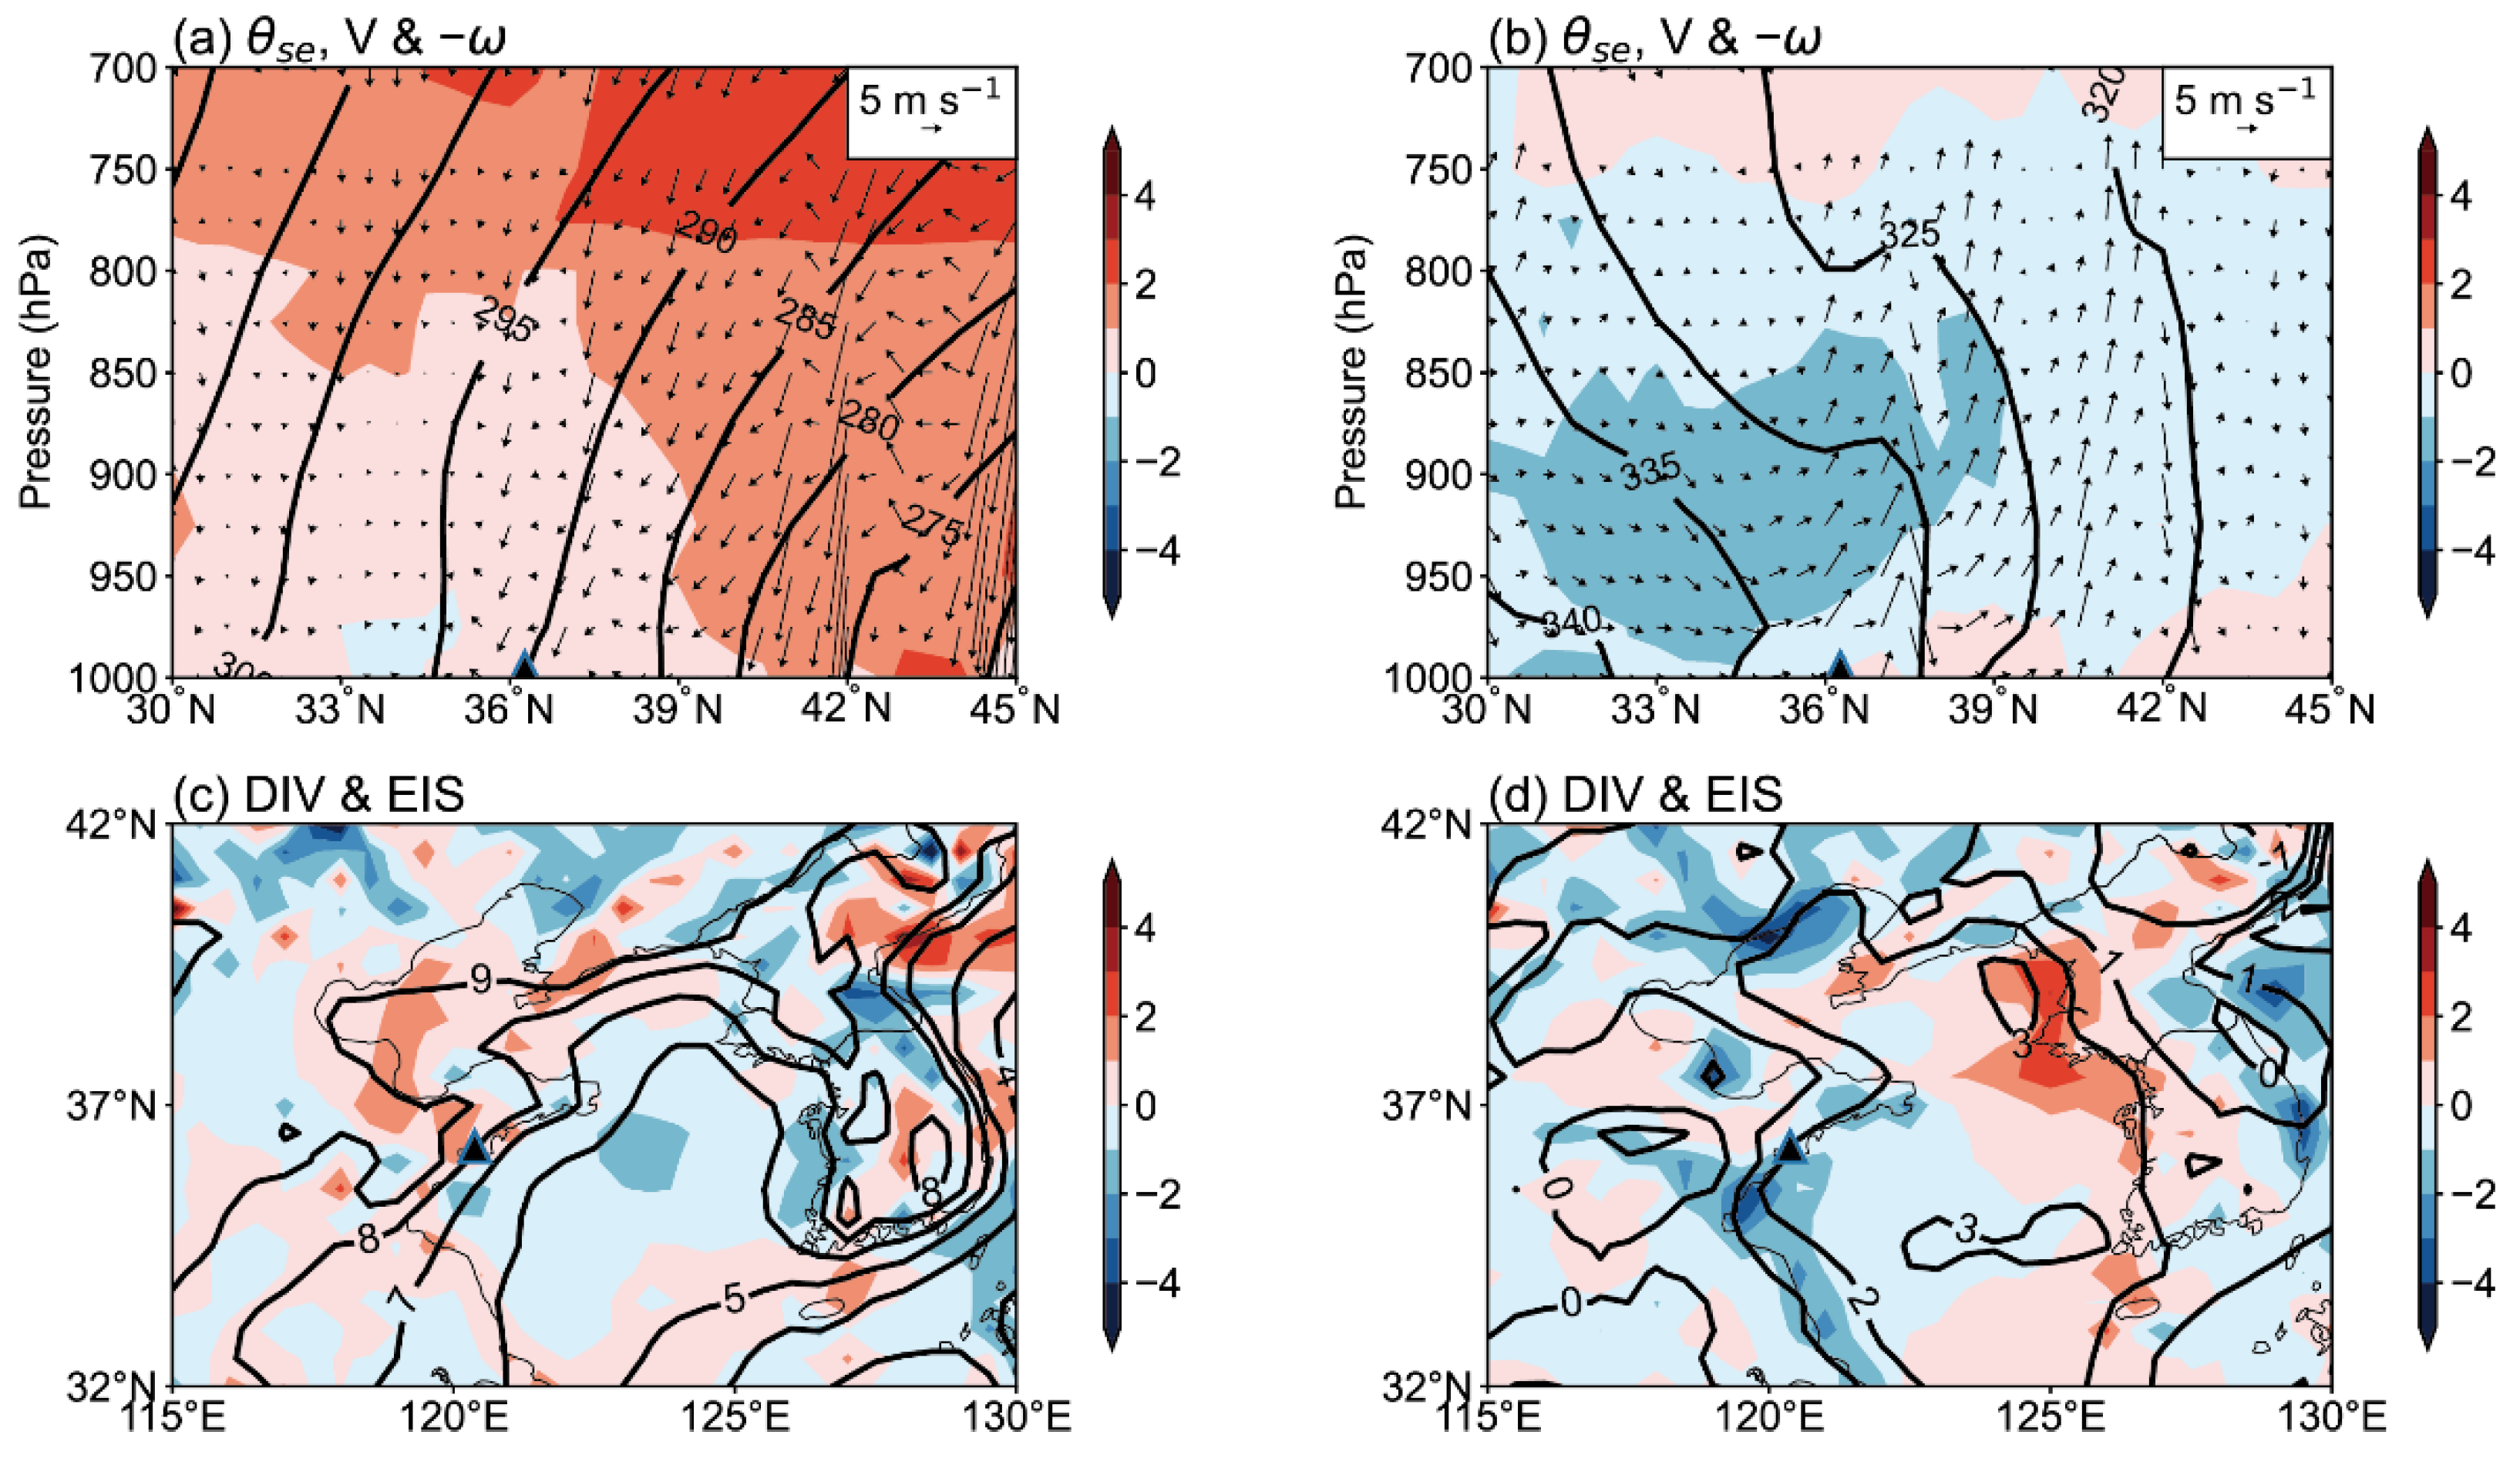
3.1. Fog Characteristics under Southeasterly and Northwesterly Winds

Wind regime is an important meteorological factor for fog formation and an important index for determining the fog type. The wind rose at the time of fog formation, which shows that fog mainly formed at Liuting International Airport under northwesterly wind and southeasterly wind, namely EF and CF with 114 cases and 104 cases, accounting for 45% and 41% of the total cases, respectively (Figure 2). Wind speed is generally small at the formation time, being less than 5 m s−1, and only 19 cases occurred when the wind speed was greater than 5 m s−1, accounting for 7.5% of the total cases.
The number of fog events shows significant interannual variation and seasonal cycles (Figure 3). The annual number of fog events (black line) presents a downward trend, with an average number of 12 cases per year (Figure 3a). The annual number reached the maximum of 26 cases in 2006 and only two cases in 2020. The EF and CF subgroups show downward and parabolic trends (blue and red lines, respectively), with an average of five cases per year. The maximum frequency of EF and CF reached 13 cases in 2006 and 12 cases in 2011, respectively. The seasonal cycle of total fog events presents a bimodal trend, with peaks in January and July (Figure 3b), respectively. The peaks reach 44 cases in winter and 32 cases in summer. It is worth noting that fewer fog events formed under the southeasterly wind in winter and northwesterly wind in summer, but the visibility was less when EF and CF formed in winter and summer, respectively (Figure 3c). Figure 3d shows the diurnal cycle of fog variation. The fog frequency gradually increases after 10 UTC (18 BST), peaks at 22 UTC (06 BST), and then decreases rapidly. The fog frequency is small from 02 to 10 UTC (10 to 18 BST), with fewer than 10 cases occurring. In summary, fog usually forms at night/early morning and dissipates within a few hours after sunrise.

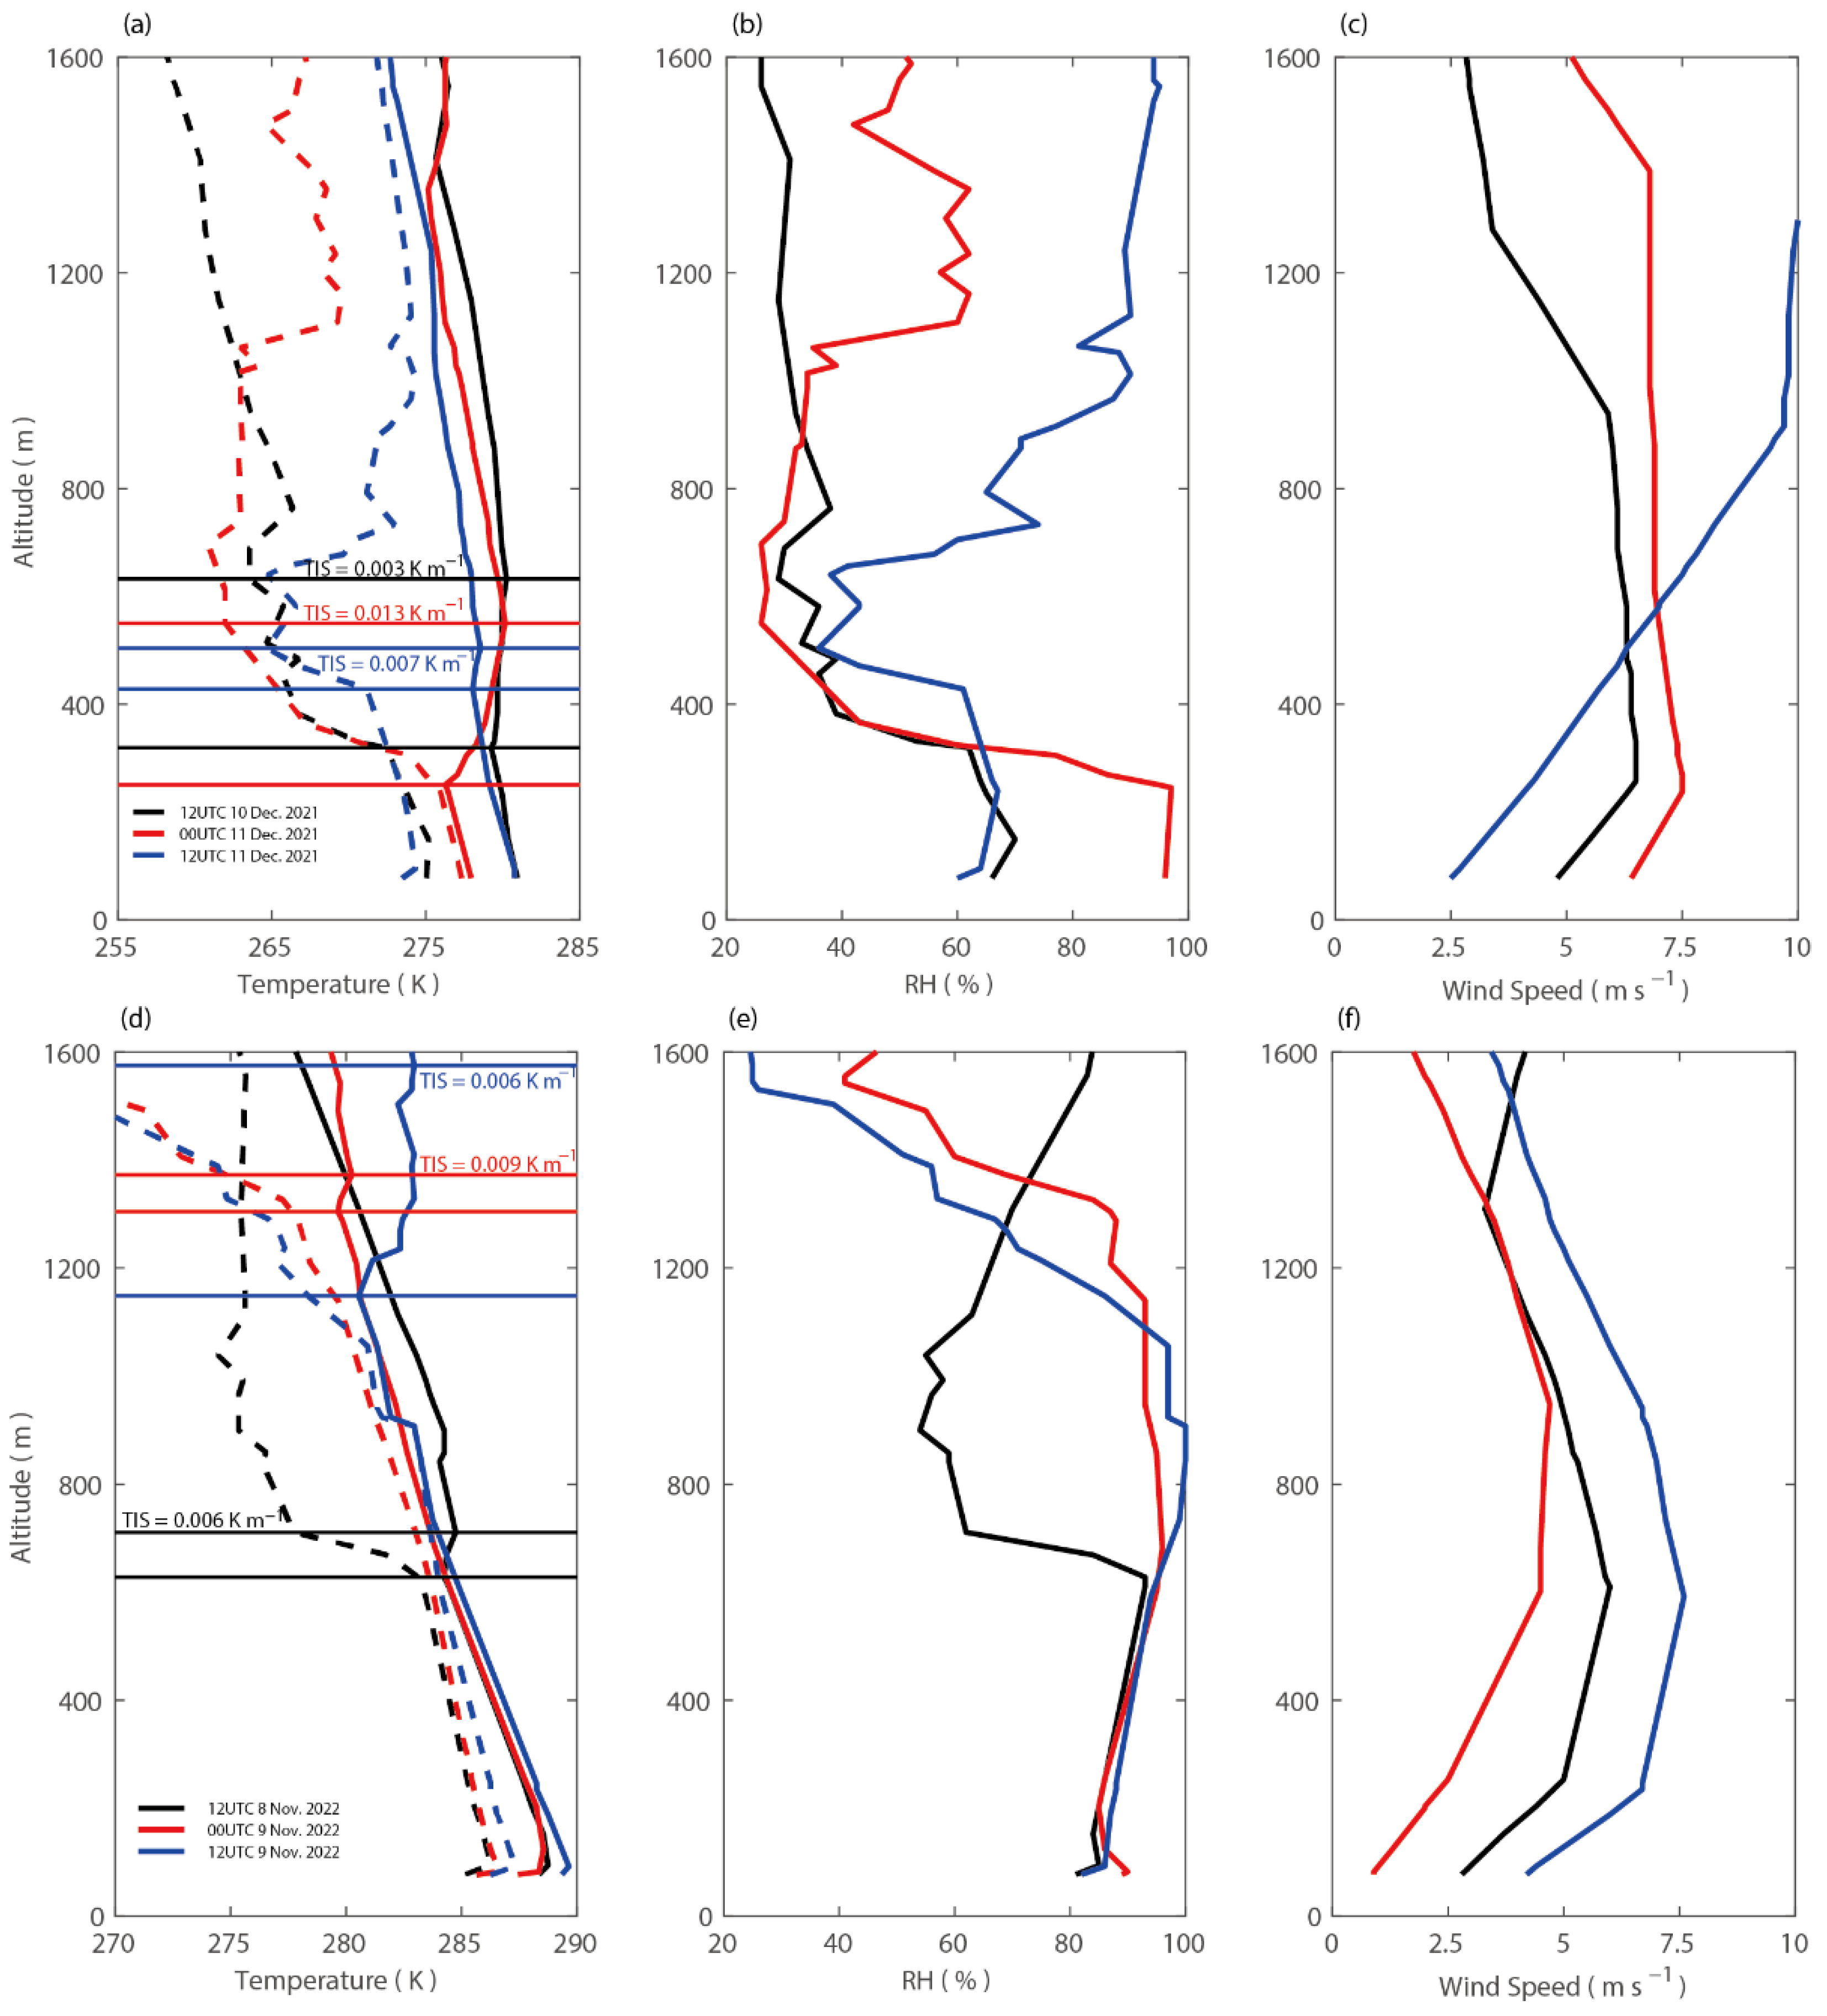
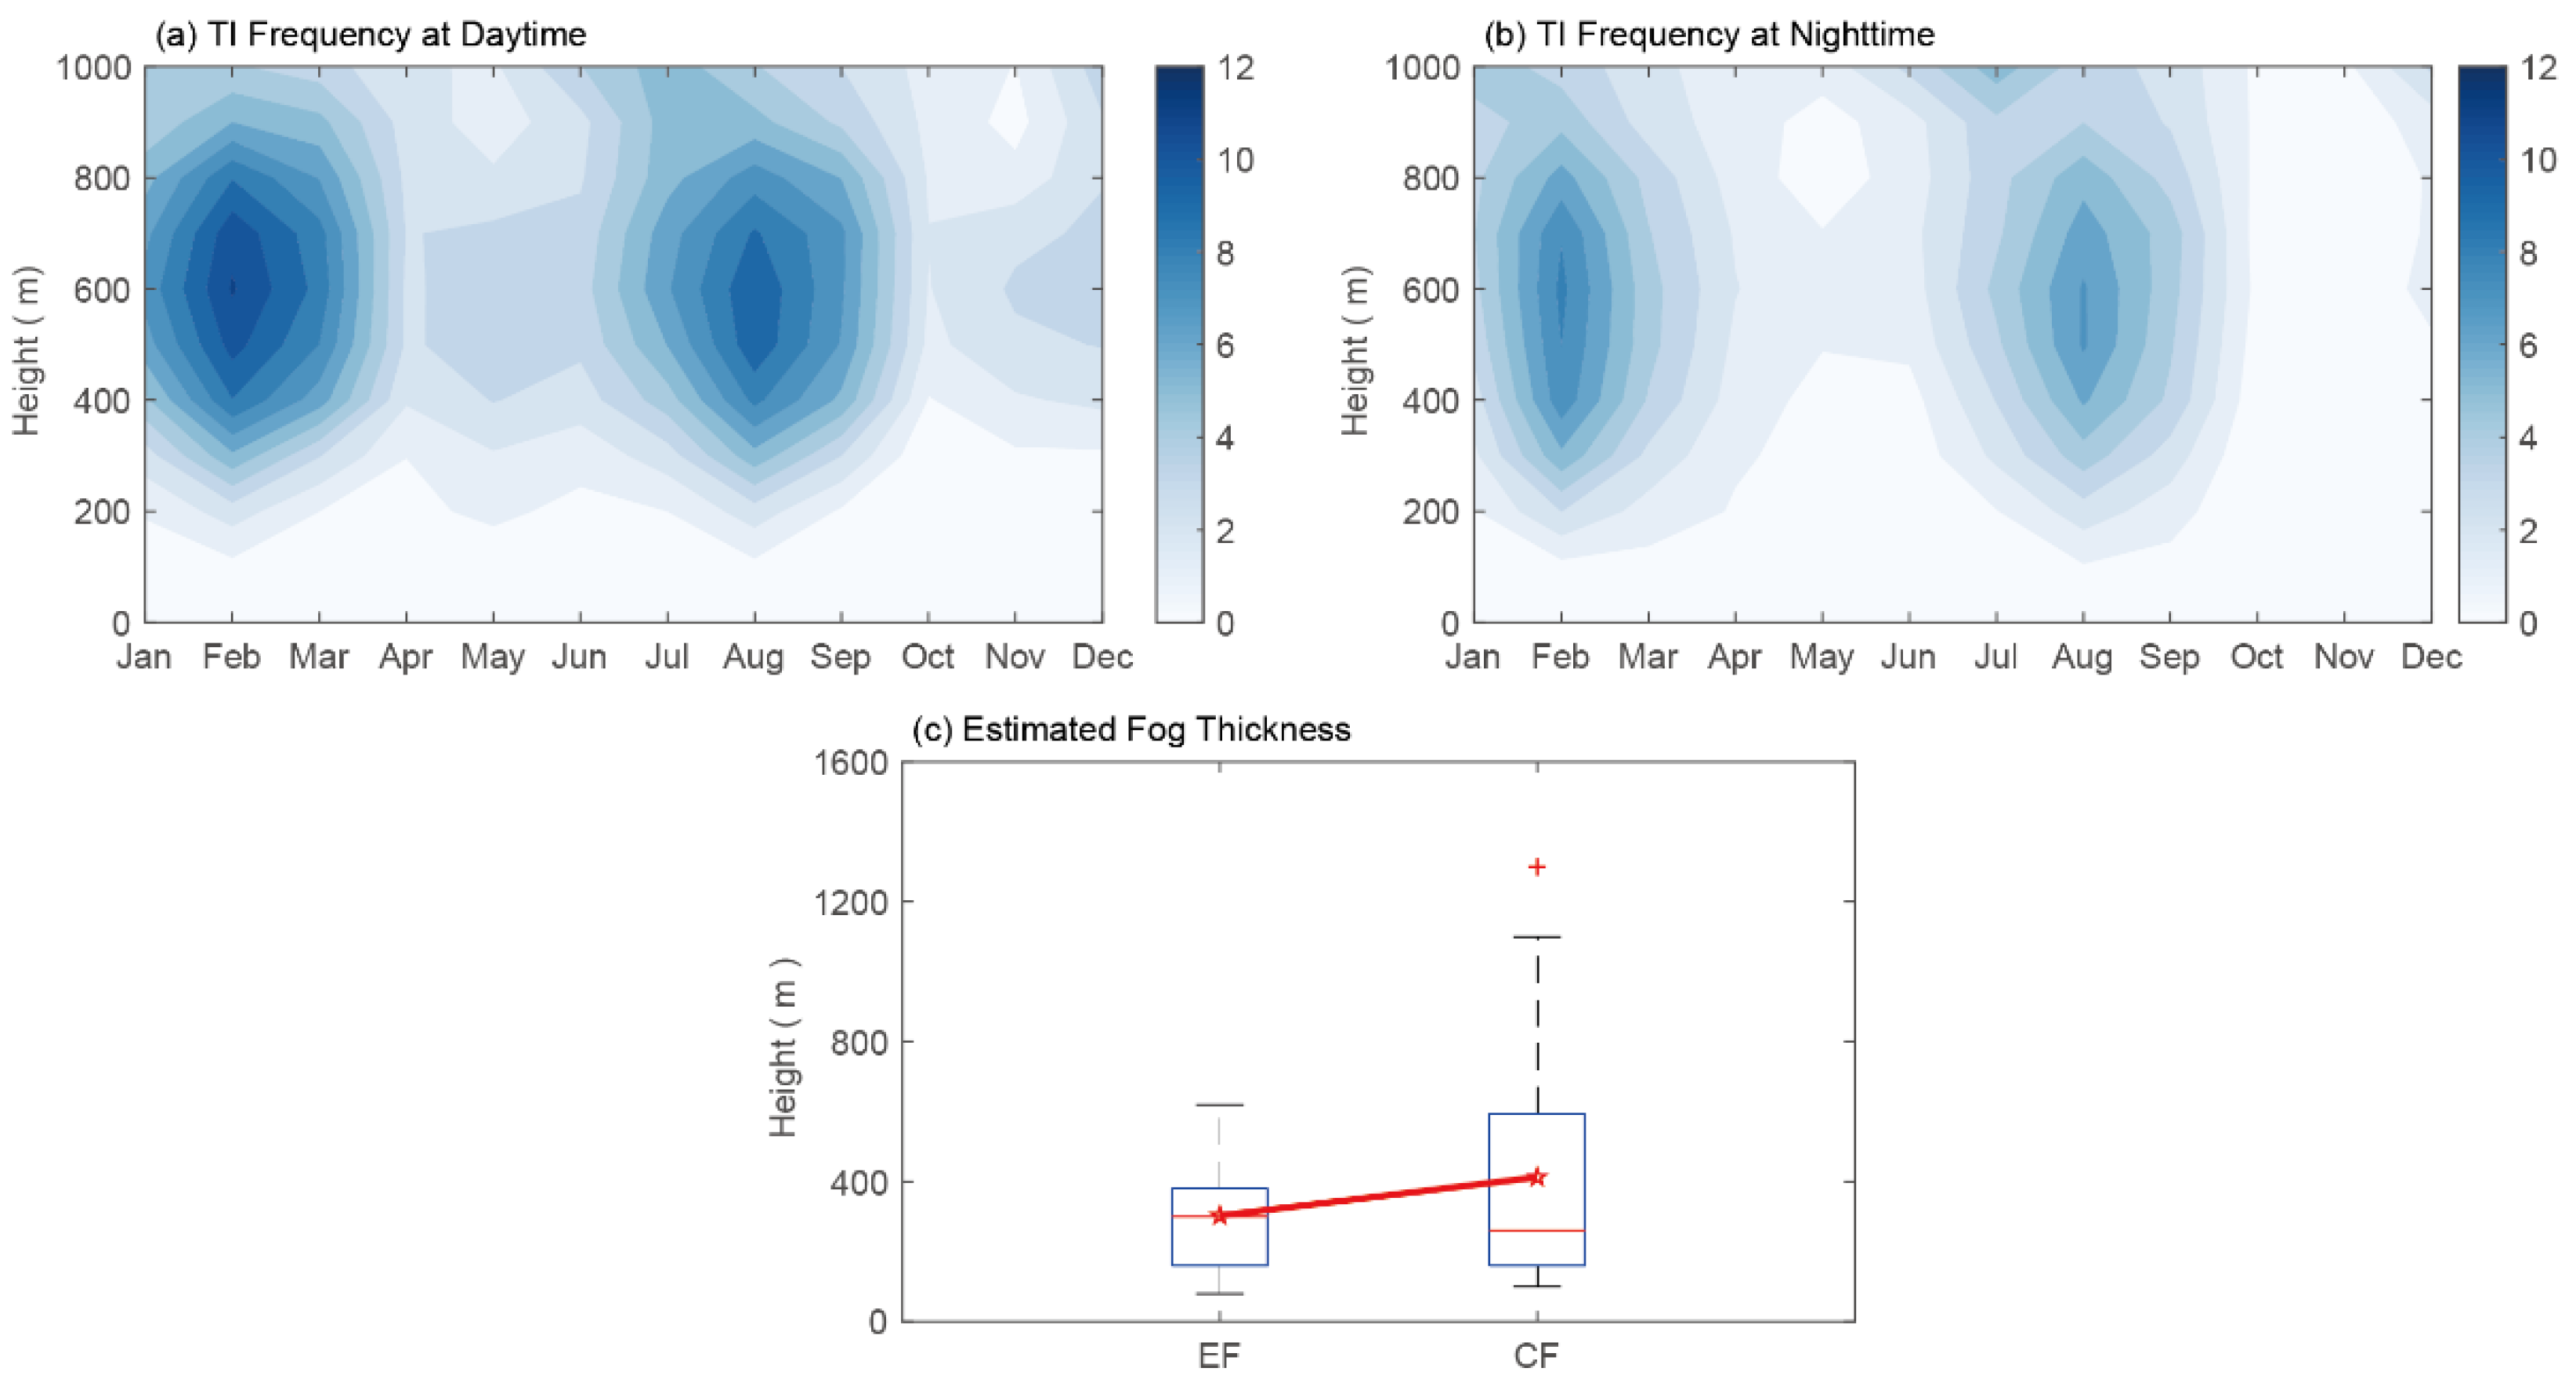
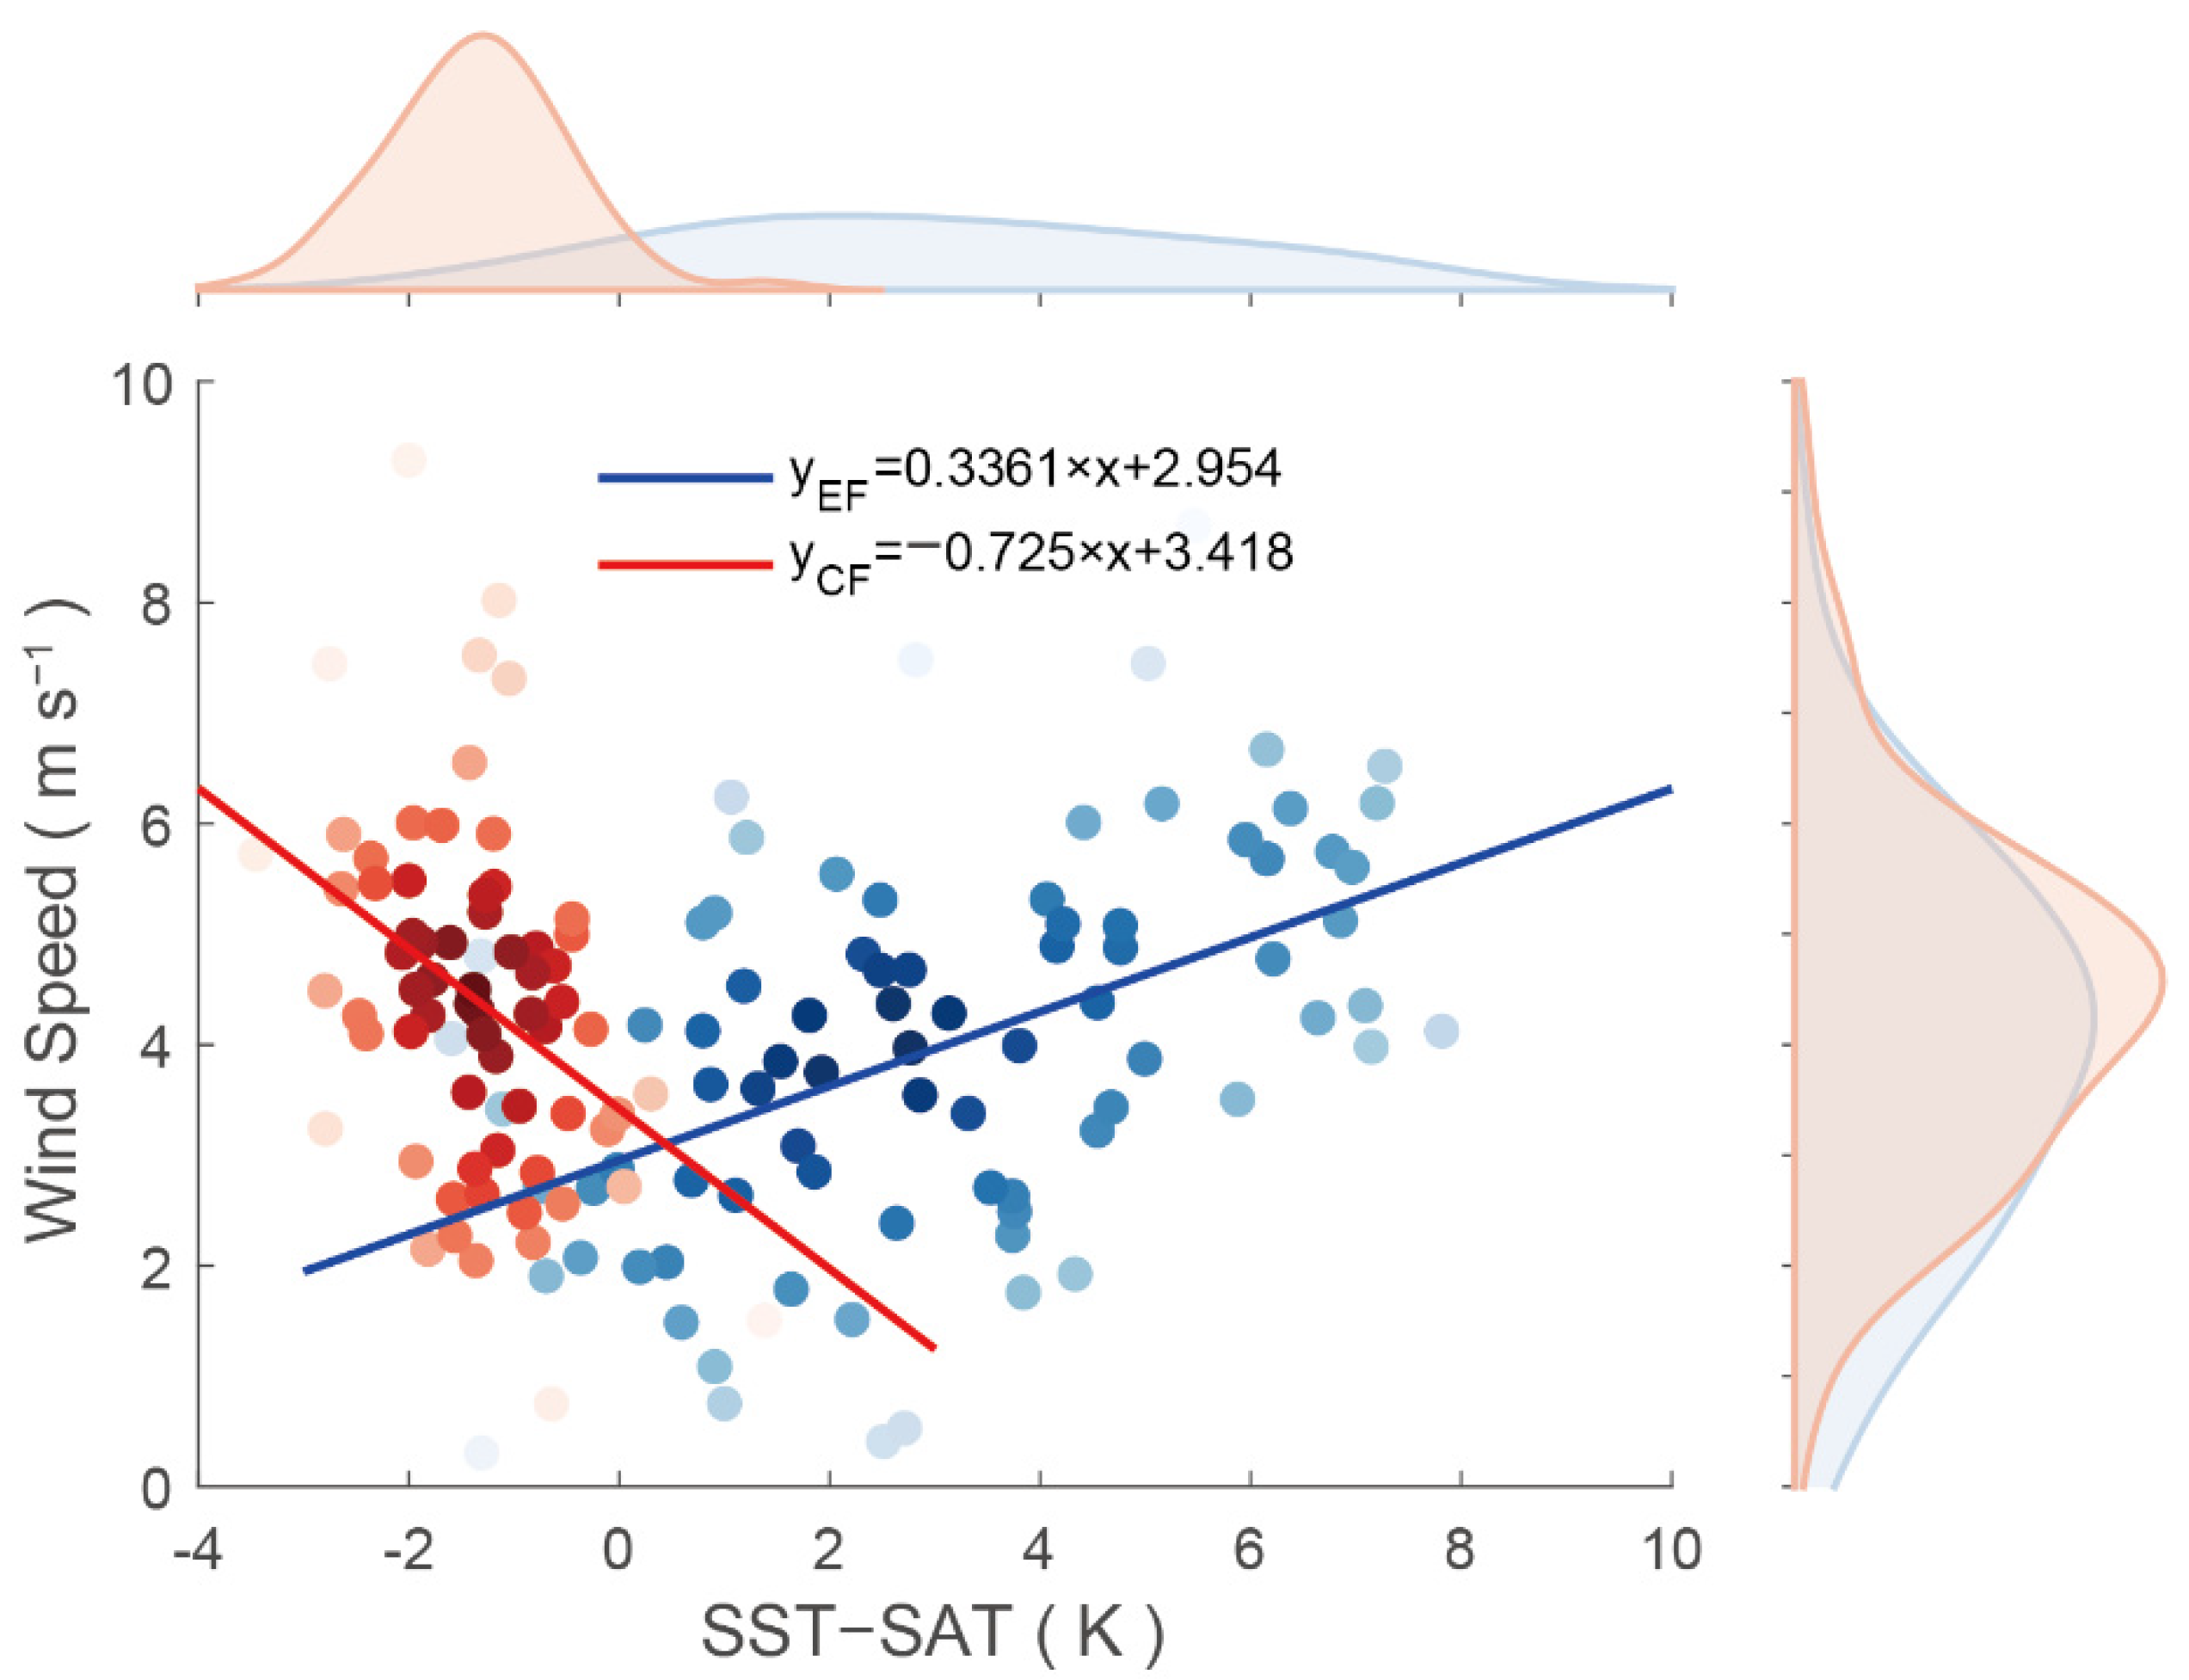
3.2. Why the CF Was Thicker Than the EF

Atmospheric stability and humidity are important factors for cloud and fog formation [29,30,31]. The formation of fog is closely related to atmospheric circulation as well as PBL structure. Previous studies have shown that there are significant differences in the vertical structures of low clouds and the PBL under different prevailing winds [25]. Then, what about fog thickness and PBL structure under different wind regimes? Are there significant differences between PBL structure on synoptic and climatic scales?
To compare PBL structure on a synoptic scale, Figure 4 shows two individual events of EF and CF observed at the airport on 10–11 December 2021 and 8–9 November 2022. All panels start at 00 UTC on the first day and end at 04 UTC on the second day. At both 00 UTC (08 BST) on day 1 (10 December 2021 and 8 November 2022), the airport was located in front of surface high pressure systems. EF and CF formed at 15 UTC (23 BST) on day 1, and the visibility was 1000 m and 900 m, respectively (Figure 4a). The minimum EF and CF visibilities were only 200 m and 100 m, respectively. With decreasing SLP, the wind speed basically remains at 2 m s−1 and 1 m s−1, and the wind direction remains northwesterly and southeasterly (Figure 4b–d), respectively. Visibility conditions below 200 m lasted for 8 h and only 1 h during CF and EF, respectively. Before fog formation, the temperature and dew point decreased continuously, and the difference between them was almost 0 K at the formation time (Figure 4e). The SLP, temperature and dew point all increased at 20 UTC (04 BST) when fog began dissipating (Figure 4a,b,e). For EF, the wind speed increased at the dissipation stage, and the wind direction remained northwesterly. The wind speed decreased at the CF dissipation stage, but the wind direction changed from southeasterly to northwesterly (Figure 4c,d).
Figure 5 shows the vertical profiles of temperature, dew point, RH and wind speed observed by sounding balloons at Qingdao station for the two cases at three different stages: prior to the event, during the event, and at the dissipation time, respectively. During the fog life cycle, they were both covered by TIs, and the vertical gradients of RH and wind speed indicated that the fog top height equaled the PBLH (Figure 5a–f). The TIS increased gradually in the process of fog formation. For EF, TIS increased from 0.003 K m−1 to 0.013 K m−1, while it increased from 0.006 K m−1 to 0.009 K m−1 for CF. TIS over EF was larger than that of CF, but EF thickness (270 m) was smaller than that of CF (1300 m). The RH in the PBL decreased rapidly from more than 95% to 60% after the dissipation of EF but almost did not change after the dissipation of CF. Before fog formation, weak vertical wind shear, about 1.1 and 3.0 m s−1 (Figure 5c,f), was favorable to the vertical mixing in the PBL and limited the fog top below TI base height. While at the dissipation stage of CF, there was a strong vertical wind shear at 0–900 m, about 7 m s−1, which led to strong vertical mixing. Moist air in the PBL broke through the TI (base height is 430 m) and moved to the middle atmosphere, which was not conducive to the maintenance of fog. For EF, the vertical wind shear did not change significantly, but wind speed increased about 5 m s−1 in the PBL, which was not conducive to the maintenance of fog.
In the two individual fog events, the TIS in the EF case was stronger than that in the CF case, but the fog thickness was smaller for EF compared to CF. Was this feature a general one in terms of multievent climatology? Composite analysis was used to study this question based on geopotential height, wind and RH at fog formation time (Figure 6). EF mainly occurs in winter and CF mainly occurs in summer (Figure 3), so 81 cases of EF under northwesterly wind and 66 cases of CF under southeasterly wind were composited during November to February and April to July, from 2000 to 2022, respectively. For both EF and CF, the airport is affected by northwesterly winds at 500 hPa, with RH below 40%, indicating that there are few or even no clouds in the middle and upper troposphere (Figure 6a,b). For EF (CF), the airport is affected by cold advection with northwesterly wind (warm and moist air with southwesterly wind from low latitudes) at 850 hPa and 925 hPa, with RH below (above) 50% (Figure 6c–f). Over the surface, the airport is located in front of the continental high when EF forms and is still affected by cold advection with northwesterly wind (Figure 6g). For CF, the airport is mainly located at the edge of the subtropical high and is affected by warm advection with southeasterly winds, with RH above 95% (Figure 6h). In summary, the middle and upper troposphere are both affected by cold and dry air when the EF and CF form, but the RH is still below 50% even at 925 hPa during EF conditions and is more than 60% up to 850 hPa during CF conditions. The vertical RH structure difference shows that air in the low troposphere is more humid during CF conditions than that of the EF.
The formation process and vertical structure of fog are also affected by atmospheric stability. Vertical motion and pseudo-equivalent potential temperature ( θ s e ) reflect the convective intensity and characteristics of atmospheric temperature and humidity. For EF, the airport is affected by downdrafts below 700 hPa, and the   θ s e increases with a positive vertical gradient, indicating stable low troposphere (Figure 7a). Weak updraft, reaching more than 700 hPa, and negative vertical gradient of θ s e indicates weak unstable or neutral PBL when CF forms (Figure 7b). When CF forms, weak updrafts and moist conditions indicate thicker PBLH. Therefore, the CF was thicker.
TI affects the entrainment-mixing in low clouds/fog and has a significant impact on low cloud/fog formation processes [23,32,33]. Estimated inversion strength (EIS) is used to represent the TIS [34]:
E I S = L T S Γ m 850 ( Z 700 L C L ) ,
where LTS is the lower troposphere stability, defined as the difference in potential temperature between 700 hPa and the surface. Γ m 850 is the moist adiabatic lapse rate at 850 hPa, and Z700 is the altitude at 700 hPa. LCL is the lifting condensation level. Larger EIS indicates stronger TI. For EF, the EIS around the airport is approximately 7–9 K but is 1–2 K for CF (Figure 7c,d). Differences in EIS show that the TIS of EF is larger than for CF.

3.3. Formation Mechanism and Diurnal Variation of Fog

Studies have shown that fog formation over the YS is affected by sea–atmosphere interactions, and the local SST is one of the main driving factors [10,15]. Due to Liuting International Airport’s location in the coastal area of Qingdao city, sea–land–atmosphere interactions can influence EF and CF formation, and local SST must be a driving factor for coastal fog formation.

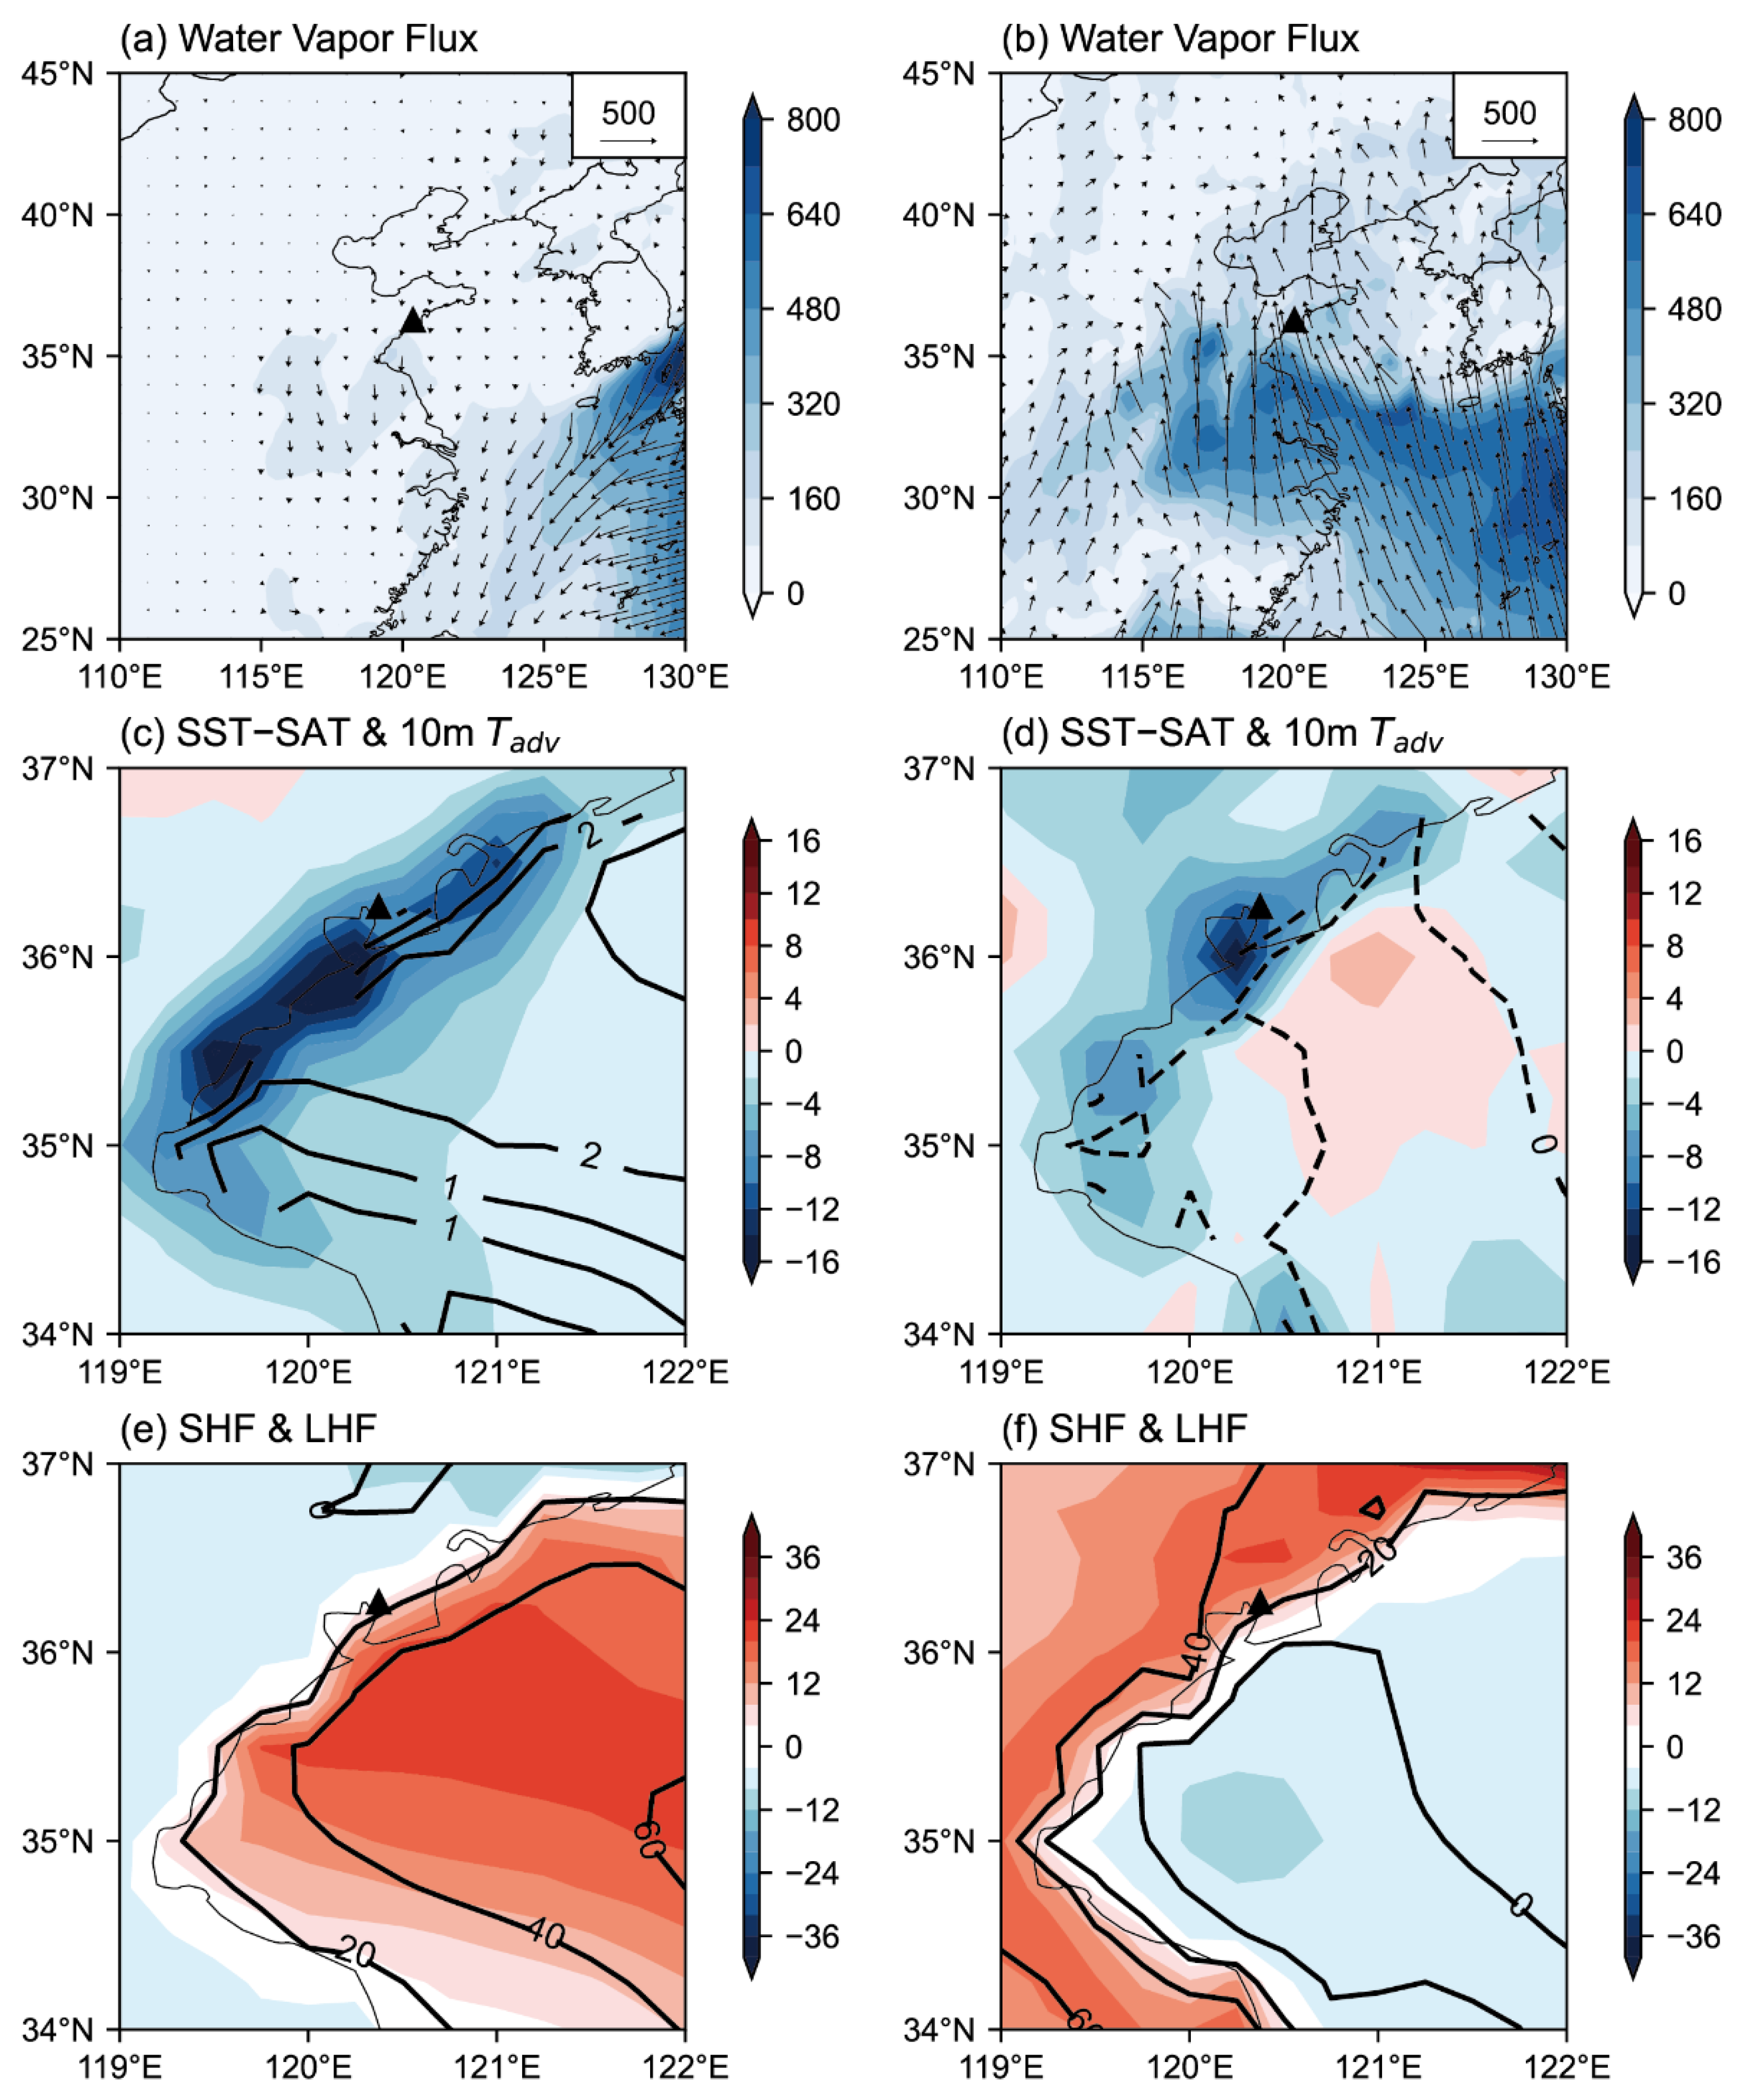
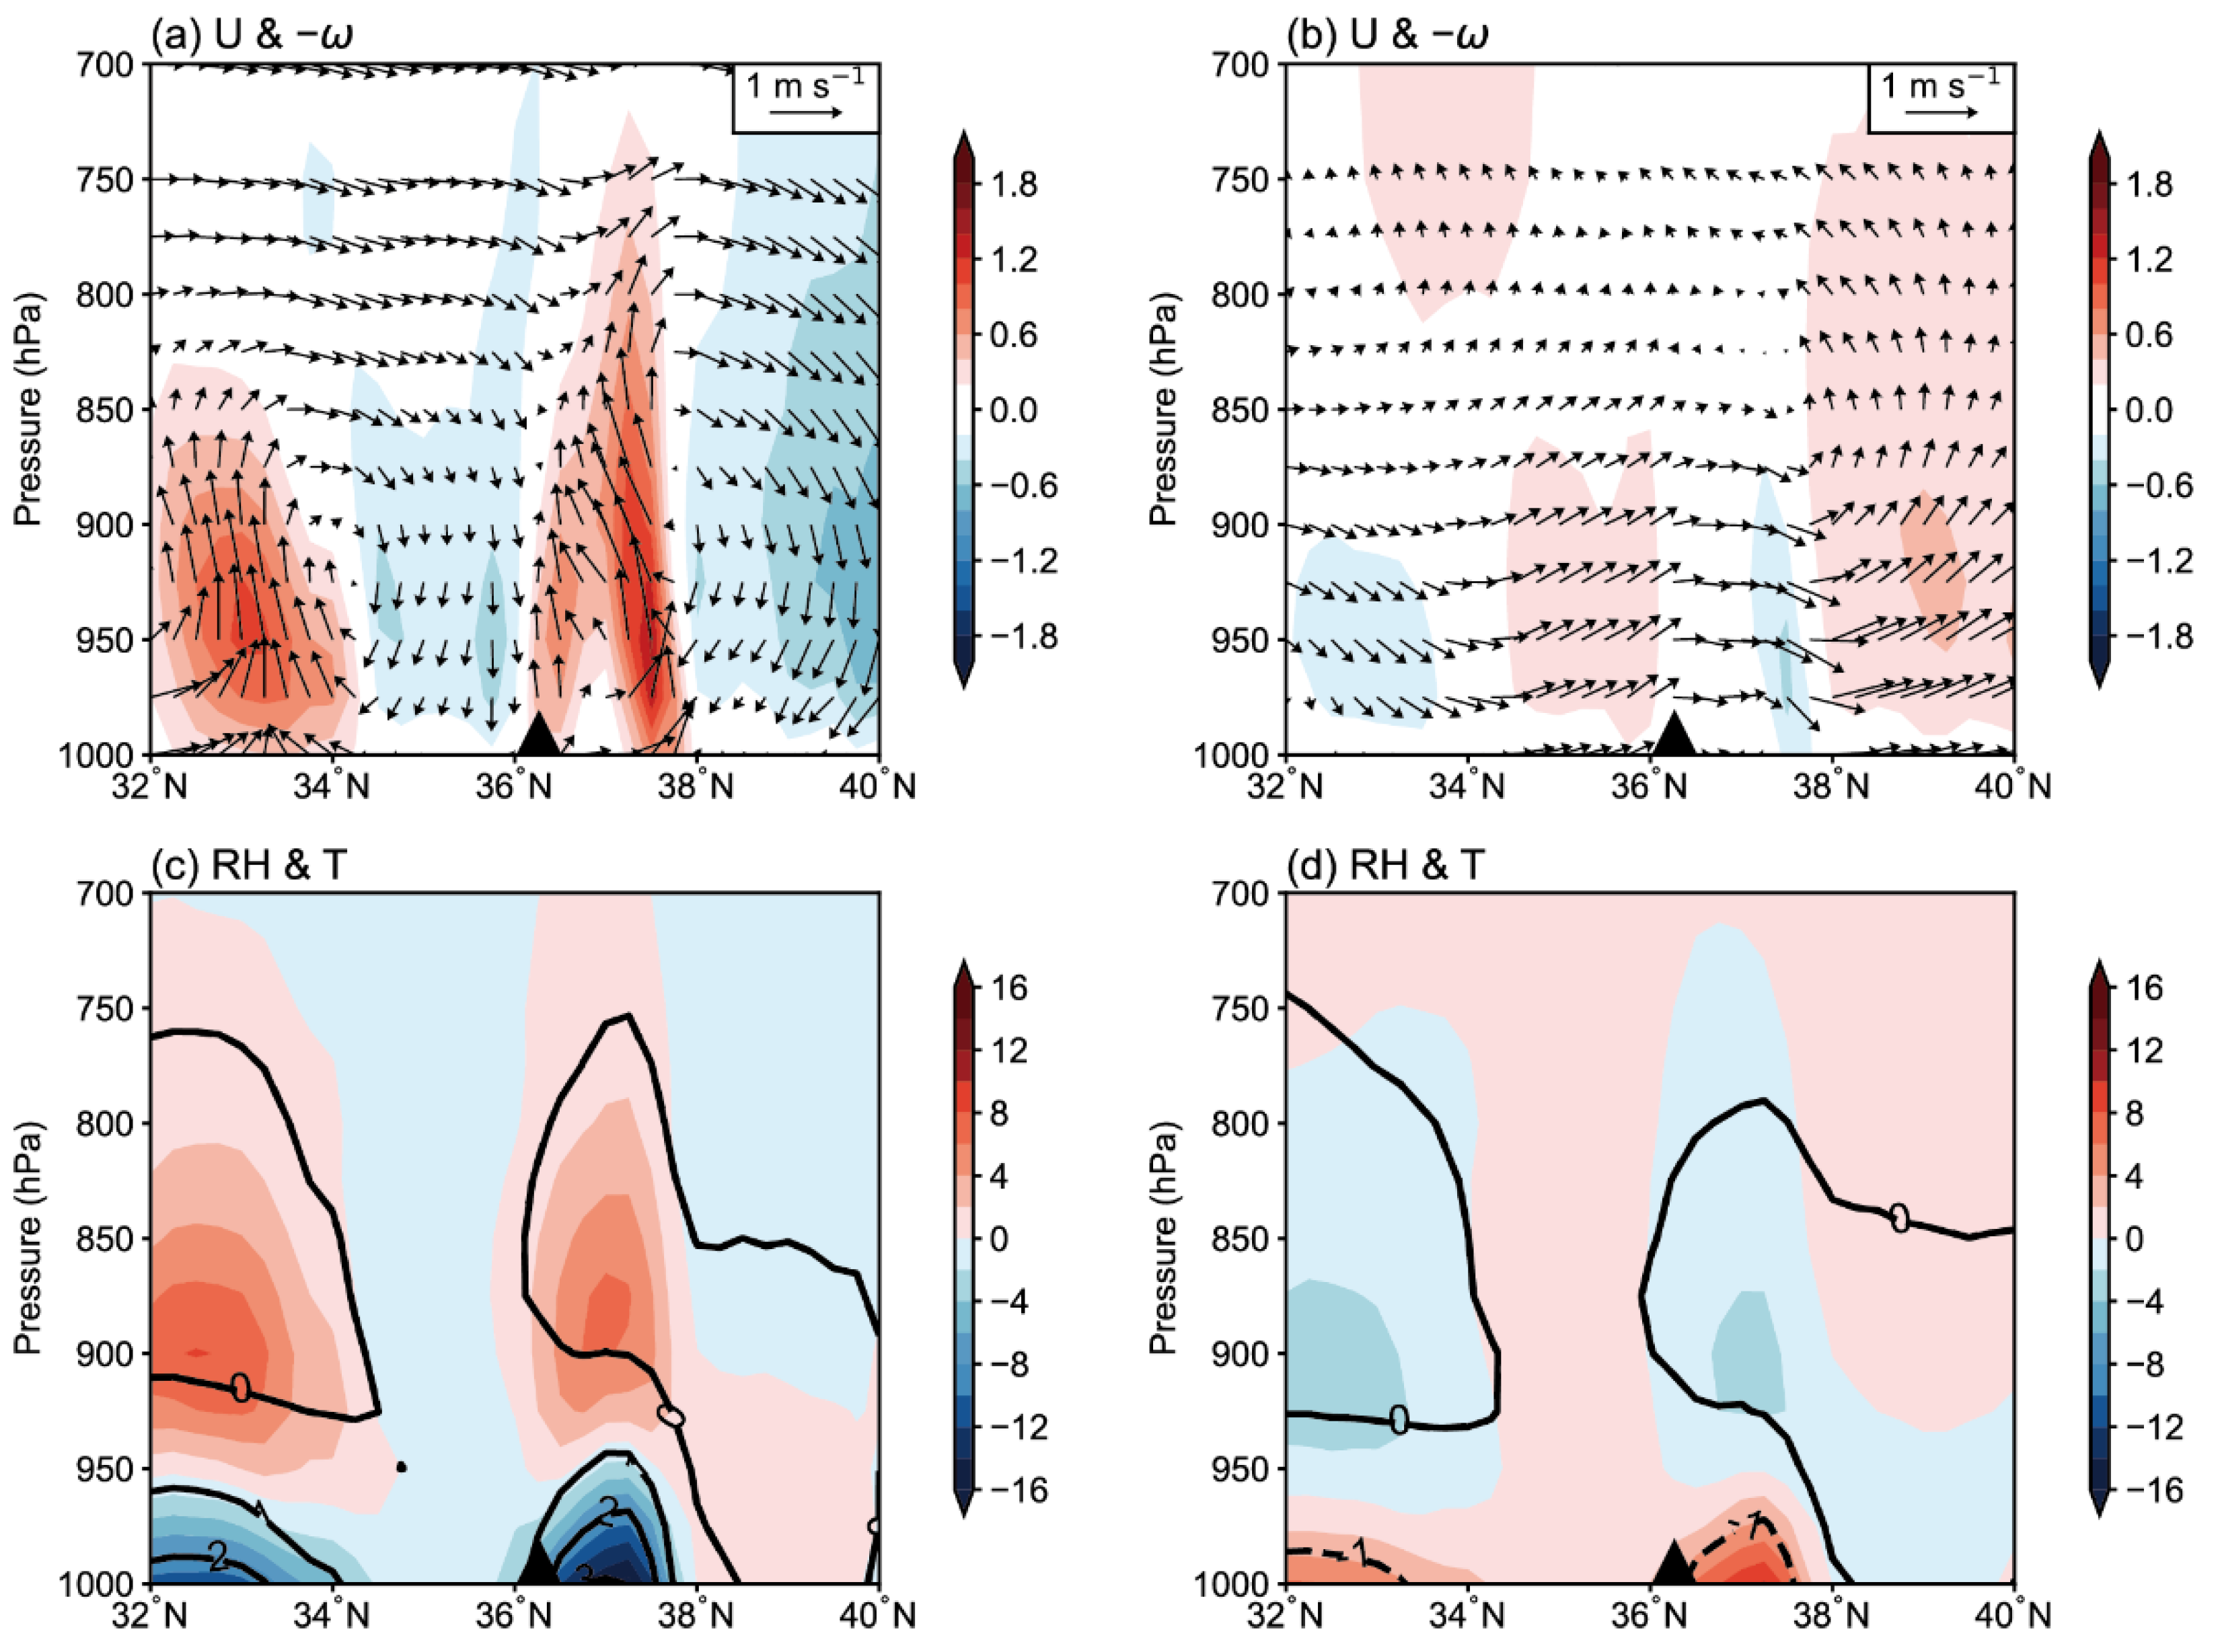
3.3.1. Moisture Source Is Affected by Surface Heat Flux and Advective Transport

Fog formation requires sufficient water vapor. Dry and cold air is advected to the Qingdao coastal area along with northwesterly wind at the EF formation time, while moist and warm air is advected to the airport from low latitudes along with southeasterly wind at the CF formation time (Figure 8a,b). For EF, the coastal area of Qingdao is affected by cold advection, with a positive SST−SAT value, indicating that heat flux is upward, from sea to atmosphere (Figure 8c). For CF, the coastal area is affected by warm advection with negative SST−SAT, indicating atmosphere-to-sea heat flux (Figure 8d). Surface wind circulation also shows opposite characteristics. Surface wind diverges when EF forms, while converges when CF forms (Figure 7c,d). SHF and LHF are small or even negative over land, and the moisture mainly comes from water vapor released from the YS (Figure 8e). In contrast, the CF air is warmer than the YS water, with downward heat flux (Figure 8f). Moisture mainly comes from the long-distance transport of low-latitude warm air and local land transpiration. In summary, EF forms with surface cold advection and positive SST−SAT value; moisture mainly comes from upward surface flux of the YS. CF forms with surface warm advection and negative SST−SAT value; moisture mainly comes from transport of low-latitude air and local land transpiration. Warm SST promotes EF formation through vertical mixing of strong turbulence, while cold SST promotes CF formation through strong turbulent cooling.
The regional mean SST−SAT and formation time wind speed in the area (120.25–120.5° E, 35.5–36.25° N) around the airport are selected to check whether EF and CF are affected by local SST (Figure 9). For EF, SST−SAT is mainly in the range of 0–8 K, negatively correlating with wind speed. For CF, SST−SAT is mainly in the range of −4–0 K, positively correlated to wind speed. Wind speed of the two types of fog is mainly in the range of 2–7 m s−1, and the difference between them is small. The difference between SST and SAT indicates that heat and water vapor exchange at the sea–air interface are completely opposite at the formation time, which confirmed that local SST is a dominant factor in fog formation.

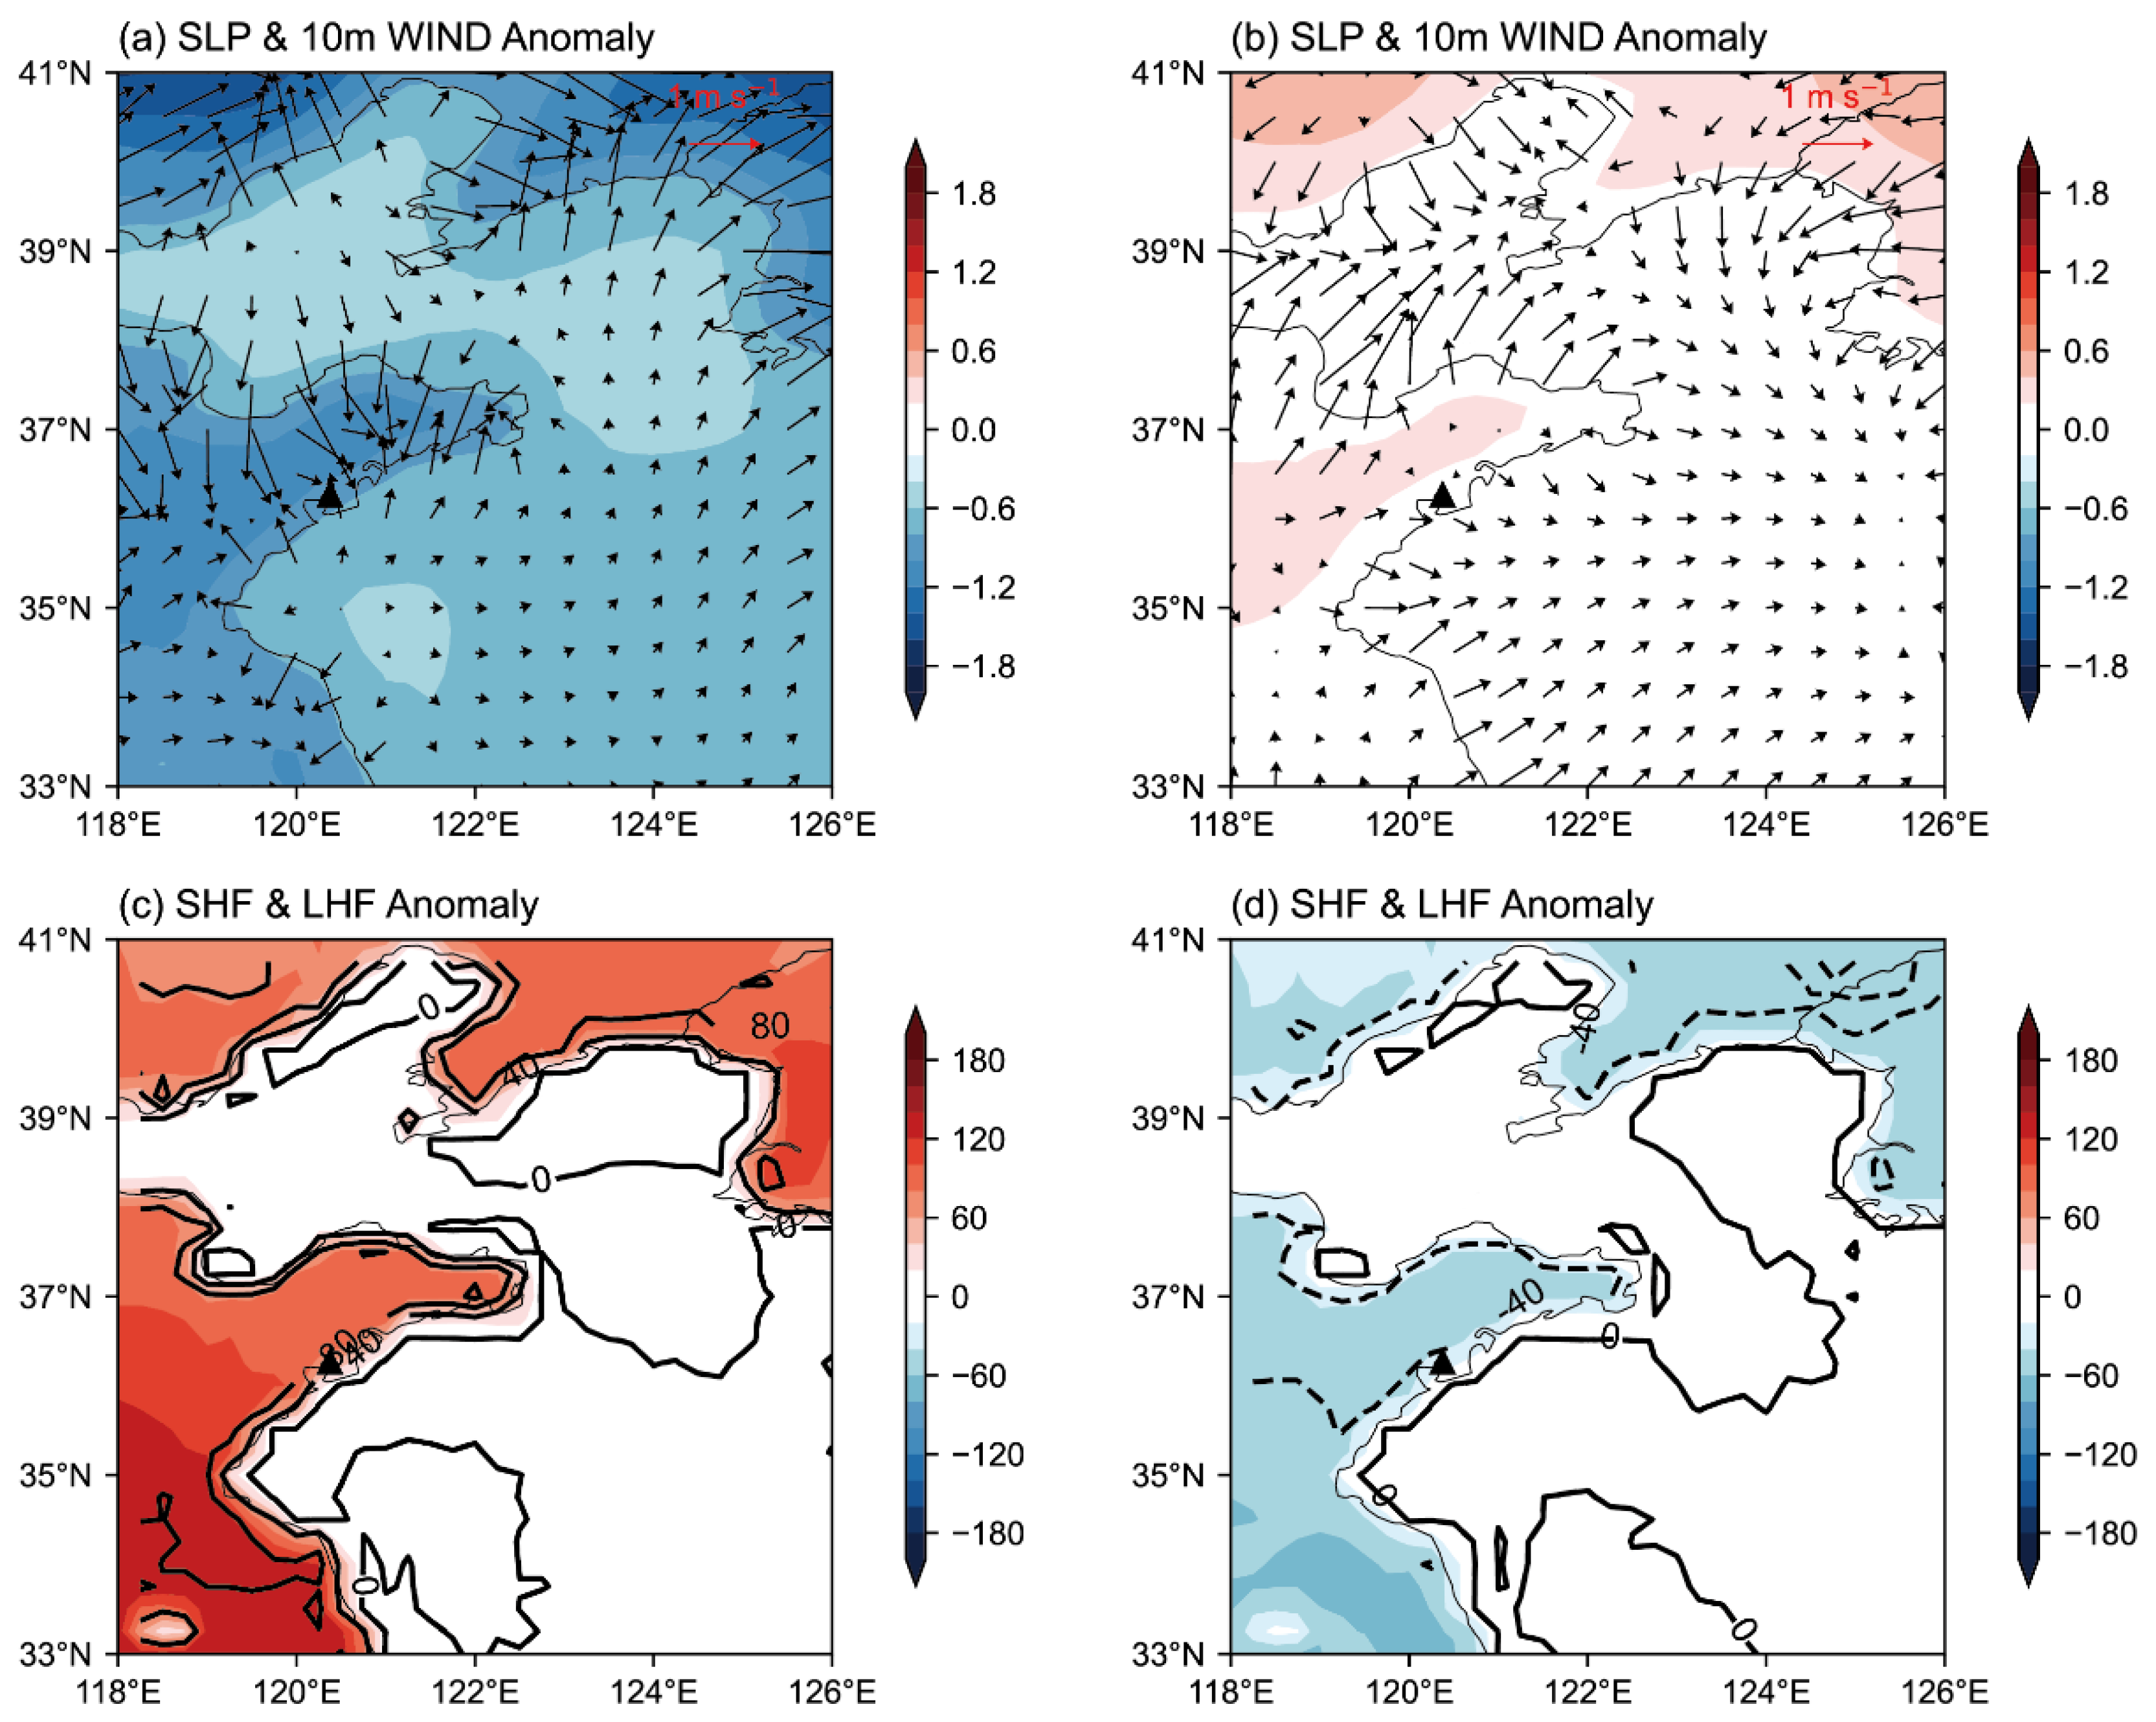
3.3.2. Night/Early Morning Fog Formation Mechanisms

Land–sea breeze is a typical coastal mesoscale system and influences fog formation. The influence of land–sea breezes on fog is analyzed using SLP, surface wind and heat flux at 06 and 18 UTC (14 and 02 BST) minus their daily means (Figure 10). During the daytime, the Shandong Peninsula is affected by low surface pressure, and the surface wind converges on the south coast due to the pressure gradient (Figure 10a,b). While at night the Shandong Peninsula is affected by weak high pressure, the surface wind diverges on the south coast. Therefore, the airport is affected by sea breezes during the day, while it is affected by land breezes at night. The diurnal differences in SHF and LHF over the YS are small and negligible, while there is significant diurnal variation over land, indicating that fog is significantly affected by land–atmosphere interactions (Figure 10c,d). During the daytime, the heat flux anomaly over land is positive and reaches more than 80 W m−2, indicating that heat and water vapor are released from land to the atmosphere, while the opposite occurs at night. Surface wind divergence and downward heat flux indicate a more stable PBL at night, which is conducive to fog formation.
Figure 11 shows the vertical cross sections of meridional−vertical circulation, RH and temperature anomalies along 120.5° E. During the daytime, air over land is affected by updrafts below 700 hPa, up to 0.02 Pa s−1, while the opposite occurs over the YS (Figure 11a). At night, air over land is affected by a weak PBL downdraft and a weak updraft over the YS (Figure 11b). The RH is also different due to the land–sea breeze influence. Moist air forms low clouds under the influence of updrafts in the daytime, while large RH anomalies are observed below 950 hPa at night (Figure 11c,d). Weak downdraft and large RH in the PBL are conducive to fog formation at night.

4. Discussion

Studies have shown that the radiative process plays an important role in fog formation [1,14]. Is the radiative process a dominant factor in fog formation at Qingdao Liuting International Airport? Based on sounding data at Qingdao radiosonde station from January 2000 to December 2022, diurnal distribution of the TI below 1000 m is studied [27]. TI occurs mainly in February–March and August–September below 800 m, with a maximum frequency of 11% at daytime and 8% at nighttime (Figure 12a,b). Diurnal difference in TI frequency is not significant, which shows that the dominant factor of fog formation along Qingdao coast is not the radiative process but temperature advection and the sea–land–atmosphere interaction process. Previous studies also showed that advection fog mainly occurs around islands, coastal areas or inland areas near large lakes [35]. We estimated fog thickness based on sounding data and found that average CF thickness is larger than EF thickness, which is consistent with ERA5 data (Figure 12c).
Abundant studies have analyzed the formation process and characteristics of fog over the YS based on satellite, buoy and ship observation data [10,15,16], but few studies have focused on coastal fog mechanisms. This study found that there are significant differences in the EF and CF characteristics at Liuting International Airport (Table 1). Local SST is one of the drivers of both EF and CF, but the characteristics and formation mechanisms of these two types of advection fog are different. This study is helpful for revealing the local SST influence on the PBL structure and fog formation mechanism along the north coast of the YS and for understanding differences in EF and CF. The results are helpful for improving the understanding of sea fog and could promote numerical prediction techniques at the airport. However, more observations and model simulations are needed to study the fog vertical structure and microphysical characteristics.

5. Conclusions

Based on surface observation, sounding and ERA5 reanalysis data, this paper studied the characteristics, formation mechanism and PBL structure of fog at Qingdao Liuting International Airport during 2000–2022 and analyzed the influence of sea–land–atmosphere interactions on EF (evaporation fog) and CF (cooling fog).
There are two types of advection fog at the airport. Fog in Qingdao can be divided into EF, dominated by northwesterly wind, and CF, dominated by southeasterly wind (Figure 2). EF mainly forms in winter from November to February, while CF mainly forms in spring and summer from April to August (Figure 3). The average frequency is five events per year, and the annual frequency shows a downward trend in the past decade. CF (EF) forms less in winter (summer), but visibility is less at the airport when it forms.
CF is thicker than EF due to significant differences in atmospheric circulation and PBL structure. For EF, the low troposphere is affected by dry and cold air even at 950 hPa, but the low troposphere is affected by warm and moist air when CF forms (Figure 6). In terms of atmospheric stability, downdrafts and a positive vertical gradient of θ s e indicate stable PBL when EF forms, while weak updrafts and a negative vertical gradient of θ s e indicate weak, unstable or neutral PBL when CF forms. Therefore, CF is thicker in vertical size.
Formation processes of EF and CF are generally opposite. The heat and water vapor fluxes from land to atmosphere are small or even negative when EF forms (Figure 8). At the formation time, SST−SAT mainly ranges from 0 to 8 K (Figure 9), and warm SST promotes fog formation through vertical mixing of strong turbulence. The moisture is mainly from the water vapor released by the YS (Figure 8e). In contrast, the atmosphere is warmer than the YS when CF forms, and SST−SAT mainly ranges from −4 to 0 K (Figure 9). Cold SST promotes fog formation through strong turbulent cooling. The moisture mainly comes from the long-distance transport of moist and warm air from low latitudes and the transpiration of the local land area (Figure 8b,f).
According to statistics, when wind direction is northwesterly with wind speed of 2–7 m s−1 in winter, and the SST−SAT value is from the range of 0–8 K, we should pay attention to the possibility of EF formation at Qingdao Liuting International Airport. In summer, when wind direction is southeasterly with wind speed of 2–7 m s−1, and the SST-SAT value is from the range of −4–0 K, the formation of CF should be observed.

Author Contributions

Conceptualization, Z.Z., Y.L. and G.S.; writing—original draft preparation, Z.Z.; writing—review and editing, Y.L., L.L., C.Z. and G.S.; project administration, Y.L.; funding acquisition, Y.L. All authors have read and agreed to the published version of the manuscript.

Funding

This research was supported by the National Natural Science Foundation of China (Grant No. U2242201 and No. 42075077 (Yunying Li)), Hunan Provincial Natural Science Foundation of China (Grant No. 2021JC0009 (Yunying Li) and No. 2023JJ30629 (Chao Zhang)) and Fengyun Application Pioneering Project (FY-APP-2022.0605 (Yunying Li)).

Institutional Review Board Statement

Not applicable.

Informed Consent Statement

Not applicable.

Data Availability Statement

Surface observation data are obtained from https://www.ncei.noaa.gov/ (accessed on 1 April 2023). Sounding data are from http://weather.uwyo.edu/ (accessed on 1 April 2023). The ERA5 reanalysis dataset is available at https://cds.climate.copernicus.eu (accessed on 1 April 2023).

Acknowledgments

The authors are very grateful to the editor and anonymous reviewers for their help and recommendations.

Conflicts of Interest

The authors declare no conflict of interest.

References

  1. Tardif, R.; Rasmussen, R.M. Event-Based Climatology and Typology of Fog in the New York City Region. J. Appl. Meteorol. Climatol. 2007, 46, 1141–1168. [Google Scholar] [CrossRef]
  2. Roux, B.; Potts, R.; Siems, S.; Manton, M. Towards a Better Understanding of Fog at Perth Airport. J. Hydrol. 2021, 600, 126516. [Google Scholar] [CrossRef]
  3. Lu, C.; Niu, S.; Tang, L.; Lv, J.; Zhao, L.; Zhu, B. Chemical Composition of Fog Water in Nanjing Area of China and Its Related Fog Microphysics. Atmos. Res. 2010, 97, 47–69. [Google Scholar] [CrossRef]
  4. Wang, Y.; Lu, C.; Niu, S.; Lv, J.; Jia, X.; Xu, X.; Xue, Y.; Zhu, L.; Yan, S. Diverse Dispersion Effects and Parameterization of Relative Dispersion in Urban Fog in Eastern China. J. Geophys. Res. Atmos. 2023, 128, e2022JD037514. [Google Scholar] [CrossRef]
  5. Wang, S.; Yi, L.; Zhang, S.; Shi, X.; Chen, X. The Microphysical Properties of a Sea-Fog Event along the West Coast of the Yellow Sea in Spring. Atmosphere 2020, 11, 413. [Google Scholar] [CrossRef]
  6. Gultepe, I.; Heymsfield, A.J.; Fernando, H.J.S.; Pardyjak, E.; Dorman, C.E.; Wang, Q.; Creegan, E.; Hoch, S.W.; Flagg, D.D.; Yamaguchi, R.; et al. A Review of Coastal Fog Microphysics During C-FOG. Bound.-Layer Meteorol. 2021, 181, 227–265. [Google Scholar] [CrossRef]
  7. Fernando, H.J.S.; Gultepe, I.; Dorman, C.; Pardyjak, E.; Wang, Q.; Hoch, S.W.; Richter, D.; Creegan, E.; Gaberšek, S.; Bullock, T.; et al. C-FOG: Life of Coastal Fog. Bull. Am. Meteorol. Soc. 2021, 102, E244–E272. [Google Scholar] [CrossRef]
  8. Niu, S.; Lu, C.; Yu, H.; Zhao, L.; Lü, J. Fog Research in China: An Overview. Adv. Atmos. Sci. 2010, 27, 639–662. [Google Scholar] [CrossRef]
  9. Zhang, S.-P.; Xie, S.-P.; Liu, Q.-Y.; Yang, Y.-Q.; Wang, X.-G.; Ren, Z.-P. Seasonal Variations of Yellow Sea Fog: Observations and Mechanisms. J. Clim. 2009, 22, 6758–6772. [Google Scholar] [CrossRef]
  10. Liu, J.; Sun, Y.; Yang, L. Interannual Variability in Summertime Sea Fog over the Northern Yellow Sea and Its Association with the Local Sea Surface Temperature. J. Geophys. Res. Atmos. 2021, 126, e2020JD034439. [Google Scholar] [CrossRef]
  11. Gultepe, I.; Isaac, G.A.; Williams, A.; Marcotte, D.; Strawbridge, K.B. Turbulent Heat Fluxes over Leads and Polynyas, and Their Effects on Arctic Clouds during FIRE.ACE: Aircraft Observations for April 1998. Atmosphere-Ocean 2003, 41, 15–34. [Google Scholar] [CrossRef]
  12. Lee, E.; Kim, J.-H.; Heo, K.-Y.; Cho, Y.-K. Advection Fog over the Eastern Yellow Sea: WRF Simulation and Its Verification by Satellite and In Situ Observations. Remote Sens. 2021, 13, 1480. [Google Scholar] [CrossRef]
  13. Koračin, D.; Dorman, C.E.; Lewis, J.M.; Hudson, J.G.; Wilcox, E.M.; Torregrosa, A. Marine Fog: A Review. Atmos. Res. 2014, 143, 142–175. [Google Scholar] [CrossRef]
  14. Yang, L.; Liu, J.-W.; Ren, Z.-P.; Xie, S.-P.; Zhang, S.-P.; Gao, S.-H. Atmospheric Conditions for Advection-Radiation Fog over the Western Yellow Sea. J. Geophys. Res. Atmos. 2018, 123, 5455–5468. [Google Scholar] [CrossRef]
  15. Liu, L.; Wang, X.; Li, Y.; Wei, W. The Effect of Sea Surface Temperature on Relative Humidity and Atmospheric Visibility of a Winter Sea Fog Event over the Yellow-Bohai Sea. Atmosphere 2022, 13, 1718. [Google Scholar] [CrossRef]
  16. Gao, X.; Gao, S.; Li, Z.; Wang, Y. A Revised Method with a Temperature Constraint for Assimilating Satellite-Derived Humidity in Forecasting Sea Fog over the Yellow Sea. Front. Earth Sci. 2023, 10, 992246. [Google Scholar] [CrossRef]
  17. Jin, G.; Gao, S.; Shi, H.; Lu, X.; Yang, Y.; Zheng, Q. Impacts of Sea–Land Breeze Circulation on the Formation and Development of Coastal Sea Fog along the Shandong Peninsula: A Case Study. Atmosphere 2022, 13, 165. [Google Scholar] [CrossRef]
  18. Fu, G.; Guo, J.; Xie, S.-P.; Duan, Y.; Zhang, M. Analysis and High-Resolution Modeling of a Dense Sea Fog Event over the Yellow Sea. Atmos. Res. 2006, 81, 293–303. [Google Scholar] [CrossRef]
  19. Gao, S.; Lin, H.; Shen, B.; Fu, G. A Heavy Sea Fog Event over the Yellow Sea in March 2005: Analysis and Numerical Modeling. Adv. Atmos. Sci. 2007, 24, 65–81. [Google Scholar] [CrossRef]
  20. Li, P.; Fu, G.; Lu, C. Large-Scale Environmental Influences on the Onset, Maintenance, and Dissipation of Six Sea Fog Cases over the Yellow Sea. Pure Appl. Geophys. 2012, 169, 983–1000. [Google Scholar] [CrossRef]
  21. Zhang, S.; Ren, Z.; Liu, J.; Yang, Y.; Wang, X. Variations in the Lower Level of the PBL Associated with the Yellow Sea Fog-New Observations by L-Band Radar. J. Ocean Univ. China 2008, 7, 353–361. [Google Scholar] [CrossRef]
  22. Wang, Y.; Gao, S.; Fu, G.; Sun, J.; Zhang, S. Assimilating MTSAT-Derived Humidity in Nowcasting Sea Fog over the Yellow Sea. Weather Forecast. 2014, 29, 205–225. [Google Scholar] [CrossRef]
  23. Yang, Y.; Gao, S. The Impact of Turbulent Diffusion Driven by Fog-Top Cooling on Sea Fog Development. J. Geophys. Res. Atmos. 2020, 125, e2019JD031562. [Google Scholar] [CrossRef]
  24. Yang, Y.; Hu, X.-M.; Gao, S.; Wang, Y. Sensitivity of WRF Simulations with the YSU PBL Scheme to the Lowest Model Level Height for a Sea Fog Event over the Yellow Sea. Atmos. Res. 2019, 215, 253–267. [Google Scholar] [CrossRef]
  25. Zhang, Z.; Li, Y. Spring Planetary Boundary Layer Structure and Corresponding Cloud Characteristics under Different Prevailing Wind Directions over the Kuroshio Sea Surface Temperature Front in the East China Sea. J. Geophys. Res. Atmos. 2020, 125, e2020JD034006. [Google Scholar] [CrossRef]
  26. Zhang, Z.; Li, Y.; Song, W. Stratocumulus in the Cold and Warm Sides of the Spring Kuroshio Sea Surface Temperature Front in the East China Sea. J. Geophys. Res. Atmos. 2020, 125, e2019JD032176. [Google Scholar] [CrossRef]
  27. Li, Y.; Yan, J.; Sui, X. Tropospheric Temperature Inversion over Central China. Atmos. Res. 2012, 116, 105–115. [Google Scholar] [CrossRef]
  28. Hersbach, H.; Bell, B.; Berrisford, P.; Hirahara, S.; Horányi, A.; Muñoz-Sabater, J.; Nicolas, J.; Peubey, C.; Radu, R.; Schepers, D.; et al. The ERA5 Global Reanalysis. Q. J. R. Meteorol. Soc. 2020, 146, 1999–2049. [Google Scholar] [CrossRef]
  29. Li, Y.; Gu, H. Relationship between Middle Stratiform Clouds and Large Scale Circulation over Eastern China. Geophys. Res. Lett. 2006, 33, L09706. [Google Scholar] [CrossRef]
  30. Li, Y.; Zhang, M. Cumulus over the Tibetan Plateau in the Summer Based on CloudSat–CALIPSO Data. J. Clim. 2016, 29, 1219–1230. [Google Scholar] [CrossRef]
  31. Sun, G.; Li, Y.; Li, S. The Differences in Cloud Vertical Structures between Active and Break Spells of the East Asian Summer Monsoon Based on CloudSat Data. Atmos. Res. 2019, 224, 157–167. [Google Scholar] [CrossRef]
  32. Lu, C.; Liu, Y.; Niu, S.; Endo, S. Scale Dependence of Entrainment-Mixing Mechanisms in Cumulus Clouds: Scale Dependence of Mixing Mechanisms. J. Geophys. Res. Atmos. 2014, 119, 13877–13890. [Google Scholar] [CrossRef]
  33. Gao, S.; Lu, C.; Liu, Y.; Mei, F.; Wang, J.; Zhu, L.; Yan, S. Contrasting Scale Dependence of Entrainment-Mixing Mechanisms in Stratocumulus Clouds. Geophys. Res. Lett. 2020, 47, e2020GL086970. [Google Scholar] [CrossRef]
  34. Wood, R.; Bretherton, C.S. On the Relationship between Stratiform Low Cloud Cover and Lower-Tropospheric Stability. J. Clim. 2006, 19, 6425–6432. [Google Scholar] [CrossRef]
  35. Lin, D.; Katurji, M.; Revell, L.E.; Khan, B.; Osborne, N.; Soltanzadeh, I.; Kremser, S. Fog Type Classification Using a Modified Richardson Number for Christchurch, New Zealand. Int. J. Climatol. 2023, 43, 314–330. [Google Scholar] [CrossRef]
Figure 1. Topography (m) and the location of the airport (black triangle) used in this study.
Atmosphere 14 01310 g001
Figure 2. Wind rose at the time of fog formation.
Atmosphere 14 01310 g002
Figure 3. (a) Annual and (b) seasonal variations in fog frequency. (c) Boxplot of EF and CF visibility (m) and (d) diurnal variation in fog frequency at formation time. Black lines represent the total fog frequency, and blue and red lines represent the fog frequency under northwesterly wind and southeasterly wind, respectively.
Atmosphere 14 01310 g003
Figure 4. (a) Visibility (m), (b) SLP (hPa), (c) wind speed (m s−1), (d) wind direction (°) and (e) temperature and dew point (K) time series on 10–11 December 2021 and 8–9 November 2022. Blue and red lines represent EF and CF variables, respectively. The solid and dashed lines represent the temperature and dew point in (e), respectively.
Atmosphere 14 01310 g004
Figure 5. (a) Temperature and dew point (K), (b) RH (%), and (c) wind speed (m s−1) profiles at 12 UTC on 10 December 2021 (black lines), at 00 UTC on 11 December 2021 (red lines) and at 12 UTC on 11 December 2021 (blue lines). (df) Same as (ac), but variables at 12 UTC on 8 November 2022, at 00 UTC on 9 November 2022 and at 12 UTC on 9 November 2022. Vertical solid and dashed lines represent temperature and dew point profiles in (a,d), respectively. Horizontal solid lines represent TI top and base heights.
Atmosphere 14 01310 g005
Figure 6. (a) Geopotential height (isolines, dagpm), wind (vectors, m s−1) and RH (shaded, %) at 500 hPa of EF. (b) Same as (a), but with CF. (c,d) Same as (a,b) but at 850 hPa. (e,f) Same as (a,b) but at 925 hPa. SLP (isolines, hPa), 10 m wind (vectors, m s−1) and 2 m RH (shaded, %) of (g) EF and (h) CF. The black triangle represents the airport location.
Atmosphere 14 01310 g006
Figure 7. (a) Vertical cross section of zonal-vertical circulation (vectors, zonal wind in m s−1 and −ω in 10−2 Pa s−1), θ s e (isolines, K) and its vertical gradience (shaded, K) along 120.5° E at the formation stage of EF. (b) Same as (a), but at the formation stage of CF. (c) The 10 m wind divergence (shaded, 10−5 s−1) and EIS (isolines, K) of EF. (d) Same as (c), but with CF. The black triangle represents the airport.
Atmosphere 14 01310 g007
Figure 8. (a) Water vapor flux (vectors and shaded, g/(cm·hPa·s)) of EF. (b) Same as (a), but with CF. (c) Temperature advection based on SAT and 10 m wind (shaded, 10−5 K s−1) and SST−SAT (isolines, K) of EF. (d) Same as (c), but with CF. (e) SHF (shaded, W m−2) and LHF (isolines, W m−2) of EF. (f) Same as (e), but with CF. Triangles represent the airport, black solid lines represent positive SST−SAT, and the opposite is true for dashed lines.
Atmosphere 14 01310 g008
Figure 9. Density scatter plot of SST−SAT (K) and wind speed (m s−1). Blue and red dots represent EF and CF, respectively.
Atmosphere 14 01310 g009
Figure 10. Anomaly of SLP (shaded, hPa) and 10 m wind (vectors, m s−1) at (a) 06 and (b) 18 UTC. Anomaly of LHF (shaded, W m−2) and SHF (isolines, W m−2) at (c) 06 and (d) 18 UTC. Black solid lines represent positive SHF anomalies, while the opposite is true for black dashed lines.
Atmosphere 14 01310 g010
Figure 11. (a) Vertical cross section of meridional-vertical circulation (vectors, meridional wind in m s−1 and −ω in 10−2 Pa s−1) and −ω (shaded) anomalies along 120.5° E at 06 UTC. (b) Same as (a), but at 18 UTC. (c) Vertical cross section of RH (shaded, %) and temperature (isolines, K) anomalies along 120.5° E at 06 UTC. (d) Same as (c), but at 18 UTC. Black solid lines represent positive temperature anomalies, while the opposite is true for black dashed lines.
Atmosphere 14 01310 g011
Figure 12. Seasonal variation of TI frequency (%) at 0800 BST (a) and 2000 BST (b). (c) boxplot of estimated EF and CF thickness (m). Red pentagram (*) and (+) represents average thickness and outlier, respectively.
Atmosphere 14 01310 g012
Table 1. Difference between EF and CF.
EFCF
Atmospheric CirculationAffected by cold and dry air at middle and upper troposphere (even at 950 hPa), surface was affected by cold advection with northwesterly windAffected by cold and dry air upon 850 hPa, surface was affected by warm advection with southeasterly wind
PBL StabilityStableWeak unstable or neutral
TI StrengthStrongerWeaker
ThicknessThinnerThicker, could reaching 1000 m
SST−SATMainly ranged in 0–8 KMainly ranged in −4–0 K
Surface Heat FluxTransport from sea to atmosphereTransport from atmosphere to sea
Surface Wind DivergenceDivergenceConvergence
Moisture SourceHeat and water vapor flux released by YSLong-distance transport of moist and warm air from low latitude and local land transpiration
Disclaimer/Publisher’s Note: The statements, opinions and data contained in all publications are solely those of the individual author(s) and contributor(s) and not of MDPI and/or the editor(s). MDPI and/or the editor(s) disclaim responsibility for any injury to people or property resulting from any ideas, methods, instructions or products referred to in the content.

