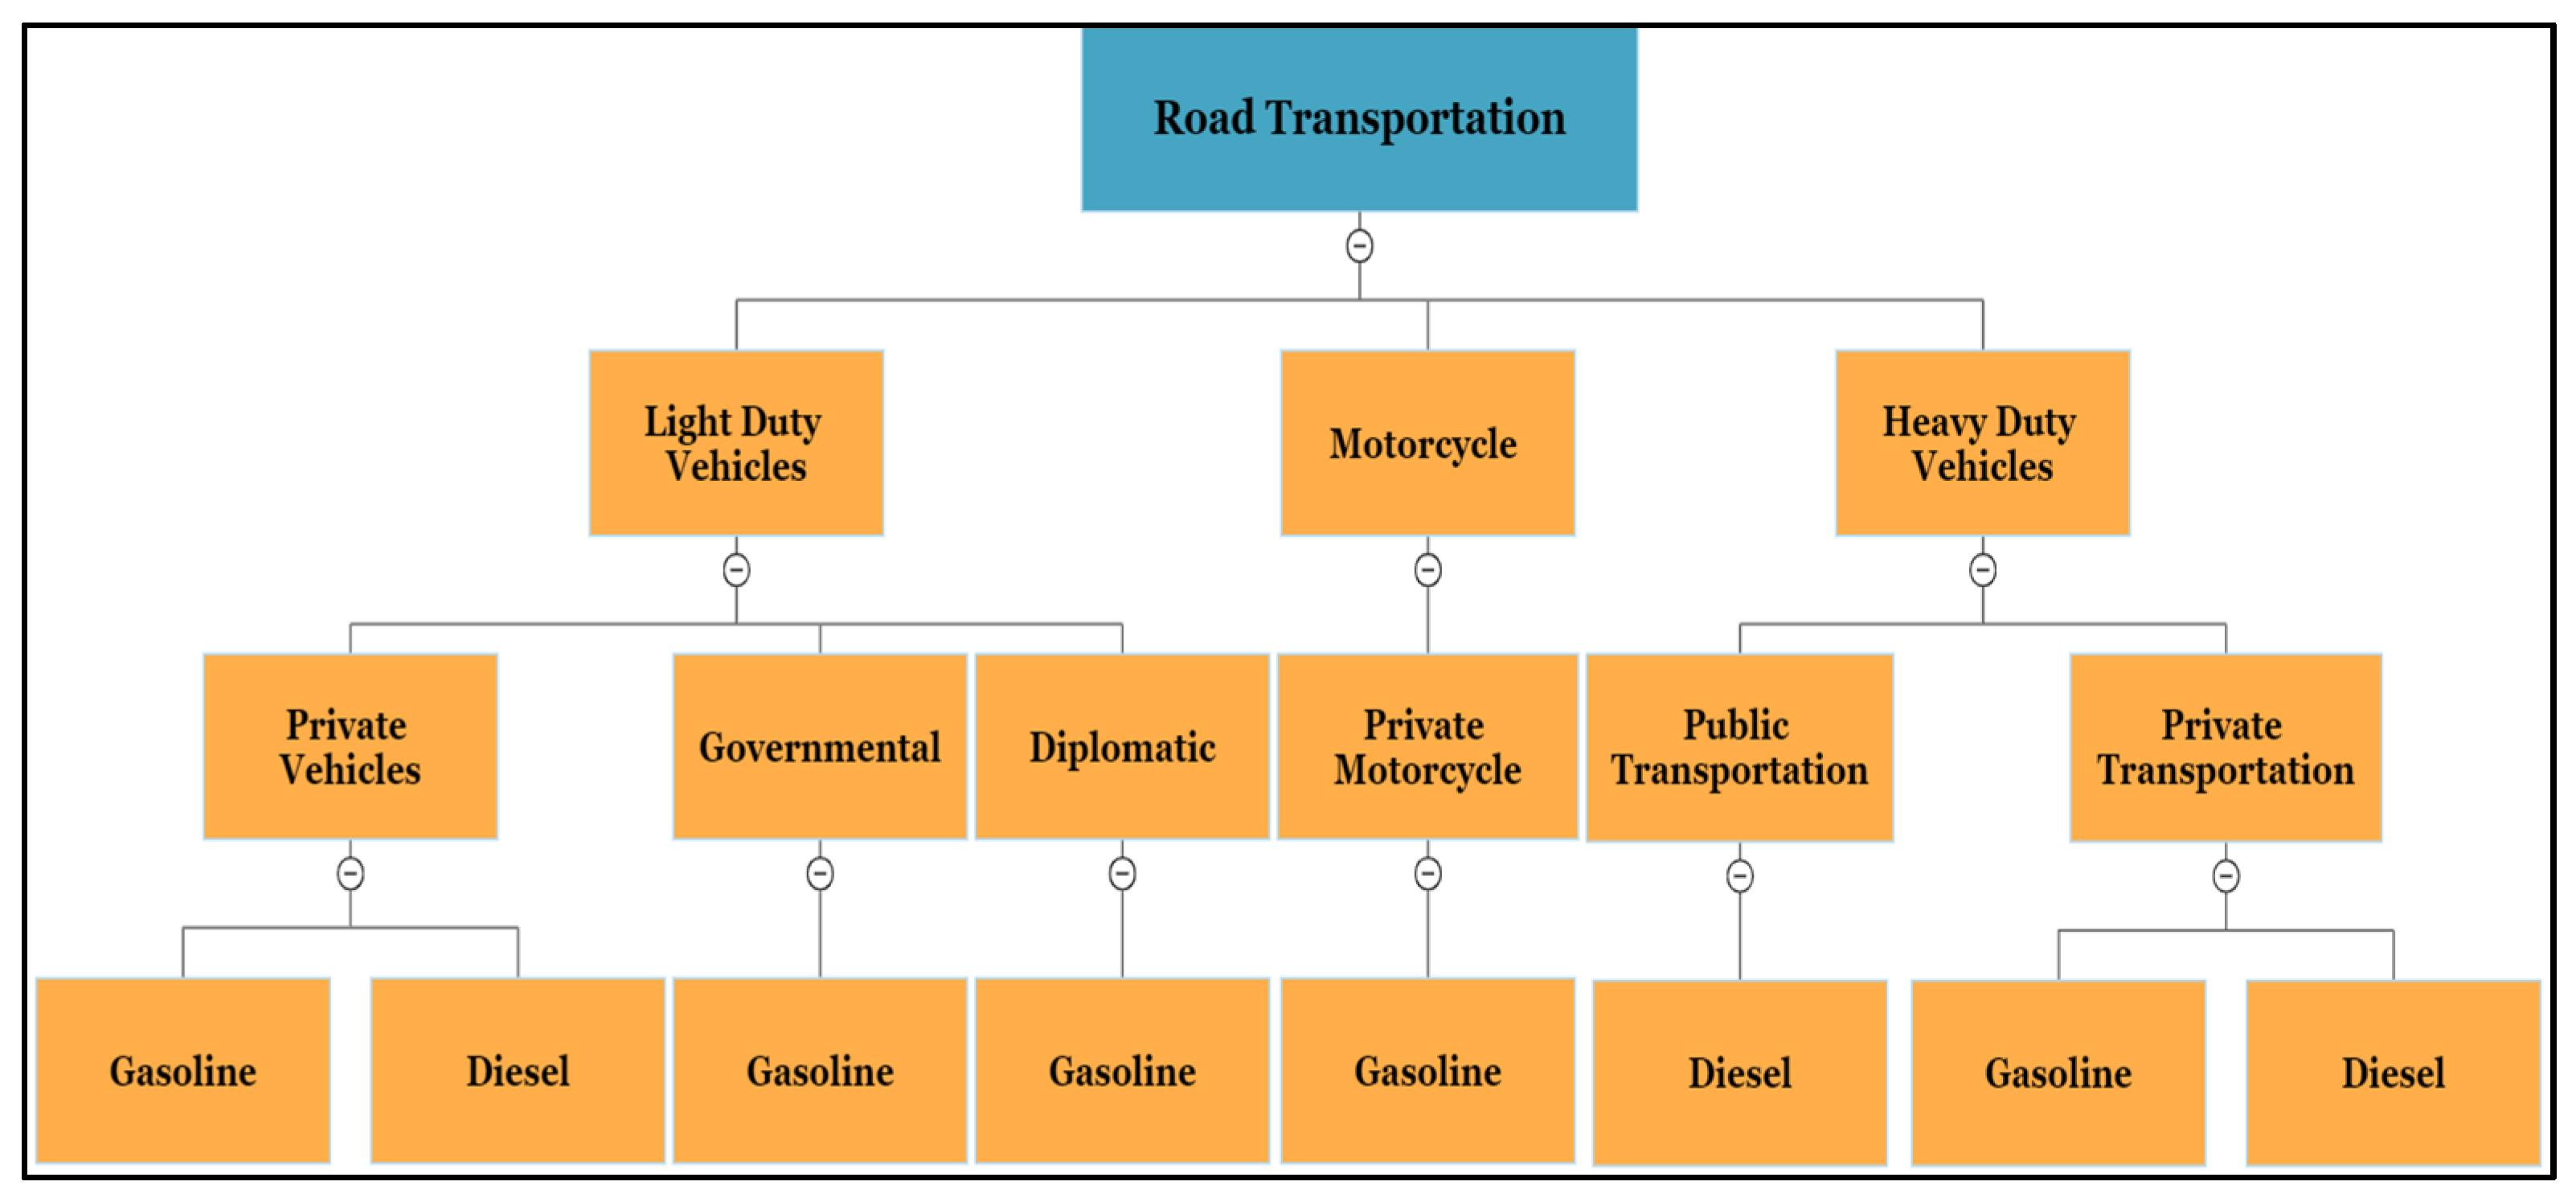
Figure 1.
LEAP model illustration for road transport structure considered in this study.
Figure 1.
LEAP model illustration for road transport structure considered in this study.
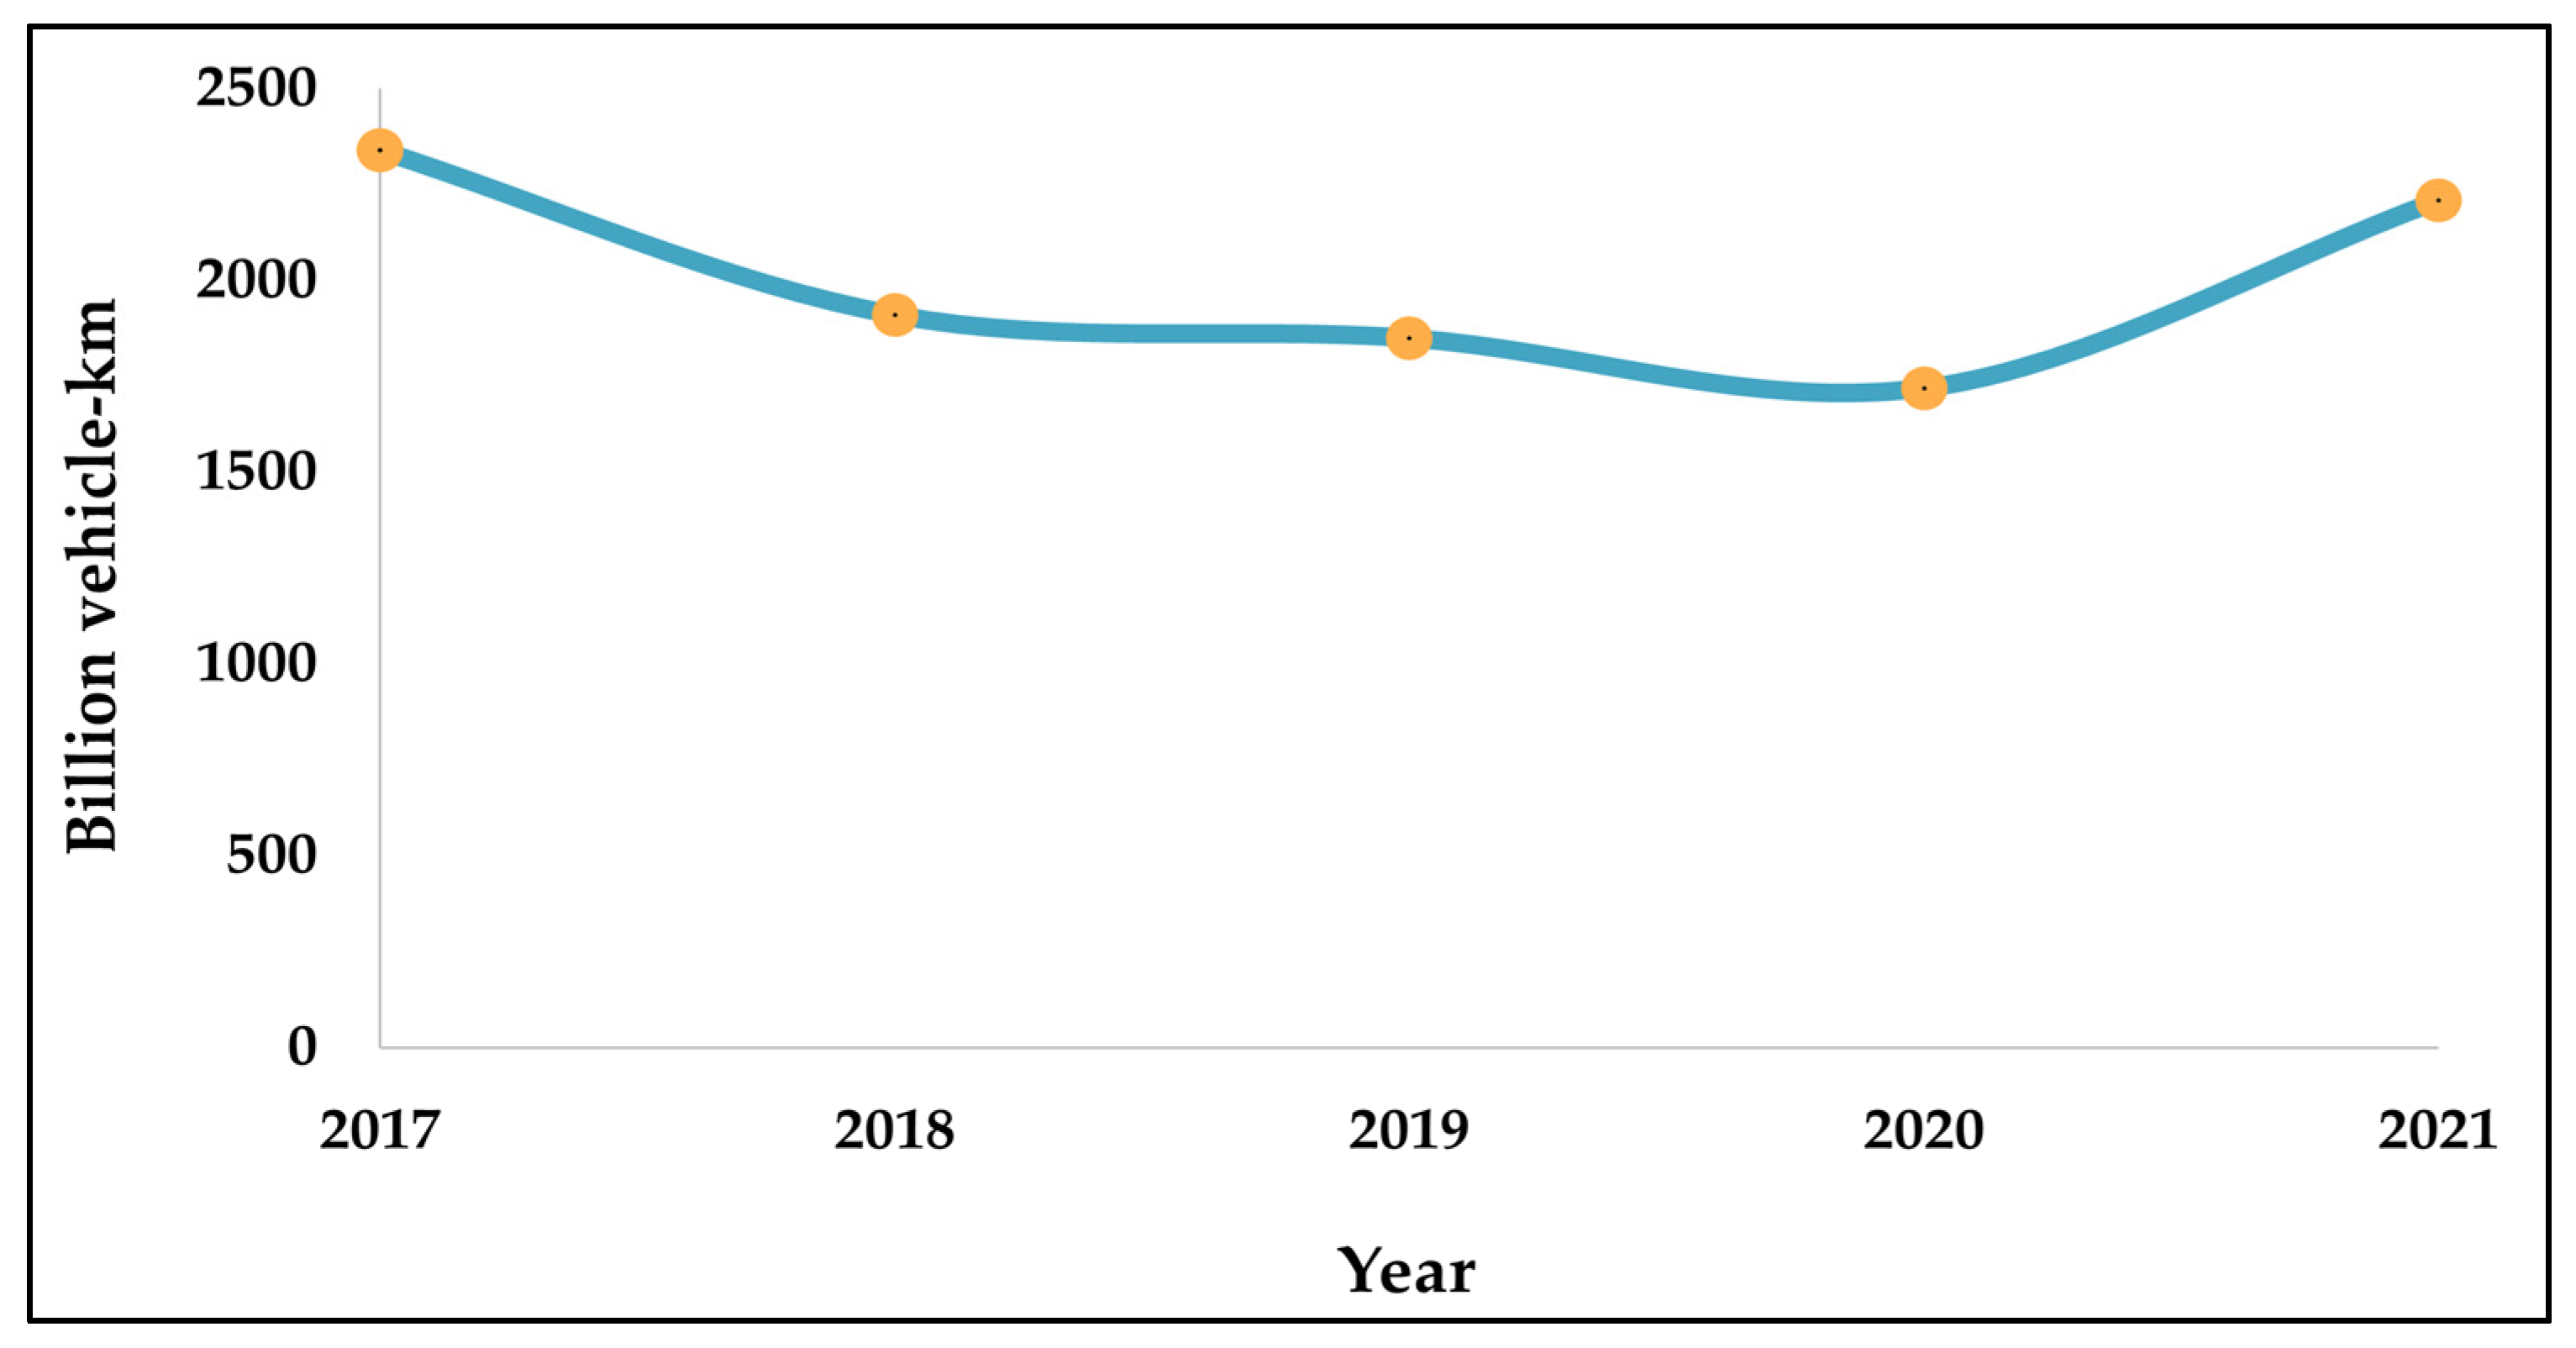
Figure 2.
Annual kilometers traveled from 2017 to 2021 in Qatar (Historical scenario).
Figure 2.
Annual kilometers traveled from 2017 to 2021 in Qatar (Historical scenario).
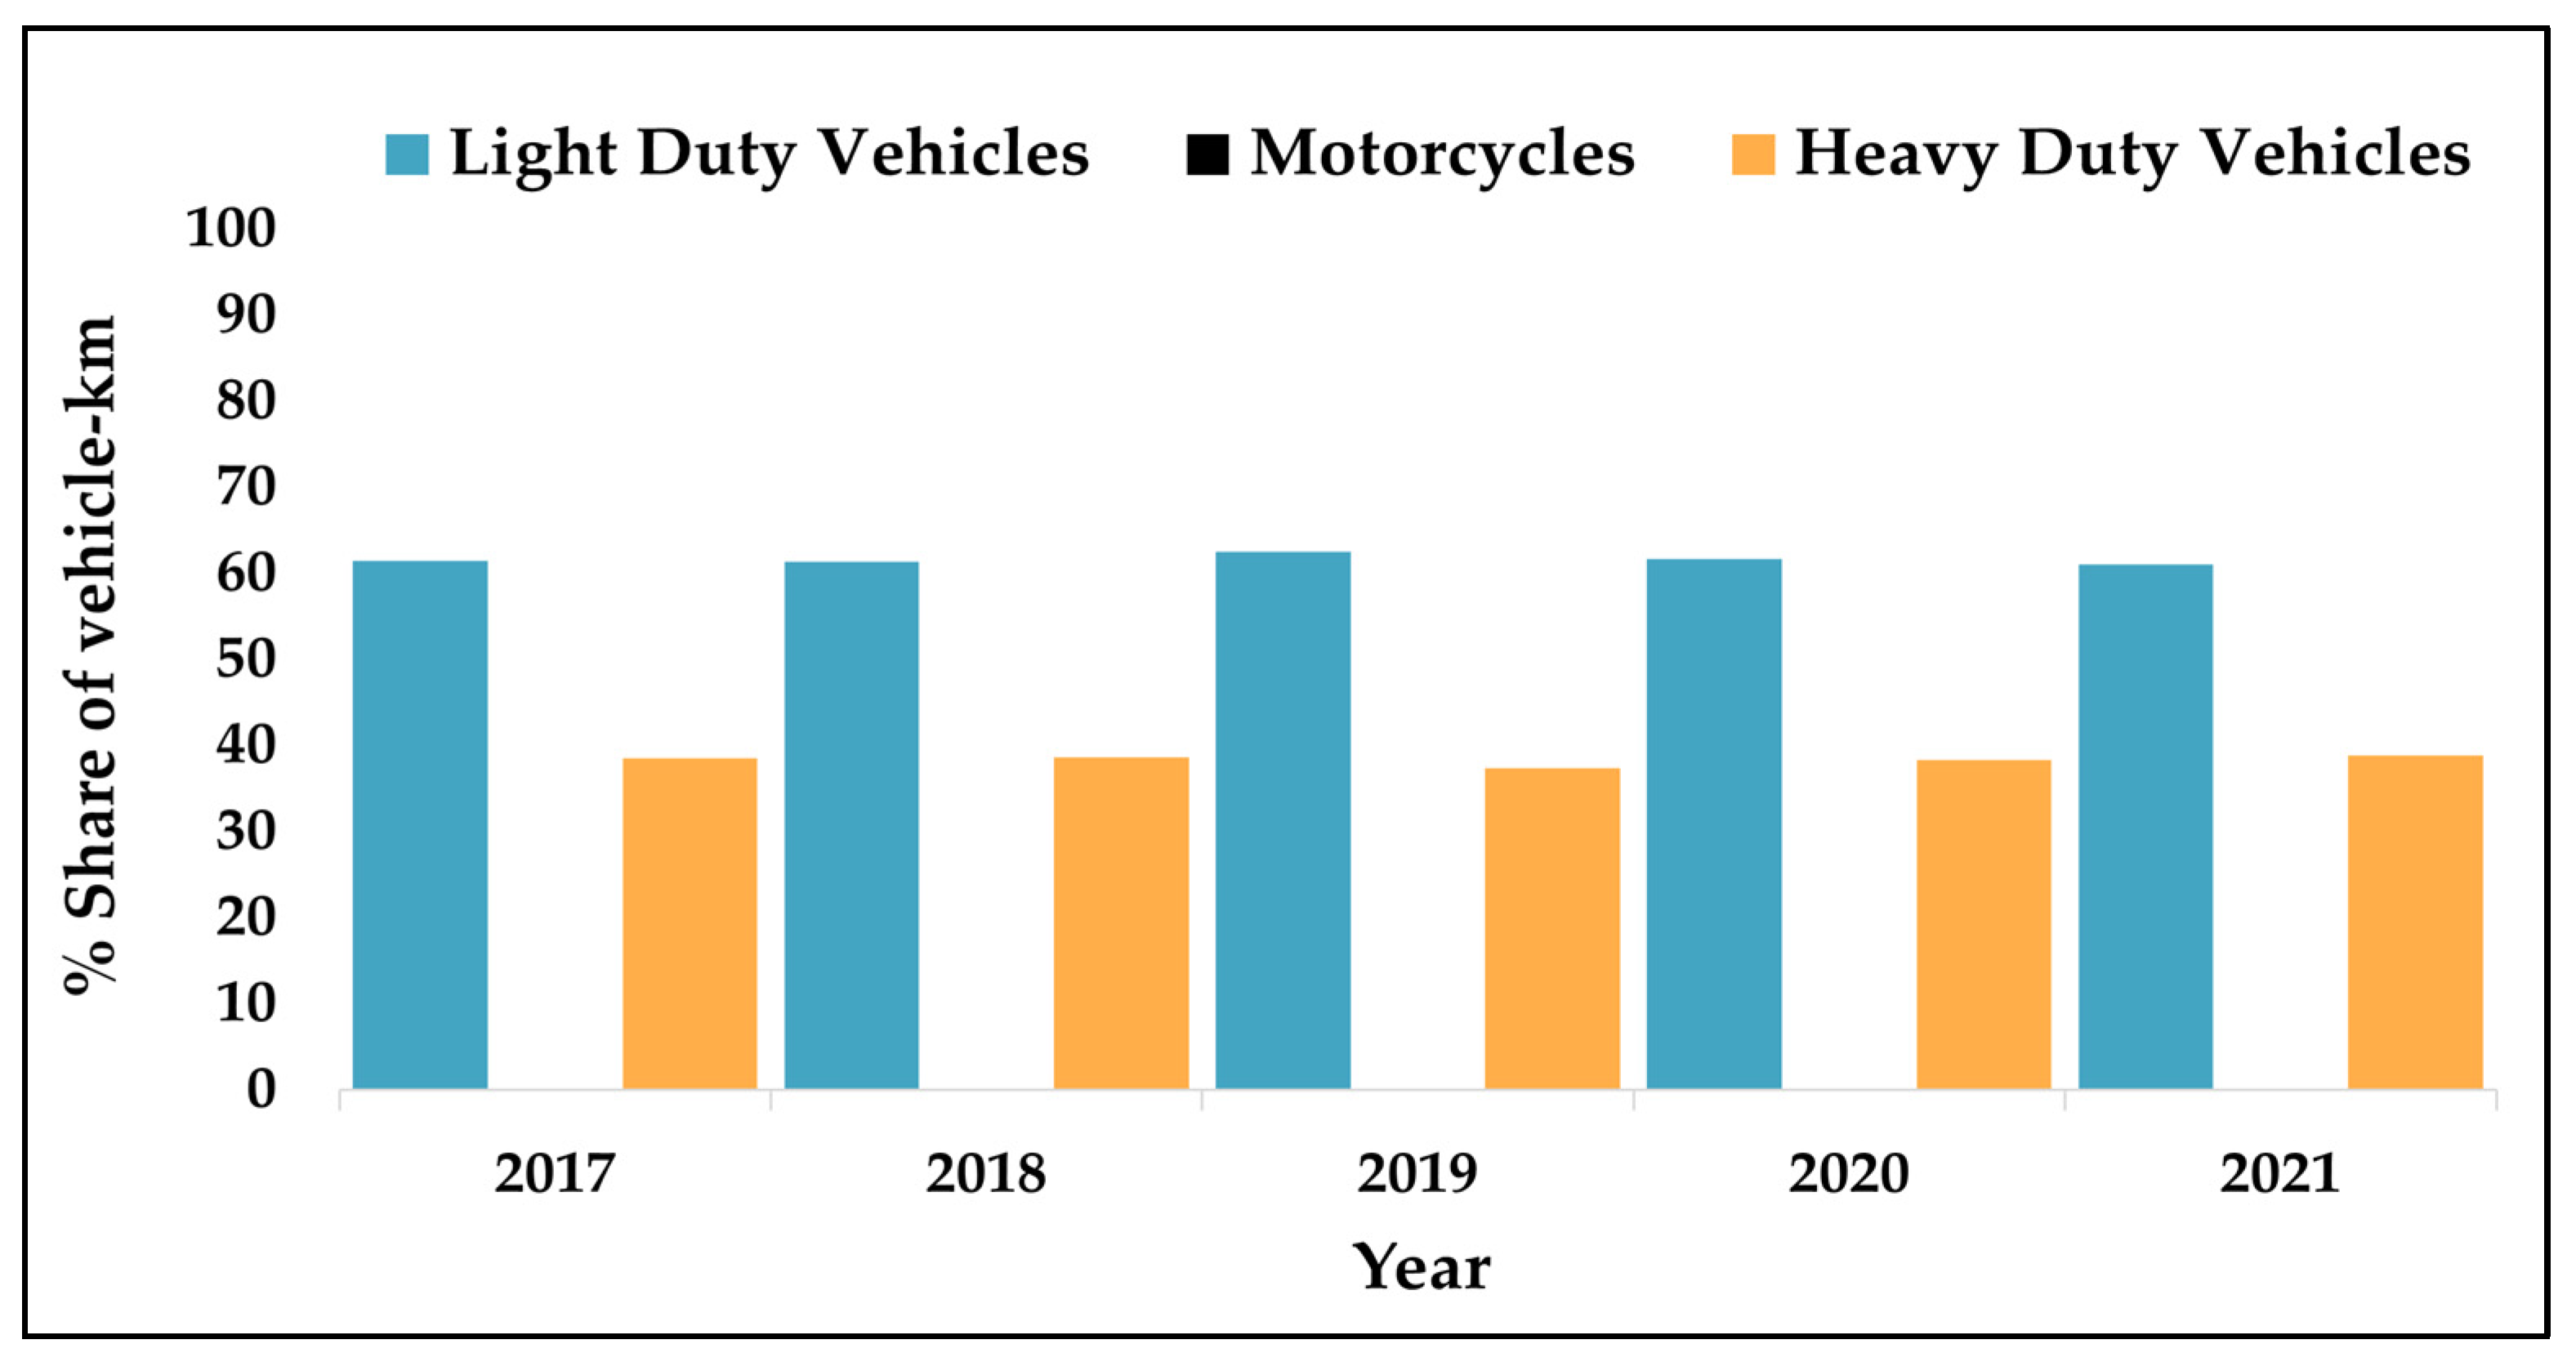
Figure 3.
The annual traveled distance (km) percent share of LDV, motorcycles, and HDV from 2017 to 2021 in Qatar (historical scenario).
Figure 3.
The annual traveled distance (km) percent share of LDV, motorcycles, and HDV from 2017 to 2021 in Qatar (historical scenario).
Figure 4.
Fuel percent share of private transportation from 2017 to 2021 in Qatar (Historical scenario).
Figure 4.
Fuel percent share of private transportation from 2017 to 2021 in Qatar (Historical scenario).
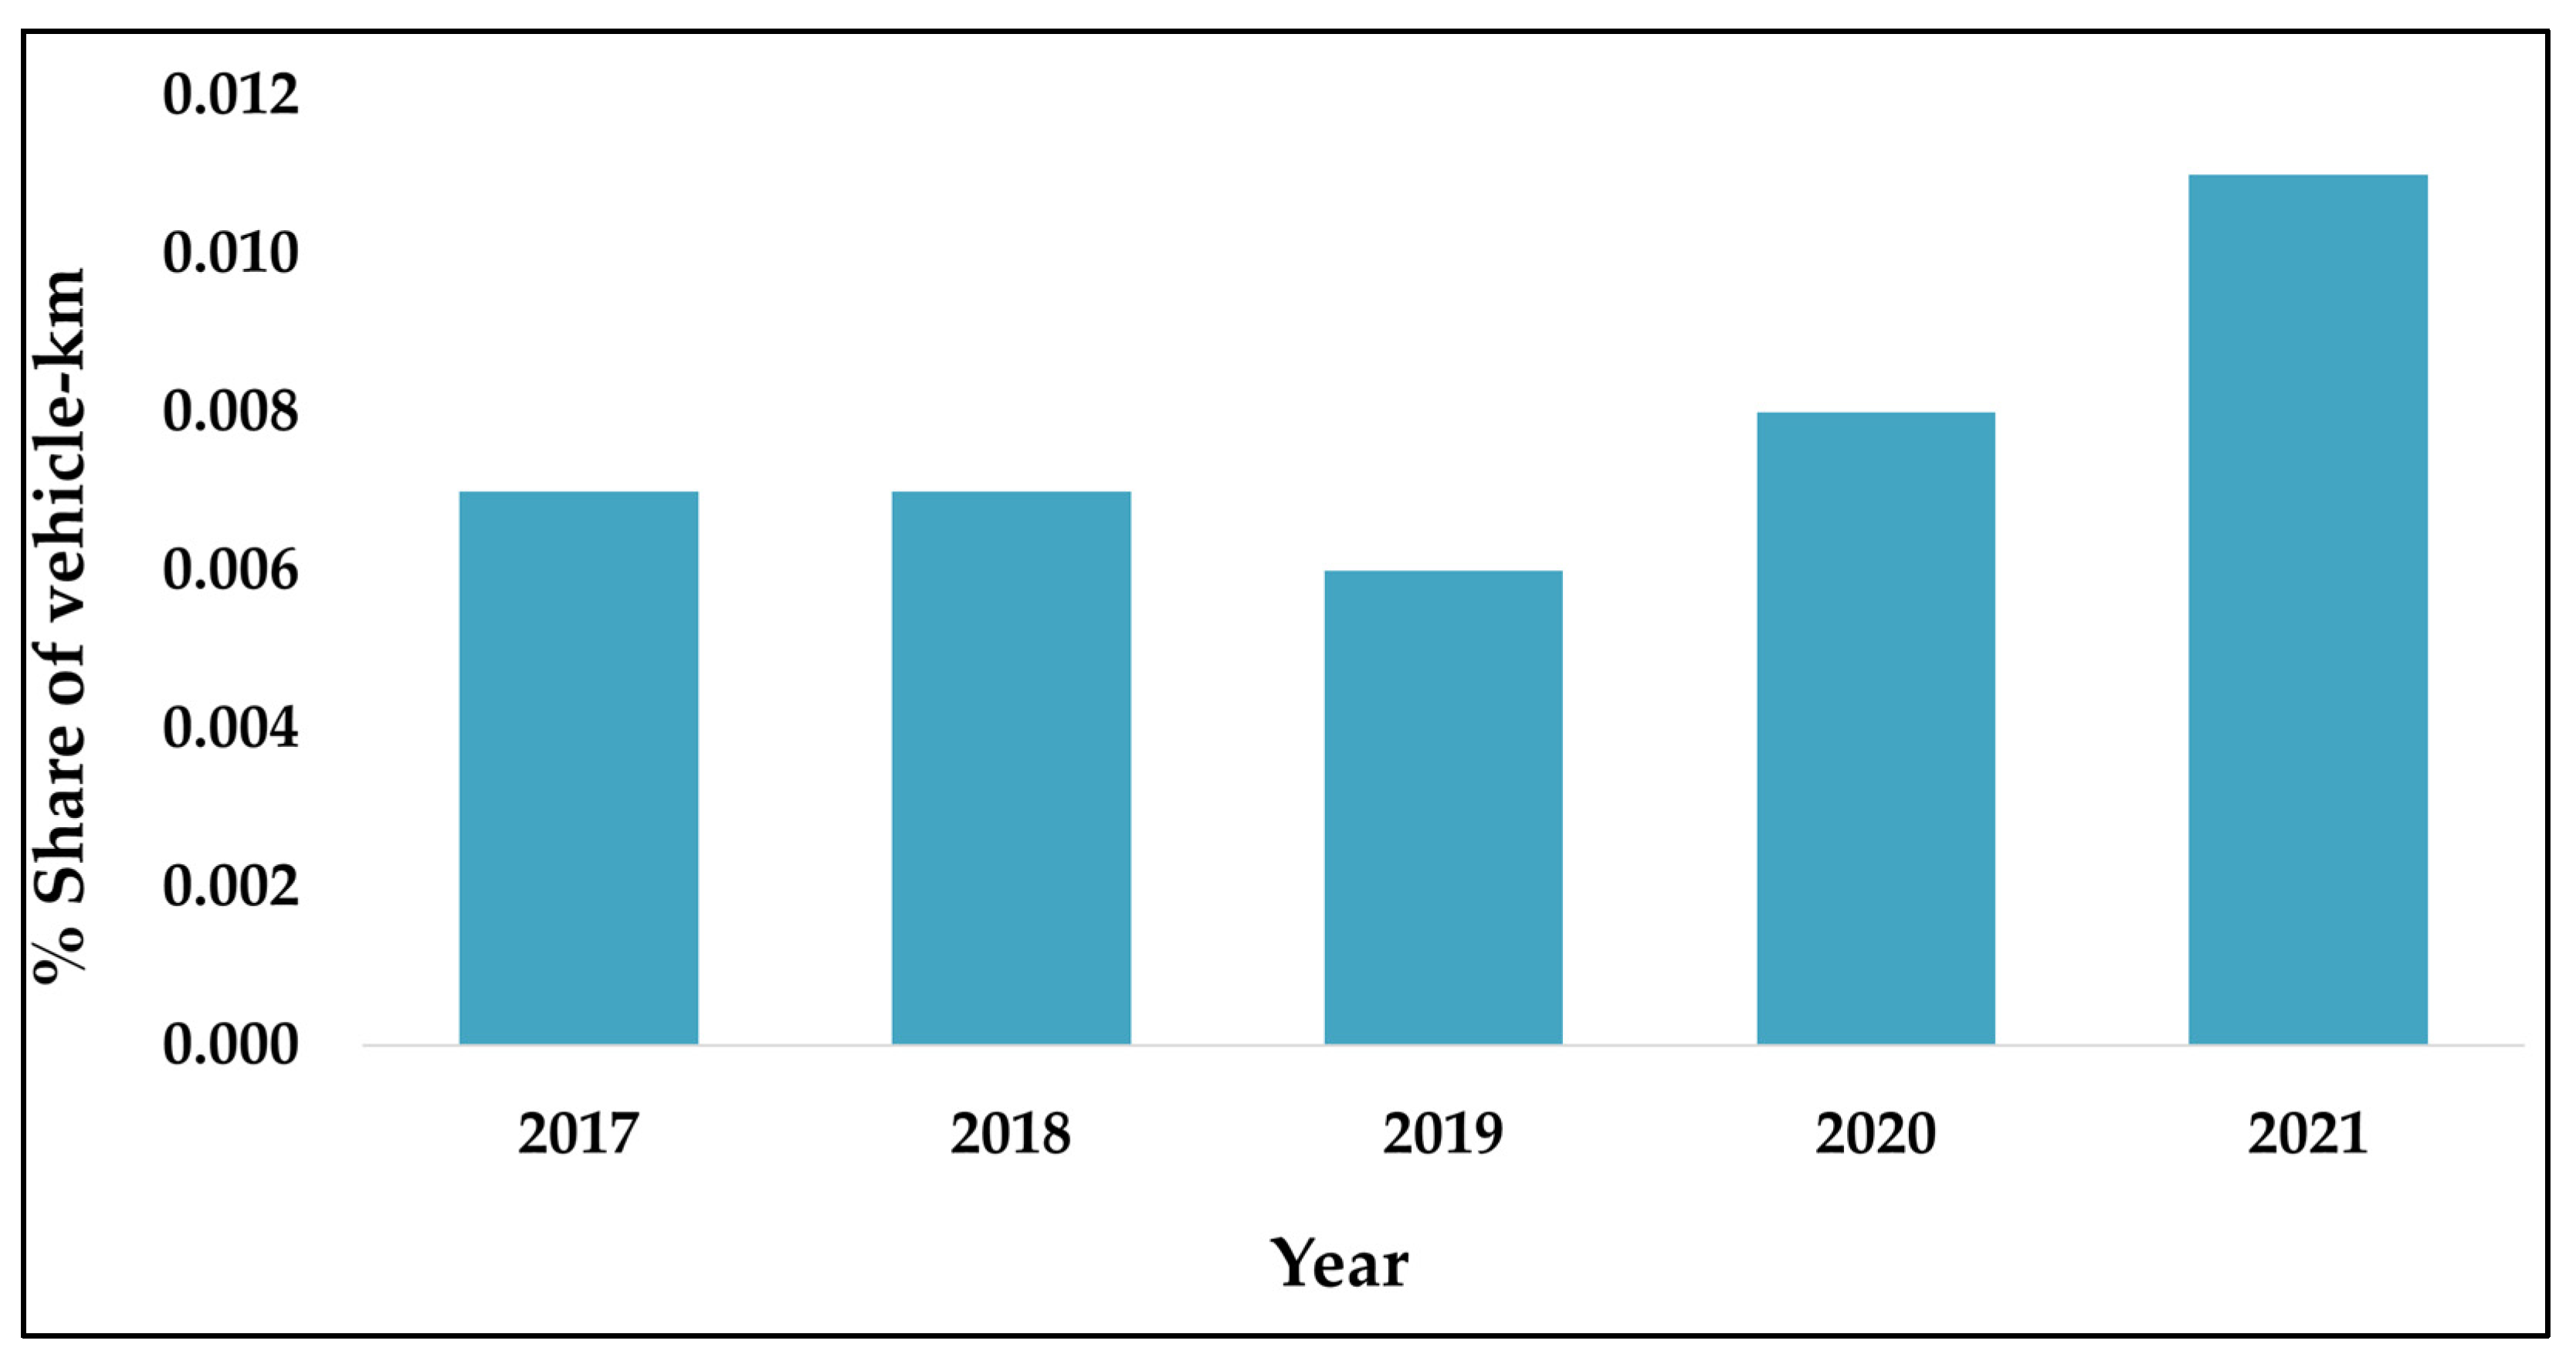
Figure 5.
The annual percent share of motorcycles from 2017 to 2021 in Qatar (Historical scenario).
Figure 5.
The annual percent share of motorcycles from 2017 to 2021 in Qatar (Historical scenario).
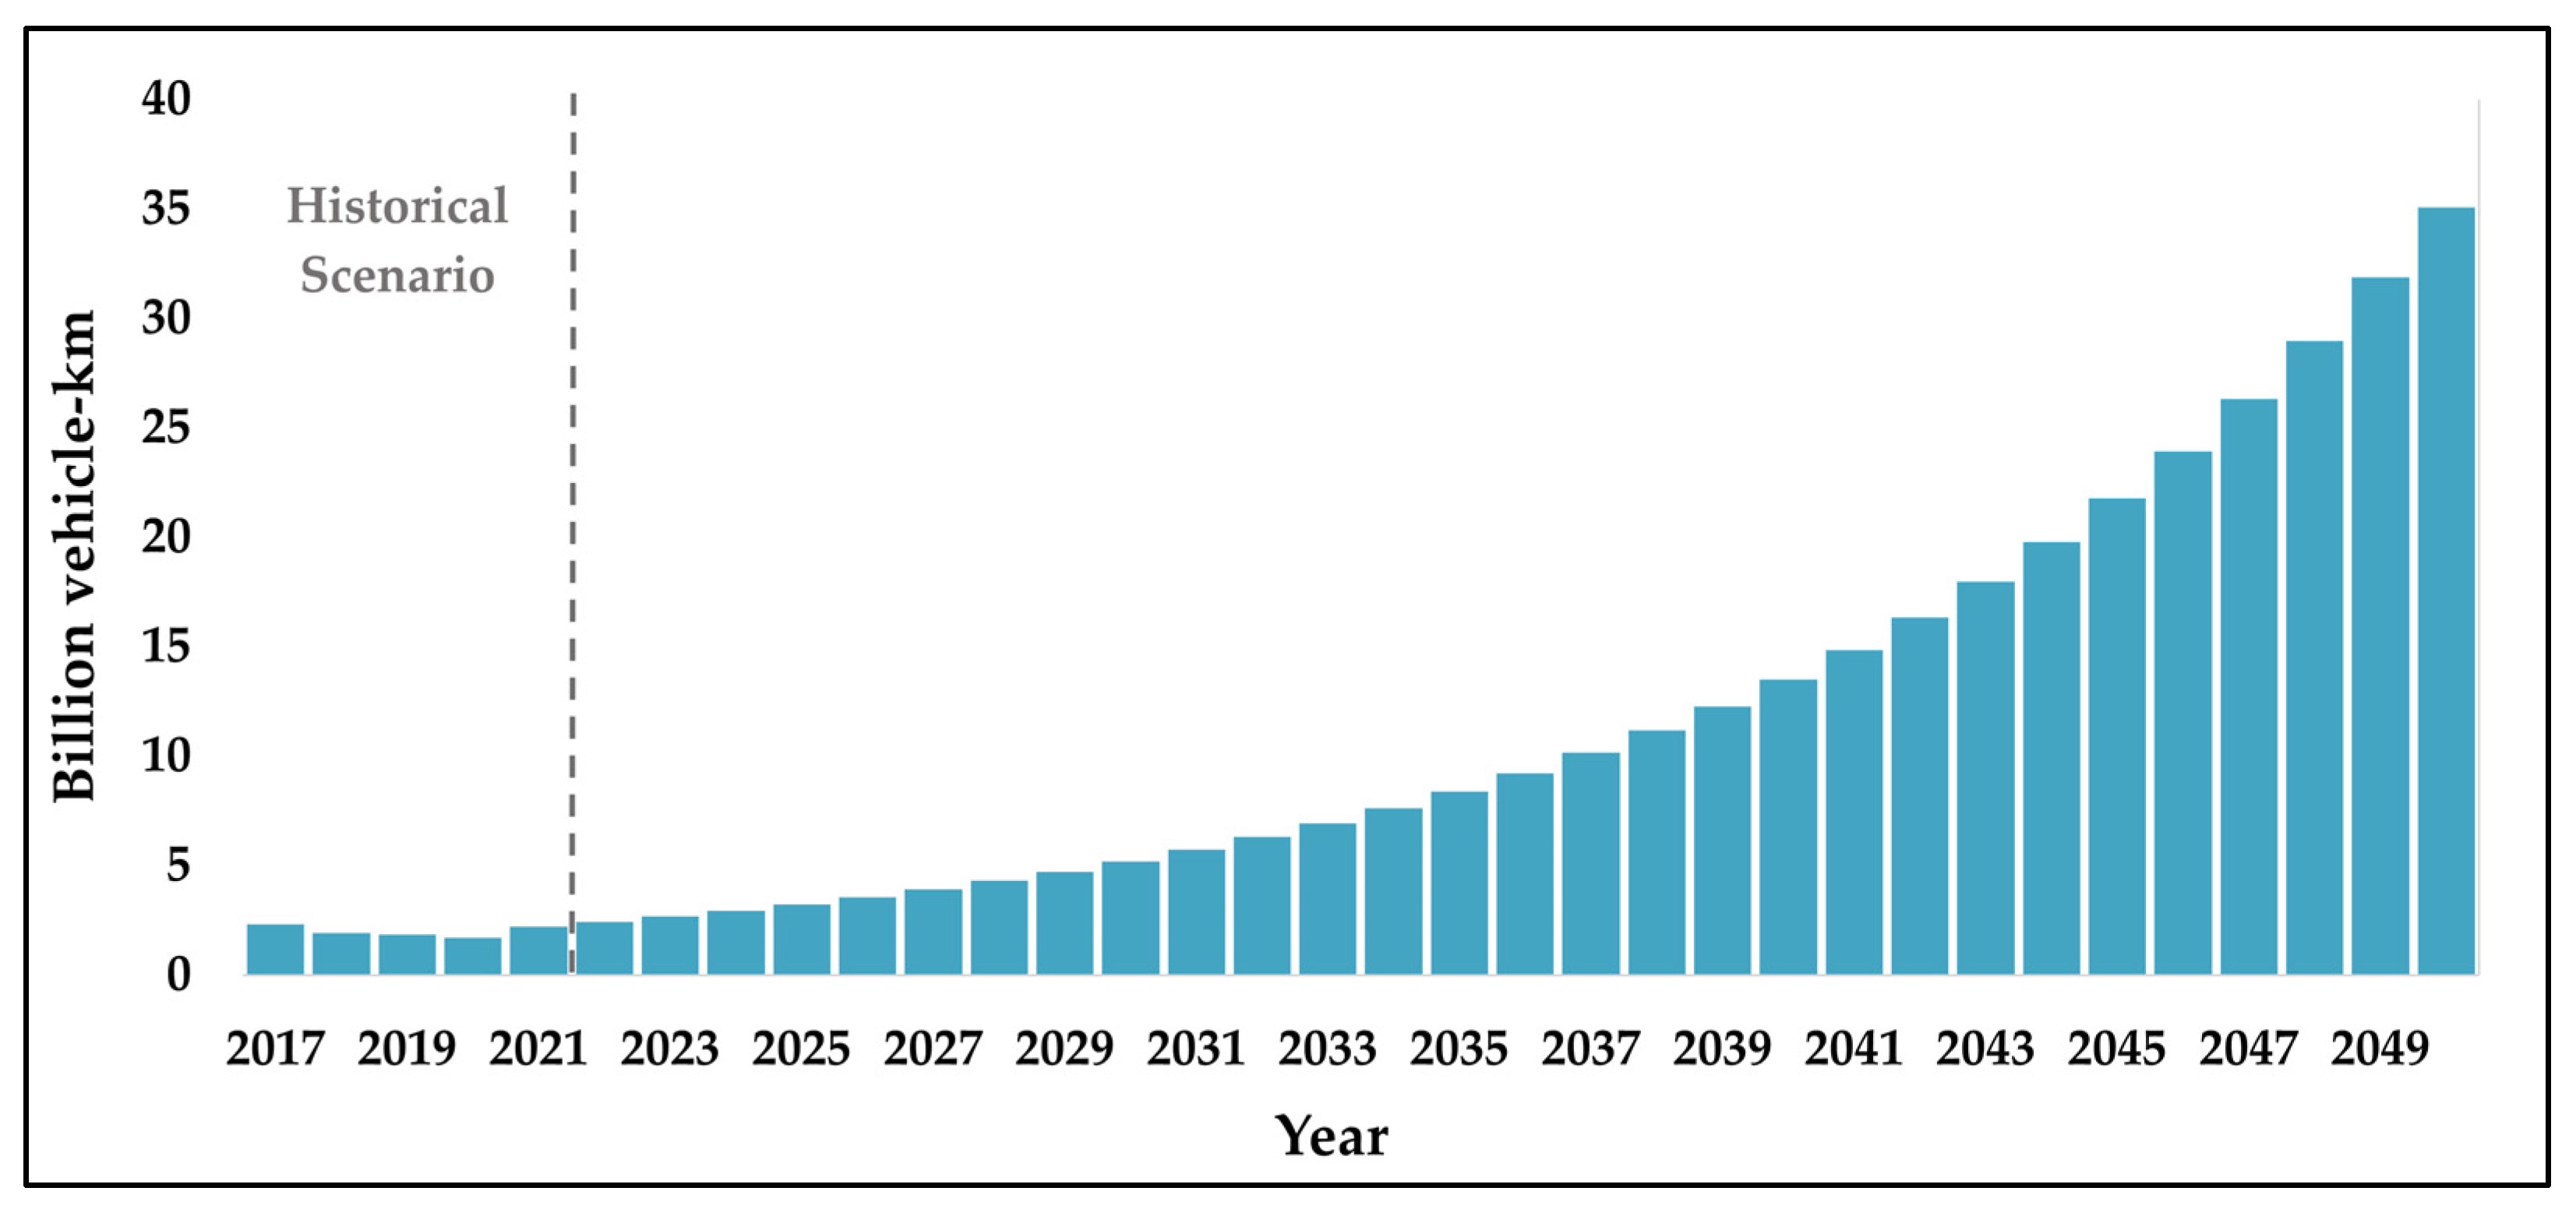
Figure 6.
Total vehicle km based on the assumption of a 10% growth rate (BAU scenario).
Figure 6.
Total vehicle km based on the assumption of a 10% growth rate (BAU scenario).
Figure 7.
Total vehicle km (billion vehicle kms) based on the assumption of a 10% growth rate, with results presented every five years.
Figure 7.
Total vehicle km (billion vehicle kms) based on the assumption of a 10% growth rate, with results presented every five years.
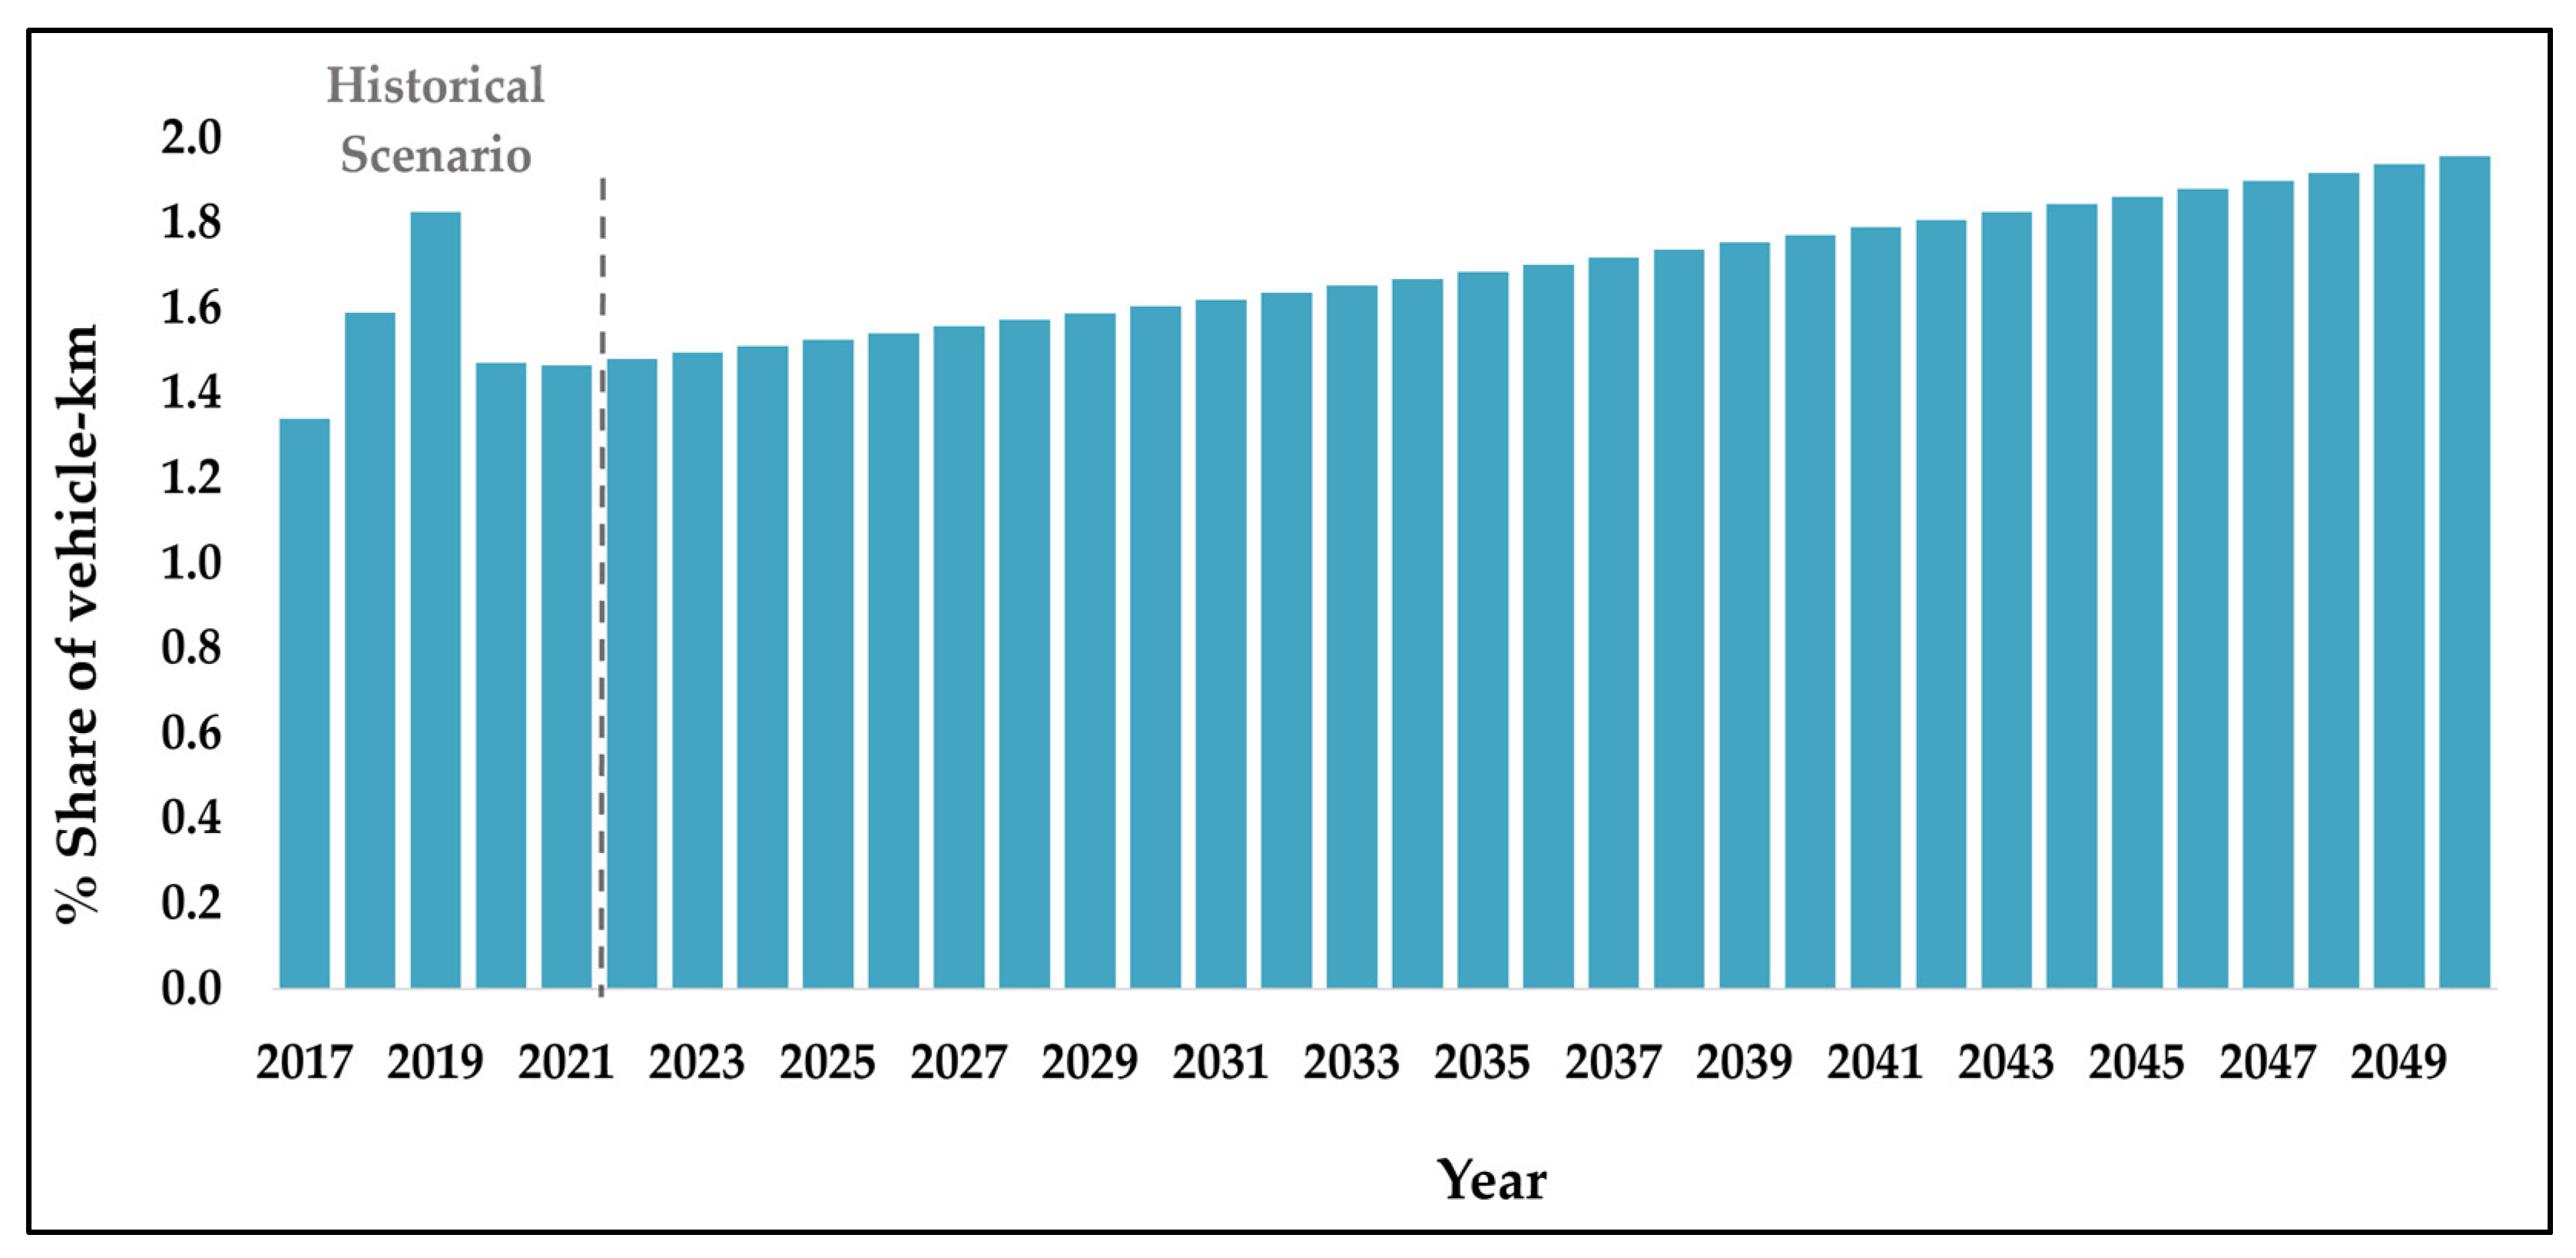
Figure 8.
The annual percent share of vehicle km traveled in Qatar with an assumption of a 1% increase in public transportation (public transport scenario).
Figure 8.
The annual percent share of vehicle km traveled in Qatar with an assumption of a 1% increase in public transportation (public transport scenario).
Figure 9.
The annual percent share of vehicle km traveled in Qatar with an assumption of a 1% increase in public transportation for every five years from 2020 to 2050.
Figure 9.
The annual percent share of vehicle km traveled in Qatar with an assumption of a 1% increase in public transportation for every five years from 2020 to 2050.
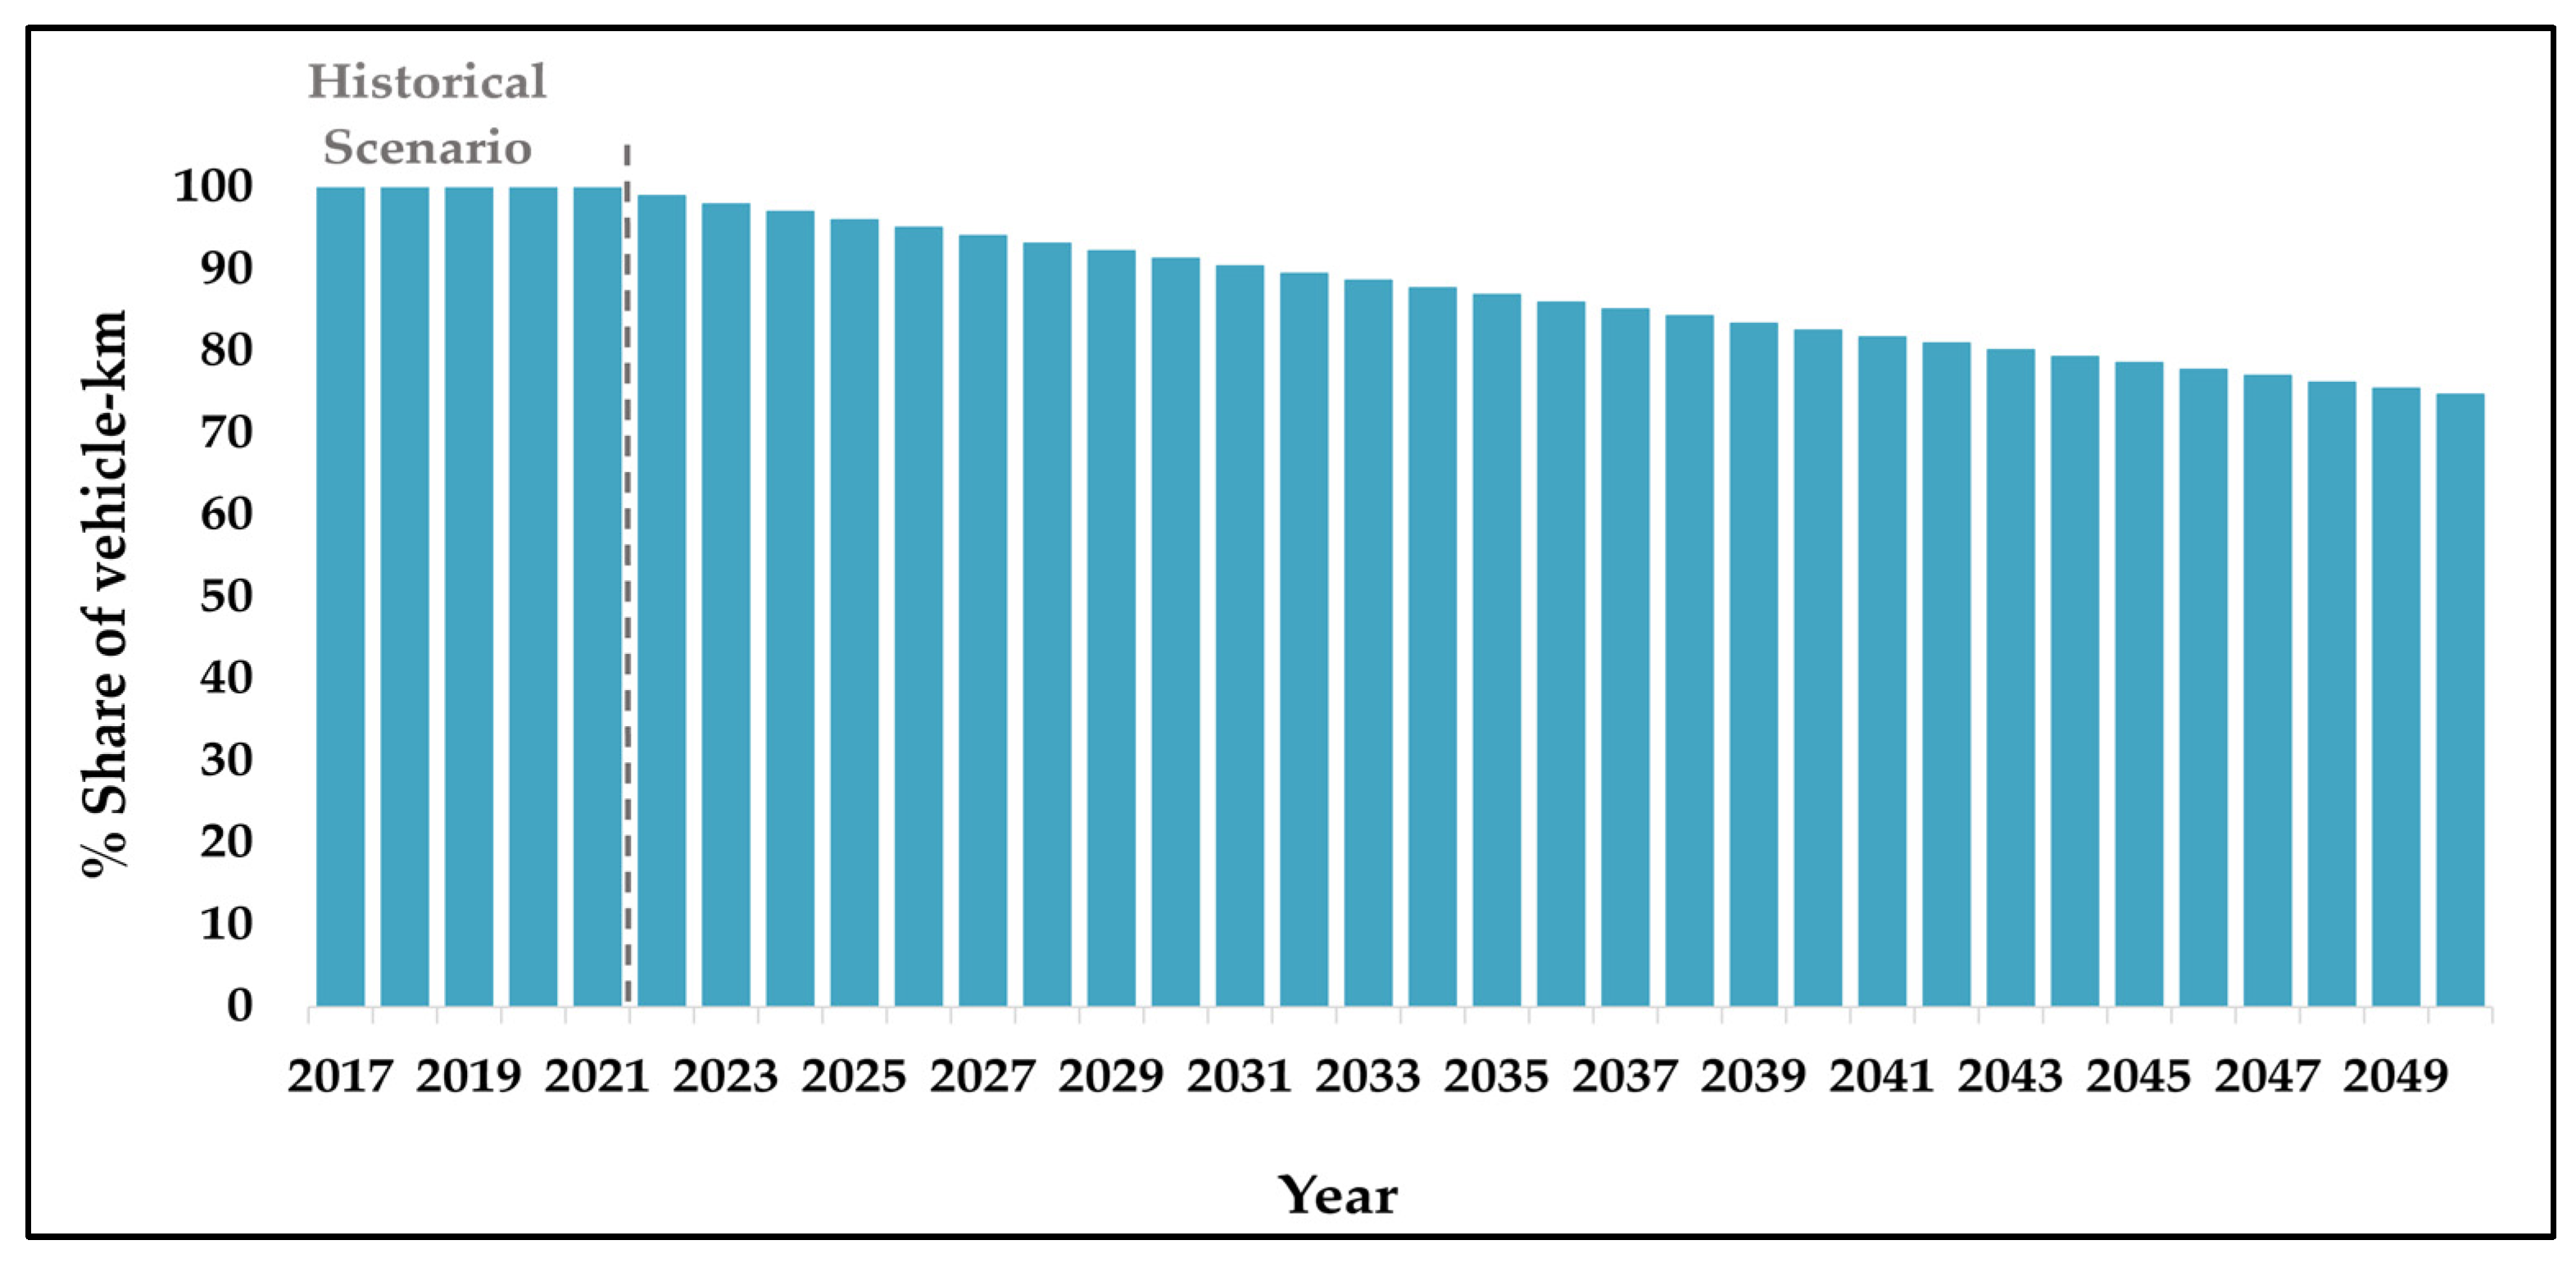
Figure 10.
The percent share of vehicle km traveled in Qatar with an assumption of a 1% decrease in private vehicles (public transport scenario).
Figure 10.
The percent share of vehicle km traveled in Qatar with an assumption of a 1% decrease in private vehicles (public transport scenario).
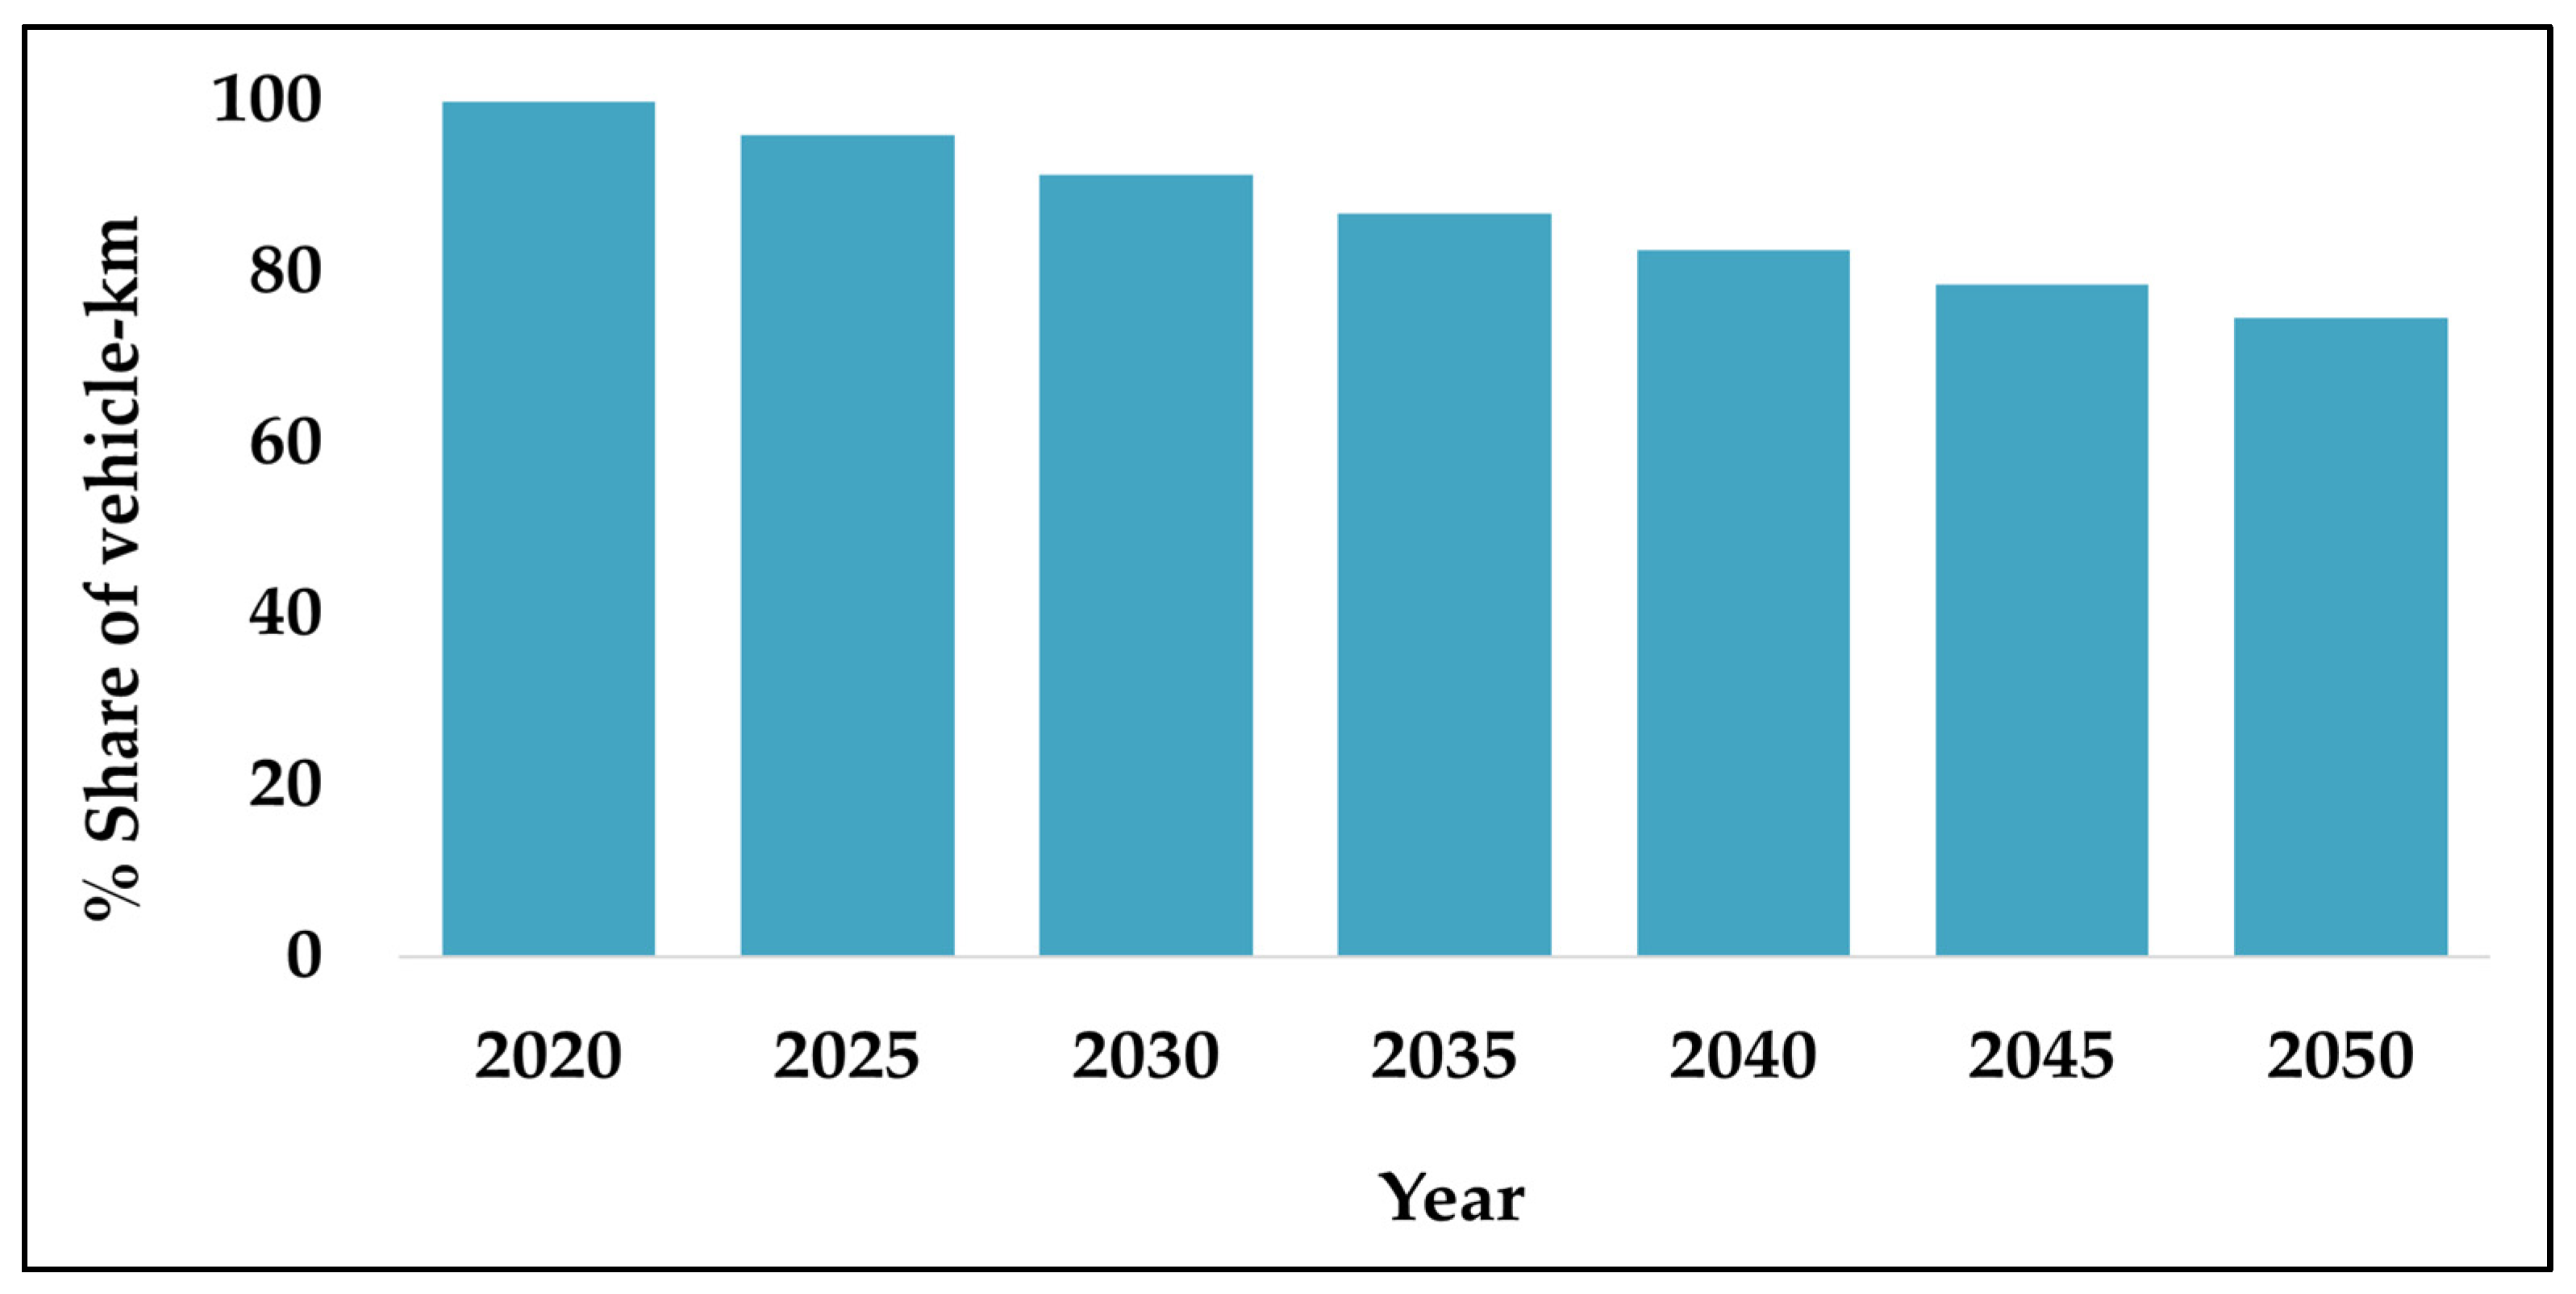
Figure 11.
The annual percent share of vehicle km traveled in Qatar with an assumption of a 1% decrease in private vehicles for every five years from 2020 to 2050.
Figure 11.
The annual percent share of vehicle km traveled in Qatar with an assumption of a 1% decrease in private vehicles for every five years from 2020 to 2050.
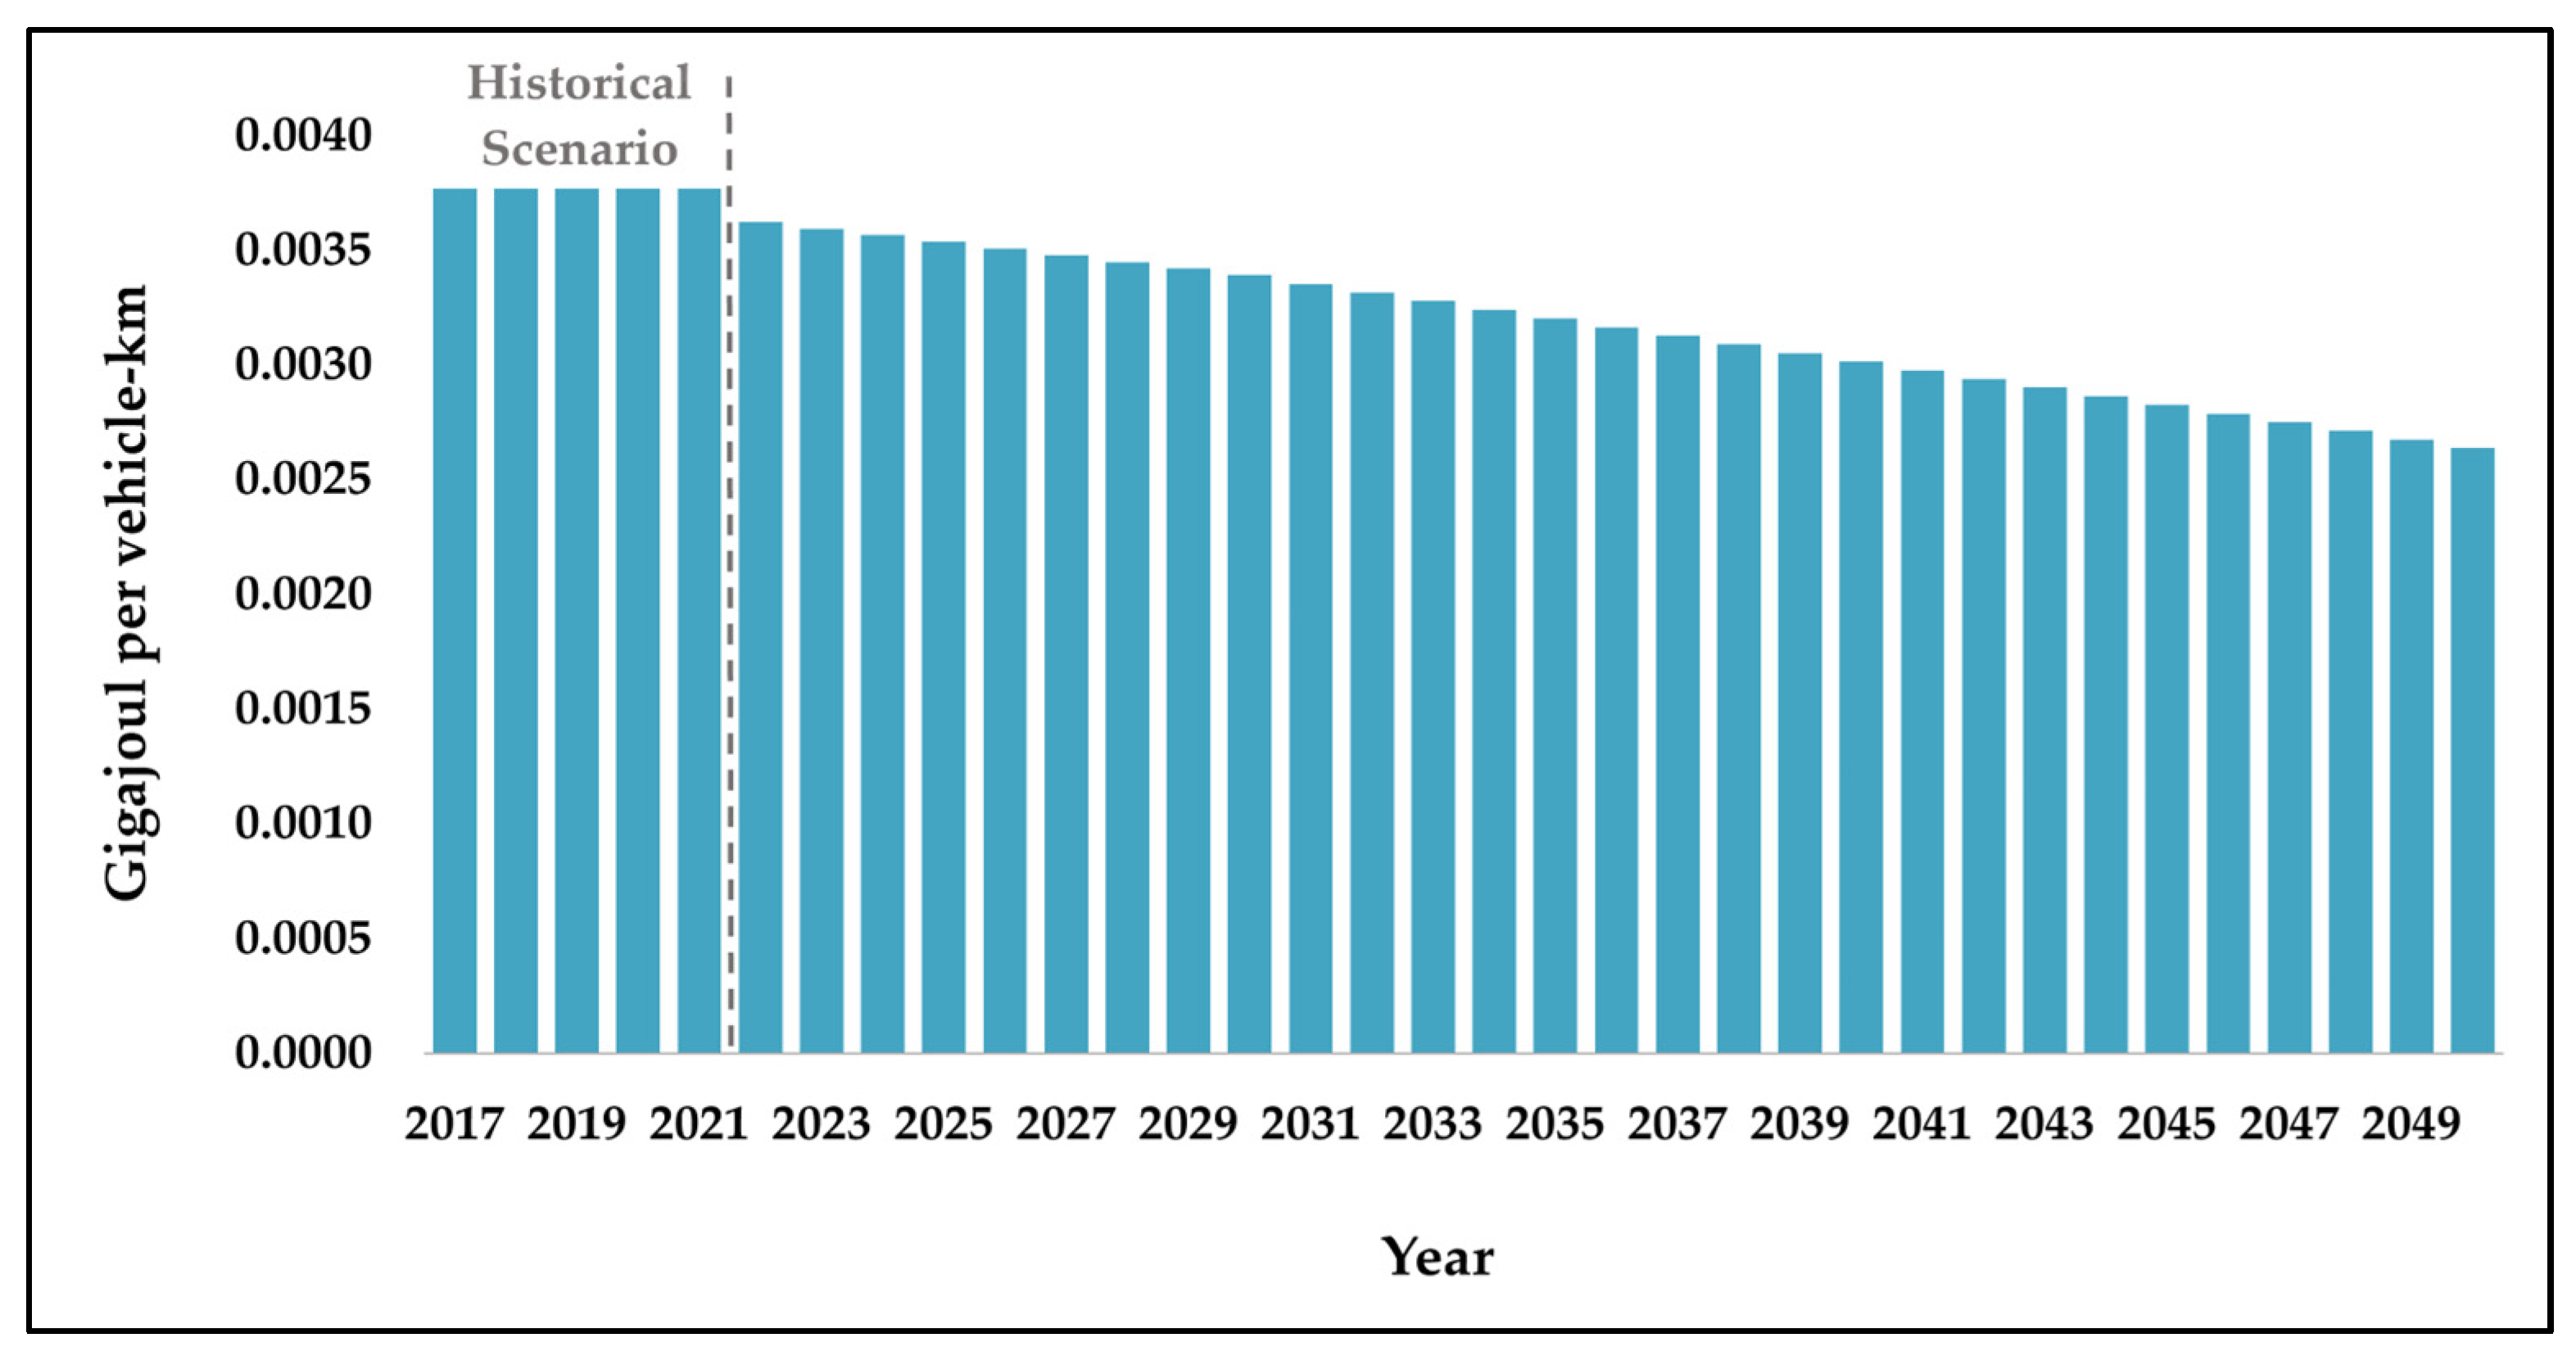
Figure 12.
The gradual reduction in energy intensity when the improvements are implemented for public transportation (fuel-economy scenario).
Figure 12.
The gradual reduction in energy intensity when the improvements are implemented for public transportation (fuel-economy scenario).
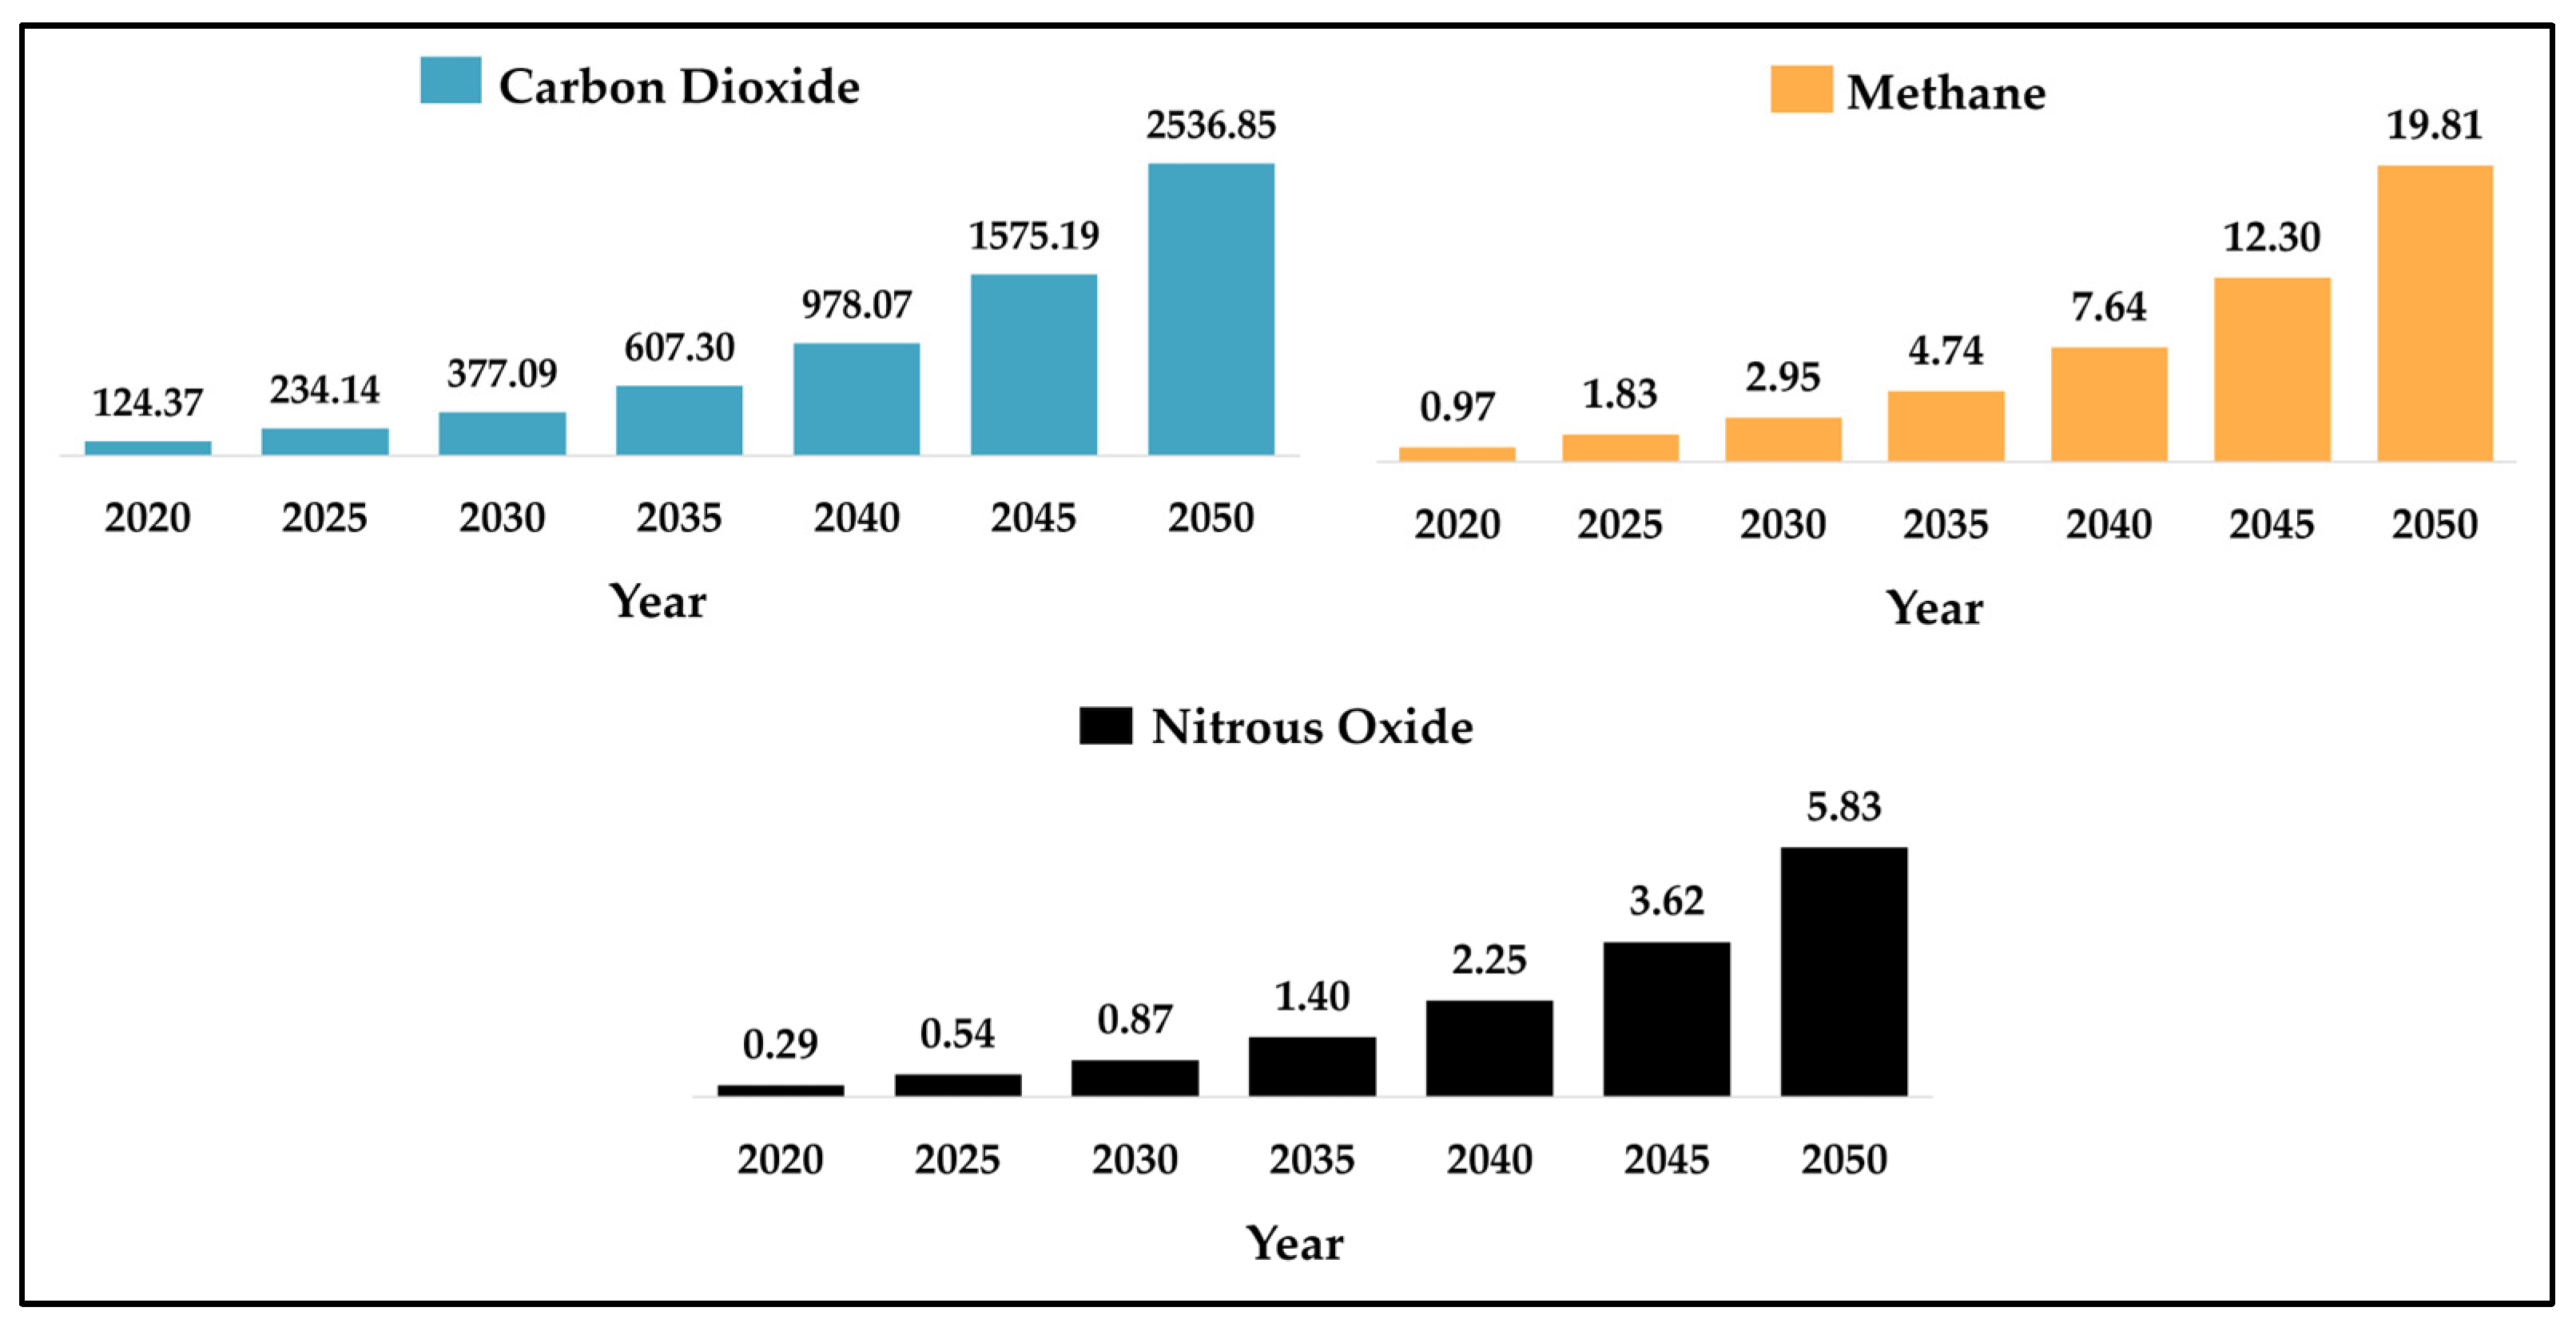
Figure 13.
Total GHG emissions from road transportation under the baseline scenario, measured in thousand metric tons of carbon equivalent using a 100-year GWP.
Figure 13.
Total GHG emissions from road transportation under the baseline scenario, measured in thousand metric tons of carbon equivalent using a 100-year GWP.
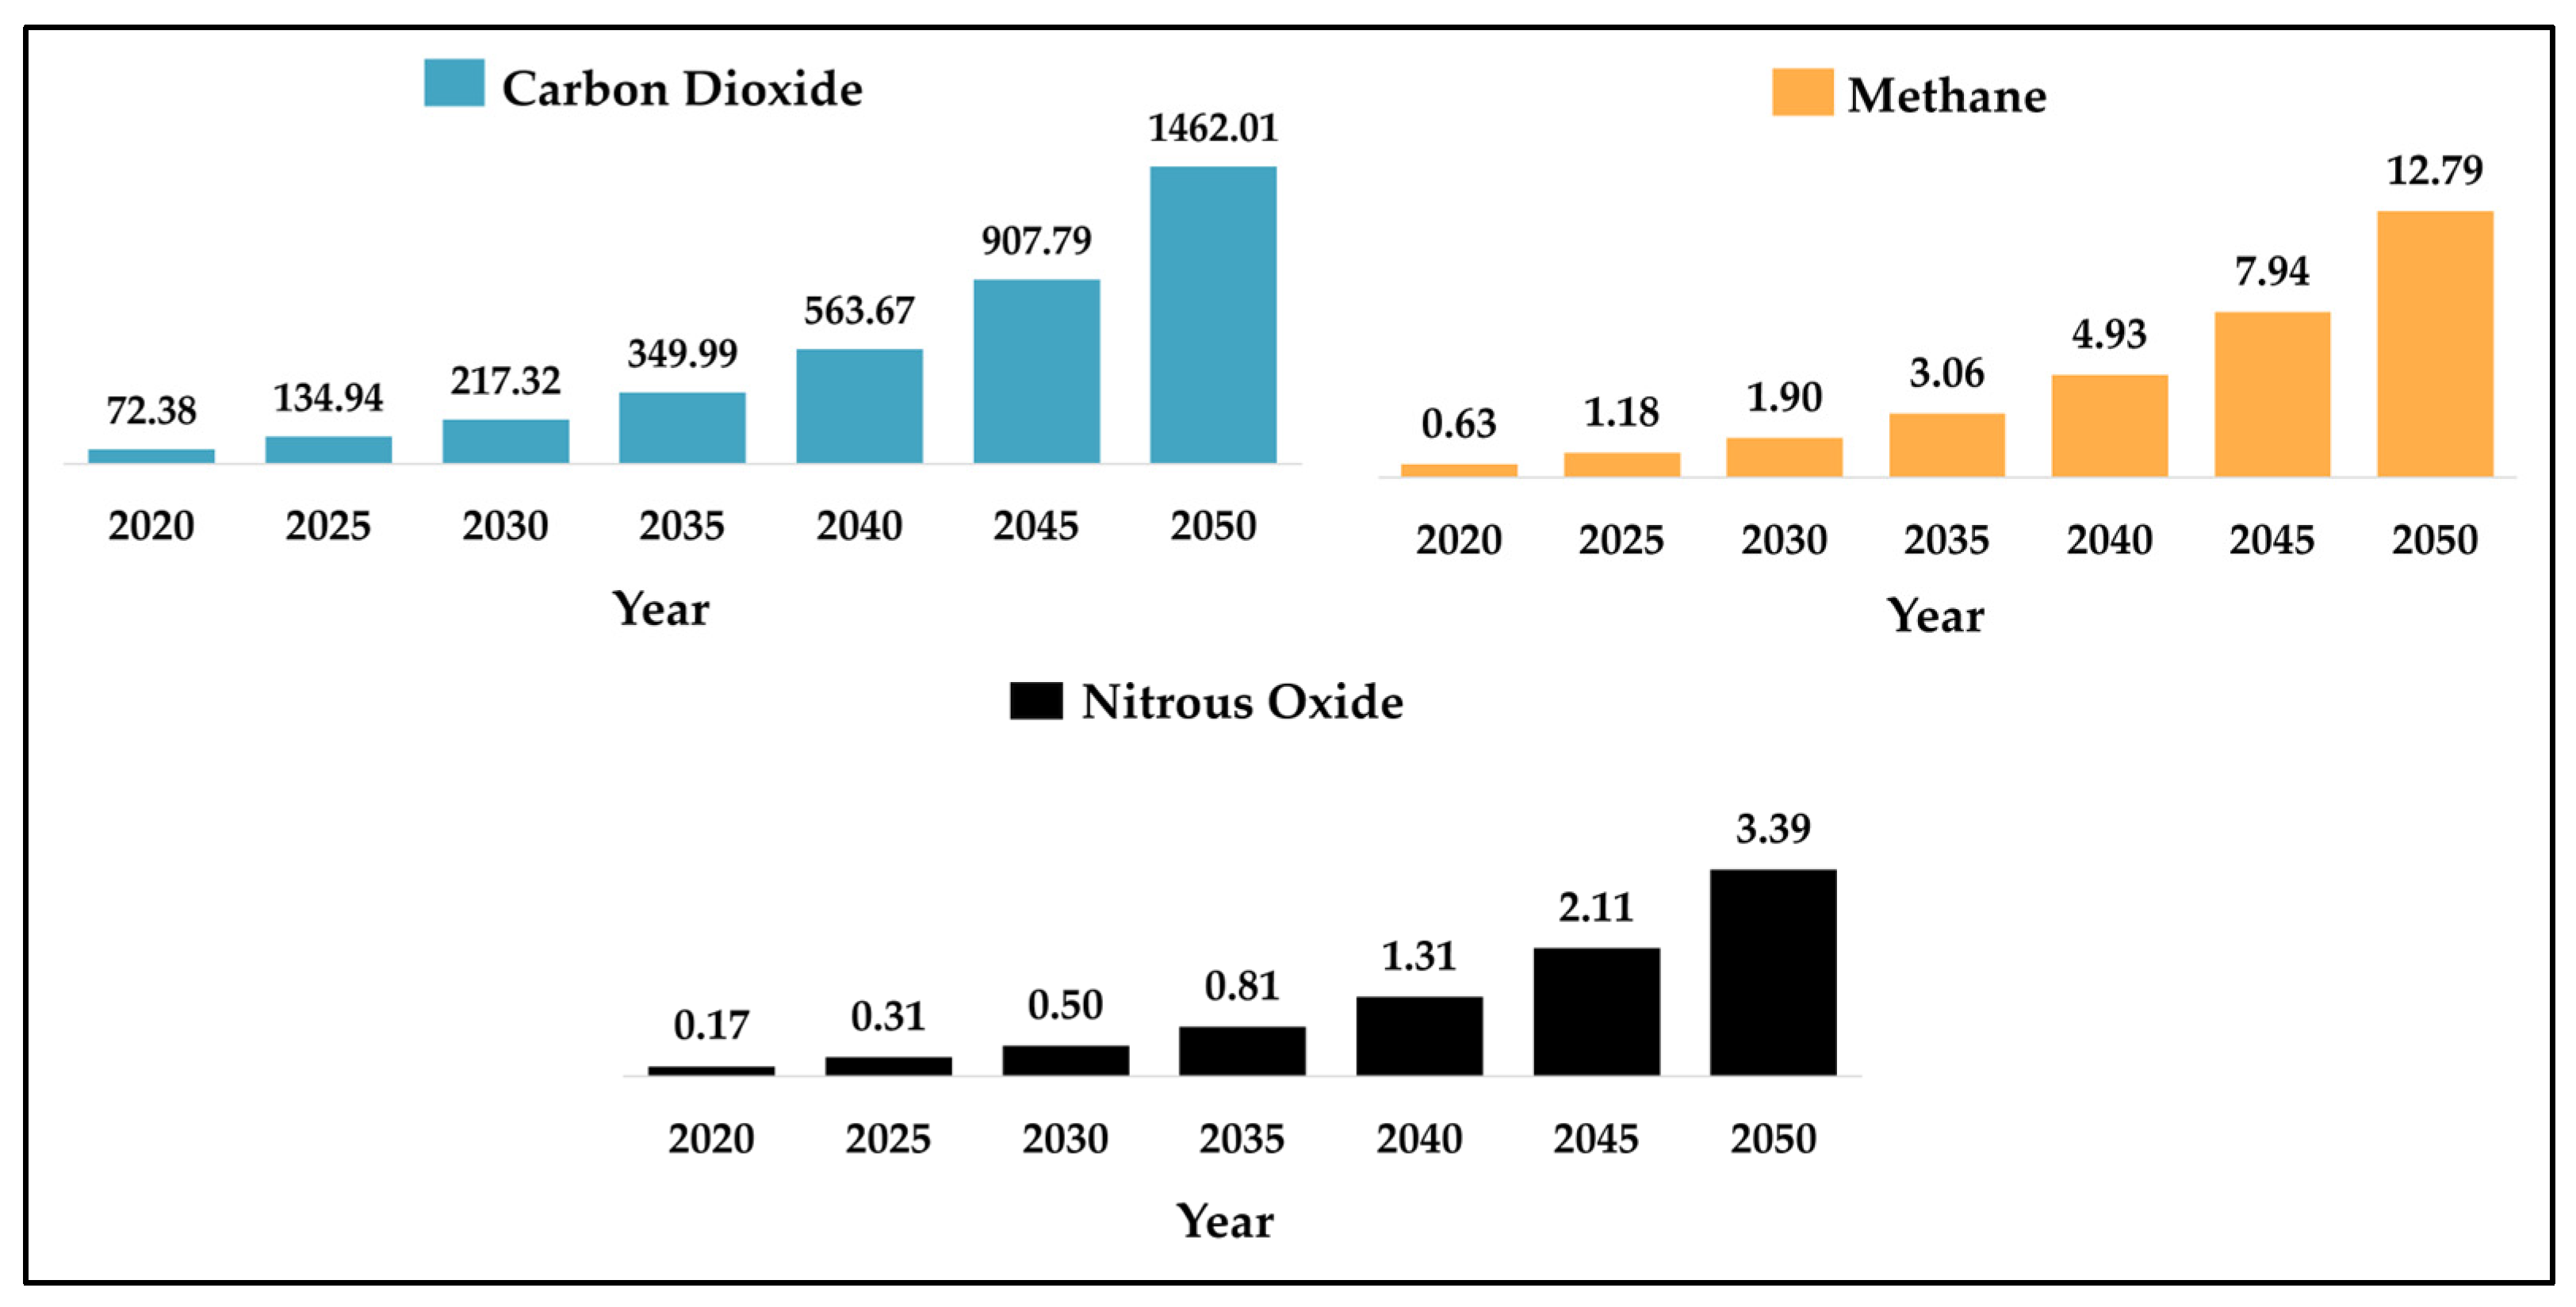
Figure 14.
GHG emissions from LDVs under the baseline scenario, measured in thousand metric tons of carbon equivalent using a 100-year GWP.
Figure 14.
GHG emissions from LDVs under the baseline scenario, measured in thousand metric tons of carbon equivalent using a 100-year GWP.
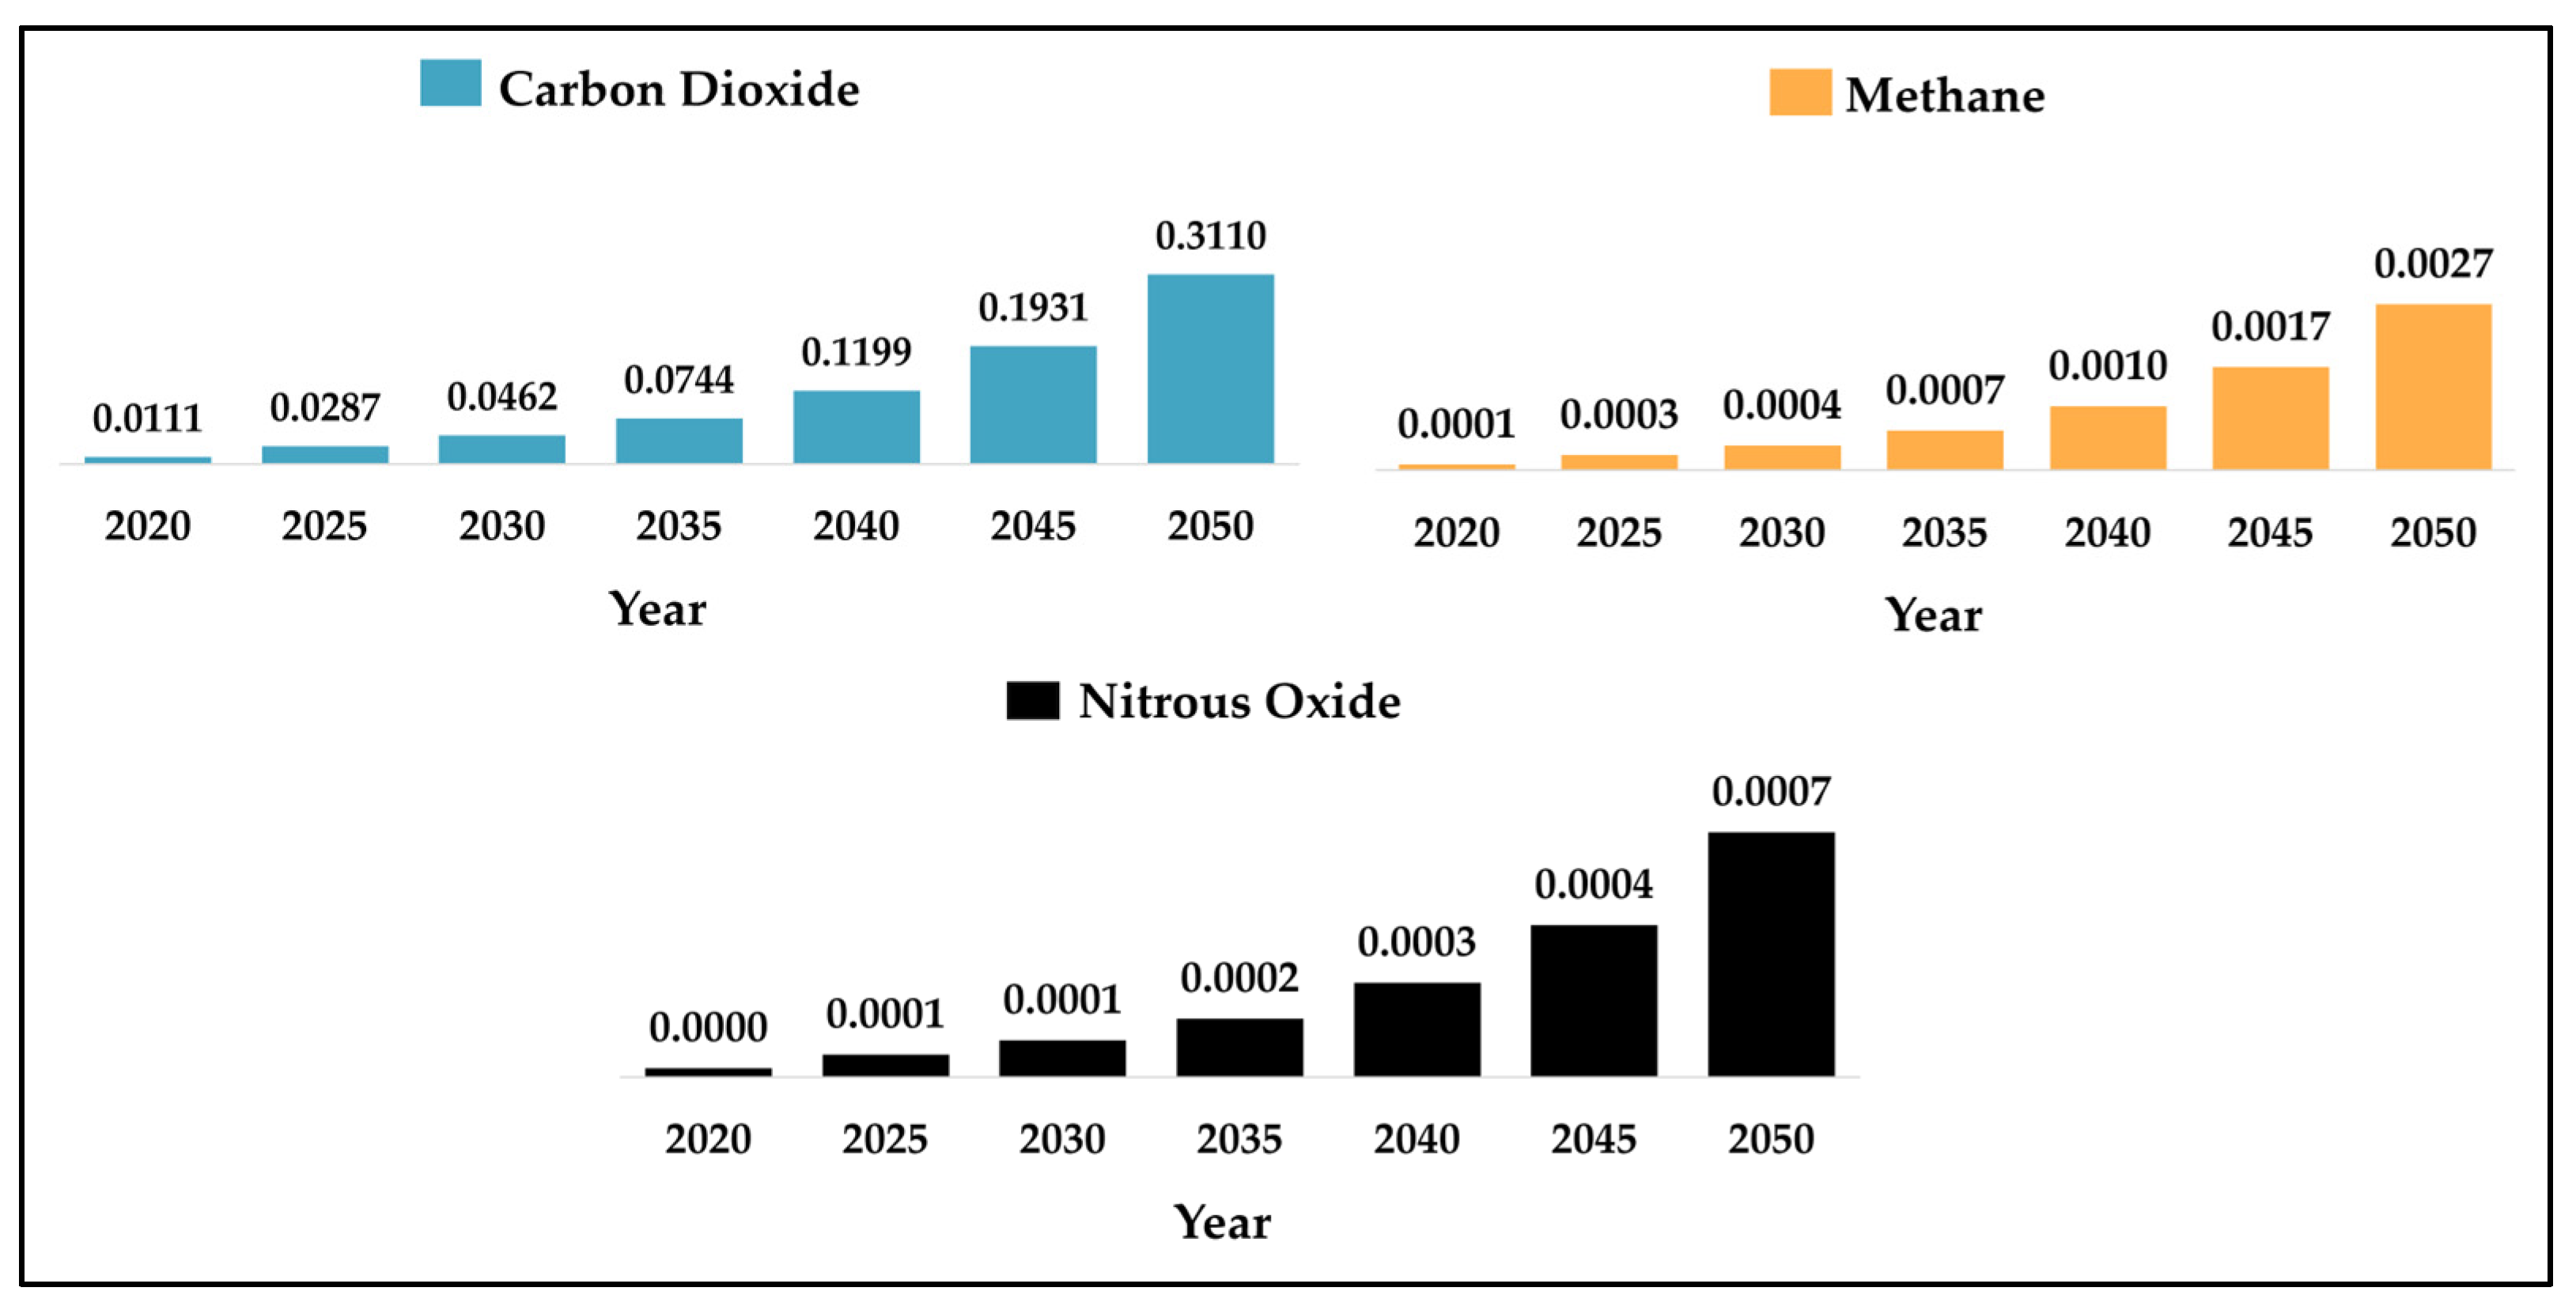
Figure 15.
GHG emissions from motorcycles under the baseline scenario, measured in thousand metric tons of carbon equivalent using 100-year GWP.
Figure 15.
GHG emissions from motorcycles under the baseline scenario, measured in thousand metric tons of carbon equivalent using 100-year GWP.
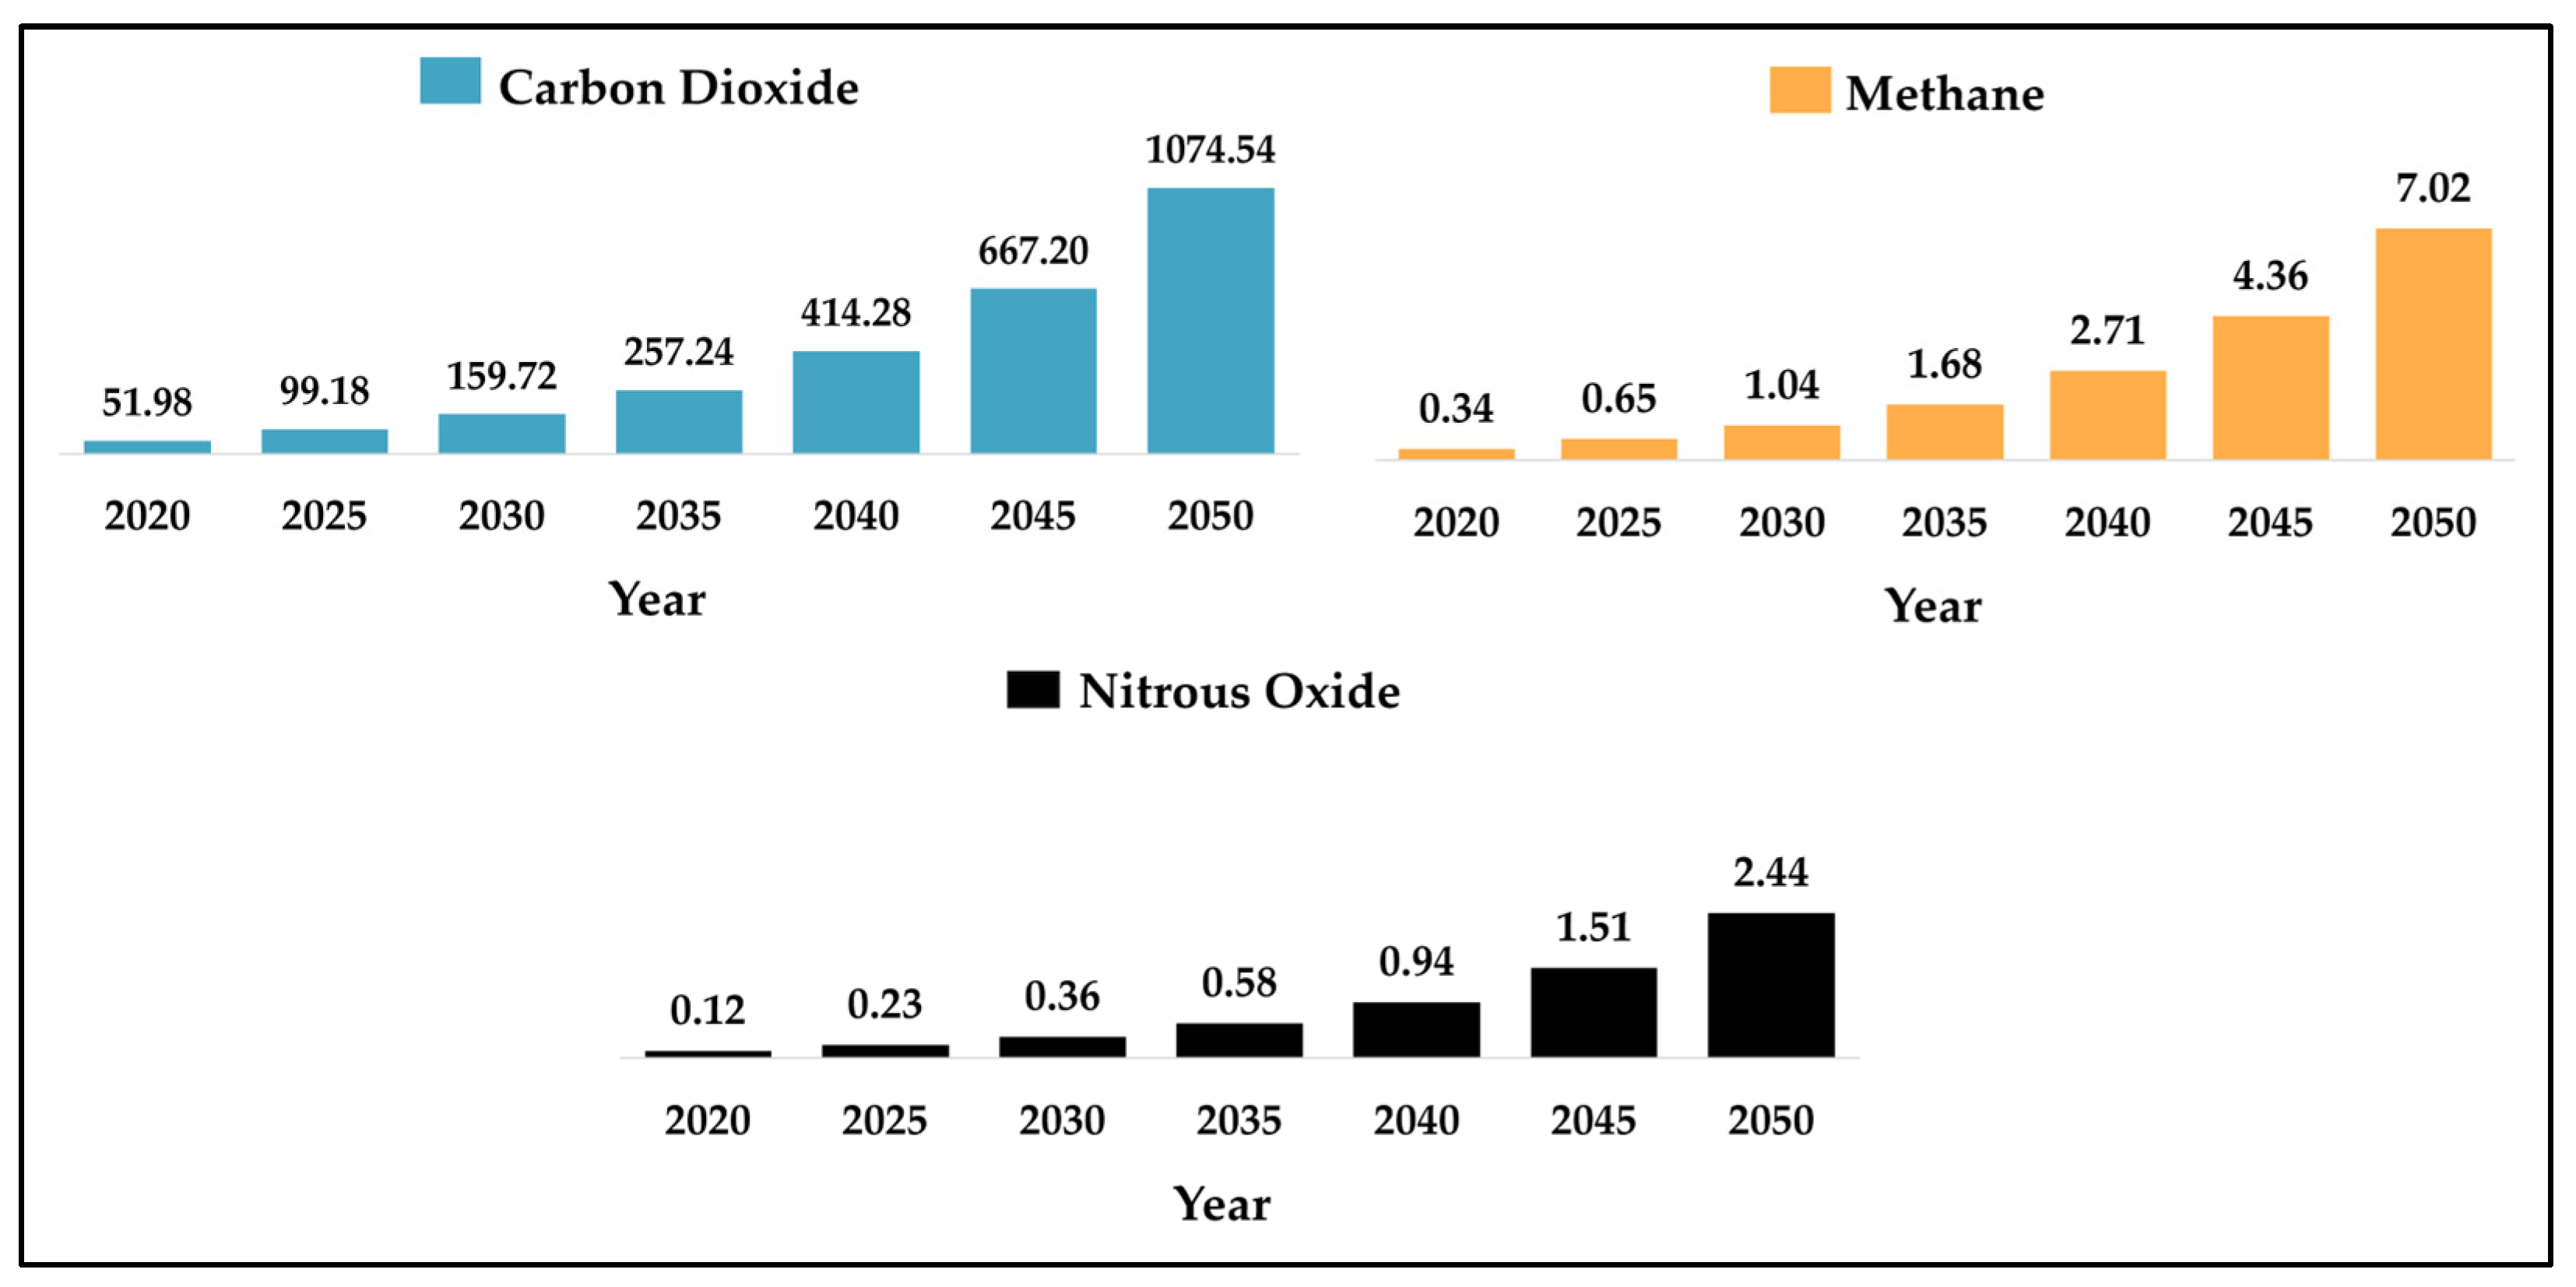
Figure 16.
GHG emissions from HDVs under the baseline scenario, measured in thousand metric tons of carbon equivalent using 100-year GWP.
Figure 16.
GHG emissions from HDVs under the baseline scenario, measured in thousand metric tons of carbon equivalent using 100-year GWP.
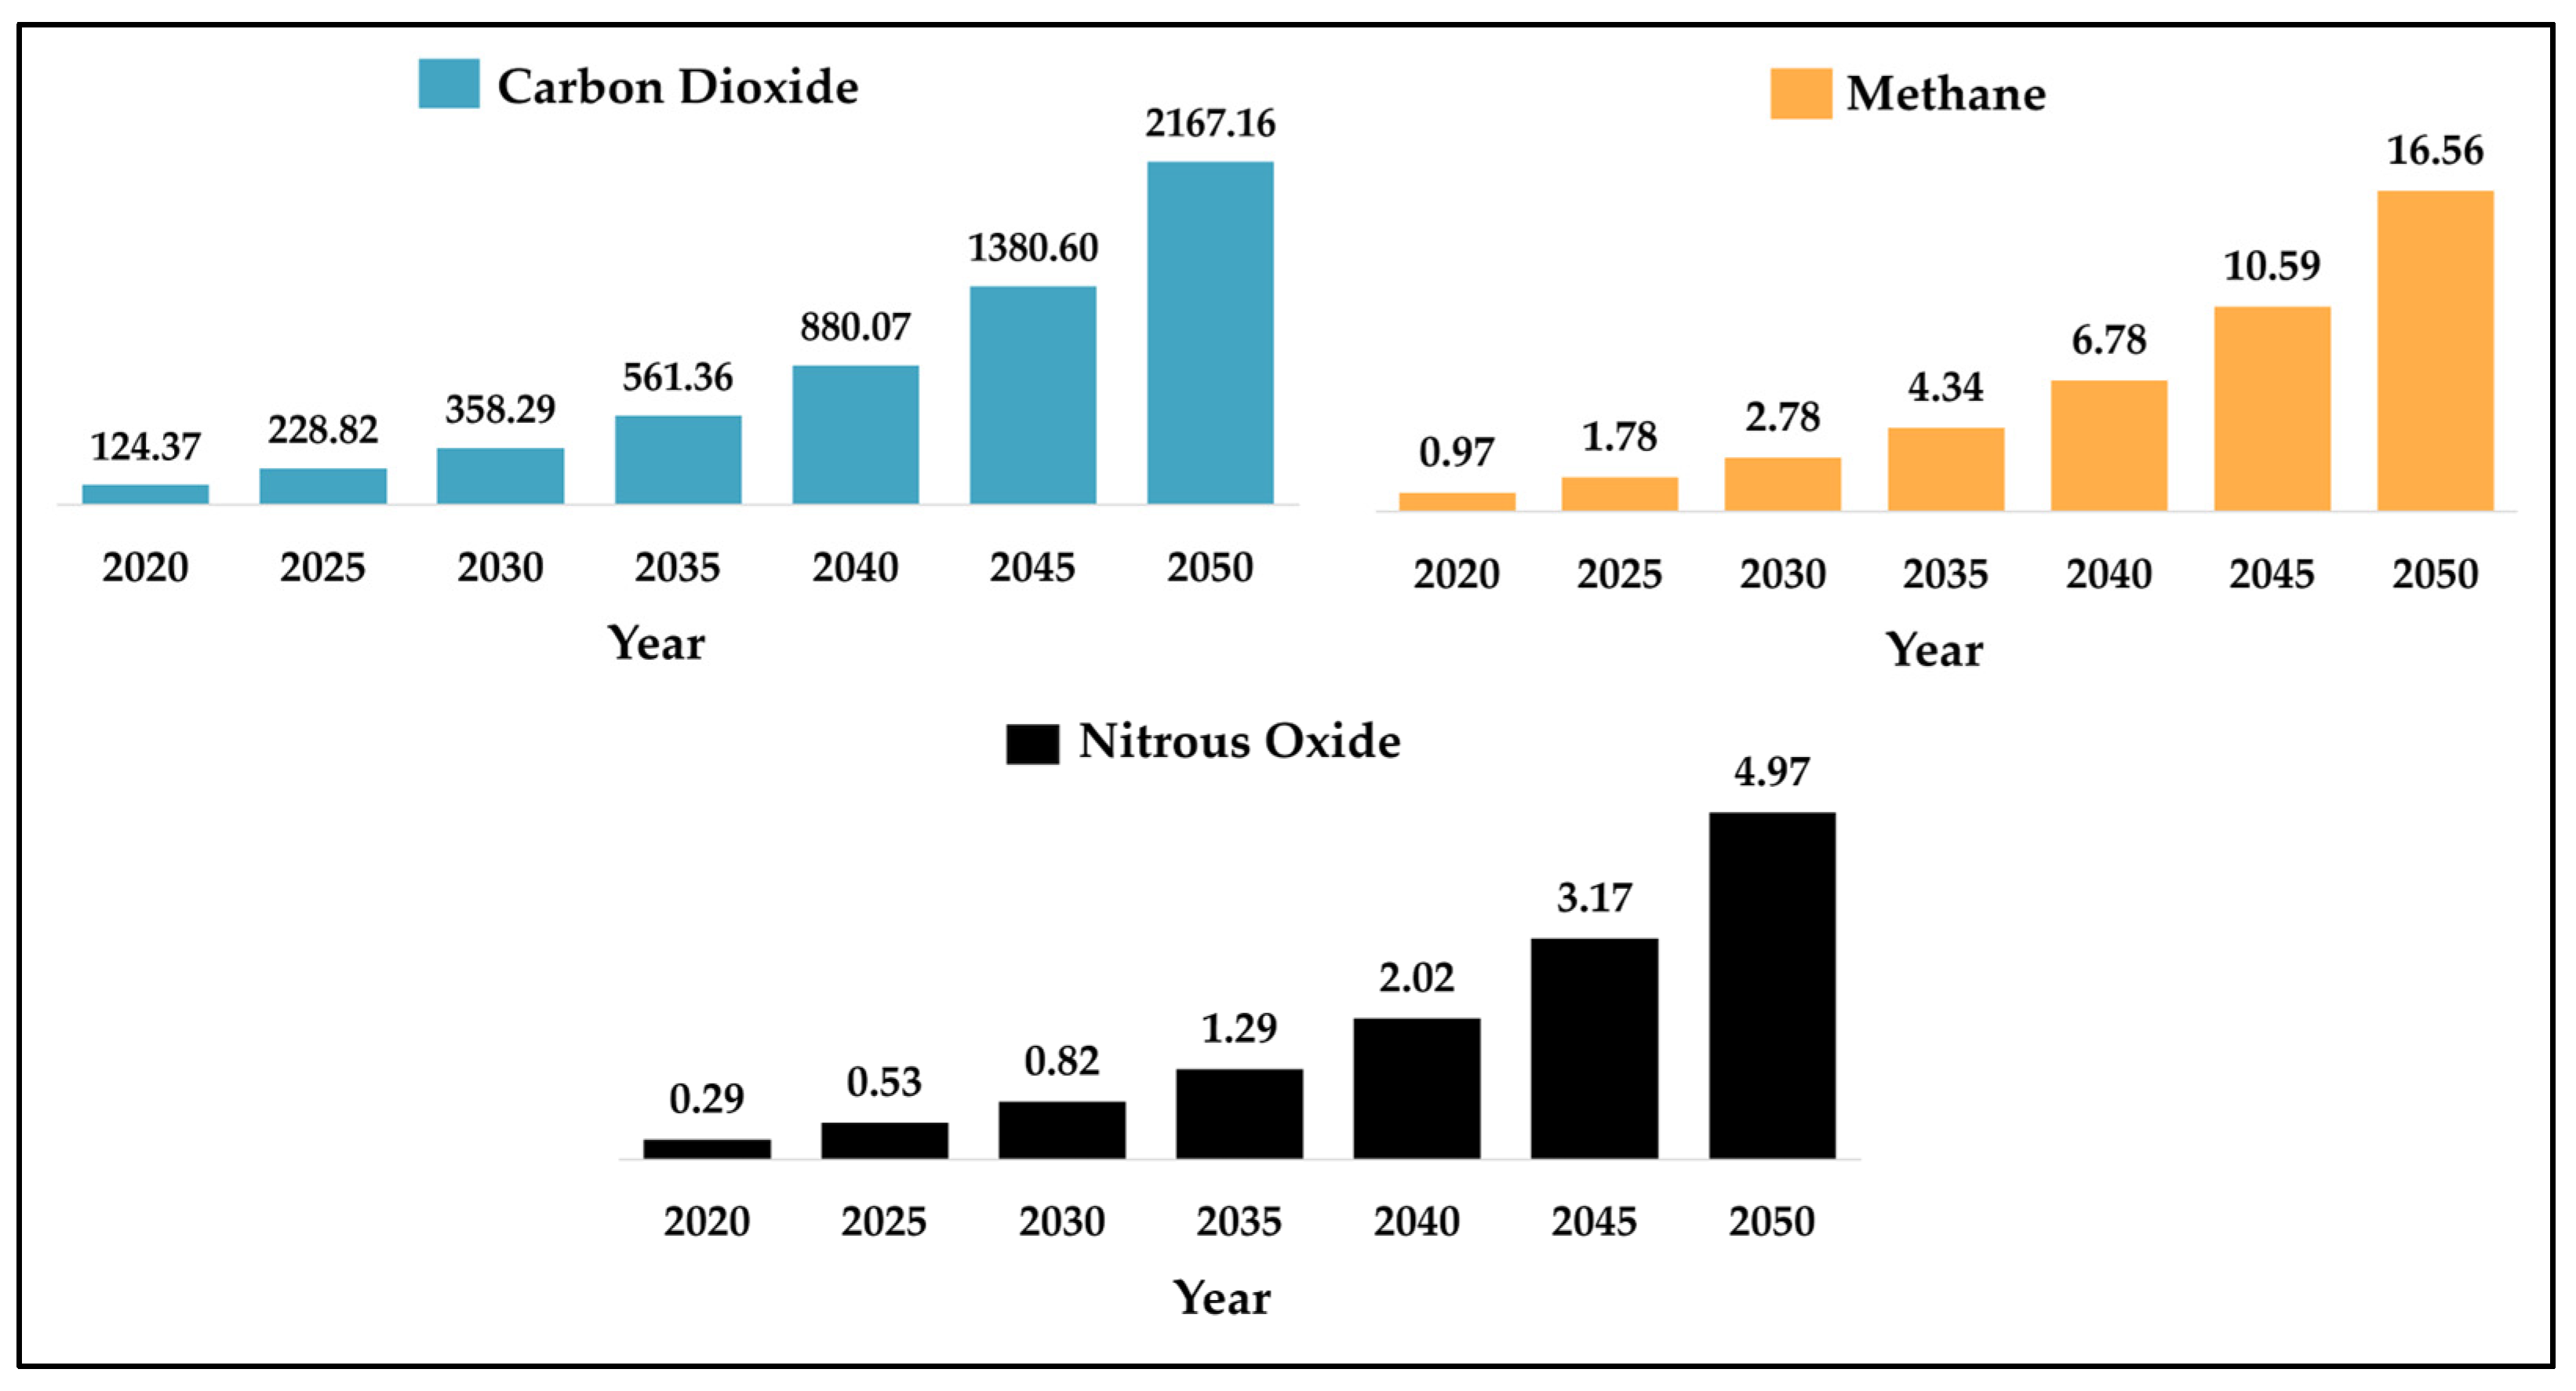
Figure 17.
GHG emissions from the public transport scenario, measured in thousand metric tons of carbon equivalent using 100-year GWP.
Figure 17.
GHG emissions from the public transport scenario, measured in thousand metric tons of carbon equivalent using 100-year GWP.
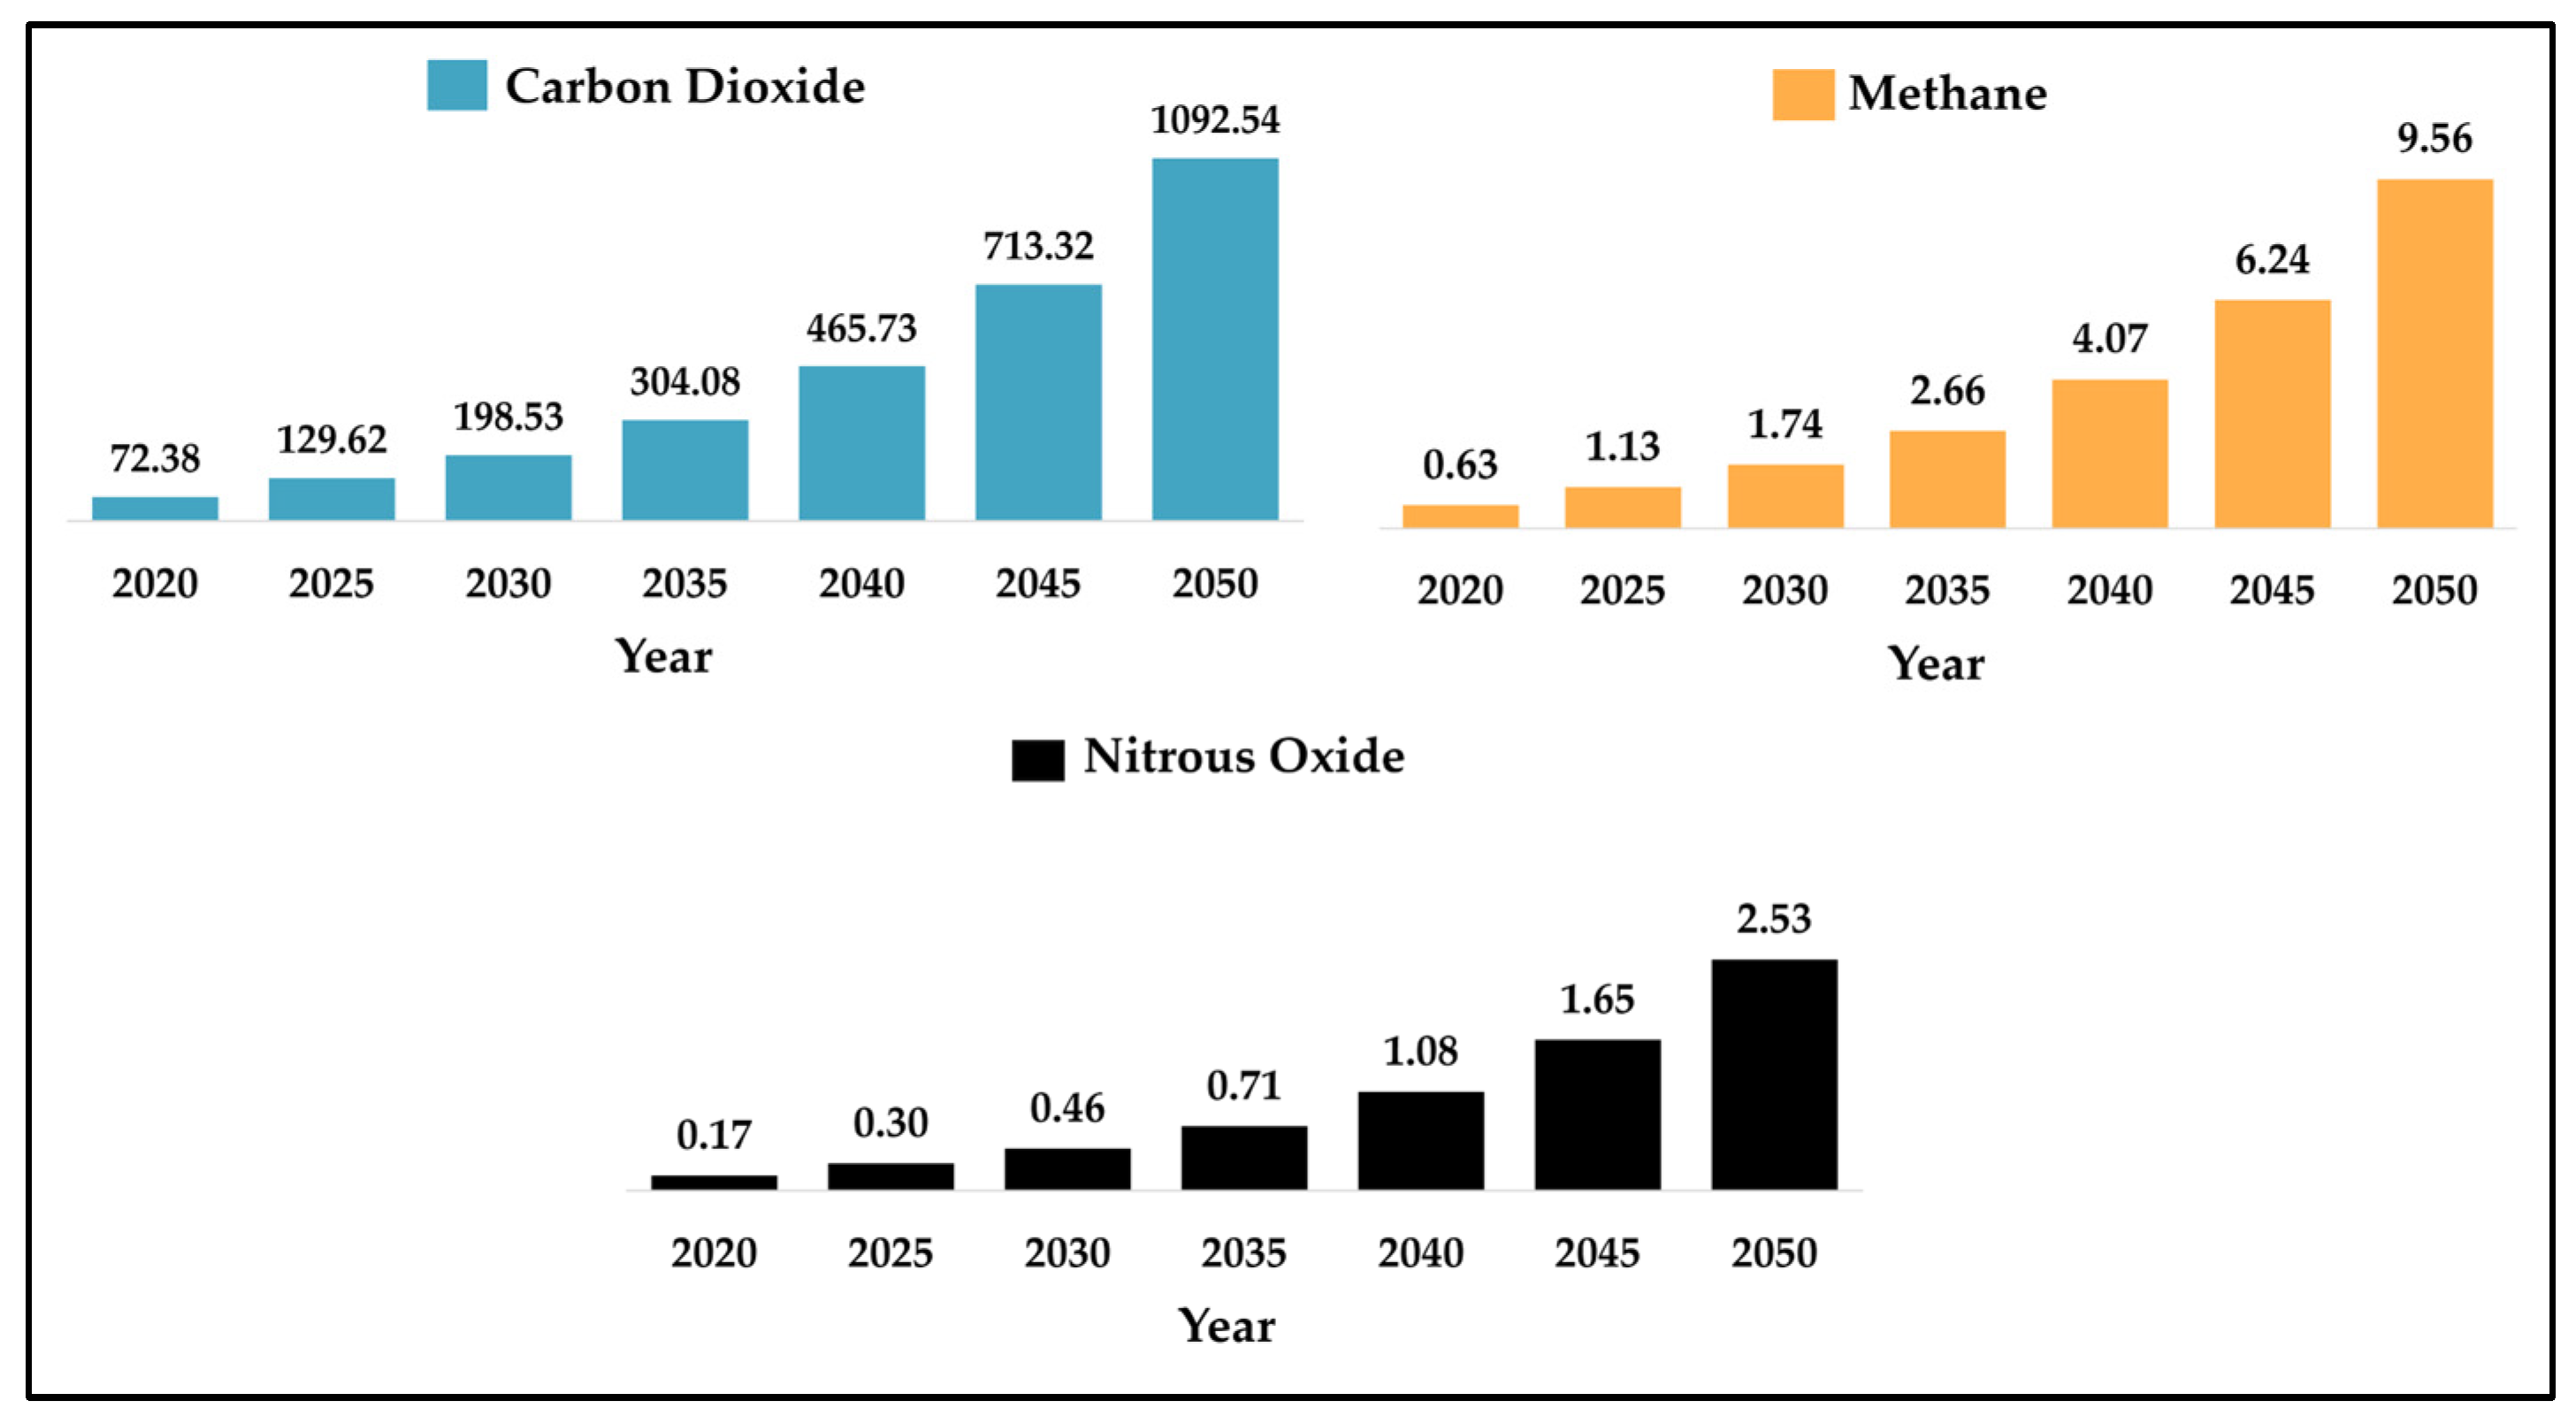
Figure 18.
GHG emissions from LDVs under the public transport scenario, measured in thousand metric tons carbon equivalent using 100-year GWP.
Figure 18.
GHG emissions from LDVs under the public transport scenario, measured in thousand metric tons carbon equivalent using 100-year GWP.
Figure 19.
GHG emissions from motorcycles under the public transport scenario, measured in thousand metric tons of carbon equivalent using 100-year GWP.
Figure 19.
GHG emissions from motorcycles under the public transport scenario, measured in thousand metric tons of carbon equivalent using 100-year GWP.
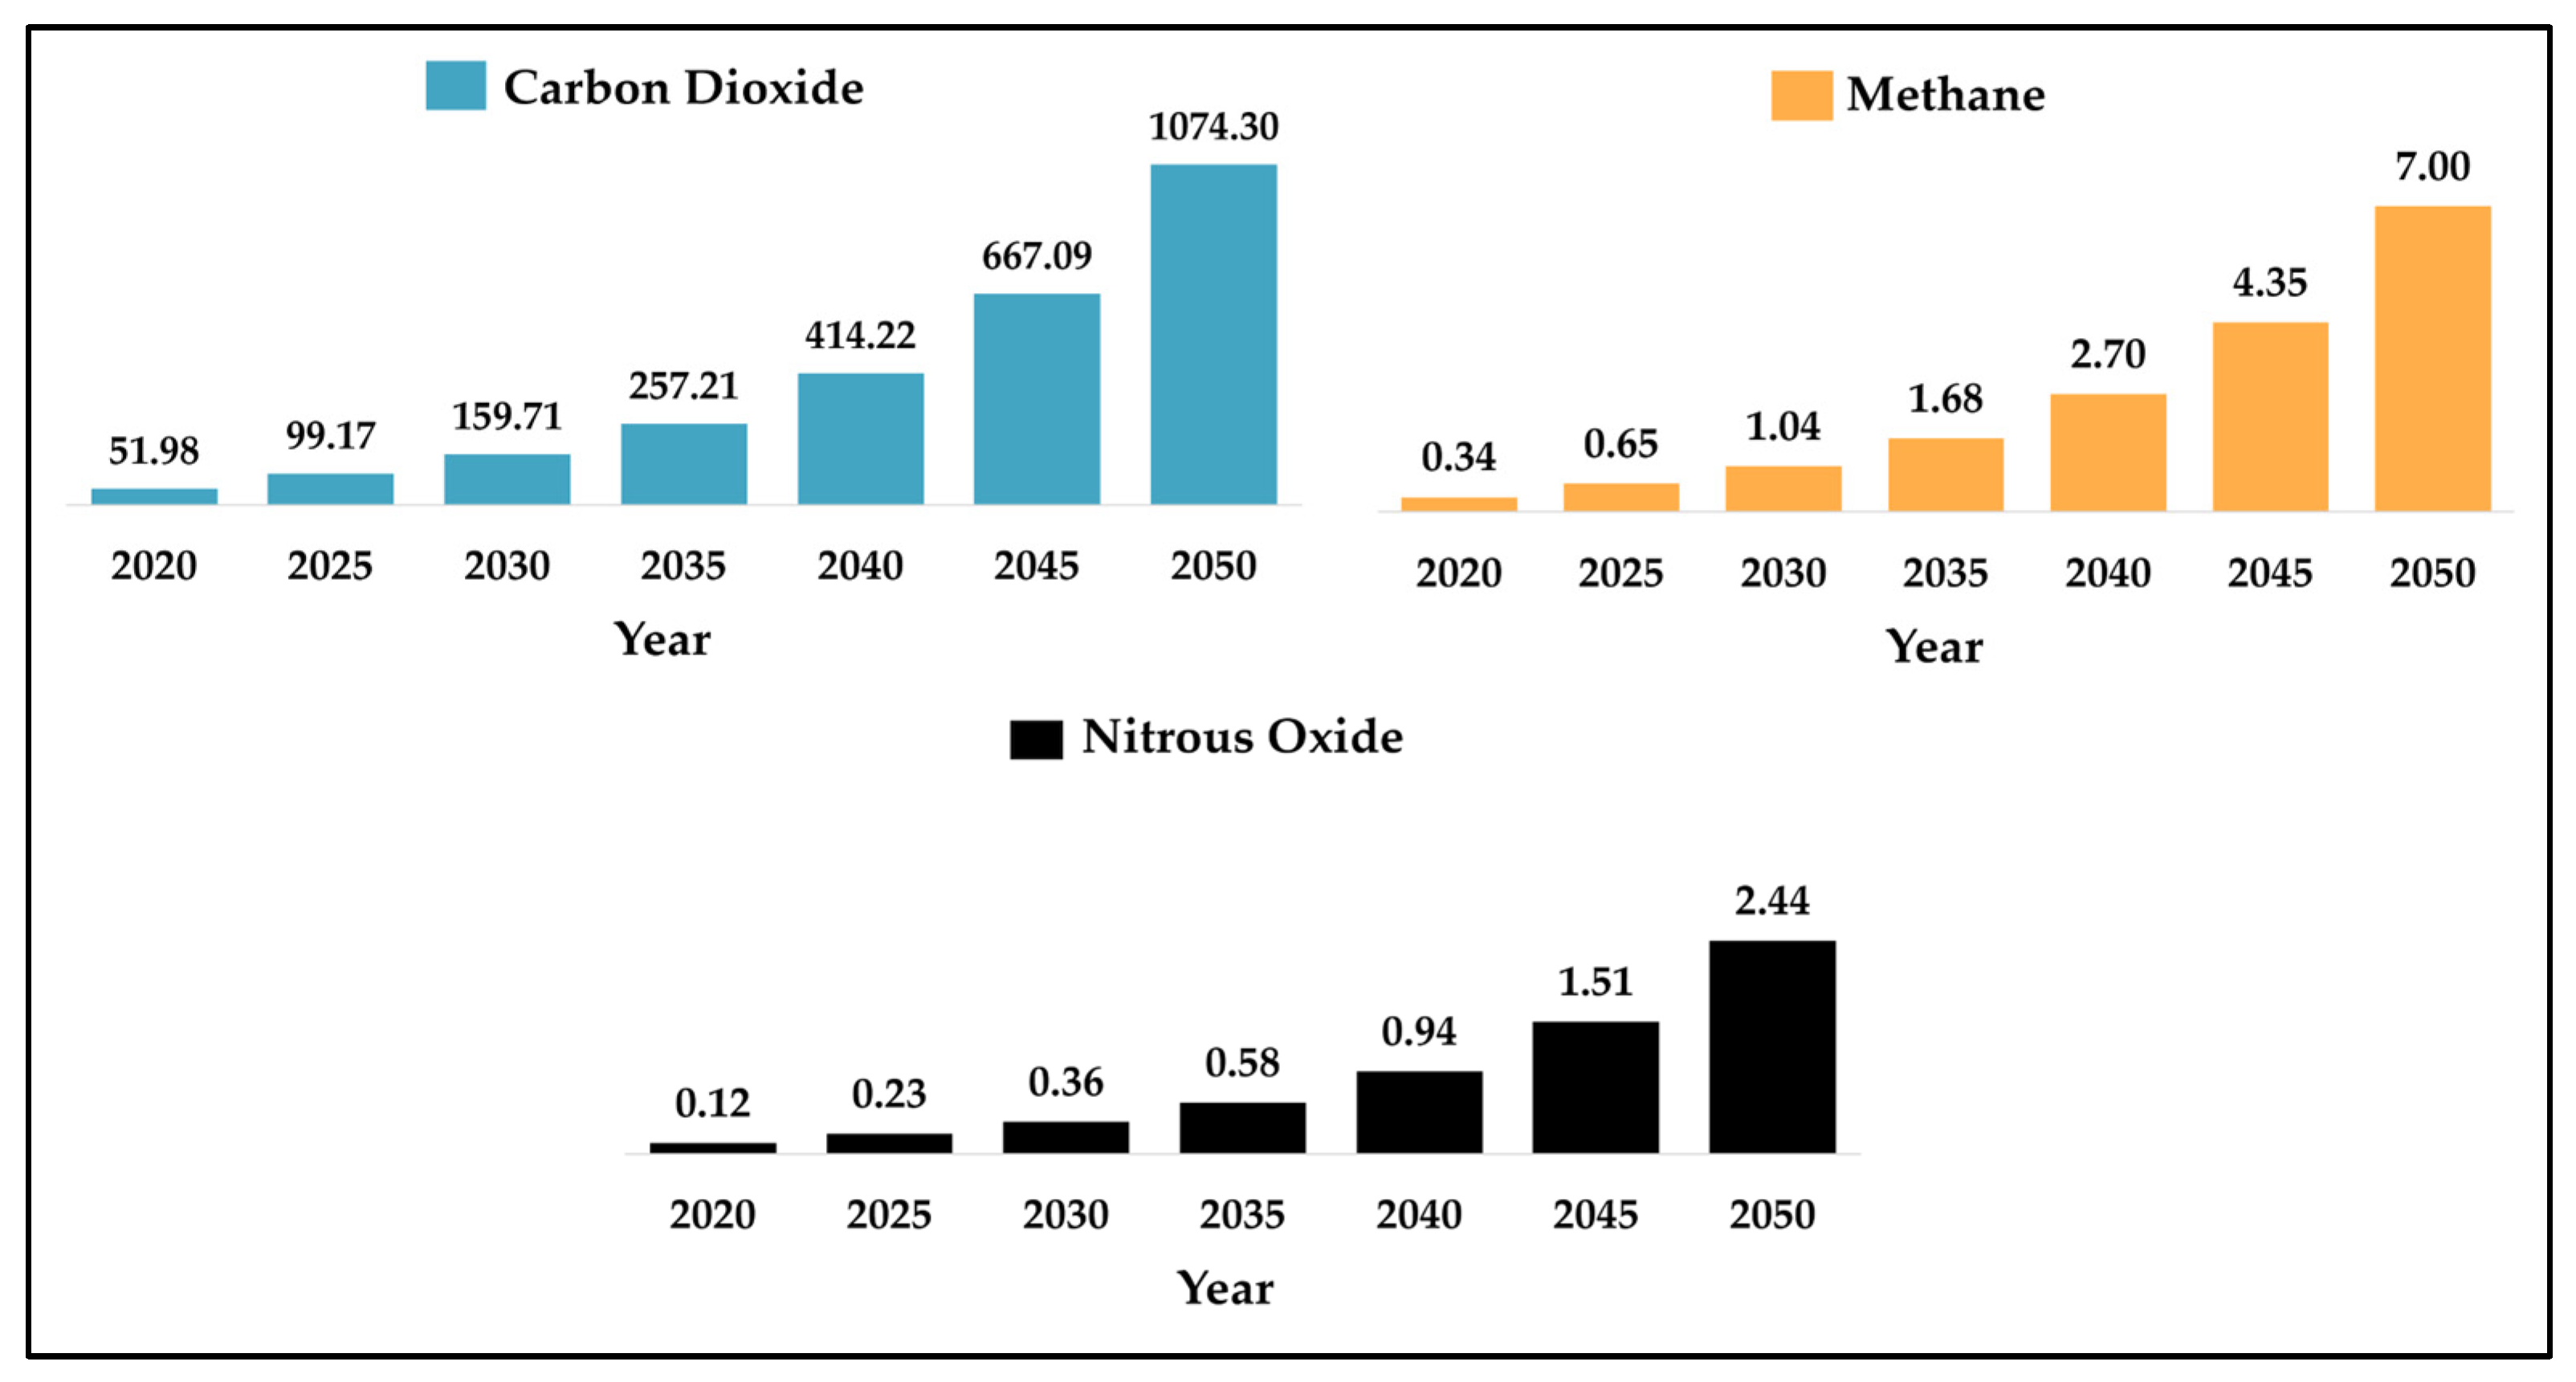
Figure 20.
GHG emissions from HDVs under the public transport scenario, measured in thousand metric tons of carbon equivalent using 100-year GWP.
Figure 20.
GHG emissions from HDVs under the public transport scenario, measured in thousand metric tons of carbon equivalent using 100-year GWP.
Table 1.
Modeling periods used for LEAP in this study.
Table 1.
Modeling periods used for LEAP in this study.
| Period | Timeline |
|---|
| Historical scenario | 2017–2021 |
| Future scenario | 2022–2050 |
Table 2.
The annual traveled distance percent shareof LDV, motorcycles, and HDV from 2017 to 2021 in Qatar (Historical scenario).
Table 2.
The annual traveled distance percent shareof LDV, motorcycles, and HDV from 2017 to 2021 in Qatar (Historical scenario).
| Branch | 2017 | 2018 | 2019 | 2020 | 2021 |
|---|
| LDV | 61.444 | 61.387 | 62.547 | 61.654 | 61.105 |
| Motorcycle | 0.007 | 0.007 | 0.006 | 0.008 | 0.011 |
| HDV | 38.549 | 38.606 | 37.447 | 38.338 | 38.885 |
Table 3.
The percent share of fuel used per vehicle km traveled by light-duty vehicles (Historical scenario).
Table 3.
The percent share of fuel used per vehicle km traveled by light-duty vehicles (Historical scenario).
| Branch | 2017 | 2018 | 2019 | 2020 | 2021 |
|---|
| Gasoline | 99.96 | 99.94 | 99.95 | 99.93 | 99.95 |
| Diesel | 0.04 | 0.06 | 0.06 | 0.07 | 0.05 |
Table 4.
The percent share of private, governmental, and diplomatic vehicles from 2017 to 2021 in Qatar (Historical scenario).
Table 4.
The percent share of private, governmental, and diplomatic vehicles from 2017 to 2021 in Qatar (Historical scenario).
| Branch | 2017 | 2018 | 2019 | 2020 | 2021 |
|---|
| Private Vehicles | 99.919 | 99.932 | 99.928 | 99.940 | 99.953 |
| Governmental | 0.001 | 0.004 | 0.005 | 0.005 | 0.004 |
| Diplomatic | 0.080 | 0.064 | 0.069 | 0.055 | 0.043 |
Table 5.
The percentage share of vehicle km traveled annually by public and private transport from 2017 to 2021 (Historical scenario).
Table 5.
The percentage share of vehicle km traveled annually by public and private transport from 2017 to 2021 (Historical scenario).
| Branch | 2017 | 2018 | 2019 | 2020 | 2021 |
|---|
| Public Transportation | 1.34 | 1.59 | 1.83 | 1.47 | 1.47 |
| Private Transportation | 98.66 | 98.41 | 98.17 | 98.53 | 98.53 |
Table 6.
Total GHG emissions from road transportation under the baseline scenario, measured in thousand metric tons of carbon equivalent.
Table 6.
Total GHG emissions from road transportation under the baseline scenario, measured in thousand metric tons of carbon equivalent.
| GHG | 2020 | 2025 | 2030 | 2035 | 2040 | 2045 | 2050 | Total |
|---|
| Carbon Dioxide | 124.37 | 234.14 | 377.09 | 607.30 | 978.07 | 1575.19 | 2536.85 | 6433.00 |
| Methane | 0.97 | 1.83 | 2.95 | 4.74 | 7.64 | 12.30 | 19.81 | 50.24 |
| Nitrous Oxide | 0.29 | 0.54 | 0.87 | 1.40 | 2.25 | 3.62 | 5.83 | 14.78 |
| Total | 125.63 | 236.51 | 380.90 | 613.44 | 987.95 | 1591.11 | 2562.50 | 6498.03 |
Table 7.
GHG emissions from LDVs under the baseline scenario, measured in thousand metric tons of carbon equivalent.
Table 7.
GHG emissions from LDVs under the baseline scenario, measured in thousand metric tons of carbon equivalent.
| GHG | 2020 | 2025 | 2030 | 2035 | 2040 | 2045 | 2050 | Total |
|---|
| Carbon Dioxide | 72.38 | 134.94 | 217.32 | 349.99 | 563.67 | 907.79 | 1462.01 | 3708.09 |
| Methane | 0.63 | 1.18 | 1.90 | 3.06 | 4.93 | 7.94 | 12.79 | 32.43 |
| Nitrous Oxide | 0.17 | 0.31 | 0.50 | 0.81 | 1.31 | 2.11 | 3.39 | 8.60 |
| Total | 73.18 | 136.43 | 219.72 | 353.87 | 569.90 | 917.84 | 1478.18 | 3749.12 |
Table 8.
GHG emissions resulting from motorcycles under the baseline scenario, measured in thousand metric tons of carbon equivalent.
Table 8.
GHG emissions resulting from motorcycles under the baseline scenario, measured in thousand metric tons of carbon equivalent.
| GHG | 2020 | 2025 | 2030 | 2035 | 2040 | 2045 | 2050 | Total |
|---|
| Carbon Dioxide | 0.0111 | 0.0287 | 0.0462 | 0.0744 | 0.1199 | 0.1931 | 0.3110 | 0.7844 |
| Methane | 0.0001 | 0.0003 | 0.0004 | 0.0007 | 0.0010 | 0.0017 | 0.0027 | 0.0069 |
| Nitrous Oxide | 0.0000 | 0.0001 | 0.0001 | 0.0002 | 0.0003 | 0.0004 | 0.0007 | 0.0018 |
| Total | 0.0112 | 0.0290 | 0.0467 | 0.0753 | 0.1212 | 0.1952 | 0.3144 | 0.7931 |
Table 9.
GHG emissions resulting from HDVs under the baseline scenario, measured in thousand metric tons of carbon equivalent.
Table 9.
GHG emissions resulting from HDVs under the baseline scenario, measured in thousand metric tons of carbon equivalent.
| GHG | 2020 | 2025 | 2030 | 2035 | 2040 | 2045 | 2050 | Total |
|---|
| Carbon Dioxide | 51.98 | 99.18 | 159.72 | 257.24 | 414.28 | 667.20 | 1074.54 | 2724.13 |
| Methane | 0.34 | 0.65 | 1.04 | 1.68 | 2.71 | 4.36 | 7.02 | 17.80 |
| Nitrous Oxide | 0.12 | 0.23 | 0.36 | 0.58 | 0.94 | 1.51 | 2.44 | 6.18 |
| Total | 52.43 | 100.05 | 161.13 | 259.50 | 417.93 | 673.08 | 1084.00 | 2748.11 |
Table 10.
GHG emissions from public transport scenario, measured in thousand metric tons carbon equivalent.
Table 10.
GHG emissions from public transport scenario, measured in thousand metric tons carbon equivalent.
| GHG | 2020 | 2025 | 2030 | 2035 | 2040 | 2045 | 2050 | Total |
|---|
| Carbon Dioxide | 124.37 | 228.82 | 358.29 | 561.36 | 880.07 | 1380.60 | 2167.16 | 5700.68 |
| Methane | 0.97 | 1.78 | 2.78 | 4.34 | 6.78 | 10.59 | 16.56 | 43.79 |
| Nitrous Oxide | 0.29 | 0.53 | 0.82 | 1.29 | 2.02 | 3.17 | 4.97 | 13.09 |
| Total | 125.63 | 231.13 | 361.89 | 566.99 | 888.87 | 1394.36 | 2188.69 | 5757.56 |
Table 11.
GHG emissions from LDVs under the public transport scenario, measured in thousand metric tons carbon equivalent.
Table 11.
GHG emissions from LDVs under the public transport scenario, measured in thousand metric tons carbon equivalent.
| GHG | 2020 | 2025 | 2030 | 2035 | 2040 | 2045 | 2050 | Total |
|---|
| Carbon Dioxide | 72.38 | 129.62 | 198.53 | 304.08 | 465.73 | 713.32 | 1092.54 | 2976.21 |
| Methane | 0.63 | 1.13 | 1.74 | 2.66 | 4.07 | 6.24 | 9.56 | 26.03 |
| Nitrous Oxide | 0.17 | 0.30 | 0.46 | 0.71 | 1.08 | 1.65 | 2.53 | 6.90 |
| Total | 73.18 | 131.06 | 200.73 | 307.44 | 470.88 | 721.22 | 1104.63 | 3009.14 |
Table 12.
GHG emissions resulting from motorcycles under the public transport scenario, measured in thousand metric tons of carbon equivalent.
Table 12.
GHG emissions resulting from motorcycles under the public transport scenario, measured in thousand metric tons of carbon equivalent.
| GHG | 2020 | 2025 | 2030 | 2035 | 2040 | 2045 | 2050 | Total |
|---|
| Carbon Dioxide | 0.0111 | 0.0287 | 0.0462 | 0.0744 | 0.1199 | 0.1931 | 0.3110 | 0.7844 |
| Methane | 0.0001 | 0.0003 | 0.0004 | 0.0007 | 0.0010 | 0.0017 | 0.0027 | 0.0069 |
| Nitrous Oxide | 0.0000 | 0.0001 | 0.0001 | 0.0002 | 0.0003 | 0.0004 | 0.0007 | 0.0018 |
| Total | 0.0112 | 0.0290 | 0.0467 | 0.0753 | 0.1212 | 0.1952 | 0.3144 | 0.7931 |
Table 13.
GHG emissions resulting from HDVs under the public transport scenario, measured in thousand metric tons of carbon equivalent.
Table 13.
GHG emissions resulting from HDVs under the public transport scenario, measured in thousand metric tons of carbon equivalent.
| GHG | 2020 | 2025 | 2030 | 2035 | 2040 | 2045 | 2050 | Total |
|---|
| Carbon Dioxide | 51.98 | 99.17 | 159.71 | 257.21 | 414.22 | 667.09 | 1074.30 | 2723.69 |
| Methane | 0.34 | 0.65 | 1.04 | 1.68 | 2.70 | 4.35 | 7.00 | 17.76 |
| Nitrous Oxide | 0.12 | 0.23 | 0.36 | 0.58 | 0.94 | 1.51 | 2.44 | 6.18 |
| Total | 52.43 | 100.05 | 161.12 | 259.47 | 417.87 | 672.95 | 1083.79 | 2747.62 |
Table 14.
The reduction in emissions from the public transport scenario to the baseline scenario, measured in thousand metric tons of carbon equivalent.
Table 14.
The reduction in emissions from the public transport scenario to the baseline scenario, measured in thousand metric tons of carbon equivalent.
| GHG | 2020 | 2025 | 2030 | 2035 | 2040 | 2045 | 2050 | Total |
|---|
| Carbon Dioxide | - | −5.31 | −18.79 | −45.94 | −97.99 | −194.58 | −369.69 | −732.32 |
| Methane | - | −0.04 | −0.16 | −0.40 | −0.86 | −1.71 | −3.25 | −6.44 |
| Nitrous Oxide | - | −0.01 | −0.04 | −0.10 | −0.22 | −0.45 | −0.85 | −1.69 |
| Total | - | −5.37 | −19.00 | −46.45 | −99.08 | −196.74 | −373.80 | −740.47 |
Table 15.
The percentage reduction in emissions from the public transport scenario to the baseline scenario between 2020 and 2050.
Table 15.
The percentage reduction in emissions from the public transport scenario to the baseline scenario between 2020 and 2050.
| GHG | 2020 | 2025 | 2030 | 2035 | 2040 | 2045 | 2050 | Total |
|---|
| Carbon Dioxide | 0% | 2.27% | 4.99% | 7.56% | 10.02% | 12.35% | 14.57% | 51.77% |
| Methane | 0% | 2.73% | 5.76% | 8.44% | 11.26% | 13.90% | 16.41% | 58.50% |
| Nitrous Oxide | 0% | 1.85% | 5.75% | 7.86% | 10.22% | 12.43% | 14.75% | 52.86% |
| Total | 0% | 6.86% | 16.50% | 23.86% | 31.50% | 38.69% | 45.73% | 163.13% |
Table 16.
The amount of reduction in emissions from the fuel economy scenario to the baseline scenario, measured in thousand metric tons of carbon equivalent.
Table 16.
The amount of reduction in emissions from the fuel economy scenario to the baseline scenario, measured in thousand metric tons of carbon equivalent.
| GHG | 2020 | 2025 | 2030 | 2035 | 2040 | 2045 | 2050 | Total |
|---|
| Carbon Dioxide | - | −5.4063 | −19.0402 | −46.5636 | −99.3973 | −197.5563 | −375.7312 | −743.695 |
| Methane | - | −0.0469 | −0.1658 | −0.4055 | −0.8654 | −1.7193 | −3.2685 | −6.4714 |
| Nitrous Oxide | - | −0.0125 | −0.0441 | −0.1079 | −0.2304 | −0.4579 | −0.8709 | −1.7239 |
| Total | - | −5.4658 | −19.2502 | −47.0771 | −100.4931 | −199.7336 | −379.8706 | −751.8903 |
Table 17.
The percentage reduction in emissions from the fuel economy scenario to the baseline scenario between 2020 and 2050.
Table 17.
The percentage reduction in emissions from the fuel economy scenario to the baseline scenario between 2020 and 2050.
| GHG | 2020 | 2025 | 2030 | 2035 | 2040 | 2045 | 2050 | Total |
|---|
| Carbon Dioxide | 0% | 2.31% | 5.05% | 7.67% | 10.16% | 12.54% | 14.81% | 52.54% |
| Methane | 0% | 2.56% | 5.63% | 8.55% | 11.33% | 13.98% | 16.50% | 58.55% |
| Nitrous Oxide | 0% | 2.32% | 5.09% | 7.74% | 10.25% | 12.65% | 14.94% | 52.99% |
| Total | 0% | 7.20% | 15.77% | 23.95% | 31.74% | 39.17% | 46.25% | 164.08% |
Table 18.
The amount of reduction in emissions from the fuel economy scenario to the public transport scenario, measured in thousand metric tons of carbon equivalent.
Table 18.
The amount of reduction in emissions from the fuel economy scenario to the public transport scenario, measured in thousand metric tons of carbon equivalent.
| GHG | 2020 | 2025 | 2030 | 2035 | 2040 | 2045 | 2050 | Total |
|---|
| Carbon Dioxide | - | −0.0891 | −0.2451 | −0.6223 | −1.4044 | −2.9715 | −6.0357 | −11.3681 |
| Methane | - | −0.0002 | −0.0005 | −0.0013 | −0.0029 | −0.0061 | −0.0124 | −0.0233 |
| Nitrous Oxide | - | −0.0002 | −0.0005 | −0.0014 | −0.0030 | −0.0064 | −0.0131 | −0.0247 |
| Total | - | −0.0895 | −0.2461 | −0.6249 | −1.4103 | −2.9840 | −6.0612 | −11.4160 |
Table 19.
The percentage reduction in emissions from the use of fuel economy option in the public transport scenario between 2020 and 2050.
Table 19.
The percentage reduction in emissions from the use of fuel economy option in the public transport scenario between 2020 and 2050.
| GHG | 2020 | 2025 | 2030 | 2035 | 2040 | 2045 | 2050 | Total |
|---|
| Carbon Dioxide | 0% | 0.04% | 0.07% | 0.11% | 0.16% | 0.22% | 0.28% | 0.87% |
| Methane | 0% | 0.01% | 0.02% | 0.03% | 0.04% | 0.06% | 0.07% | 0.23% |
| Nitrous Oxide | 0% | 0.04% | 0.06% | 0.11% | 0.15% | 0.21% | 0.26% | 0.82% |
| Total | 0% | 0.09% | 0.15% | 0.25% | 0.35% | 0.48% | 0.62% | 1.93% |


