Article

Combined Effects of Ambient PM2.5 and Cold Exposure on the Development of Metabolic Disorder

1
Department of Environmental Health, School of Public Health and the Key Laboratory of Public Health Safety, Ministry of Education, Fudan University, Shanghai 200032, China
2
Shanghai Municipal Center for Disease Control and Prevention, Shanghai 200336, China
3
IRDR International Center of Excellence on Risk Interconnectivity and Governance on Weather/Climate Extremes Impact and Public Health, Fudan University, Shanghai 200433, China
4
Shanghai Key Laboratory of Atmospheric Particle Pollution and Prevention, Department of Environmental Science and Engineering, Fudan University, Shanghai 200433, China
*
Authors to whom correspondence should be addressed.
These authors contributed equally to this work.
Atmosphere 2023, 14(7), 1157; https://doi.org/10.3390/atmos14071157
Submission received: 30 May 2023 / Revised: 14 July 2023 / Accepted: 14 July 2023 / Published: 17 July 2023
(This article belongs to the Section Air Quality)

Abstract

:
The coexistence of temperature changes and air pollution poses a severe global environmental issue, exacerbating health burdens. The aim of this study was to clarify the combined effects of ambient PM2.5 and cold exposure on the development of metabolic disorders. Male C57BL/6 mice were randomly divided into four groups: TN-FA, TN-PM, TC-FA and TC-PM. The mice were then exposed to concentrated PM2.5 or filtered air (FA) under normal (22 °C) or cold (4 °C) environment conditions for 4 weeks. Metabolic-disorder-related indicators, blood pressure, serous lipids, fasting blood glucose and insulin, energy metabolism, mitochondria and protein expression in tissues were detected for comprehensively assessing metabolic disorder. The results showed that, compared to being exposed to PM2.5 only, when mice were exposed to both PM2.5 and the cold (non-optimal), they exhibited more significant metabolic disorders regarding glucose tolerance (p < 0.05), insulin resistance (p < 0.05), lipid metabolism, adipocytes (p < 0.01) and mitochondrial function. This study suggested that a cold environment might substantially exacerbate PM2.5-induced metabolic disorder. The interaction between temperature changes and air pollution implied that implementing the necessary environment-related policies is a critical and complex challenge.

Graphical Abstract

1. Introduction

The acceleration of modernization has allowed for more convenience and comfort within life experiences but is also accompanied by serious ecological environmental pollution and temperature changes. Severe environmental issues, such as the greenhouse effect, and heat waves and cold waves occur frequently, raising alarms for human beings. The World Health Organization (WHO) has identified air pollution as the single largest environmental health risk factor [1]. Ambient particulate matter (PM) with an aerodynamic diameter of ≤2.5 μm (fine particulate matter, PM2.5) is known to significantly contribute to many health problems. The Global Burden of Disease (GBD) Study (2019) has shown that PM is still one of the top ten contributing factors to the global burden of diseases [2]. Meanwhile, temperature changes are associated with a series of health problems such as affecting the risk of morbidity and mortality of cardiovascular diseases and infant health [3,4]. Non-optimal temperature has been found to be the main risk factor in GBD (2019), and low temperature accounted for 0.946 million deaths in females [2]. In a realistic context, heavy PM2.5 pollution is often accompanied by extreme temperature changes. Cold waves especially occur alongside high PM2.5 pollution in winter because of the heating supplies. Therefore, the coexistence of temperature changes and air pollution not only exacerbates the health burden but also reinforces higher health-protection-related requirements.
Noncommunicable diseases are still the largest and fastest-growing global health burden, even more strongly linked to air pollution and temperature changes. In most noncommunicable diseases, metabolic syndrome is a generic term for the risk factors of type 2 diabetes mellitus (T2DM) and cardiovascular diseases [5]. In the survey analyzing the prevalence of metabolic syndrome in housewives, it has been suggested that household PM2.5 is closely related to the prevalence of metabolic syndrome in females [6]. Animal experiments have found that long-term exposure to PM2.5 impaired glucose tolerance, induced insulin resistance, decreased energy expenditure and induced the development of liver inflammation accompanied by elevated triglycerides [7,8,9]. Transcriptome analysis of cold-stimulated mice also found that up-regulated genes were enriched in lipid metabolism, fatty acid metabolism, lipid oxidation and fatty acid oxidation [10,11,12]. However, in most PM2.5-related epidemiological studies, temperature is always controlled as a confounding factor in statistical analysis [13,14], and vice versa. Consequently, there are few studies elucidating the combined effects of PM2.5 and cold, excluding some epidemiological investigations focusing on premature mortality [15,16,17,18], and hospital admissions for cardiovascular disease or respiratory outcomes [19]. Similarly, there are few corresponding animal studies linking air pollution and cold exposure, and metabolic disorders. Although some animal studies have reported that PM2.5 or cold exposure alone was associated with metabolic disorders, the effects and potential mechanisms induced by the combination of the two are still unclear. At the same time, few studies have described metabolic disorders (blood pressure, energy homeostasis, glucose tolerance, insulin resistance, lipids, adipocytokines, inflammation, mitochondria and energy-related protein expression) induced by air pollution and temperature changes comprehensively. Instead, most only observed morbidity, mortality, hospital admissions, insulin, glucose or blood pressure. As such, this study intended to mimic the general population exposed to ambient PM2.5 and cold simultaneously through the use of healthy C57BL/6 mice, and explore the combined effects and potential mechanism of these factors on metabolic disorders by measuring various relevant indicators.

2. Materials and Methods

2.1. Animals and Exposure Design

Six-week-old male C57BL/6 mice were purchased from the Experimental Animal Center of the College of Medicine, Fudan University (Shanghai, China). After one-week acclimation at 22 ± 2 °C the mice were randomly divided into four groups, with 10 in each group: TN-FA, TN-PM, TC-FA and TC-PM. In these groups, TN and TC proceeded at a normal (optimal) temperature (22 °C) and cold (non-optimal temperature, 4 °C), respectively. Under the different (TN and TC) temperatures, the mice were separately exposed to concentrated PM2.5 (PM) or filtered air (FA). The PM and FA exposure were performed using the “Shanghai Meteorological and Environmental Animal Exposure System (Shanghai-METAS)”, which can concentrate or filter outdoor PM2.5. Then, the concentrated PM2.5 or FA entered the chambers, in which the temperature was simultaneously adjusted to TN or TC, according to the study design (Figure 1a). We performed several studies linking PM2.5 and metabolic disorder/atherosclerosis using Shanghai-METAS [20,21,22]. In detail, the mice were treated with PM2.5/FA under normal (optimal) or cold (optimal) temperature conditions, using METAS for 8 h/day, for a total of 4 weeks. The mice were provided with free access to water and food during the exposure. All of the experiments were approved by the Animal Care and Use Committee of Fudan University and followed appropriate protocols.

2.2. Blood Pressure Measurement

At the beginning and the end of the entire exposure, the blood pressure of the mice was measured using the non-invasive blood pressure acquisition system (CODA, Kent, WA, USA). Before testing, the mice were placed on a heated animal stand by an animal binder for 10 min. Then, a volume pressure recording (VPR) sensor and an O-cuff kit were placed on the tail to measure the systolic blood pressure (SBP) and diastolic blood pressure (DBP). The measurement interval was set to 10 s and every was mouse tested 10 consecutive times.

2.3. Metabolic Cage

At the end of exposure, the mice were placed in metabolic cages (Shanghai Research Center of the Southern model organisms) for 24 h to determine the respiratory exchange ratio (RER), carbon dioxide production (VCO2), oxygen consumption (VO2) and heat production in a resting state, at 22 °C. Water and food were freely available. Data were normalized to the body weight.

2.4. Blood Glucose Tolerance and Insulin Sensitivity Measurement

At the end of the 4-week exposure, the mice were fasted for 12 h for intraperitoneal glucose tolerance testing (IPGTT). Blood samples were collected from the vena caudalis to measure the level of blood glucose at 0, 30, 60, 90 and 120 min after the dextrose (2 mg/g body weight) injection, respectively.
For the insulin tolerance test (ITT), insulin (0.5 U/kg) was administered via an intraperitoneal injection after 4.5 h of fasting. The homeostasis model assessment (HOMA-IR) was calculated according to the following equation: [fasting insulin concentration (mU/L) × fasting glucose concentration (mmol/L)]/22.5.

2.5. Blood Biomarkers

After the mice were sacrificed, the blood samples were collected and centrifuged at 1500 rpm for 20 min. The levels of insulin, interleukin (IL)-6, tumor necrosis factor (TNF)-α, leptin and adiponectin were measured using an enzyme-linked immunosorbent assay (ELISA) kit (Biosource International, Camarillo, CA, USA).

2.6. Serous Lipid Determination

Blood samples were also collected for analyzing serous triglyceride (TG), total cholesterol (TC), low-density lipoprotein cholesterol (LDL-C) and high-density lipoprotein cholesterol (HDL-C) (NanJing KeyGen Biotech. Inc., Nanjing, Jiangsu, China).

2.7. Histological Analysis and Transmission Electron Microscopy Observation

The inguinal white adipose tissue (WAT) and brown adipose tissue (BAT) were harvested. Part of the WAT and BAT were fixed with 10% neutral buffered formalin for histological morphology analysis (H&E staining). The ultra-structure of BAT was examined via transmission electron microscopy (CM120, Philips, Amsterdam, Holland) to investigate mitochondrial changes. The total mitochondria in 10 micrographs per group were counted, and mitochondrial size and number were analyzed using ImageJ software.

2.8. Western Blot Analysis

The WAT and BAT of mice were homogenized in the lysis buffer (Thermo Fisher Scientific, Waltham, MA, USA) with protease and phosphatase inhibitors (Kangchen Biotech, Beijing, China). The same amounts of proteins were separated by a sodium dodecyl sulfate-polyacrylamide gel, then transferred to PVDF membranes (Bio-Rad, Hercules, CA, USA). The membranes were incubated with primary antibody UCP-1 and HSP90 (Cell Signaling Technology, Boston, MA, USA) overnight at 4 °C, respectively. After being washed, the membranes were incubated with HRP-conjugated secondary antibody (Cell Signaling Technology, Boston, MA, USA). Last, the membranes were detected with enhanced chemiluminescence followed by exposure to X-ray film. The density of the protein bands was calculated using ImageQuant TL8.1 software.

2.9. Statistical Analysis

The results were expressed as the mean ± standard deviation (SD). The data were statistically analyzed using IBM SPSS Statistics 22.0. The normality of each group was tested using the Shapiro–Wilk method and the homogeneity of variance was tested using the Levene method. Pairwise comparisons were performed using the least significance difference (LSD) test. The differences between FA and PM, as well as normal temperature and cold, were analyzed through t-tests, and a p-value < 0.05 was considered statistically significant.

3. Results

3.1. PM2.5 Concentrations and Body Weight of the Mice

The PM2.5 concentrations in PM and FA chambers during exposure are shown in Figure 1e. The average concentrations of PM2.5 in the TN-FA, TN-PM, TC-FA and TC-PM groups during the exposure were 9.28 ± 1.04, 155.47 ± 8.10, 9.50 ± 1.01 and 145.07 ± 8.95 μg/m3, respectively.
As shown in Figure 1f, the average body weights of the mice in the TN-FA, TN-PM, TC-FA and TC-PM groups were 23.52 ± 0.84, 23.87 ±1.00, 23.72 ± 1.19 and 23.01 ± 1.18 g before exposure. The baseline body weights of the mice had no significant difference among the four groups. At the end of the 4-week exposure, the average body weights of the mice in the four groups were 24.73 ± 1.22, 24.27 ± 1.55, 26.72 ± 1.54 and 26.81 ± 0.68 g. The PM2.5-exposed mice displayed a reduction in the body weight increment.

3.2. Combined Effects of PM2.5 and Cold Exposure on Blood Pressure

The baseline, the SBP and DBP among the four groups showed no significant difference. Similarly, after the 4-week exposure, there were also no significant differences in the SBP and DBP between the FA and PM groups, as well as the TN and TC groups (Figure 1g,h).

3.3. Cold Exacerbates PM2.5-Induced Glucose Tolerance and Insulin Resistance

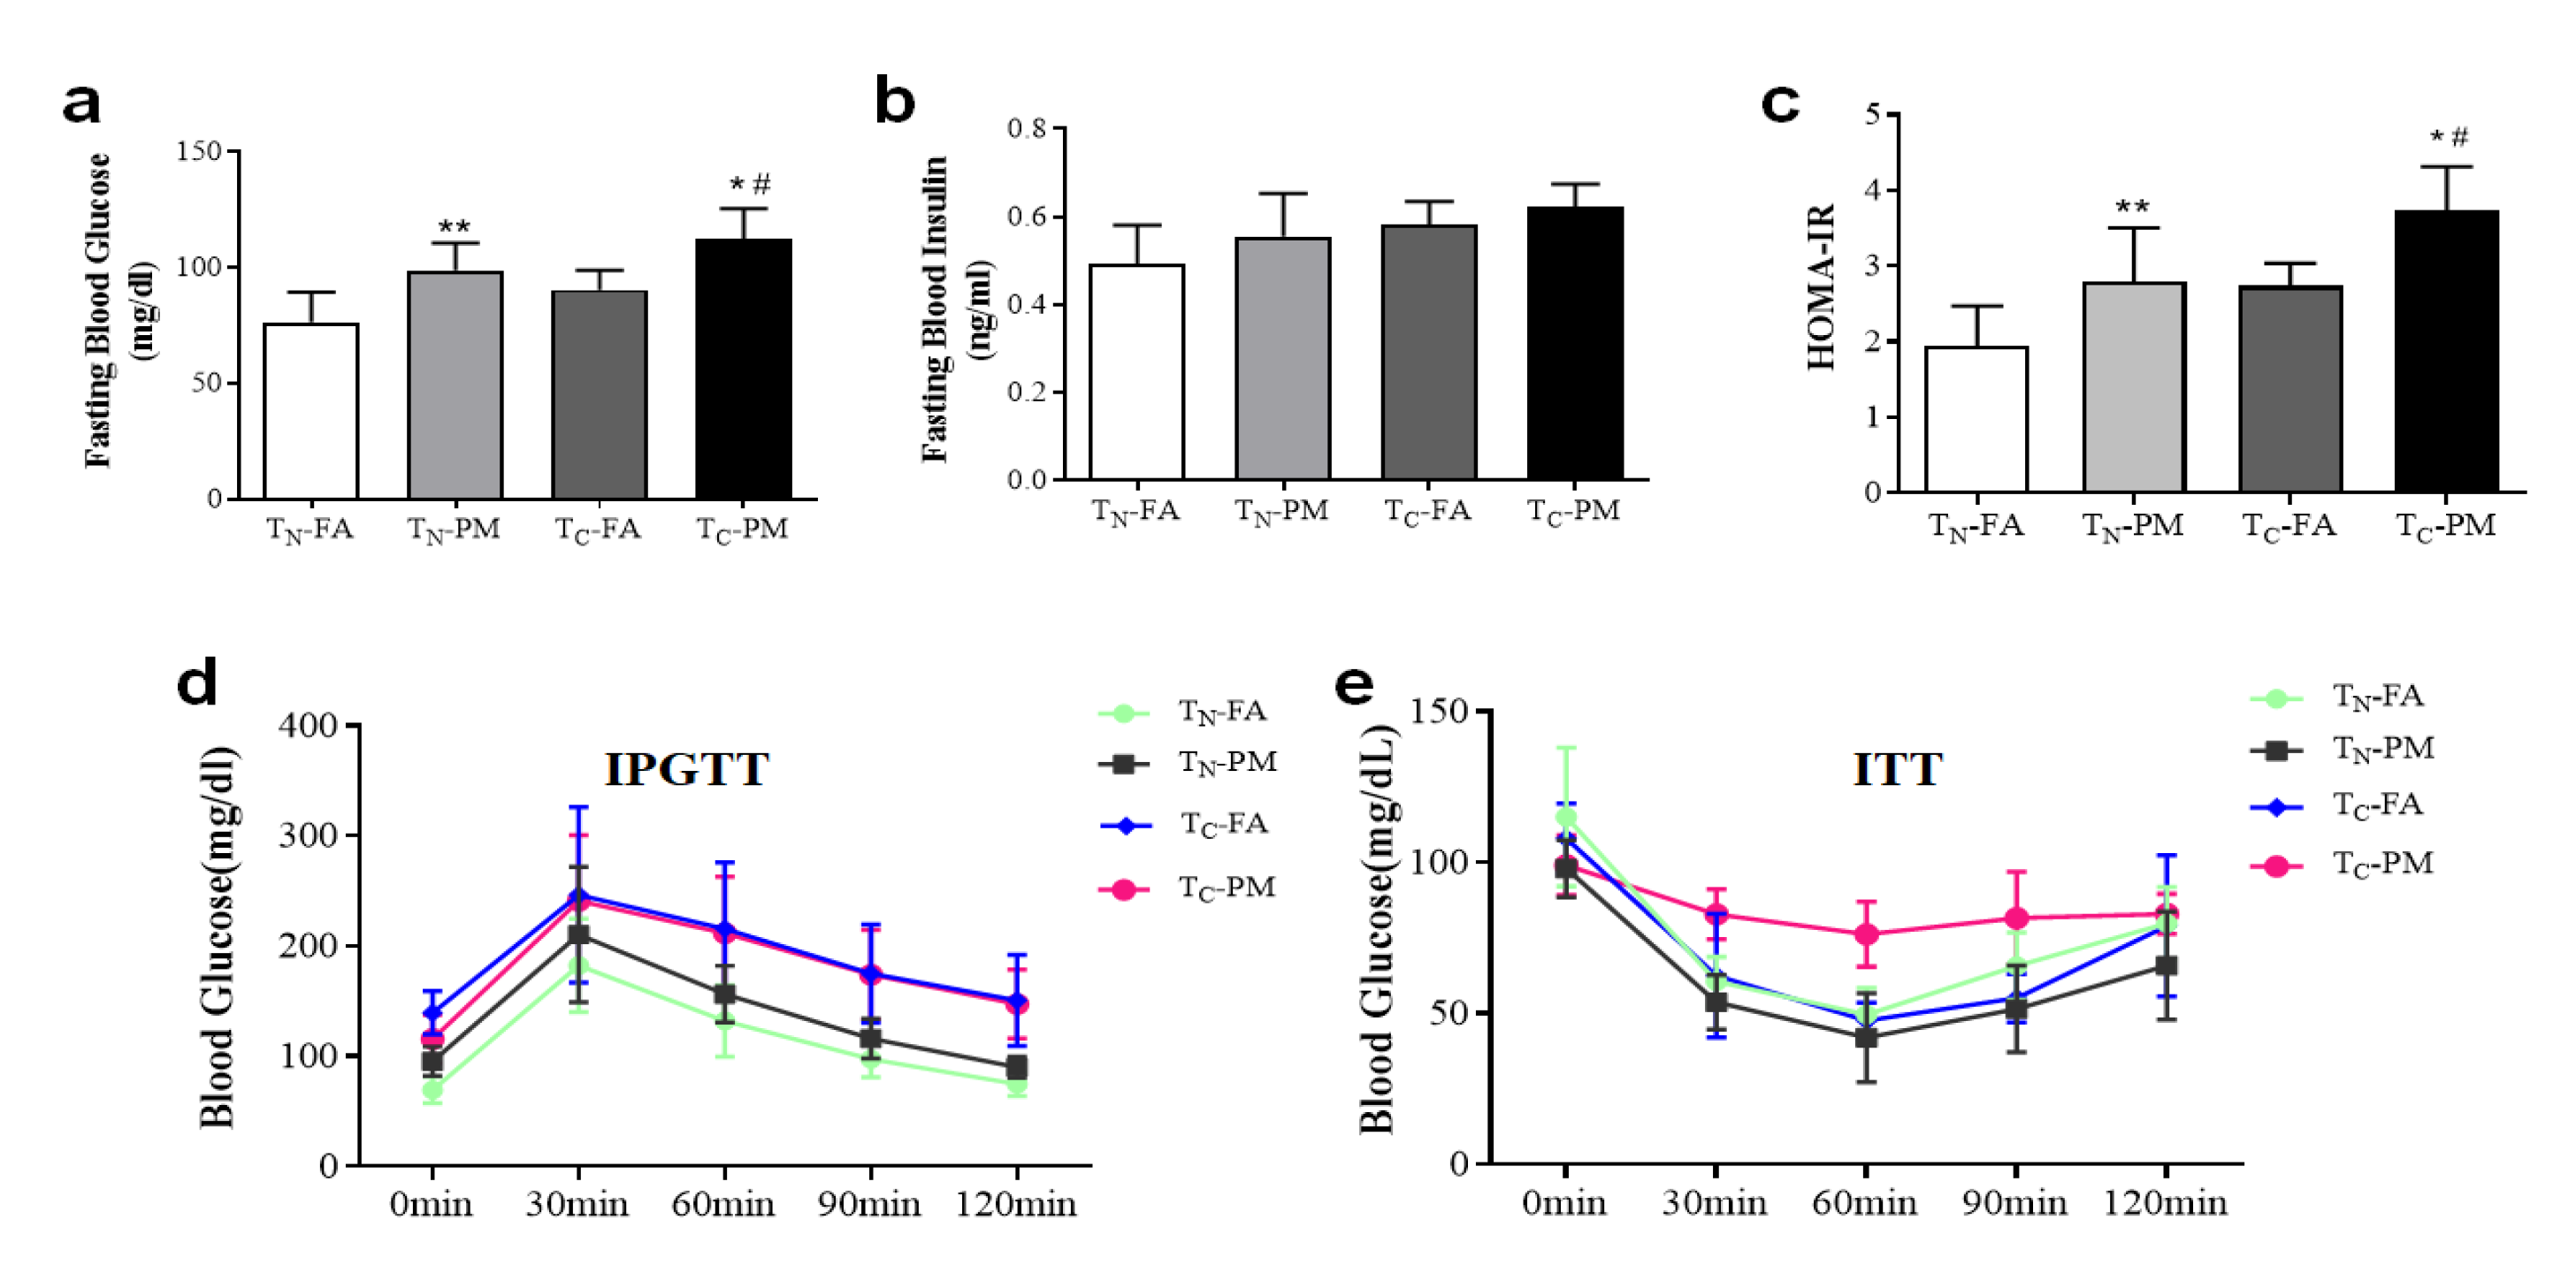
In both the normal and cold environments, PM exposure significantly increased the level of fasting blood glucose when compared with FA (p < 0.01). Meanwhile, the fasting blood glucose in TC-PM mice was higher than that in the TN-PM mice (Figure 2a). There was no difference in the fasting insulin among the four groups (Figure 2b). The trends of the HOMA-IR index in these groups were similar to the trends of the fasting blood glucose. PM exposure increased HOMA-IR at normal and cold temperatures (Figure 2c).
As shown in Figure 2d, in IPGTT, the trends of blood glucose at 30 min, from the highest to the lowest, were TC-FA, TC-PM, TN-PM and TN-FA mice after a glucose injection. Thirty minutes later, the blood glucose in each group showed a downward trend, but the blood glucose in the TC-FA and TC-PM groups remainder at a higher level until 120 min than that in the other groups. In ITT, the blood glucose reached the lowest value at 60 min in the mice after insulin injection (Figure 2e). The trends of blood glucose at 60 min, from the highest to the lowest, were TC-PM, TN-FA, TC-FA and TN-PM groups. After 60 min, the blood glucose was gradually restored.

3.4. Cold Exacerbates PM2.5-Induced Energy Imbalance

As shown in Figure 3, cold exposure could induce an increase in VO2, VCO2, RER and heat production, regardless of whether the mice were exposed to PM2.5 or not. At a normal temperature, PM exposure could only induce a significant change in heat production, but not the VO2, VCO2 and RER. However, at cold temperatures, PM exposure could significantly induce an increase in the VO2, VCO2 and RER, and decrease in heat production when compared with the FA exposure (p < 0.05). The results indicated that cold exposure absolutely influenced the effects of PM2.5 on energy metabolism.

3.5. Cold Exacerbates PM2.5-Induced Pathological and Mitochondria Alteration

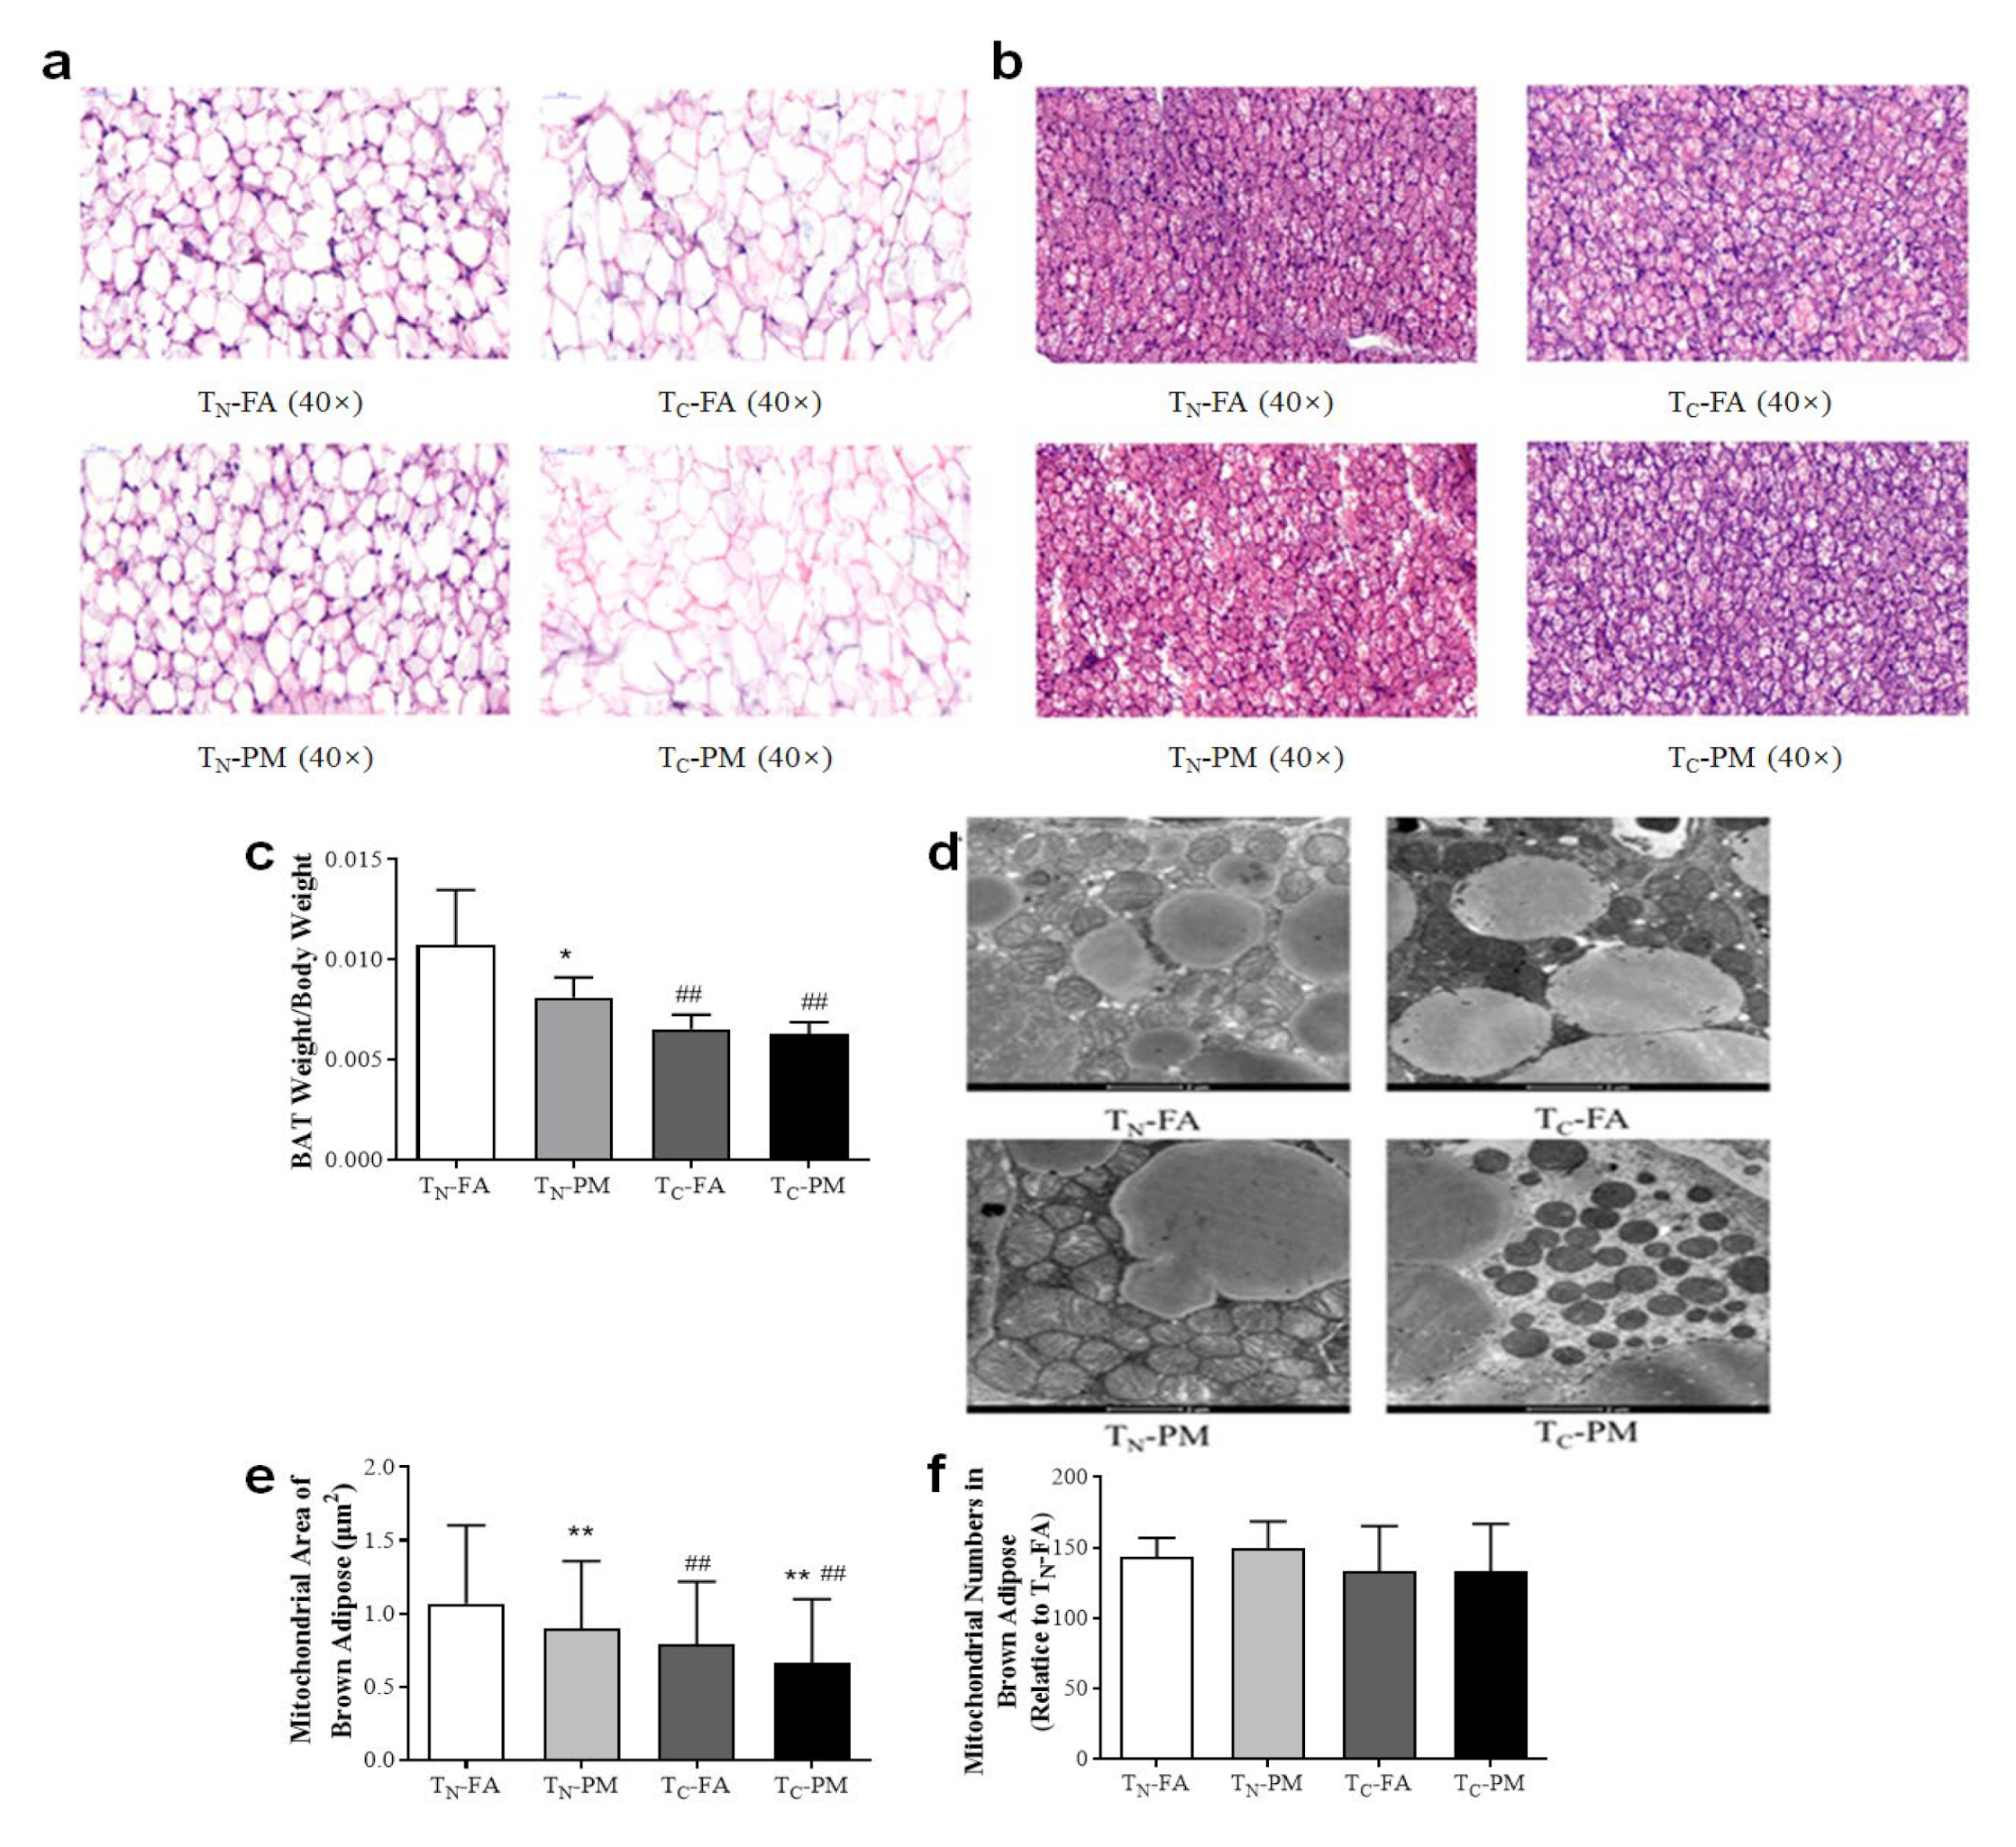
A histopathological evaluation of WAT and BAT in each group is shown in Figure 4a and b. Compared with TN mice, TC mice displayed severe adipose cell hypertrophy in WAT, regardless of whether the mice were exposed to concentrated PM2.5 or not. Cold significantly exacerbated PM2.5-induced white adipose cell hypertrophy (Figure 4a). There was no fat accumulation at cold temperatures when compared with normal temperatures, which even displayed smaller brown adipocytes (Figure 4b).
Figure 4c shows that PM2.5 could induce a decrease in BAT weight when compared with FA at a normal temperature. Similarly, cold exposure could induce a decrease in BAT weight in both the PM2.5 and FA groups. Figure 4d shows the number and morphology of mitochondria in BAT. Figure 4e shows that the mitochondrial area of BAT in PM groups was significantly smaller than that in FA under TN or TC conditions (p < 0.01). Meanwhile, compared with TN groups, the area of BAT mitochondria in the TC groups was significantly reduced (p < 0.01). Neither cold nor PM2.5 could induce changes in the number of mitochondria (Figure 4f).

3.6. Cold Influences PM2.5-Induced Abnormal Lipid Metabolism

The serum lipid profiles were detected to observe lipid metabolism. As shown in Figure 5, at a normal temperature, PM2.5 exposure could induce an increase in the serous TC and LDL, but not in TG and HDL when compared with FA. Most notably, there were no differences in these lipid indicators between TC-PM mice and TC-FA mice.

3.7. Cold Exacerbates PM2.5-Induced Inflammation and Energy Expenditure Inhibition

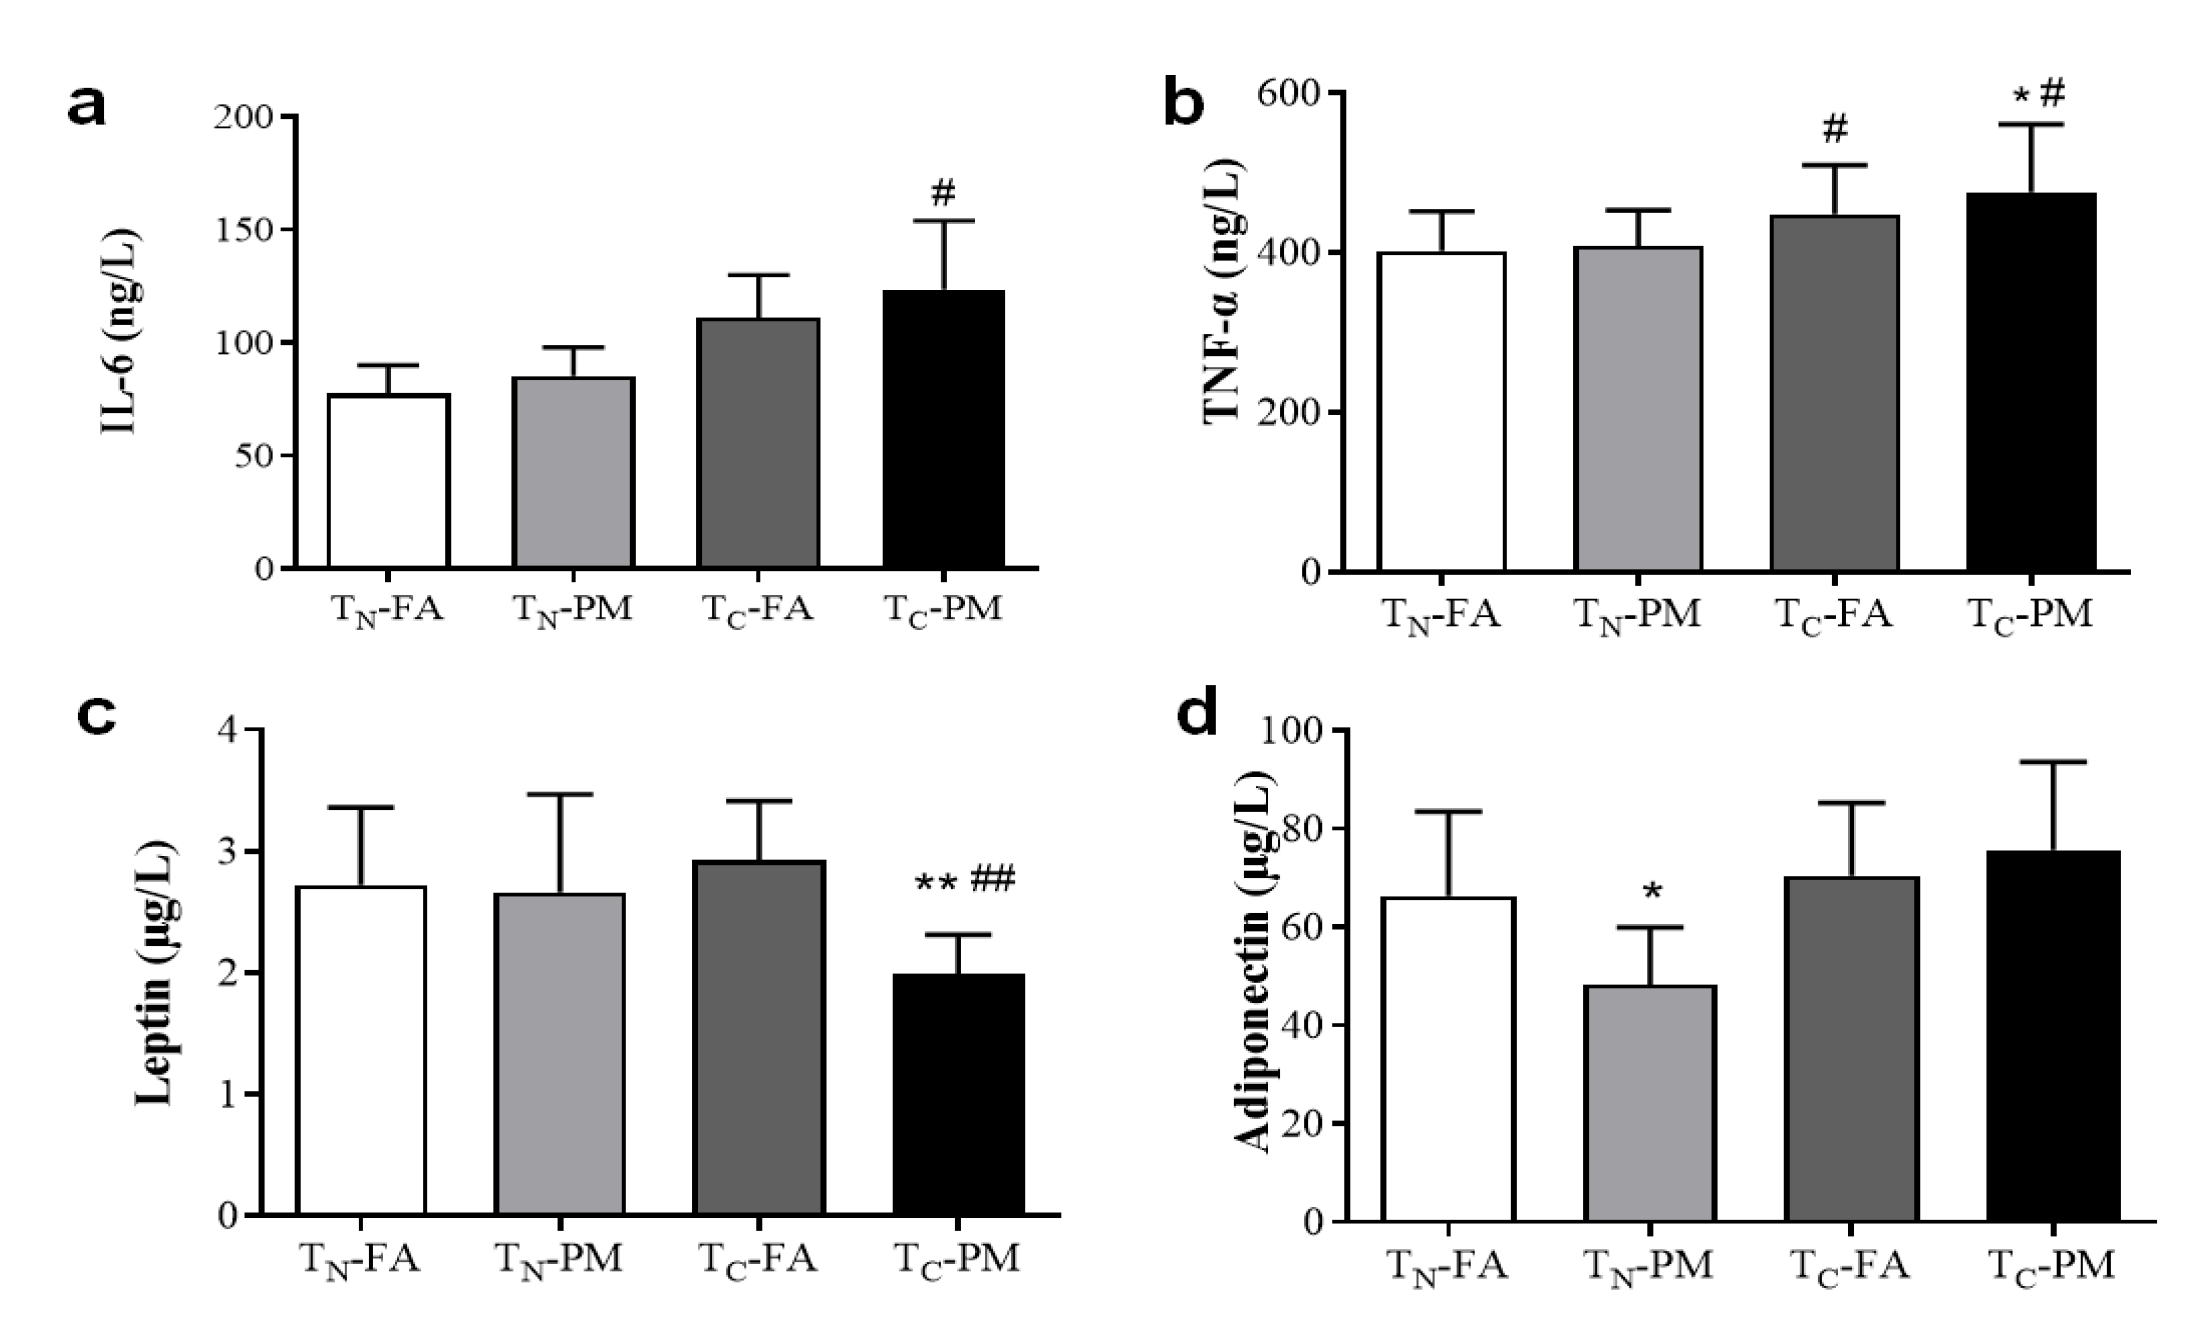
At a normal temperature, PM2.5 exposure had no significant influence on serous TNF-α and IL-6 (Figure 6a,b). However, at a cold temperature, PM2.5 exposure could induce an increase in the TNF-α when compared with FA. Therefore, there was a significant difference between TC-FA and TC-PM mice.
PM2.5 did not change the level of leptin at a normal temperature, but it induced a significant decrease in leptin at a cold temperature (Figure 6c). The results suggested that PM2.5 markedly inhibited leptin-related energy consumption. PM2.5 exposure reduced adiponectin at a normal temperature. However, at a cold temperature, PM2.5 exposure had no significant influence on adiponectin (Figure 6d).

3.8. Combined Exposure to PM2.5 and the Cold Inhibits Thermogenesis and Energy Expenditure

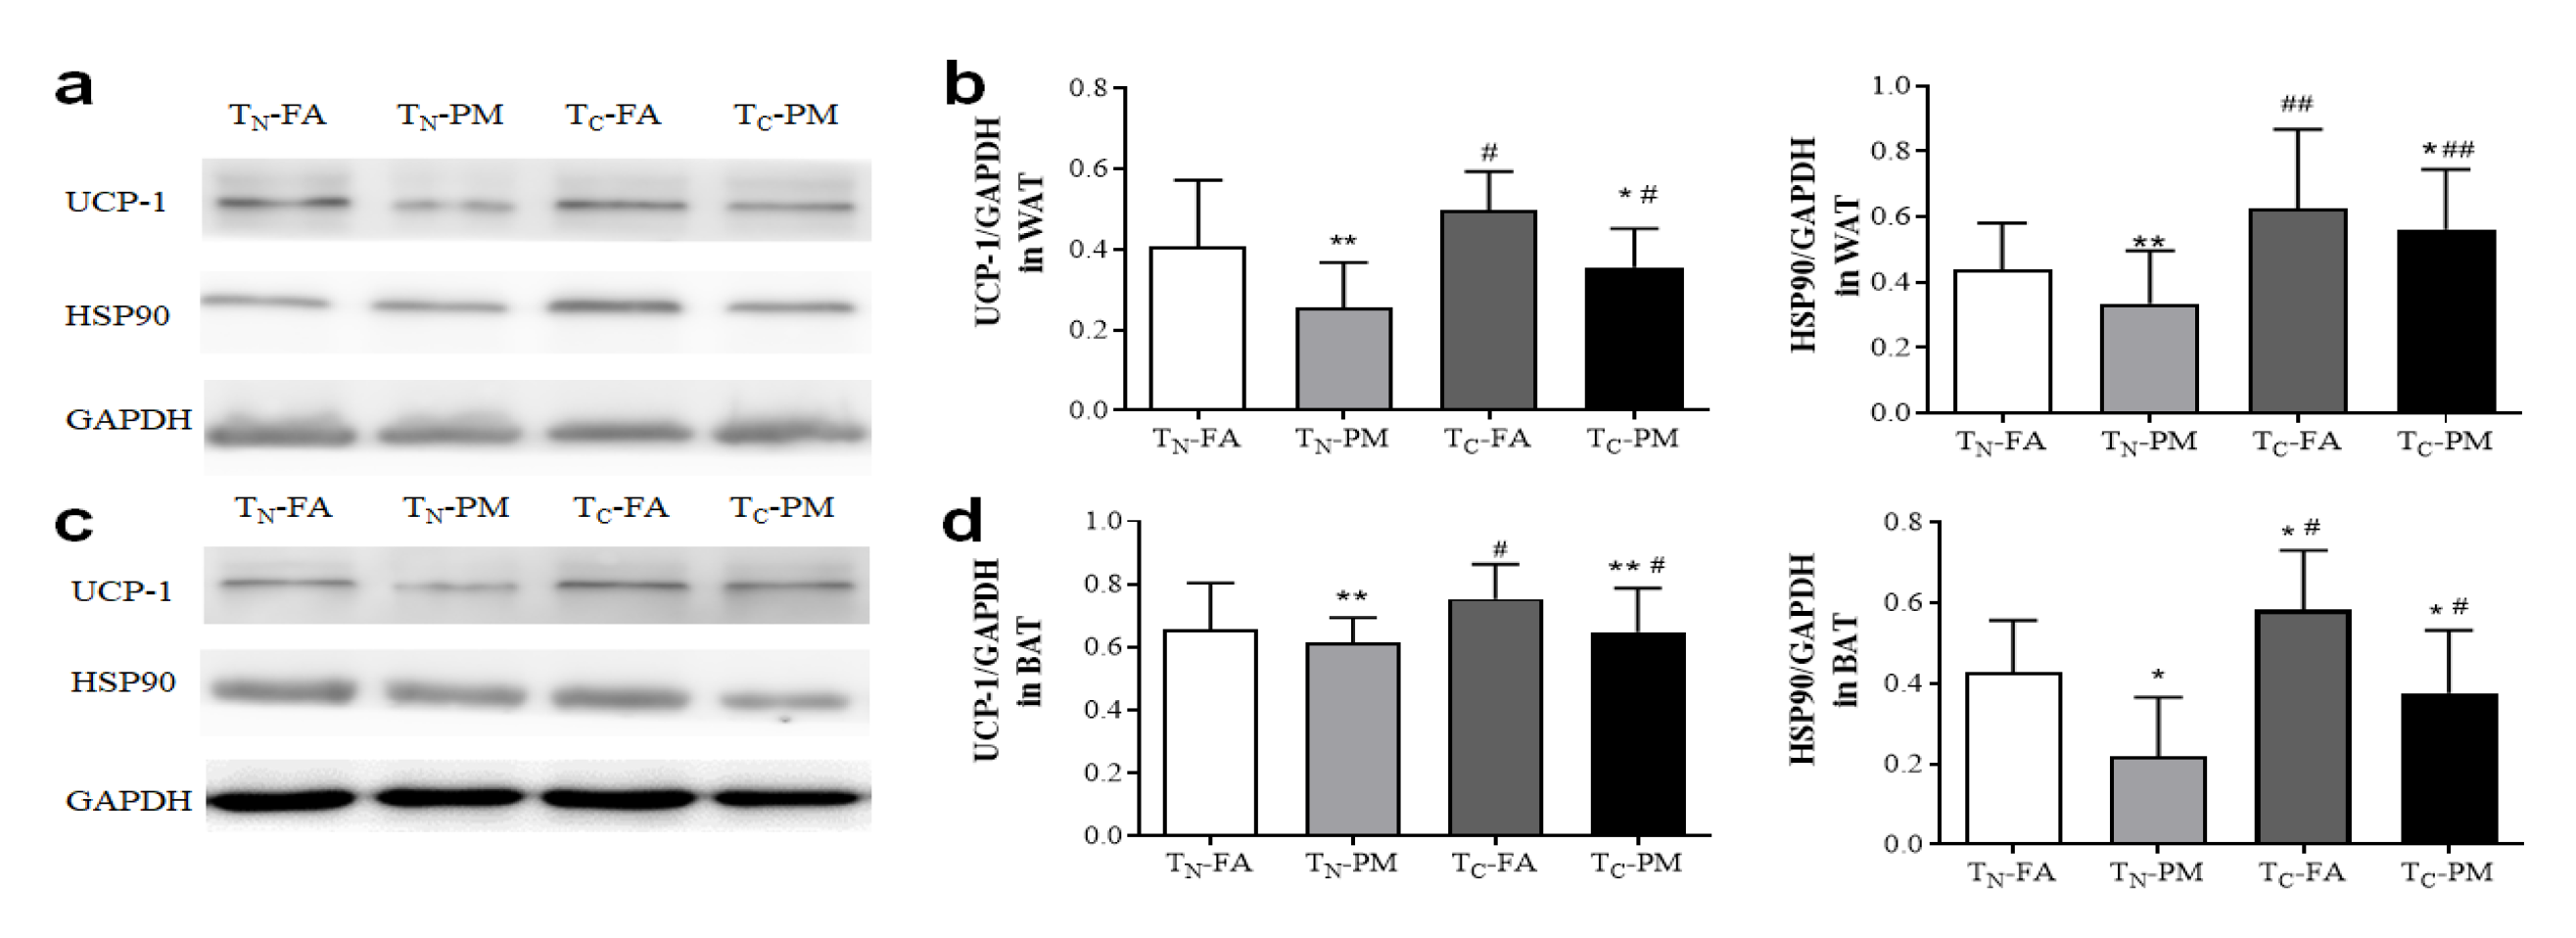
As shown in Figure 7a,b, compared with that in TN-FA and TC-FA, the expression of UCP-1 and HSP90 proteins in the WAT of mice in both the TN-PM and TC-PM groups was significantly decreased, indicating that PM2.5 could induce a decrease in the UCP-1 and HSP90 proteins in mice. However, the expression of UCP-1 and HSP90 proteins was significantly increased in both TC-FA and TC-PM groups compared with the corresponding TN-FA and TN-PM, suggesting that cold exposure seemed to induce an increase in UCP-1 and HSP90 expression. The trends of UCP-1 and HSP90 protein expression in BAT were the same as those in WAT (Figure 7c,d).

4. Discussion

Temperature changes, air pollution and noncommunicable diseases have become the most serious threats to global health [23,24]. As one of the risk factors for T2DM and cardiovascular diseases, metabolic disorder poses a huge threat to human health. A large number of epidemiological and experimental studies have found that ambient PM2.5 exposure played an important role in the occurrence and development of diabetes [25,26,27,28,29]. Although previous studies have shown that both ambient PM2.5 and temperature changes could affect blood glucose, blood lipids and blood pressure [30,31,32], there are few studies observing the combined effects of air pollution and temperature changes on the development of metabolic disorder, excluding the studies related to asthma and atherosclerotic heart disease mortality [33,34,35]. Previous studies have reported that temperature changes could not only alter the dispersion of particulate matter but also intensify the formation of secondary pollutants [36]. In order to identify the combined effects of PM2.5 and the cold on the development of metabolic disorders, we performed the current animal study. To the best of our knowledge, this study is the first to provide direct evidence related to the combined exposure to PM2.5 and the cold exacerbating metabolic disorder within the normal healthy population.
In this study, the average concentration of PM2.5 in PM-exposed groups was about 150 μg/m3, which was much higher than the upper limit stipulated by the Chinese Air Quality Standard (AQS, GB3095-2012). In addition, the exposure concentration of PM2.5 in this study represents the common weather condition in autumn and winter, especially in northern Chinese cities such as Beijing [37,38], which is 10 times the WHO 24 average recommended level. In recent years, our repeated determination of PM2.5 components in exposure and control chambers of METAS indicated that the types of chemical components have not changed regardless of the concentration [20,21,22], and traffic exhausts and industrial emissions are the predominant sources of ambient PM around the exposure system [39]. Therefore, the PM2.5 concentration in this study could represent the air pollution condition in most cities in China. In addition, in terms of the temperature setting, this study chose 22 °C and 4 °C to represent the normal temperature and the cold, and there were fewer temperature points. In the future, temperature points can be added to explore the further impact of temperature change curves.
The duration of the current study was 4 weeks, which made for a short-term study design. This study comprehensively detected metabolic-disorder-related indicators, including blood pressure, insulin resistance (fasting insulin, HOMA-IR, ITT), glucose tolerance (fasting blood glucose, IPGTT), energy consumption (VO2, VCO2, RER, and heat production), serous lipids profile (TC, TG, LDL and HDL), inflammatory response (IL-6 and TNF-α), leptin, adiponectin and mitochondria function (number and area of mitochondria in BAT), in order to observe the combined effects of PM2.5 and cold exposure on the development of metabolic disorders. In the future, we will also conduct long-term exposure studies in order to obtain more comprehensive and reliable conclusions.

4.1. Cold Exacerbates PM2.5-Induced Glucose Metabolism Disorders

The present study found that PM and cold exposure had no significant effects on SBP and DBP, which might be associated with the fact that short-term exposure cannot influence blood pressure homeostasis. It was also found that PM2.5 could induce an increase in fasting blood glucose under both normal and cold temperatures. The fasting blood glucose in TC-PM mice was higher than that in the TN-PM mice, suggesting that the effect of PM2.5 on glucose metabolism was exacerbated by cold exposure. Insulin resistance was an important criterion for diagnosing MetS and T2DM. Blood glucose tolerance and insulin sensitivity were often used to determine whether insulin resistance was occurring or not [27,40,41]. The maintenance of blood glucose homeostasis in vivo mainly depends on the insulin reactivity in target tissues. In this study, TN-PM mice displayed an increase in the HOMA-IR in comparison with TN-FA mice, indicating the occurrence of insulin resistance. Meanwhile, cold exposure could induce an increase in the HOMA-IR in PM-exposed mice, but not in FA-exposed mice when compared with those at a normal temperature, suggesting that cold exposure might exacerbate the PM-induced insulin resistance. Similarly, IPGTT and ITT showed that PM2.5 along with cold exposure could induce serious glucose tolerance and insulin resistance when compared with PM2.5 or cold exposure alone, which further confirmed that the cold exacerbates the effects of PM2.5.
In the metabolic cage experiment, PM2.5 increased heat production under a normal temperature, which was contrary to the long-term PM2.5-induced decrease in heat production in our previous study [22]. The reason might be associated with the difference between long-term and short-term exposure [42,43], and the potential mechanism should be explored in our future study. Importantly, TC-PM exposure could induce a higher VCO2 and RER in comparison with TC-FA, suggesting that there was a higher energy metabolism in PM-exposed mice under cold environment conditions. The higher energy metabolism was consistent with the higher body weight and fasting blood glucose in PM-exposed mice.

4.2. Cold Exacerbates PM2.5-Induced Lipid Metabolism Disorders

Circulatory lipids are closely related to the risk of cardiovascular disease. Studies had found that a decrease in LDL and an increase in HDL were associated with a reduction in the incidence of myocardial infarction, unstable angina and sudden cardiac death as early as 1996 [44,45]. Exposure to ultrafine particles could inhibit the protective effects of HDL [46]. A retrospective cohort study also found that intermediate-term exposure to PM10 resulted in an increase in LDL and TG and a decrease in HDL [47]. The present study found that PM2.5 exposure could induce an increase in TC under normal temperature conditions when compared with FA exposure, but not in the cold-exposed groups. Cold exposure could induce a lower TC and LDL when compared with that within a normal environment, which might be associated with shivering thermogenesis, increased activity, promoted function of BAT and enhanced plasma metabolism under short-term cold exposure [48,49]. The results might be explained by the function of BAT in regulating triglycerides [11,50]. Interestingly, PM2.5 could induce an increase in TC and LDL within a normal environment when compared with FA. Similarly, previous studies, including ours, indicated that PM2.5 exposure increased TG and LDL in both ApoE-/- mice [51] and healthy C57BL/6 mice [22]. Curiously, there was no difference in TC and LDL between the PM2.5 and FA groups under cold environment conditions, suggesting that cold exposure substantially influenced the effects of PM2.5.
In this study, there was no significant difference in serous IL-6 and TNF-α between PM and FA mice under normal temperature conditions. However, at a cold temperature, PM2.5 could induce an increase in the TNF-α, suggesting that cold exposure definitely promoted PM2.5-induced systemic inflammation. Adipose tissue can secrete fatty acids, leptin and adiponectin. In this study, PM2.5 exposure could induce a decrease in adiponectin, but not leptin at a normal temperature. In contrast, at a cold temperature, PM2.5 exposure could induce a decrease in leptin and had no significant effects on adiponectin. The results signified that PM2.5 combined with cold exposure could induce a reduction in energy consumption and promotion of adipocyte synthesis. Adiponectin is an important thermogenic regulator, which is necessary to maintain the body temperature at low temperatures [52]. Thus, TC mice secreted higher adiponectin than TN mice. Adiponectin decreased in obese and T2D patients and the reduction in adiponectin was related to a decrease in insulin sensitivity and glucose tolerance [53]. In the current study, TN-PM mice had a lower level of adiponectin compared with TN-FA mice, which indicated that PM2.5 might impair glucose metabolism and insulin sensitivity.
Mitochondria are important organelles in energy metabolism. In BAT, PM2.5 exposure had no significant effect on mitochondrial quantity under both normal and cold temperature conditions. In the TN and TC groups, PM2.5 significantly reduced the mitochondrial area. A previous study found that long-term PM2.5 exposure decreased mitochondrial counts in visceral adipose and mitochondrial size in interscapular adipose depots [54], which was consistent with the decrease in these indicators in TN-PM mice in our study. According to the metabolism of mice, VO2, VCO2, RER and heat production in TC mice were significantly higher than those in TN mice, and VO2, VCO2, RER and heat production in TC-PM mice were significantly higher than those in TC-FA mice. The results suggested that the changes in the area of mitochondria in BAT would be a compensatory change in order to maintain physical function when short-term-exposed to a combination of the cold and PM2.5.

4.3. Cold Exacerbates PM2.5-Induced Protein Metabolism Disorders

UCP-1 is a specific expression protein in BAT. Under cold conditions, it can uncouple mitochondrial oxidation and phosphorylation, metabolize fatty acids and generate energy, thereby maintaining the body temperature. A previous study found that cold exposure could induce the expression of BAT thermogenesis genes and increase the protein levels of UCP1 and PGC1α [49]. HSP90 is one of the proteins in the heat shock protein family, and its main function is to maintain the structure of intracellular proteins [55]. HSP90 plays a critical role in both the regulation of normal cellular homeostasis and the stress response [56,57]. Previous studies indicated that Hsp90 genes performed a vital role in cold acclimation [58,59] and ambient PM2.5 exposure [60]. In the present study, the expression of UCP-1 and HSP90 was increased in both WAT and BAT during cold exposure when compared with the corresponding normal temperature. More importantly, PM2.5 exposure could induce the down-regulation of UCP-1 and HSP90 expression, regardless of whether the mice were exposed to a normal or cold temperature. The UCP-1 alteration might in turn impair the BAT structure and function [61,62].

5. Conclusions

This study showed that the combined exposure to PM2.5 and the cold might contribute to the development of metabolic disorders within the healthy population. During short-term exposure, cold exposure might exacerbate PM2.5-related metabolic disorders, which are potentially associated with changes in energy homeostasis, glucose metabolism, insulin resistance and mitochondrial function. In the future, we will explore the mechanism of metabolic disorders induced by co-exposure to PM2.5 and cold temperatures. The results demonstrated that the combined effects of PM2.5 pollution and temperature changes could be a great threat to people’s health. Due to the combined effects of air pollution and temperature changes, and the health issue of noncommunicable diseases, a study focusing on air pollution and temperature changes is critical. The government and health authorities have taken into account estimating both the temperature- and air-pollution-related health problems in order to set up an adequate policy to face the temperature and pollution challenges.

Author Contributions

Conceptualization, Z.L., J.Z. (Jia Zhang), J.Z. (Jinzhuo Zhao) and J.C.; investigation, Z.L., J.Z. (Jia Zhang), D.F., G.W., B.W., L.L. and L.W.; writing—original draft preparation, Z.L. and J.Z. (Jia Zhang); writing—review and editing, J.Z. (Jinzhuo Zhao) and J.C.; supervision, J.Z. (Jinzhuo Zhao) and J.C.; funding acquisition, J.Z. (Jinzhuo Zhao) and J.C. All authors have read and agreed to the published version of the manuscript.

Funding

This research was funded by the National Key Research and Development Program of China, grant number 2016YFC0206600”, and the National Natural Science Foundation of China, grant number 91843301 and 91743202.

Institutional Review Board Statement

The animal study protocol was approved by the Fudan University Animal Care and Use Committee (protocol code 201902063S, 27 February 2019).

Informed Consent Statement

Not applicable.

Data Availability Statement

The data that support the findings of this study are available from the corresponding author (Jinzhuo Zhao) upon reasonable request.

Conflicts of Interest

The authors declare no conflict of interest.

References

  1. World Health Organization. Ambient air pollution: A global assessment of exposure and burden of disease. Clean Air J. 2016, 26, 6. [Google Scholar] [CrossRef]
  2. Murray, C.J.L.; Aravkin, A.Y.; Zheng, P.; Abbafati, C.; Abbas, K.M.; Abbasi-Kangevari, M.; Abd-Allah, F.; Abdelalim, A.; Abdollahi, M.; Abdollahpour, I.; et al. Global burden of 87 risk factors in 204 countries and territories, 1990–2019: A systematic analysis for the Global Burden of Disease Study 2019. Lancet 2020, 396, 1223–1249. [Google Scholar] [CrossRef] [PubMed]
  3. Liu, J.; Varghese, B.M.; Hansen, A.; Zhang, Y.; Driscoll, T.; Morgan, G.; Dear, K.; Gourley, M.; Capon, A.; Bi, P. Heat exposure and cardiovascular health outcomes: A systematic review and meta-analysis. Lancet Planet. Health 2022, 6, e484–e495. [Google Scholar] [CrossRef] [PubMed]
  4. Lakhoo, D.P.; Blake, H.A.; Chersich, M.F.; Nakstad, B.; Kovats, S. The Effect of High and Low Ambient Temperature on Infant Health: A Systematic Review. Int. J. Environ. Res. Public Health 2022, 19, 9109. [Google Scholar] [CrossRef] [PubMed]
  5. Romanello, M.; van Daalen, K.; Anto, J.M.; Dasandi, N.; Drummond, P.; Hamilton, I.G.; Jankin, S.; Kendrovski, V.; Lowe, R.; Rocklöv, J.; et al. Tracking progress on health and climate change in Europe. Lancet Public Health 2021, 6, e858–e865. [Google Scholar] [CrossRef]
  6. Rajkumar, S.; Young, B.N.; Clark, M.L.; Benka-Coker, M.L.; Bachand, A.M.; Brook, R.D.; Nelson, T.L.; Volckens, J.; Reynolds, S.J.; L’Orange, C.; et al. Household air pollution from biomass-burning cookstoves and metabolic syndrome, blood lipid concentrations, and waist circumference in Honduran women: A cross-sectional study. Environ. Res. 2019, 170, 46–55. [Google Scholar] [CrossRef]
  7. Rajagopalan, S.; Park, B.; Palanivel, R.; Vinayachandran, V.; Deiuliis, J.A.; Gangwar, R.S.; Das, L.; Yin, J.; Choi, Y.; Al-Kindi, S.; et al. Metabolic effects of air pollution exposure and reversibility. J. Clin. Investig. 2020, 130, 6034–6040. [Google Scholar] [CrossRef]
  8. Zhang, Z.; Hu, S.; Fan, P.; Li, L.; Feng, S.; Xiao, H.; Zhu, L. The Roles of Liver Inflammation and the Insulin Signaling Pathway in PM2.5 Instillation-Induced Insulin Resistance in Wistar Rats. Dis. Markers 2021, 2021, 2821673. [Google Scholar] [CrossRef]
  9. Zheng, X.Y.; Tang, S.L.; Liu, T.; Wang, Y.; Xu, X.J.; Xiao, N.; Li, C.; Xu, Y.J.; He, Z.X.; Ma, S.L.; et al. Effects of long-term PM(2.5) exposure on metabolic syndrome among adults and elderly in Guangdong, China. Environ. Health A Glob. Access Sci. Source 2022, 21, 84. [Google Scholar] [CrossRef]
  10. Liang, X.; Pan, J.; Cao, C.; Zhang, L.; Zhao, Y.; Fan, Y.; Li, K.; Tao, C.; Wang, Y. Transcriptional Response of Subcutaneous White Adipose Tissue to Acute Cold Exposure in Mice. Int. J. Mol. Sci. 2019, 20, 3968. [Google Scholar] [CrossRef] [Green Version]
  11. Bartelt, A.; Bruns, O.T.; Reimer, R.; Hohenberg, H.; Ittrich, H.; Peldschus, K.; Kaul, M.G.; Tromsdorf, U.I.; Weller, H.; Waurisch, C.; et al. Brown adipose tissue activity controls triglyceride clearance. Nat. Med. 2011, 17, 200–205. [Google Scholar] [CrossRef]
  12. Sugimoto, S.; Mena, H.A.; Sansbury, B.E.; Kobayashi, S.; Tsuji, T.; Wang, C.-H.; Yin, X.; Huang, T.L.; Kusuyama, J.; Kodani, S.D.; et al. Brown adipose tissue-derived MaR2 contributes to cold-induced resolution of inflammation. Nat. Metab. 2022, 4, 775–790. [Google Scholar] [CrossRef]
  13. Zhao, L.; Fang, J.; Tang, S.; Deng, F.; Liu, X.; Shen, Y.; Liu, Y.; Kong, F.; Du, Y.; Cui, L.; et al. PM2.5 and Serum Metabolome and Insulin Resistance, Potential Mediation by the Gut Microbiome: A Population-Based Panel Study of Older Adults in China. Environ. Health Perspect. 2022, 130, 27007. [Google Scholar] [CrossRef]
  14. Yu, P.; Xu, R.; Li, S.; Yue, X.; Chen, G.; Ye, T.; Coêlho, M.; Saldiva, P.H.N.; Sim, M.R.; Abramson, M.J.; et al. Exposure to wildfire-related PM2.5 and site-specific cancer mortality in Brazil from 2010 to 2016: A retrospective study. PLoS Med. 2022, 19, e1004103. [Google Scholar] [CrossRef]
  15. Benmarhnia, T.; Oulhote, Y.; Petit, C.; Lapostolle, A.; Chauvin, P.; Zmirou-Navier, D.; Deguen, S. Chronic air pollution and social deprivation as modifiers of the association between high temperature and daily mortality. Environ. Health A Glob. Access Sci. Source 2014, 13, 53. [Google Scholar] [CrossRef] [Green Version]
  16. Li, J.; Woodward, A.; Hou, X.-Y.; Zhu, T.; Zhang, J.; Brown, H.; Yang, J.; Qin, R.; Gao, J.; Gu, S.; et al. Modification of the effects of air pollutants on mortality by temperature: A systematic review and meta-analysis. Sci. Total Environ. 2017, 575, 1556–1570. [Google Scholar] [CrossRef]
  17. Shaposhnikov, D.; Revich, B.; Bellander, T.; Bedada, G.B.; Bottai, M.; Kharkova, T.; Kvasha, E.; Lezina, E.; Lind, T.; Semutnikova, E.; et al. Mortality related to air pollution with the moscow heat wave and wildfire of 2010. Epidemiology 2014, 25, 359–364. [Google Scholar] [CrossRef] [Green Version]
  18. Wang, Q.; Li, B.; Benmarhnia, T.; Hajat, S.; Ren, M.; Liu, T.; Knibbs, L.D.; Zhang, H.; Bao, J.; Zhang, Y.; et al. Independent and Combined Effects of Heatwaves and PM2.5 on Preterm Birth in Guangzhou, China: A Survival Analysis. Environ. Health Perspect. 2020, 128, 17006. [Google Scholar] [CrossRef] [Green Version]
  19. De Sario, M.; Katsouyanni, K.; Michelozzi, P. Climate change, extreme weather events, air pollution and respiratory health in Europe. Eur. Respir. J. 2013, 42, 826. [Google Scholar] [CrossRef] [Green Version]
  20. Du, X.; Zeng, X.; Pan, K.; Zhang, J.; Song, L.; Zhou, J.; Chen, R.; Xie, Y.; Sun, Q.; Zhao, J.; et al. Metabolomics analysis of urine from healthy wild type mice exposed to ambient PM2.5. Sci. Total Environ. 2020, 714, 136790. [Google Scholar] [CrossRef]
  21. Du, X.; Zeng, X.; Zhang, J.; Pan, K.; Song, L.; Zhou, J.; Zhou, L.; Xie, Y.; Sun, Q.; Ge, W.; et al. Ambient fine particulate matter induced the elevation of blood pressure through ACE2/Ang(1–7) pathway: The evidence from urine metabolites. Ecotoxicol. Environ. Saf. 2020, 203, 111044. [Google Scholar] [CrossRef] [PubMed]
  22. Pan, K.; Jiang, S.; Du, X.; Zeng, X.; Zhang, J.; Song, L.; Zhou, J.; Kan, H.; Sun, Q.; Xie, Y.; et al. AMPK activation attenuates inflammatory response to reduce ambient PM2.5-induced metabolic disorders in healthy and diabetic mice. Ecotoxicol. Environ. Saf. 2019, 179, 290–300. [Google Scholar] [CrossRef] [PubMed]
  23. Smith, K.R.; Jerrett, M.; Anderson, H.R.; Burnett, R.T.; Stone, V.; Derwent, R.; Atkinson, R.W.; Cohen, A.; Shonkoff, S.B.; Krewski, D.; et al. Public health benefits of strategies to reduce greenhouse-gas emissions: Health implications of short-lived greenhouse pollutants. Lancet 2009, 374, 2091–2103. [Google Scholar] [CrossRef] [PubMed] [Green Version]
  24. Watts, N.; Amann, M.; Arnell, N.; Ayeb-Karlsson, S.; Beagley, J.; Belesova, K.; Boykoff, M.; Byass, P.; Cai, W.; Campbell-Lendrum, D.; et al. The 2020 report of The Lancet Countdown on health and climate change: Responding to converging crises. Lancet 2021, 397, 129–170. [Google Scholar] [CrossRef]
  25. Goettems-Fiorin, P.B.; Grochanke, B.S.; Baldissera, F.G.; dos Santos, A.B.; Homem de Bittencourt, P.I.; Ludwig, M.S.; Rhoden, C.R.; Heck, T.G. Fine particulate matter potentiates type 2 diabetes development in high-fat diet-treated mice: Stress response and extracellular to intracellular HSP70 ratio analysis. J. Physiol. Biochem. 2016, 72, 643–656. [Google Scholar] [CrossRef]
  26. Hansen, A.B.; Ravnskjær, L.; Loft, S.; Andersen, K.K.; Bräuner, E.V.; Baastrup, R.; Yao, C.; Ketzel, M.; Becker, T.; Brandt, J.; et al. Long-term exposure to fine particulate matter and incidence of diabetes in the Danish Nurse Cohort. Environ. Int. 2016, 91, 243–250. [Google Scholar] [CrossRef] [Green Version]
  27. Liu, C.; Fonken, L.K.; Wang, A.; Maiseyeu, A.; Bai, Y.; Wang, T.Y.; Maurya, S.; Ko, Y.A.; Periasamy, M.; Dvonch, T.; et al. Central IKKβ inhibition prevents air pollution mediated peripheral inflammation and exaggeration of type II diabetes. Part. Fibre Toxicol. 2014, 11, 53. [Google Scholar] [CrossRef] [Green Version]
  28. Pearson, J.F.; Bachireddy, C.; Shyamprasad, S.; Goldfine, A.B.; Brownstein, J.S. Association between fine particulate matter and diabetes prevalence in the U.S. Diabetes Care 2010, 33, 2196–2201. [Google Scholar] [CrossRef] [Green Version]
  29. Zanobetti, A.; Dominici, F.; Wang, Y.; Schwartz, J.D. A national case-crossover analysis of the short-term effect of PM2.5 on hospitalizations and mortality in subjects with diabetes and neurological disorders. Environ. Health A Glob. Access Sci. Source 2014, 13, 38. [Google Scholar] [CrossRef]
  30. Askari, S.; Asghari, G.; Ghanbarian, A.; Khazan, M.; Alamdari, S.; Azizi, F. Seasonal variations of blood pressure in adults: Tehran lipid and glucose study. Arch. Iran. Med. 2014, 17, 441–443. [Google Scholar]
  31. Iwen, K.A.; Backhaus, J.; Cassens, M.; Waltl, M.; Hedesan, O.C.; Merkel, M.; Heeren, J.; Sina, C.; Rademacher, L.; Windjäger, A.; et al. Cold-Induced Brown Adipose Tissue Activity Alters Plasma Fatty Acids and Improves Glucose Metabolism in Men. J. Clin. Endocrinol. Metab. 2017, 102, 4226–4234. [Google Scholar] [CrossRef] [Green Version]
  32. Zhang, J.; Zeng, X.; Du, X.; Pan, K.; Song, L.; Song, W.; Xie, Y.; Zhao, J. Parental PM2.5 Exposure-Promoted Development of Metabolic Syndrome in Offspring Is Associated with the Changes of Immune Microenvironment. Toxicol. Sci. 2019, 170, 415–426. [Google Scholar] [CrossRef]
  33. Zhou, J.; Geng, F.; Xu, J.; Peng, L.; Ye, X.; Yang, D.; Zhao, J.; Sun, Q. PM2.5 exposure and cold stress exacerbates asthma in mice by increasing histone acetylation in IL-4 gene promoter in CD4+ T cells. Toxicol. Lett. 2019, 316, 147–153. [Google Scholar] [CrossRef]
  34. Zhou, J.; Xu, J.; Geng, F.; Peng, L.; Ye, X.; Yang, D.; Zhao, J.; Sun, Q. Childhood co-exposure of cold stress and PM2.5 aggravates the susceptibility and severity of asthma in adulthood of mice. Environ. Toxicol. 2021, 36, 177–184. [Google Scholar] [CrossRef]
  35. Liu, G.; Sun, B.; Yu, L.; Chen, J.; Han, B.; Liu, B.; Chen, J. Short-term exposure to ambient air pollution and daily atherosclerotic heart disease mortality in a cool climate. Environ. Sci. Pollut. Res. 2019, 26, 23603–23614. [Google Scholar] [CrossRef]
  36. Watts, N.; Adger, W.N.; Agnolucci, P.; Blackstock, J.; Byass, P.; Cai, W.; Chaytor, S.; Colbourn, T.; Collins, M.; Cooper, A.; et al. Health and climate change: Policy responses to protect public health. Lancet 2015, 386, 1861–1914. [Google Scholar] [CrossRef]
  37. Ji, D.; Cui, Y.; Li, L.; He, J.; Wang, L.; Zhang, H.; Wang, W.; Zhou, L.; Maenhaut, W.; Wen, T.; et al. Characterization and source identification of fine particulate matter in urban Beijing during the 2015 Spring Festival. Sci. Total Environ. 2018, 628–629, 430–440. [Google Scholar] [CrossRef]
  38. Zhang, Y.-L.; Cao, F. Fine particulate matter (PM2.5) in China at a city level. Sci. Rep. 2015, 5, 14884. [Google Scholar] [CrossRef] [Green Version]
  39. Hameed, S.; Pan, K.; Su, W.; Trupp, M.; Mi, L.; Zhao, J. Label-free detection and quantification of ultrafine particulate matter in lung and heart of mouse and evaluation of tissue injury. Part. Fibre Toxicol. 2022, 19, 51. [Google Scholar] [CrossRef]
  40. Liu, C.; Xu, X.; Bai, Y.; Wang, T.Y.; Rao, X.; Wang, A.; Sun, L.; Ying, Z.; Gushchina, L.; Maiseyeu, A.; et al. Air pollution-mediated susceptibility to inflammation and insulin resistance: Influence of CCR2 pathways in mice. Environ. Health Perspect. 2014, 122, 17–26. [Google Scholar] [CrossRef] [Green Version]
  41. Rajagopalan, S.; Brook, R.D. Air Pollution and Type 2 Diabetes: Mechanistic Insights. Diabetes 2012, 61, 3037–3045. [Google Scholar] [CrossRef] [PubMed] [Green Version]
  42. Cai, Y.; Zhang, B.; Ke, W.; Feng, B.; Lin, H.; Xiao, J.; Zeng, W.; Li, X.; Tao, J.; Yang, Z.; et al. Associations of Short-Term and Long-Term Exposure to Ambient Air Pollutants with Hypertension: A Systematic Review and Meta-Analysis. Hypertension 2016, 68, 62–70. [Google Scholar] [CrossRef] [PubMed] [Green Version]
  43. Campolim, C.M.; Weissmann, L.; Ferreira, C.K.d.O.; Zordão, O.P.; Dornellas, A.P.S.; de Castro, G.; Zanotto, T.M.; Boico, V.F.; Quaresma, P.G.F.; Lima, R.P.A.; et al. Short-term exposure to air pollution (PM2.5) induces hypothalamic inflammation, and long-term leads to leptin resistance and obesity via Tlr4/Ikbke in mice. Sci. Rep. 2020, 10, 10160. [Google Scholar] [CrossRef]
  44. Downs, J.R.; Clearfield, M.; Weis, S.; Whitney, E.; Shapiro, D.R.; Beere, P.A.; Langendorfer, A.; Stein, E.A.; Kruyer, W.; Gotto, J.A.M.; et al. Primary Prevention of Acute Coronary Events with Lovastatin in Men and Women with Average Cholesterol LevelsResults of AFCAPS/TexCAPS. JAMA 1998, 279, 1615–1622. [Google Scholar] [CrossRef] [PubMed]
  45. Gardner, C.D.; Fortmann, S.P.; Krauss, R.M. Association of Small Low-Density Lipoprotein Particles with the Incidence of Coronary Artery Disease in Men and Women. JAMA 1996, 276, 875–881. [Google Scholar] [CrossRef]
  46. Araujo, J.A.; Barajas, B.; Kleinman, M.; Wang, X.; Bennett, B.J.; Gong, K.W.; Navab, M.; Harkema, J.; Sioutas, C.; Lusis, A.J.; et al. Ambient particulate pollutants in the ultrafine range promote early atherosclerosis and systemic oxidative stress. Circ. Res. 2008, 102, 589–596. [Google Scholar] [CrossRef]
  47. Yitshak Sade, M.; Kloog, I.; Liberty, I.F.; Schwartz, J.; Novack, V. The Association between Air Pollution Exposure and Glucose and Lipids Levels. J. Clin. Endocrinol. Metab. 2016, 101, 2460–2467. [Google Scholar] [CrossRef]
  48. Graña-Baumgartner, A.; Dukkipati, V.S.R.; Biggs, P.J.; Kenyon, P.R.; Blair, H.T.; López-Villalobos, N.; Ross, A.B. Mass Spectrometry-Based Lipidomics of Brown Adipose Tissue and Plasma of New-Born Lambs Subjected to Short-Term Cold Exposure. Animals 2022, 12, 2762. [Google Scholar] [CrossRef]
  49. Liu, X.; Tang, J.; Zhang, R.; Zhan, S.; Zhong, T.; Guo, J.; Wang, Y.; Cao, J.; Li, L.; Zhang, H.; et al. Cold exposure induces lipid dynamics and thermogenesis in brown adipose tissue of goats. BMC Genom. 2022, 23, 528. [Google Scholar] [CrossRef]
  50. Khedoe, P.P.S.J.; Hoeke, G.; Kooijman, S.; Dijk, W.; Buijs, J.T.; Kersten, S.; Havekes, L.M.; Hiemstra, P.S.; Berbée, J.F.P.; Boon, M.R.; et al. Brown adipose tissue takes up plasma triglycerides mostly after lipolysis. J. Lipid Res. 2015, 56, 51–59. [Google Scholar] [CrossRef] [Green Version]
  51. Du, X.; Jiang, S.; Zeng, X.; Zhang, J.; Pan, K.; Zhou, J.; Xie, Y.; Kan, H.; Song, W.; Sun, Q.; et al. Air pollution is associated with the development of atherosclerosis via the cooperation of CD36 and NLRP3 inflammasome in ApoE−/− mice. Toxicol. Lett. 2018, 290, 123–132. [Google Scholar] [CrossRef]
  52. Wei, Q.; Lee, J.H.; Wang, H.; Bongmba, O.Y.N.; Wu, C.-S.; Pradhan, G.; Sun, Z.; Chew, L.; Bajaj, M.; Chan, L.; et al. Adiponectin is required for maintaining normal body temperature in a cold environment. BMC Physiol. 2017, 17, 8. [Google Scholar] [CrossRef] [Green Version]
  53. Wolf, G. Adiponectin: A regulator of energy homeostasis. Nutr. Rev. 2003, 61, 290–292. [Google Scholar] [CrossRef]
  54. Xu, X.; Liu, C.; Xu, Z.; Tzan, K.; Zhong, M.; Wang, A.; Lippmann, M.; Chen, L.C.; Rajagopalan, S.; Sun, Q. Long-term exposure to ambient fine particulate pollution induces insulin resistance and mitochondrial alteration in adipose tissue. Toxicol. Sci. Off. J. Soc. Toxicol. 2011, 124, 88–98. [Google Scholar] [CrossRef] [Green Version]
  55. Wei, H.; Zhang, R.; Su, Y.; Bi, Y.; Li, X.; Zhang, X.; Li, J.; Bao, J. Effects of Acute Cold Stress after Long-Term Cold Stimulation on Antioxidant Status, Heat Shock Proteins, Inflammation and Immune Cytokines in Broiler Heart. Front. Physiol. 2018, 9, 1589. [Google Scholar] [CrossRef] [Green Version]
  56. Wandinger, S.K.; Richter, K.; Buchner, J. The Hsp90 Chaperone Machinery*. J. Biol. Chem. 2008, 283, 18473–18477. [Google Scholar] [CrossRef] [Green Version]
  57. Dezwaan, D.C.; Freeman, B.C. HSP90: The Rosetta stone for cellular protein dynamics? Cell Cycle 2008, 7, 1006–1012. [Google Scholar] [CrossRef]
  58. Sajad, S.; Jiang, S.; Anwar, M.; Dai, Q.; Luo, Y.; Hassan, M.A.; Tetteh, C.; Song, J. Genome-Wide Study of Hsp90 Gene Family in Cabbage (Brassica oleracea var. capitata L.) and Their Imperative Roles in Response to Cold Stress. Front. Plant Sci. 2022, 13, 908511. [Google Scholar] [CrossRef]
  59. Krishna, P.; Sacco, M.; Cherutti, J.F.; Hill, S. Cold-Induced Accumulation of hsp90 Transcripts in Brassica napus. Plant Physiol. 1995, 107, 915–923. [Google Scholar] [CrossRef]
  60. Watterson, T.L.; Hamilton, B.; Martin, R.; Coulombe, R.A., Jr. Urban particulate matter causes ER stress and the unfolded protein response in human lung cells. Toxicol. Sci. Off. J. Soc. Toxicol. 2009, 112, 111–122. [Google Scholar] [CrossRef] [Green Version]
  61. Liu, C.; Bai, Y.; Xu, X.; Sun, L.; Wang, A.; Wang, T.-Y.; Maurya, S.K.; Periasamy, M.; Morishita, M.; Harkema, J.; et al. Exaggerated effects of particulate matter air pollution in genetic type II diabetes mellitus. Part. Fibre Toxicol. 2014, 11, 27. [Google Scholar] [CrossRef] [PubMed] [Green Version]
  62. Song, L.; Jiang, S.; Pan, K.; Du, X.; Zeng, X.; Zhang, J.; Zhou, J.; Sun, Q.; Xie, Y.; Zhao, J. AMPK activation ameliorates fine particulate matter-induced hepatic injury. Environ. Sci. Pollut. Res. 2020, 27, 21311–21319. [Google Scholar] [CrossRef] [PubMed]
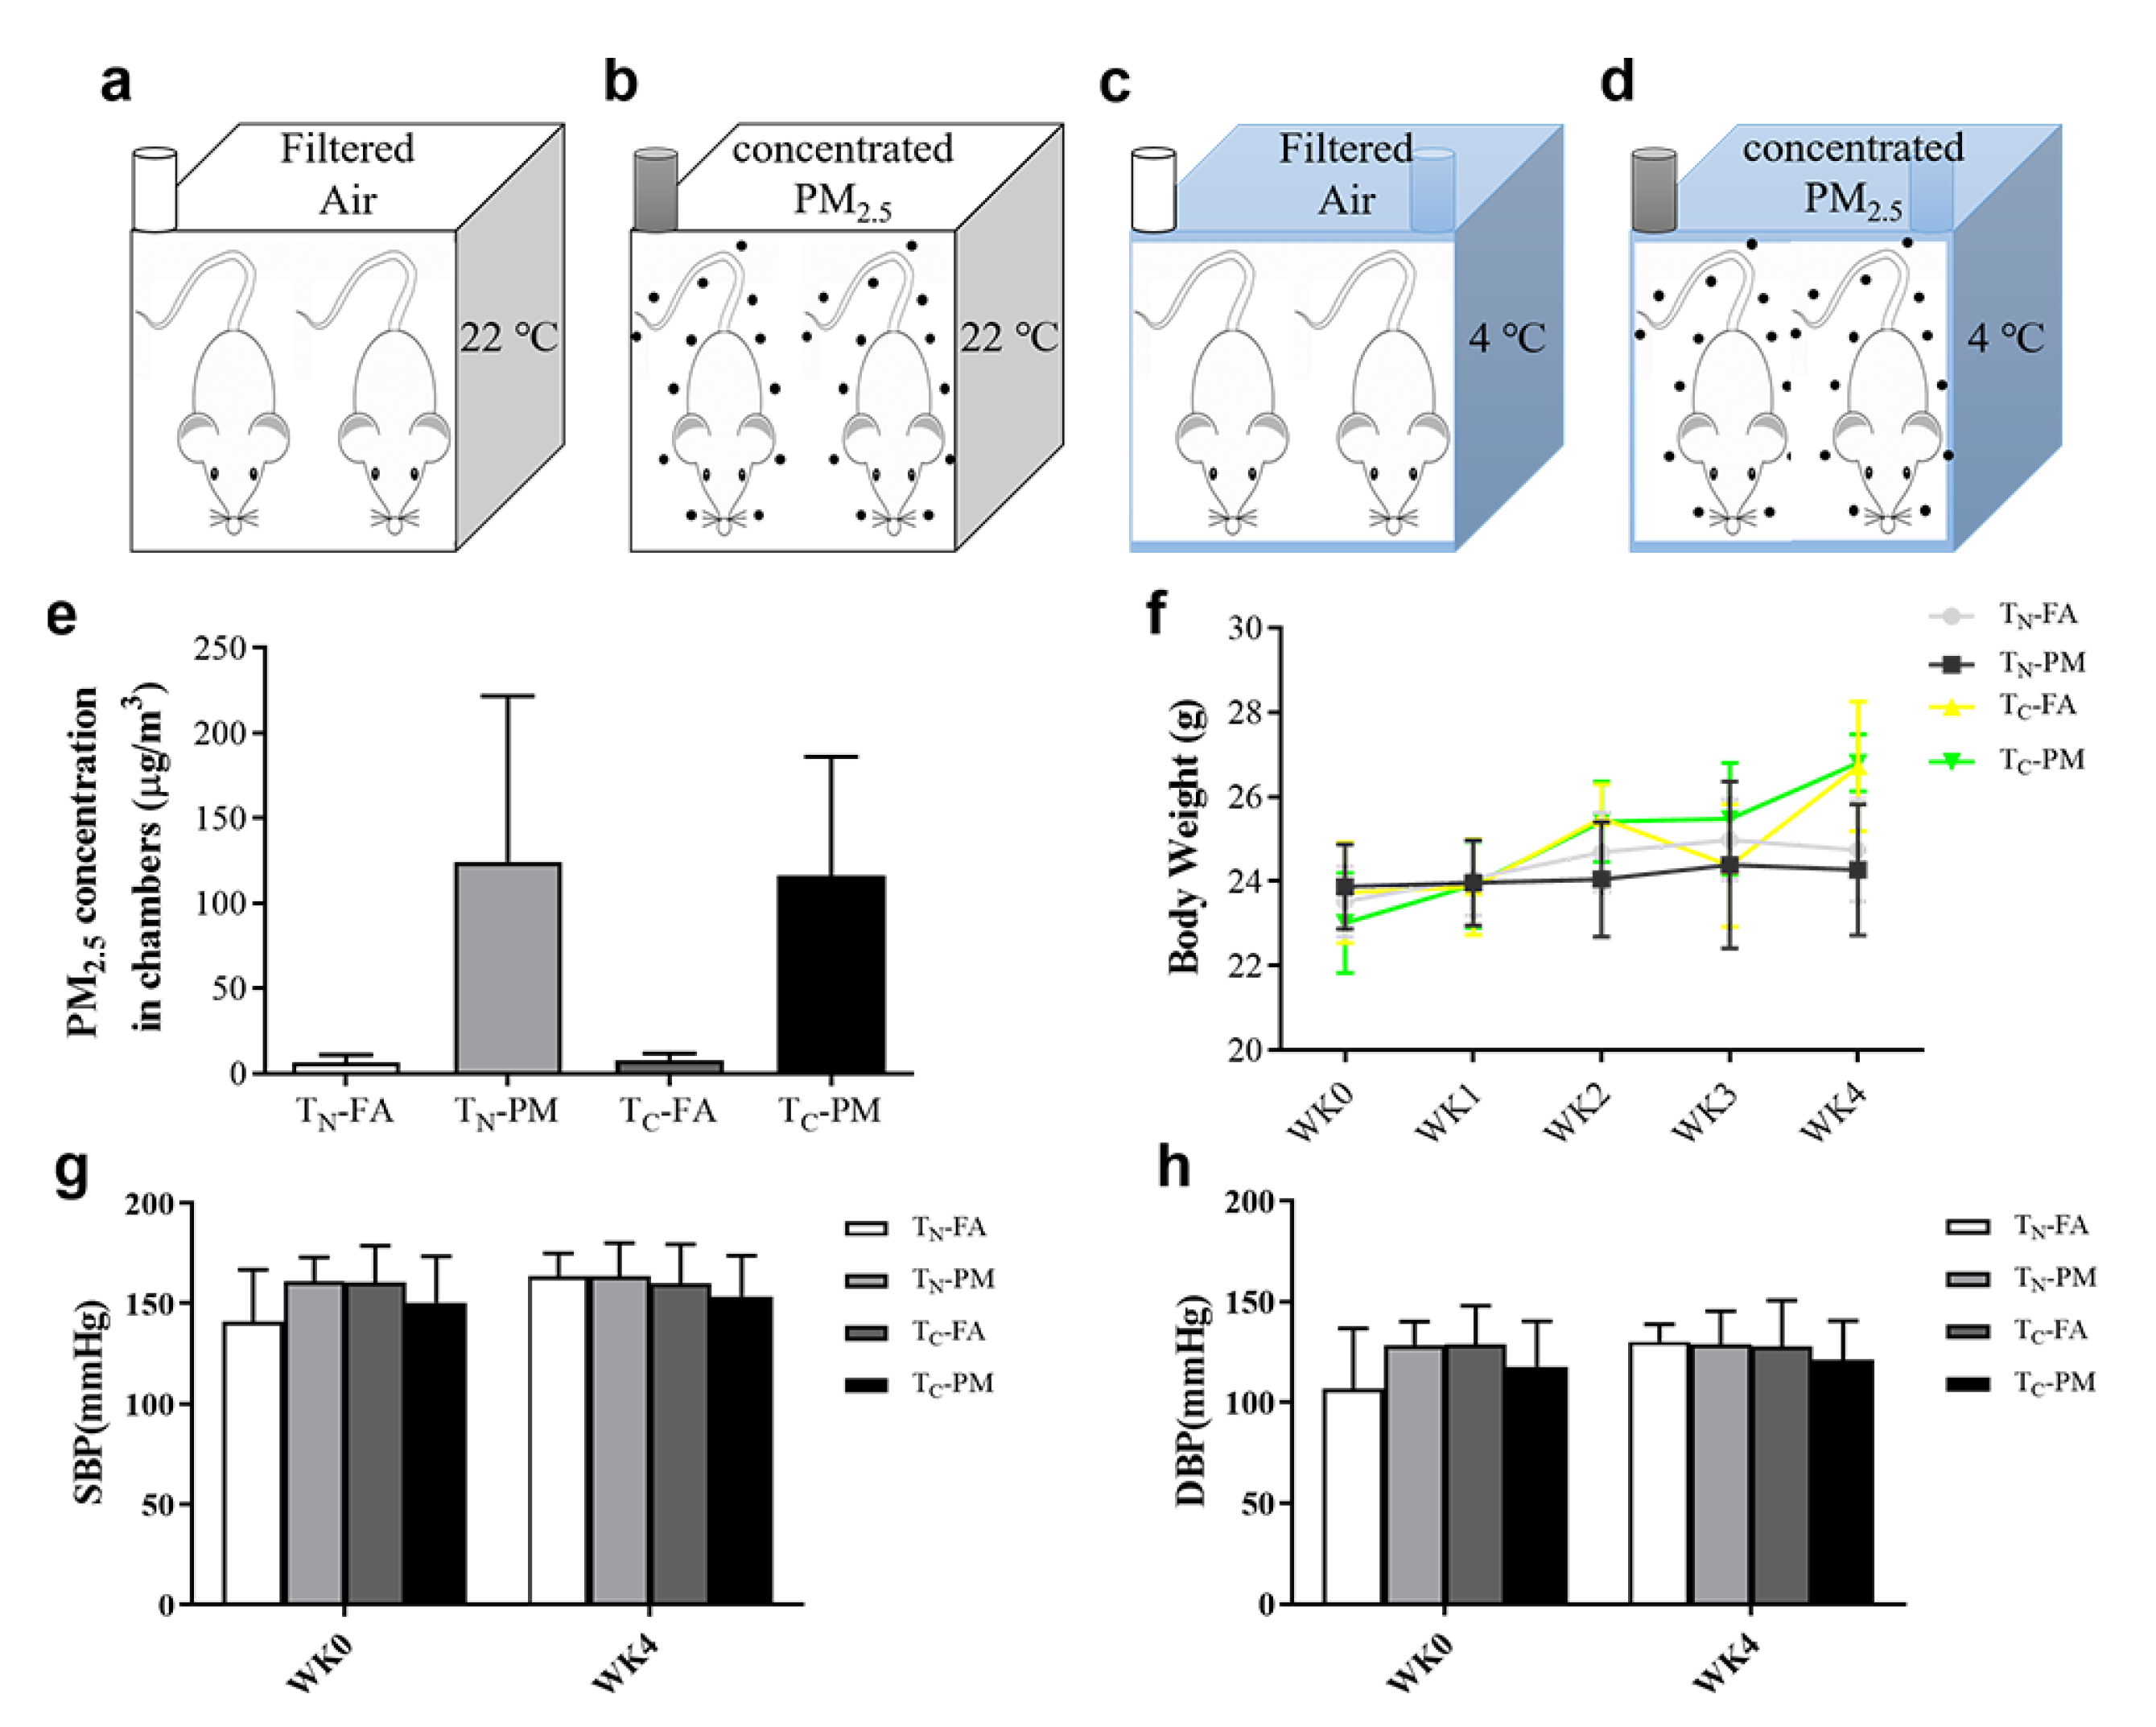
Figure 1. Exposure schematic (ad), PM2.5 concentrations (e), body weight (f), and blood pressure of different groups during exposure (g,h).
Atmosphere 14 01157 g001
Figure 2. Glucose tolerance and insulin resistance in mice after combined exposure to PM2.5 and the cold. (a,b) Fasting blood glucose and insulin of mice. (c) HOMA-IR. (d) IPGTT. (e) ITT. * p < 0.05, ** p < 0.01, FA vs. PM; # p < 0.05, TC vs. TN.
Atmosphere 14 01157 g002
Figure 3. Energy metabolism of mice by metabolic cage. (ad) VO2, VCO2, RER and heat production in mice after combined exposure to PM2.5 and the cold. * p < 0.05, ** p < 0.01, FA vs. PM; ## p < 0.01, TC vs. TN.
Atmosphere 14 01157 g003
Figure 4. Representative images of the H&E staining of WAT (a) and BAT (b) in mice after combined exposure to PM2.5 and the cold. Number and morphology of mitochondria in BAT of mice via transmission electron microscopy ((TEM, cf). (c) The ratio of BAT weight to body weight in mice. (d) Morphology of mitochondria in BAT. (e) Area of mitochondria in BAT. (f) Number of mitochondria in BAT. * p < 0.05, ** p < 0.01, FA vs. PM; ## p < 0.01, TC vs. TN.
Atmosphere 14 01157 g004
Figure 5. Blood lipids of mice. (ad) TC, TG, LDL and HDL in the serum of mice after combined exposure to PM2.5 and the cold. * p < 0.05, FA vs. PM.
Atmosphere 14 01157 g005
Figure 6. Inflammatory cytokines and adipocytokines in the serum of mice. (ad) IL-6, TNF-α, leptin and adiponectin in the serum of mice. * p < 0.05, ** p < 0.01, FA vs. PM; # p < 0.05, ## p < 0.01, TC vs. TN.
Atmosphere 14 01157 g006
Figure 7. Protein expression of UCP-1 and HSP90 in the WAT (a,b) and BAT (c,d) of mice after combined exposure to PM2.5 and the cold. * p < 0.05, ** p < 0.01, FA vs. PM; # p < 0.05, ## p < 0.01, TC vs. TN.
Atmosphere 14 01157 g007
Disclaimer/Publisher’s Note: The statements, opinions and data contained in all publications are solely those of the individual author(s) and contributor(s) and not of MDPI and/or the editor(s). MDPI and/or the editor(s) disclaim responsibility for any injury to people or property resulting from any ideas, methods, instructions or products referred to in the content.