Abstract
With the changing climate, the frequency and intensity of extreme precipitation events are increasing. Climate change is projected to increase both mean and extreme precipitation. Socio-economic damages can be immense and require a difficult recovery, especially for developing countries such as Bhutan. Furthermore, changing precipitation patterns affect land productivity and water availability. The Experts Team on Climate Change Detection Indices (ETCCDI) is used to find the changes associated with extreme precipitation in Bhutan. The study of extreme precipitation is important for Bhutan, whose economy is dependent on agriculture and hydropower. Even for a small country, there were varying patterns of precipitation in different districts. Deothang district received less frequent and more intense rainfall, while Haa, Bumthang, Trashiyangtse, and Chukha received weak but persistent rainfall. Mann–Kendall trends revealed a drier climate for two districts, Dagana and Trashiyangtse, and a wetter climate for the Mongar district. Modeling of the extreme rainfall with extreme value theory (EVT) revealed that the generalized extreme value (GEV) distribution by their T = 50-year return value, indicating an increasing value of annual maximums for all stations. This study is the first of its kind for Bhutan, and the findings can be used for decision support and the planning of appropriate adaptation strategies for hydro-meteorological disasters, hydropower, and agriculture sectors in Bhutan.
1. Introduction
Extreme climate events and their variability are associated with devastating environmental and socio-economic consequences. These impacts are greater in developing countries, where most of the population depends on climate-sensitive sectors and where the ability to recover from hazards is relatively low [1]. According to the IPCC’s Fifth Assessment Report [2], global land and sea surface temperatures have risen by 0.85 °C during the last century. A changing climate aggravates variability in the spatiotemporal patterns of weather and climate extremes, potentially resulting in unprecedented extremes [3]. Several studies have confirmed the impacts of anthropogenic climate change on the intensification of extreme precipitation [3,4,5,6,7]. Therefore, analyzing historical precipitation extremes is crucial for climate assessment, water resource management, mitigation strategies, and sustainable agricultural and developmental practices [8,9].
Numerous studies using both observations and models found global trends to be increasing, predicting a wetter future. For instance, Alexander et al. [10] reported that contributions from very wet days to the annual total precipitation had slightly increased, indicating an increase in the worldwide extreme precipitation. This was further supported by [9,11,12,13,14,15], although the trends were spatially heterogeneous. Findings from the South Asian region also revealed a similar increase [16]. In Pakistan, [17] found a higher intensity and recurring frequency of precipitation events in the more recent period, while [8] suggested an overall increase in precipitation in the same region, which shifts the center of maxima and intensity of extreme precipitation events. For Bangladesh, increasing trends were mostly for the spring and summer monsoon seasons [14,18]. In contrast, studies in Nepal [19,20] revealed a general prolongation of dry periods, with a decrease in post-monsoon rainfall but with heterogeneous patterns in the increasing trends of the annual and high-intensity precipitation. In all these studies, the extreme indices set by the Experts Team on Climate Change Detection Indices (ETCCDI) were utilized with the Mann–Kendall test to detect trends in extreme precipitation. Mountainous regions are more vulnerable to global climate change [1,21]. The IPCC’s report on extreme events and disasters states that the Hindu Kush Himalayan region is warming at a much higher rate than the global mean [1,2]. The countries in these regions are highly exposed to the adverse effects of changing climates due to their topography, seismic activities, land-use patterns, and other anthropogenic activities [2,19,22]. The capacity to study climate trends in these areas is constrained by the lack of sufficient length and spatial extent of observed data. Moreover, high-mountain precipitation patterns are harder to simulate with climate models [23].
Located in the Eastern Himalayas, more than 70% of Bhutan is covered by forest. Although it is a carbon-negative country, it ranks fourth highest in the region, with 1.7% of the total population exposed to flood risks [24]. An increasing number of disasters related to hydro-meteorological hazards are reported in the country [24,25]. For example, 21 people were killed and extensive property was damaged by the glacial lake outburst flood (GLOF) event of Luggye Tsho in 1994. Thirteen people died in 2009 as a result of heavy rains brought by Cyclone Aila, with an estimated economic loss of more than USD 15.8 million [24,26]. Most of these hazards are caused by heavy or extreme precipitation during the monsoon season [19,27,28,29].
Previous studies on rainfall trends in Bhutan revealed a general decreasing trend, but future projections show an increase with a substantial change in the spatial pattern of winter and summer monsoon precipitation [1,26,30]. Sharma et al. [31] revealed that rainfall patterns in the south of the country are negatively influenced by the El Nino–Southern Oscillation (ENSO) cycle, while the majority of the country remains unaffected. All these studies confirmed the sporadic nature of rainfall patterns over Bhutan owing to its orography. However, a detailed study to understand the patterns of extreme precipitation in Bhutan is missing. Given the presence of numerous microclimates in the country, there is a high demand for localized information for better planning, resource management, and disaster prevention.
Therefore, this study has been conducted to analyze spatiotemporal patterns of extreme precipitation in terms of its frequency, amount, and duration over Bhutan. While the Mann–Kendall approach has been used in previous studies, this study is unique in terms of its use of the extreme indices from the Experts Team on Climate Change Detection (ETCCDI), which provide a thorough outlook on rainfall patterns. Furthermore, the 50- and 100-year rainfall return values calculated with the extreme value theory (EVT) provide further information on future extremes.
The findings from this study can provide essential information to decision-makers and policymakers. The remaining parts of this paper are arranged as follows. Section two describes the physical and climatic characteristics of the study domain, while Section three covers data and methods. Section four summarizes the results and discussions, and Section five concludes the study.
2. Study Area
Bhutan is located in the Eastern Himalayas at [27.5142° N, 90.4336° E] and is landlocked between India and China (Figure 1). It has an area of approximately 38,000 square kilometers and is characterized by non-uniform and rugged topography ranging from less than 100 m in the southern plains to more than 7000 m in the high mountains of the north. It has three distinct climate zones: the southern belt, characterized by a subtropical climate, high humidity, and heavy rainfall; the central belt, characterized by cool winters, hot summers, and moderate rainfall; and the northern belt, with cold winters and cool summers. During summer, the southwest monsoon brings rain over Bhutan, with occasional heavy rainfall brought on by the cyclonic systems over the Bay of Bengal, while the winter season is affected by Western disturbances originating in the Mediterranean region [26,32].
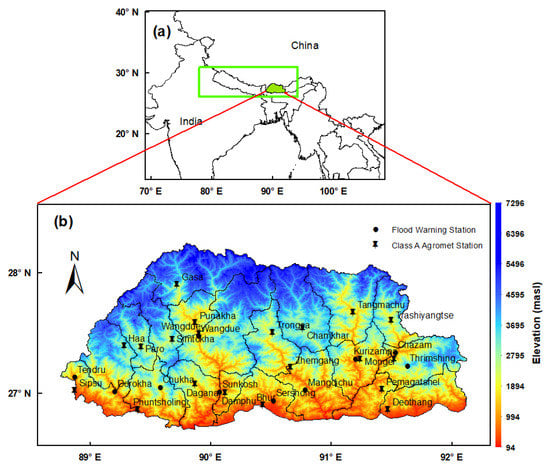
Figure 1.
(a) Study area showing the location of Bhutan in South Asia (the green box shows the Eastern Himalayas); (b) topography (unit: meters above sea level (masl)) of the study area and the locations of the stations.
The majority of the meteorological stations in the country lie below 3000 m. As stations lying above 3000 m (northern Bhutan) lack long-term meteorological data, they cannot be included in this study. Therefore, the study area is limited to the central and southern belts of the country.
3. Data and Methodology
3.1. Data
Daily surface observational data from the National Centre for Hydrology and Meteorology (NCHM) of Bhutan were utilized in this paper. It includes rainfall datasets from 1996–2021 for 20 agro-meteorological stations and 10 flood warning stations (FWS). The spatial locations of the stations are shown in Figure 1b. Table 1 shows the stations with their altitude and annual maximum rainfall. Data were examined for missing values and outliers, and stations with more than 3% of their observations missing were discarded. The initial 30 stations were then reduced to 25.

Table 1.
Selected stations, their altitudes, and the annual maximum 1-day precipitation.
3.2. Precipitation Indices
Ten extreme indices (Table 2) were selected based on the ETCCDI [33] of the World Meteorological Organization (WMO). These were chosen to access and quantify extreme precipitation in Bhutan in terms of intensity, frequency, and duration. Indices established by the ETCCDI have been extensively used to study extremes in precipitation and temperature at regional and global scales [8,10,18,19,20].

Table 2.
Precipitation indices used.
The chosen indices in this study were calculated from the daily precipitation data using RClimdex (a package in the statistical programming language R) [34].
3.3. Trend Analysis
3.3.1. Mann–Kendall (MK) Test
The M–K test [35,36] is a nonparametric statistical test widely used to detect monotonic trends in climatological and hydrological time series data. It does not require data to be normally distributed, nor does it depend on the magnitude of missing data values, and it is also less sensitive to outliers [37]. In this test, the null hypothesis (Ho), that there is no trend, is tested against the alternative hypothesis (H1), that there is an increasing or decreasing monotonic trend.
The standardized Mann–Kendall Test statistic S is given as
where and are the data points of the time series, and m is the data length of the time series.
The variance of S is given as
The normalized test statistic Z is a measure of the significance of the trend. If Z > 0 (Z < 0), the trend is increasing (decreasing). In this paper, α = 0.05 level of significance was used. At α = 0.05, the trend is significant if |Z| > Z1 − α/2, where Z1 − α/2 is tabulated from the standard normal distribution Tables and is calculated as
3.3.2. Sen’s Slope Estimator
The magnitude of a trend is determined by the nonparametric Sen’s slope estimator test. It assumes that the trend is linear. Sen’s slope Q is given as
where j > k.
3.4. Return Level
3.4.1. Generalized Extreme Value Distribution
The extreme value theory (EVT) is a statistical methodology used to infer the probability of rare or extreme events. It assumes extreme events to be stationary and involves fitting data into a probability distribution(s) based on the Fisher–Tippett–Gnedenko theorem [38]. Of the two distributions used in EVT, the generalized Pareto distribution (GPD) uses exceedances over a threshold, while the generalized extreme value (GEV) distribution takes the block maxima approach (annual maximum rainfall). The latter has been chosen for this study as there are no well-defined rainfall thresholds for Bhutan that effectively capture all the microclimates at present.
Moreover, Easterling et al. [39] found that the GEV distribution is a suitable fit to the tails of the distribution for atmospheric variables. The GEV is a three-parameter distribution that combines all three extreme value distributions: Gumbel (Type I), Frchet (Type II), and the negative Weibull (Type III). The three parameters are location, scale, and shape. The GEV cumulative distribution function can be given as
where −∞ < μ < ∞ is the location parameter, α > 0 is the scale parameter, and −∞ < σ < ∞ is the shape parameter. The sign of the shape parameter σ defines the type of the distribution. If σ = 0, it is the two-parameter Gumbel distribution; if σ > 0, it is the Fréchet distribution; and if σ < 0, it is the upper-bounded Weibull distribution. The maximum likelihood estimate (MLE), due to its high efficiency [40], is used to estimate the parameters, which are obtained by maximizing the log-likelihood with its parameter estimates. The GEV log-likelihood is given as
Solving the above equation provides the maximum likelihood estimates (MLE) Numerous studies have shown EVT to successfully model extreme precipitation [41,42,43,44,45,46,47,48,49].
3.4.2. GEV Return Periods and Return Levels
Once the data have been fitted to the probability model, the occurrence of the extreme quantile can be calculated for a given return period. A return period (T), also known as a recurrence interval or repeat interval, is the average time or an estimated average time between events such as earthquakes, floods, landslides, or river discharge flows. It is given as , where ‘p’ is the probability of occurrence of a rainfall of magnitude equal to or greater than a magnitude having a return period ‘T’ in any given year. The return level (Xp) is the level exceeded on average once in T years: .
For GEV, the return level Zp for a return period 1/p can be obtained as follows:
3.4.3. Goodness of Fit/Model Choice
In order to see if the distribution choice is appropriate for the data, the goodness of fit of the GEV distribution is checked. Probability and quantile plots are graphical techniques used to assess if the fitted data originate from a given or known probability distribution, in this case, the GEV distribution. The data are plotted against a theoretical distribution so that the points should form an approximately straight line. Departures from this straight line indicate departures from the specified distribution [50].
4. Results and Discussion
4.1. Precipitation Climatology in Bhutan
Prior to analyzing variations in precipitation extremes, it was necessary to understand the general characteristics of the precipitation patterns. Figure 2 shows the spatial variability of the mean annual rainfall and monthly precipitation averaged over all stations. The mean annual rainfall decreases with increasing latitude, ranging from >5000 mm in the southern belt to <580 mm in the north (Figure 2a). This pattern can be attributed to the orographic effect on the southwest monsoon, which deposits most of the rainfall in the southern plains and decreases as it travels northward. Meanwhile, winter precipitation is relatively weaker and mainly in the form of snow in northern Bhutan. The summer (JJAS) months contribute to ~72% of the total rainfall (Figure 2b) [26].
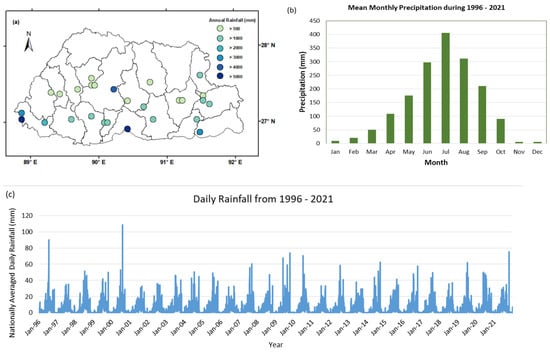
Figure 2.
(a) Spatial map of mean annual rainfall over Bhutan during 1996–2021; (b) mean monthly rainfall during 1996–2021; (c) time series of the nationally averaged daily rainfall during 1996–2021.
This season (JJAS) also records the highest frequency of extreme events from 1968 to 2022 [51,52]. Figure 2c shows the time series of the nationally averaged daily rainfall data for 1996–2021. The spatial pattern of mean monsoon precipitation (Figure 3) shows a similar latitudinal variation as the mean annual rainfall. It can also be seen that the pre-monsoon season received more rainfall compared to the post-monsoon months. The winter months recorded the least rainfall throughout the country.
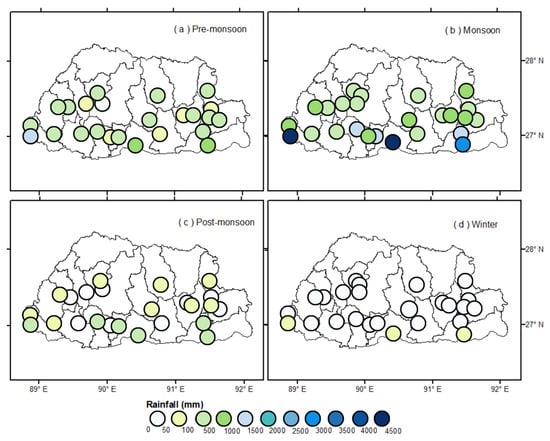
Figure 3.
Spatial map of seasonal mean rainfall over Bhutan during 1996–2021: (a) Pre-monsoon, (b) Monsoon, (c) Post-monsoon, (d) Winter rainfall.
Table 3 summarizes the trend in annual and wet seasonal (monsoon) rainfall based on the nonparametric MK test conducted at a 95% confidence level. The results reveal an insignificant downward trend for the annual rainfall as well as the summer rainfall.

Table 3.
Summary of MK results for annual and monsoonal rainfall over Bhutan during 1996–2021.
4.2. Spatial Distribution of Extreme Precipitation Indices
Zhang et al. [34] categorize the indices Rx1Day, Rx5Day, R95p, and R99p as intensity indicators; R10 mm and R20 mm as frequency indicators; CDD and CWD as duration indicators; and SDII and PRCPTOT as extra indicators (Table 2). The spatial distribution of the rainfall indices is given in Figure 4a. According to this figure, the indices show a similar latitudinal variation as the annual rainfall distribution of the country. Results from Figure 4a are compared to the mean annual number of rainy days (Figure 4b). All intensity, frequency, and duration indices were high at stations in the southern region. These stations also had the highest mean number of annual rainy days between 1996 and 2021. As most of the rain is deposited in this region during the southwest monsoon, the result is consistent with the annual rainfall distribution. However, for Deothang station, located in the southeast region, the high-intensity values were recorded on fewer rainy days (<130 Days).
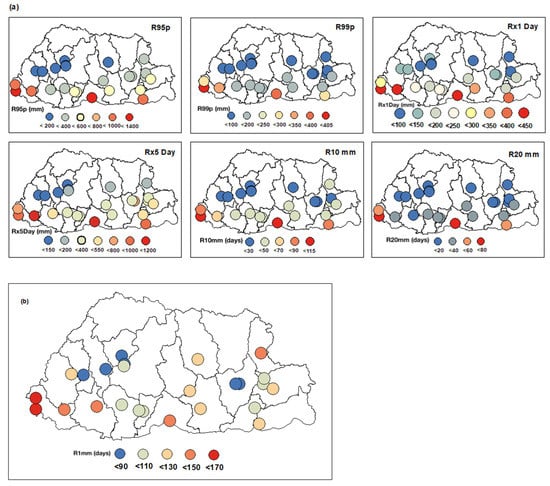
Figure 4.
(a) Spatial distribution of frequency (R10 mm and R20 mm) and intensity indices (R95p, R99p, Rx1Day, and Rx5Day). Note: The legend for each map is different; (b) Spatial distribution of the mean annual number of days when rainfall > 1 mm (rainy day).
The lowest values of the indices were concentrated in the western, central, and eastern regions. Contrary to the expected low number of rainy days for these stations, Haa, Bumthang, and Trashiyangtse stations had a higher number of rainy days. Haa, Bumthang, and Trashi Yangtse are located in west, central, and eastern Bhutan, respectively. Nearly as many rainy days were recorded at these stations as at Deothang. In addition, Chukha FWS, with lower intensity values, had a higher number of rainy days than Deothang. Such high values of the intensity indices associated with fewer rainy days indicate less frequent but more intense rainfall events, while the reverse indicates weaker but more persistent rainfall [19]. With the exception of Bumthang, the remaining stations in the central region had moderate values of the indices.
Figure 5 shows the hydro-meteorological hazards recorded from media coverage for 1996–2021. As media coverage is usually limited to events with significant damage to infrastructure and lives, the figure only provides a rough picture of the frequency of such events. While stations in regions of high annual precipitation had a higher number of extreme events, it was interesting to note that Kanglung and Trashi Yangtse stations also recorded a high number despite having relatively lower values for the rainfall indices. Similarly, Gasa station, located in northern Bhutan, also experienced a high number of hazards. This indicates that statistically insignificant values of rainfall can trigger hazards that can have a disastrous socio-economic impact on the region or the country. For example, in Lhuentse in 2022, weak but persistent rainfall triggered a flash flood, which led to the loss of five lives and the destruction of several households and their properties. It is therefore crucial to have localized information for better planning, managing natural resources, and disaster prevention.
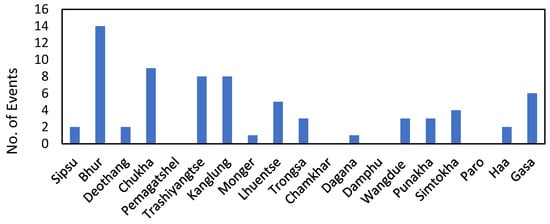
Figure 5.
Number of hydro-meteorological hazards between 1996 and 2021 collected from media records.
4.3. Trends in Extreme Precipitation Indices
The spatial distribution of the station-wise trends in extreme precipitation indices is given in Figure 6. Out of the four intensity indicators, three (Rx1Day, Rx5Day, and R95p) showed a downward trend for 56% of the total stations, although they are not uniformly distributed. For these three indices, the downward trend is dominant over the western and eastern parts of the country. Dagana station showed a significant downward trend for all three indicators (Rx1Day: 1.7 mm, Rx5Day: 4.9 mm, and R95p: 20.5 mm), while the significant downward trend for Trashi Yangtse is only for R95p (4.8 mm). Over central Bhutan, including the south-central region, the rainfall intensity is increasing, although not significantly. Given the complex nature of Bhutan’s terrain, the Rx1Day events are capable of causing hazards of significant magnitude. For the total annual rainfall above the 99th percentile, 76% of the stations showed no trends, while a small number in the south-central region showed a non-significant increasing trend.
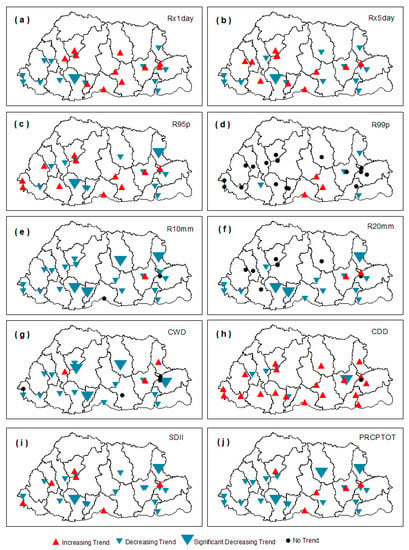
Figure 6.
Spatial distribution of trends in extreme precipitation indices over Bhutan: (a) Rx1Day, (b) RX5Day (c) very wet days (R95p), (d) extremely wet days (R99p), (e) R10 ≥ 10 mm, (f) R20 ≥ 20 mm, (g) consecutive wet days (CWD), (h) consecutive dry days (CDD), (i) SDII, and (j) PRCPTOT.
The number of days with rainfall amounts greater than 10 mm had decreasing trends at 88% of the stations. These trends were significant over Trashi Yangtse (0.25 days), Bumthang (0.4 days), Dagana (1.8 days), and Damphu (0.85 days). Likewise, for R20 mm, the decreasing trend was dominant, with significant values for Trashi Yangtse (0.37 Days), Dagana (1.2 Days), and Damphu (0.55 days). A decreasing frequency of rainfall is a concern for agriculture and hydropower, the two major economy generating sectors of Bhutan. The trend for consecutive wet days (CWD) is significantly negative over Damphu (0.5 days), Bumthang (0.4 Days), Wangdue FWS (0.2 days), and Thrimshing FWS (0.25 days). A noteworthy observation is the increasing trend of consecutive dry days across 72% of the stations. Karki et al. [19] pointed to a similar increasing CDD trend across Nepal, Bangladesh, and China, given its association with large-scale weather systems rather than localized systems.
The downward trend for Dagana station is significant for the three intensity indices (Rx1Day, Rx5Day, and R95p), both frequency indices (R10 mm and R20 mm), and other indicators (SDII and PRCPTOT). The duration indicators point to a decreasing trend for wet spells (CWD) while dry spells (CDD) are increasing, although the trends are insignificant. These results indicate Dagana is becoming drier over time. A similar pattern can be seen for Trashi Yangtse station. Significant downward trends can be noted for the intensity indicator R95p, for both frequency indicators, for SDII, and for total precipitation (PRCPTOT). However, dry and wet spells both seem to be increasing, although insignificantly. The reverse can be seen for Monger. Intensity, frequency, and duration indices, including total precipitation, are increasing while consecutive dry days are significantly decreasing (1.9 days). The large heterogeneity in the spatial patterns is in line with previous trend studies in Bhutan.
4.4. Spatial Distribution of Rx1Day and Rx5Day Trends on a Seasonal Scale
The spatial distribution of Rx1Day and RX5Day trends on a seasonal scale is shown in Figure 7 and Figure 8. For the pre-monsoon season, all stations in the central belt show an increasing trend, while stations in the southern belt show decreasing values. This season is prone to impacts from cyclones in the Bay of Bengal, which can sometimes cause devastating socio-economic impacts. For the monsoon season, 84% of the stations showed decreasing trends, with only one significant value in Dagana. The increasing values were detected for Punakha, Wangdue, Trongsa, and Sarpang stations. Both the post-monsoon and winter seasons showed longitudinal variation in the trends, but with contrasting west–east variation, while stations in the eastern region can expect an increase in Rx1Day during the winter season.
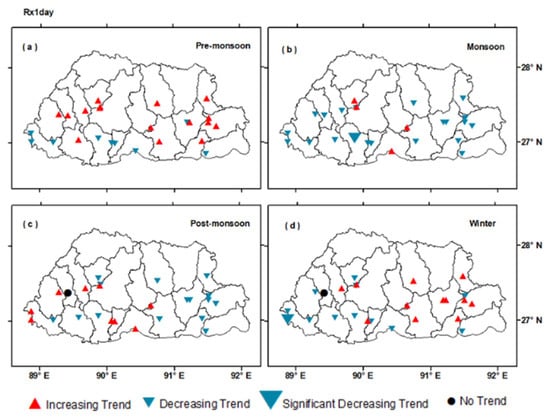
Figure 7.
Spatial distributions of the trends of Rx1Day at different meteorological stations on seasonal scales during 1996–2021: (a) pre-monsoon, (b) monsoon, (c) post-monsoon, and (d) winter. The significance level is set to 0.05.
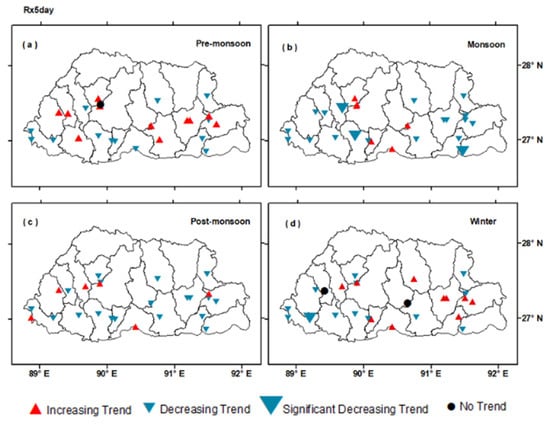
Figure 8.
Spatial distributions of the trends of Rx5Day at different meteorological stations on seasonal scales during 1996–2021: (a) pre-monsoon, (b) monsoon, (c) post-monsoon, and (d) winter. The significance level is set to 0.05.
Similarly, the spatial patterns of Rx5Day trends are shown in Figure 8. No consistent patterns can be seen in any of the seasons. Regardless, significant downward trends were detected for Thimphu, Dagana, and Deothang during the monsoon period. Similar to Rx1Day, parts of eastern Bhutan can expect an increase in Rx5Day during the winter season.
As mentioned in Section 4.1, the monsoon season contributes the most to the annual rainfall, thus enriching the hydropower and water sectors. However, rainfall patterns in the pre-monsoon and post-monsoon are more variable. Therefore, knowledge of rainfall variability in the pre-monsoon, post-monsoon, and winter seasons might be of interest to the rain-dependent sectors.
4.5. Modeling Using GEV
The model diagnostics for Rx1Day are given in Figure 9. For both the probability and quantile plots, the points are very close to the linear line, indicating that the GEV is a good fit. Similarly, the return level and the density plot also show that the GEV distribution can model the data correctly. The plots for the individual stations also showed a good fit, with only a few points diverging from the straight lines. However, individual plots have not been included in this study for brevity.
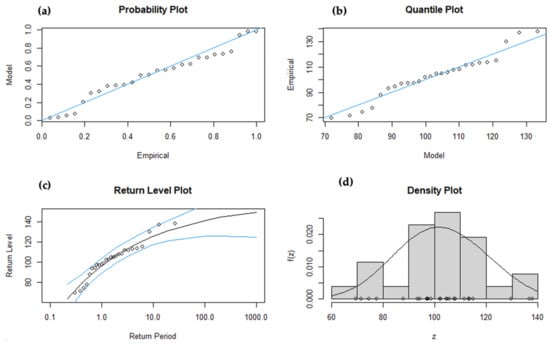
Figure 9.
Model diagnostics for GEV for the national data during 1996–2021: (a) Probability plot, (b) Quantile plot, (c) Return level plot, (d) Density plot.
4.6. Return Levels
Table 4 provides return levels of the one-day maximum (Rx1Day) for the return periods of 50 and 100 years. These 50- and 100-year return levels are the maximum possible precipitation during a precipitation event within a 50- or 100-year period [43]. The return level increased with the increase in the return period. For Sipsu station, the one-day maximum rainfall (445.2 mm), which triggered floods in the area, was exceeded by both the T = 50-year and T = 100-year return values. This means that similar flooding events might occur once every 50 or 100 years in Sipsu. The annual maximums of 88% of the stations are exceeded by their T = 50-year return value. The estimated return levels for the next 100 years indicate an increasing rainfall intensity for all stations and predict higher rainfall amounts than those recorded for these indices. Stations along the southern belt had the highest return values for all indices.

Table 4.
Return levels of the one-day maximum rainfall for 50 and 100 years.
5. Conclusions
Despite the high vulnerability to the impacts of extreme weather events, studies on extreme precipitation patterns are currently lacking in Bhutan. Therefore, using the 10 ETCCDI indices and the extreme value theorem (EVT), this paper studied extreme precipitation patterns across the country. A clear latitudinal pattern was found in the annual rainfall, with the monsoon season contributing the most. While stations with higher numbers of rainy days usually had higher values of the extreme indices, Deothang station had high-intensity rainfall on a fewer number of rainy days, whereas Haa, Bumthang, Chukha, and Trashi-Yangtse had the reverse. For the trend analysis, a spatially non-uniform decrease in the rainfall indices was observed. Generally, the high intensity indicators were decreasing (insignificant trend) in the west and east of Bhutan, while they were increasing (insignificant trend) in the central and south-central regions. The one-day maximum rainfall (Rx1Day) was increasing (insignificant trend) in the west, east, and central regions during the pre-monsoon season, while it was decreasing (insignificant trend) across most of the country during the summer. The post-monsoon and winter seasons had contrasting west–east variations in the trend. Significant downward trends in Dagana and Trashi-Yangtse indicated that these two stations were gradually drying. On the contrary, a non-significant increasing trend in the total precipitation (PRCPTOT), intensity, and frequency indices, with a significant decrease in the consecutive wet days (CDD), suggested a wetter climate for Mongar. The EVT analysis showed the GEV distribution as a good fit, with an annual maxima of 88% of the stations being exceeded by their T = 50-year return value.
Choudhury et al. [53] discovered a connection between interannual and interdecal variability and the abrupt decline in North East Indian (NEI) rainfall. Considering that Bhutan and the NEI region share borders, these natural variations may also be affecting the patterns in the country’s rainfall indices. Given the complex topography of Bhutan, several microclimatic features are prevalent over short distances, due to which the extreme threshold may differ from station to station. These microclimates are also difficult to simulate in the weather and climate models. Therefore, taking more data points with the use of data from Automatic Weather Stations (AWS) is recommended for future studies.
Some limitations of the study include the lack of long-term data with adequate representation from all the microclimates in the country. The agrometeorological station data used in this study are only available from 1996, with most of these stations lying below 3000 m. This excludes the northernmost part of the country from the study. Furthermore, EVT assumes data stationarity, i.e., changes in the hydrological cycle due to climate change are not considered. The study also did not consider the serial correlation effect on test results, which is a common problem when using nonparametric trend methods such as the MK test, as pointed out in [54].
Author Contributions
Conceptualization, T.L. Investigation and methodology, T.L. Formal analysis, software, and visualization, T.L. Writing—original draft preparation, T.L. Writing—review and editing, G.C., S.D. and T.B.T. Supervision, G.C. All authors discussed the results and commented on the paper and figures. All authors have read and agreed to the published version of the manuscript.
Funding
This research was financially supported by the National Natural Science Foundation of China (U2240209, U2040209), Hydraulic Science and Technology Program of Jiangsu Province (2022003), the Cooperative Innovation Center for Water Safety & Hydro Science (B2106017), and Shanghai Water Authority Research Project (2023-11).
Institutional Review Board Statement
Not applicable.
Informed Consent Statement
Not applicable.
Data Availability Statement
Not applicable.
Acknowledgments
The authors would like to thank the National Centre for Hydrology and Meteorology in Bhutan for providing the datasets utilized in this study. The first author expresses gratitude to Hohai University for providing the support and access to resources that enabled the smooth conduct of this study.
Conflicts of Interest
The authors declare no conflict of interest.
Abbreviations
| Abbreviation | Definition |
| Rx1Day | Monthly maximum 1-day precipitation |
| Rx5Day | Monthly maximum consecutive 5-day precipitation |
| R95p | Annual total precipitation when RR > 95th percentile |
| R99p | Annual total precipitation when RR > 99th percentile |
| R10 mm | Annual count of days with RR ≥ 10 mm |
| R20 mm | Annual count of days with RR ≥ 20 mm |
| CDD | Maximum number of consecutive days with daily precipitation < 1 mm |
| CWD | Maximum number of consecutive days with daily precipitation > 1 mm |
| SDII | Ratio of annual total wet-day precipitation to the number of wet days |
| PRCPTOT | Annual total precipitation in wet days (RR >= 1 mm) |
| IPPC | Intergovernmental Panel on Climate Change |
| ETCCDI | Experts Team on Climate Change Detection Indices |
| M-K Test | Mann–Kendall test |
| GLOF | Glacial lake outburst flood |
| USD | US dollars |
| ENSO | El Nino–Southern Oscillation |
| EVT | Extreme value theory |
| NCHM | National Centre for Hydrology and Meteorology, Bhutan |
| FWS | Flood warning station |
| WMO | World Meteorological Organization |
| GEV | Generalized extreme value distribution |
| MLE | Maximum likelihood estimate |
References
- Tse-ring, K.; Sharma, E.; Chettri, N.; Shrestha, A. (Eds.) Climate Change Vulnerability of Mountain Ecosystems in the Eastern Himalayas; Climate Change Impact and Vulnerability in the Eastern Himalayas—Synthesis Report; ICIMOD: Kathmandu, Nepal, 2010. [Google Scholar]
- IPCC. Contribution of Working Groups I, II and III to the Fifth Assessment Report of the Intergovernmental Panel on Climate Change; Climate Change 2014: Synthesis Report; Core Writing Team, Pachauri, R.K., Meyer, L.A., Eds.; IPCC: Geneva, Switzerland, 2014; p. 151. [Google Scholar]
- Cutter, S.; Osman-Elasha, B.; Campbell, J.; Cheong, S.-M.; McCormick, S.; Pulwarty, R.; Supratid, S.; Ziervogel, G.; Calvo, E.; Mutabazi, K.D.; et al. Managing the Risks from Climate Extremes at the Local Level. In Managing the Risks of Extreme Events and Disasters to Advance Climate Change Adaptation; Field, C.B., Barros, V., Stocker, T.F., Dahe, Q., Eds.; Cambridge University Press: Cambridge, UK, 2012; pp. 291–338. [Google Scholar] [CrossRef]
- Allan, R.P.; Soden, B.J. Atmospheric Warming and the Amplification of Precipitation Extremes. Science 2008, 321, 1481–1484. [Google Scholar] [CrossRef]
- Min, S.-K.; Zhang, X.; Zwiers, F.W.; Hegerl, G.C. Human Contribution to More-Intense Precipitation Extremes. Nature 2011, 470, 378–381. [Google Scholar] [CrossRef] [PubMed]
- Shiu, C.-J.; Liu, S.C.; Fu, C.; Dai, A.; Sun, Y. How Much Do Precipitation Extremes Change in a Warming Climate?: Changes in Precipitation Extremes. Geophys. Res. Lett. 2012, 39, 17707. [Google Scholar] [CrossRef]
- Trenberth, K.E.; Dai, A.; Rasmussen, R.M.; Parsons, D.B. The Changing Character of Precipitation. Bull. Am. Meteorol. Soc. 2003, 84, 1205–1218. [Google Scholar] [CrossRef]
- Bhatti, A.S.; Wang, G.; Ullah, W.; Ullah, S.; Fiifi Tawia Hagan, D.; Kwesi Nooni, I.; Lou, D.; Ullah, I. Trend in Extreme Precipitation Indices Based on Long Term In Situ Precipitation Records over Pakistan. Water 2020, 12, 797. [Google Scholar] [CrossRef]
- Scoccimarro, E.; Gualdi, S.; Bellucci, A.; Zampieri, M.; Navarra, A. Heavy Precipitation Events in a Warmer Climate: Results from CMIP5 Models. J. Clim. 2013, 26, 7902–7911. [Google Scholar] [CrossRef]
- Alexander, L.V.; Zhang, X.; Peterson, T.C.; Caesar, J.; Gleason, B.; Klein Tank, A.M.G.; Haylock, M.; Collins, D.; Trewin, B.; Rahimzadeh, F.; et al. Global Observed Changes in Daily Climate Extremes of Temperature and Precipitation. J. Geophys. Res. 2006, 111, D05109. [Google Scholar] [CrossRef]
- Asadieh, B.; Krakauer, N.Y. Global Trends in Extreme Precipitation: Climate Models versus Observations. Hydrol. Earth Syst. Sci. 2015, 19, 877–891. [Google Scholar] [CrossRef]
- Donat, M.G.; Alexander, L.V.; Yang, H.; Durre, I.; Vose, R.; Dunn, R.J.H.; Willett, K.M.; Aguilar, E.; Brunet, M.; Caesar, J.; et al. Updated Analyses of Temperature and Precipitation Extreme Indices since the Beginning of the Twentieth Century: The HadEX2 Dataset: HADEX2-Global Gridded Climate Extremes. J. Geophys. Res. Atmos. 2013, 118, 2098–2118. [Google Scholar] [CrossRef]
- Huo, R.; Li, L.; Chen, H.; Xu, C.-Y.; Chen, J.; Guo, S. Extreme Precipitation Changes in Europe from the Last Millennium to the End of the Twenty-First Century. J. Clim. 2021, 34, 567–588. [Google Scholar] [CrossRef]
- Gao, T.; Xie, L. Spatiotemporal Changes in Precipitation Extremes over Yangtze River Basin, China, Considering the Rainfall Shift in the Late 1970s. Glob. Planet. Chang. 2016, 147, 106–124. [Google Scholar] [CrossRef]
- Mukherjee, S.; Aadhar, S.; Stone, D.; Mishra, V. Increase in Extreme Precipitation Events under Anthropogenic Warming in India. Weather Clim. Extrem. 2018, 20, 45–53. [Google Scholar] [CrossRef]
- Sheikh, M.M.; Manzoor, N.; Ashraf, J.; Adnan, M.; Collins, D.; Hameed, S.; Manton, M.J.; Ahmed, A.U.; Baidya, S.K.; Borgaonkar, H.P.; et al. Trends in extreme daily rainfall and temperature indices over South Asia. Int. J. Climatol. 2015, 35, 1625–1637. [Google Scholar] [CrossRef]
- Abbas, S.; Waseem, M.; Yaseen, M.; Latif, Y.; Leta, M.K.; Khan, T.H.; Muhammad, S. Spatial-Temporal Seasonal Variability of Extreme Precipitation under Warming Climate in Pakistan. Atmosphere 2023, 14, 210. [Google Scholar] [CrossRef]
- Ezaz, G.T.; Zhang, K.; Li, X.; Shalehy, M.H.; Hossain, M.A.; Liu, L. Spatiotemporal Changes of Precipitation Extremes in Bangladesh during 1987–2017 and Their Connections with Climate Changes, Climate Oscillations, and Monsoon Dynamics. Glob. Planet. Chang. 2022, 208, 103712. [Google Scholar] [CrossRef]
- Karki, R.; Hasson, S.U.; Schickhoff, U.; Scholten, T.; Böhner, J. Rising Precipitation Extremes across Nepal. Climate 2017, 5, 4. [Google Scholar] [CrossRef]
- Panthi, J.; Dahal, P.; Shrestha, M.; Aryal, S.; Krakauer, N.; Pradhanang, S.; Lakhankar, T.; Jha, A.; Sharma, M.; Karki, R. Spatial and Temporal Variability of Rainfall in the Gandaki River Basin of Nepal Himalaya. Climate 2015, 3, 210–226. [Google Scholar] [CrossRef]
- Rangwala, I.; Miller, J.R. Climate Change in Mountains: A Review of Elevation-Dependent Warming and Its Possible Causes. Clim. Chang. 2012, 114, 527–547. [Google Scholar] [CrossRef]
- Singh, S.P.; Bassignana-Khadka, I.; Karky, B.S.; Sharma, E. Climate Change in the Hindu Kush-Himalayas: The State of Current Knowledge; ICIMOD: Kathmandu, Nepal, 2011. [Google Scholar]
- Ménégoz, M.; Gallée, H.; Jacobi, H.W. Precipitation and Snow Cover in the Himalaya: From Reanalysis to Regional Climate Simulations. Hydrol. Earth Syst. Sci. 2013, 17, 3921–3936. [Google Scholar] [CrossRef]
- United Nations Development Program (UNDP). Royal Government of Bhutan. Addressing the Risks of Climate Induced Disasters through Enhanced National and Local Capacity for Effective Actions. Project Document. 2014. Available online: https://info.undp.org/docs/pdc/Documents/BTN/Bhutan%20NAPA2%20ProDoc%20signed_18th%20April%202014.pdf (accessed on 1 March 2021).
- Dikshit, A.; Sarkar, R.; Pradhan, B.; Acharya, S.; Dorji, K. Estimating Rainfall Thresholds for Landslide Occurrence in the Bhutan Himalayas. Water 2019, 11, 1616. [Google Scholar] [CrossRef]
- Dorji, T.; Tamang, T.B. Analysis of Historical Climate and Climate Change Projection; National Centre for Hydrology and Meteorology: Thimphu, Bhutan, 2019. Available online: https://www.nchm.gov.bt/attachment/ckfinder/userfiles/files/Analysis%20of%20Historical%20Climate%20and%20Climate%20Change%20Projection.pdf (accessed on 1 February 2021).
- Joshi, V.; Kumar, K. Extreme Rainfall Events and Associated Natural Hazards in Alaknanda Valley, Indian Himalayan Region. J. Mt. Sci. 2006, 3, 228–236. [Google Scholar] [CrossRef]
- Sarkar, R.; Dorji, K. Determination of the Probabilities of Landslide Events—A Case Study of Bhutan. Hydrology 2019, 6, 52. [Google Scholar] [CrossRef]
- Bookhagen, B. Appearance of Extreme Monsoonal Rainfall Events and Their Impact on Erosion in the Himalaya. Geomat. Nat. Hazards Risk 2010, 1, 37–50. [Google Scholar] [CrossRef]
- Dorji, T.; Ona, B.J.; Raghavan, S.V. Statistical Analyses on the Seasonal Rainfall Trend and Annual Rainfall Variability in Bhutan. SOLA 2021, 17, 202–206. [Google Scholar] [CrossRef]
- Sharma, V.; Adhikari, K. Rainfall and rainy days trend and ENSO phenomena in Himalayan Kingdom of Bhutan. Acta Geophys. 2022, 70, 1855–1869. [Google Scholar] [CrossRef]
- Quadir, D.A.; Hussain, A.; Ahasan, M.N.; Chhophel, K.; Sonam, K. Climatic Characteristics of Temperature and Precipitation of Bhutan. MAUSAM 2007, 58, 9–16. [Google Scholar] [CrossRef]
- WMO. ETCCDI: Climate Change Indices. Available online: http://etccdi.pacificclimate.org/ (accessed on 1 March 2021).
- Zhang, X.; Yang, F. RClimDex 1.0 User Manual; Climate Research Branch Environment Canada: Downsvies, ON, Canada, 2004; Volume 1, p. 22.
- Mann, H.B. Nonparametric tests against trend. Econometrica 1945, 13, 245–259. [Google Scholar] [CrossRef]
- Kendall, M.G. Rank Correlation Methods, 4th ed.; Charles Griffin: London, UK, 1975; p. 202. [Google Scholar]
- Wang, F.; Shao, W.; Yu, H.; Kan, G.; He, X.; Zhang, D.; Ren, M.; Wang, G. Re-Evaluation of the Power of the Mann-Kendall Test for Detecting Monotonic Trends in Hydrometeorological Time Series. Front. Earth Sci. 2020, 8, 14. [Google Scholar] [CrossRef]
- Fisher, R.A.; Tippett, L.H.C. Limiting Forms of the Frequency Distribution of the Largest or Smallest Member of a Sample. Math. Proc. Camb. Philos. Soc. 1928, 24, 180–190. [Google Scholar] [CrossRef]
- Easterling, D.R.; Kunkel, K.E.; Wehner, M.F.; Sun, L. Detection and Attribution of Climate Extremes in the Observed Record. Weather Clim. Extrem. 2016, 11, 17–27. [Google Scholar] [CrossRef]
- Deshpande, N.; Kulkarni, B.; Verma, A.; Mandal, B. Extreme rainfall analysis and estimation of Probable Maximum Precipitation (PMP) by statistical methods over the Indus river basin in India. J. Spat. Hydrol. 2008, 8, 22–36. [Google Scholar]
- Albaldawi, T. Extreme Value Analysis of Maximum Rainfall Data in Baghdad City. Math. Stat. J. 2018, 2, 1–8. [Google Scholar]
- Acero, F.; Parey, S.; García, J.; Dacunha-Castelle, D. Return Level Estimation of Extreme Rainfall over the Iberian Peninsula: Comparison of Methods. Water 2018, 10, 179. [Google Scholar] [CrossRef]
- Zaman, M.; Ahmad, I.; Usman, M.; Saifullah, M.; Anjum, M.N.; Khan, M.I.; Uzair Qamar, M. Event-Based Time Distribution Patterns, Return Levels, and Their Trends of Extreme Precipitation across Indus Basin. Water 2020, 12, 3373. [Google Scholar] [CrossRef]
- Emmy, A.; Evelina, N. An Extreme Value Approach to Modeling Risk of Extreme Rainfall in Bangladesh. Bachelor’s Thesis, Lund University, Lund, Sweden, 2018. [Google Scholar]
- Feng, S.; Nadarajah, S.; Hu, Q. Modeling Annual Extreme Precipitation in China Using the Generalized Extreme Value Distribution. J. Meteorol. Soc. Jpn. Ser. II 2007, 85, 599–613. [Google Scholar] [CrossRef]
- Manuela, E.; Tong, M. Extreme Value Modeling of Precipitation in Case Studies for China. Int. J. Sci. Innov. Math. Res. IJSIMR 2014, 2, 23–36. [Google Scholar]
- Triphonia, J.N.; Joachim, R.; Edwin, R.; Shaban, N.; Michel, D.S.M. Modeling of Extreme Maximum Rainfall using Extreme Value Theory for Tanzania. Int. J. Sci. Innov. Math. Res. IJSIMR 2016, 4, 34–45. [Google Scholar]
- Johnson, K.; Smithers, J. Review: Methods for the Estimation of Extreme Rainfall Events. Water SA 2019, 45, 501–512. [Google Scholar] [CrossRef]
- Namitha, M.R. Analysis of Extreme Rainfall Events and Calculation of Return Levels Using Generalised Extreme Value Distribution. Int. J. Pure Appl. Biosci. 2018, 6, 1309–1316. [Google Scholar] [CrossRef]
- NIST/SEMATECH e-Handbook of Statistical Methods, Exploratory Data Analysis. Available online: https://www.itl.nist.gov/div898/handbook/toolaids/pff/E-Handbook.pdf (accessed on 1 February 2021).
- NCHM. Compendium of Climate and Hydrological Extremes in Bhutan since 1968 from Kuensel; National Centre for Hydro Meteorology (NCHM): Thimphu, Bhutan, 2014.
- NCHM. Compendium of Extreme Events; National Centre for Hydro Meteorology (NCHM): Thimphu, Bhutan, 2021; Volume 2.
- Choudhury, B.A.; Saha, S.K.; Konwar, M.; Sujith, K.; Deshamukhya, A. Rapid drying of Northeast India in the last three decades: Climate change or natural variability? J. Geophys. Res. Atmos. 2019, 124, 227–237. [Google Scholar] [CrossRef]
- Gümüs, V.; Avşaroğlu, A.; Şimşek, O.; Dinsever, L.D. Evaluation of meteorological time series trends in Southeastern Anatolia, Turkey. Geofizika 2023, 40, 51–73. [Google Scholar] [CrossRef]
Disclaimer/Publisher’s Note: The statements, opinions and data contained in all publications are solely those of the individual author(s) and contributor(s) and not of MDPI and/or the editor(s). MDPI and/or the editor(s) disclaim responsibility for any injury to people or property resulting from any ideas, methods, instructions or products referred to in the content. |
© 2023 by the authors. Licensee MDPI, Basel, Switzerland. This article is an open access article distributed under the terms and conditions of the Creative Commons Attribution (CC BY) license (https://creativecommons.org/licenses/by/4.0/).