1. Introduction
Phenomena or events that degrade the quality of the environment and have a potential for endangering people, property, and infrastructure are called geohazards [
1]. Based on the literature findings, geohazards have a significant impact on human health and economic development, leading to consequences such as human casualties [
2,
3,
4,
5], direct damage to infrastructure or private property [
6,
7], a negative impact on household income [
8,
9], alteration of consumer behavior among various income groups [
10,
11], and lower life satisfaction [
12,
13,
14]. For the most part, geohazards are generated as a result of a combination of unfavorable natural factors and, in certain situations, they can also be caused by humans. Refs. [
15,
16], through examples, explain that geohazards have a negative impact on geosites.
Until a few decades ago, natural and geohazards were considered to be typically natural, i.e., occurring naturally. However, recently, it has been realized that anthropogenic factors have an increasing direct or indirect impact on their occurrence and frequency [
17]. That is why the expression “anthropogenic–natural disasters” or “anthropo-geohazards” is used more frequently worldwide today. As noted by [
18], during the last several decades, Europe has predominantly experienced hydro-meteorological hazards that frequently give rise to diverse risk factors, including environmental changes, population dynamics, infrastructure vulnerabilities, and socio-economic aspects [
19,
20,
21].
In terms of climate-related risks, South-Eastern Europe (SEE) could be identified as one of the world’s critical areas [
22]. This geographical area has been known for its numerous hydro-meteorological hazards throughout modern history [
23]. These undesirable natural events often cause environmental, social and, therefore, economic damage, with long-term consequences, and can easily turn into disasters with catastrophically large effects. The severity of economic damage can be illustrated by the reported loss of over EUR 433 billion for the period 1980–2015 in the European Economic Area [
24]. With an evidently increasing number of extreme weather events induced by climate change, hydro-meteorological hazards have emerged as a high-impact risk, especially in Europe [
25,
26,
27]. Contemporary research in the field [
24] has presented unfortunate facts related to hydro-meteorological hazards in Europe. All major hazardous events (heavy precipitation episodes/floods, storms, landslides/rockfalls, wildfires, droughts, extreme temperatures) have increased in frequency and/or intensity. Projected scenarios for the future are not optimistic, since even more natural hazard-related damage is expected for various sectors [
25]. During these hazardous events, humans, and anthropogenic systems in general, are highly exposed and vulnerable [
28]. Climate and weather conditions are not the only reason for this. As the global population continues to experience a rising trend (estimated to be 11 billion by the end of this century), (United Nations-UN), accompanied by urbanization of natural disaster-prone zones [
29], society development and economic growth [
30], the amplification of natural hazards impact is imminent. This socio-economic development has also led to tourism expansion, thus increasing its sensitivity to weather-related hazards [
18].
In the last few decades, there has been great interest in analyzing and assessing the risk of natural hazards and geohazards. The huge interest is the result of a large number of casualties and the damage caused by these natural hazards around the world [
31,
32,
33,
34,
35,
36,
37]. According to [
38], the acceleration of the process of soil erosion can cause a potential problem for agriculture. Soil erosion may be doubled with an increase in slope and relative angle of terrain [
39,
40,
41]. As pointed out by [
42], the Western Balkans region is highly prone to water erosion processes and, therefore, the estimation of rainfall erosivity potential is essential for understanding the complex relationships between hydro-meteorological factors, soil erosion processes and main topographical features.
According to [
2,
43], this has led to the development of various simulation models of different accuracy and complexity, including empirical, stochastic, and deterministic models. Additionally, indicators based on biological, physical, social, and economic approaches have also been utilized. Empirical models are commonly used, particularly in countries where input data are often limited, and their validity is uncertain, such as Western Balkan and southeastern European countries. These models are preferred due to their simplicity and ease of use, having less input data and fewer computations, compared to more comprehensive models [
43].
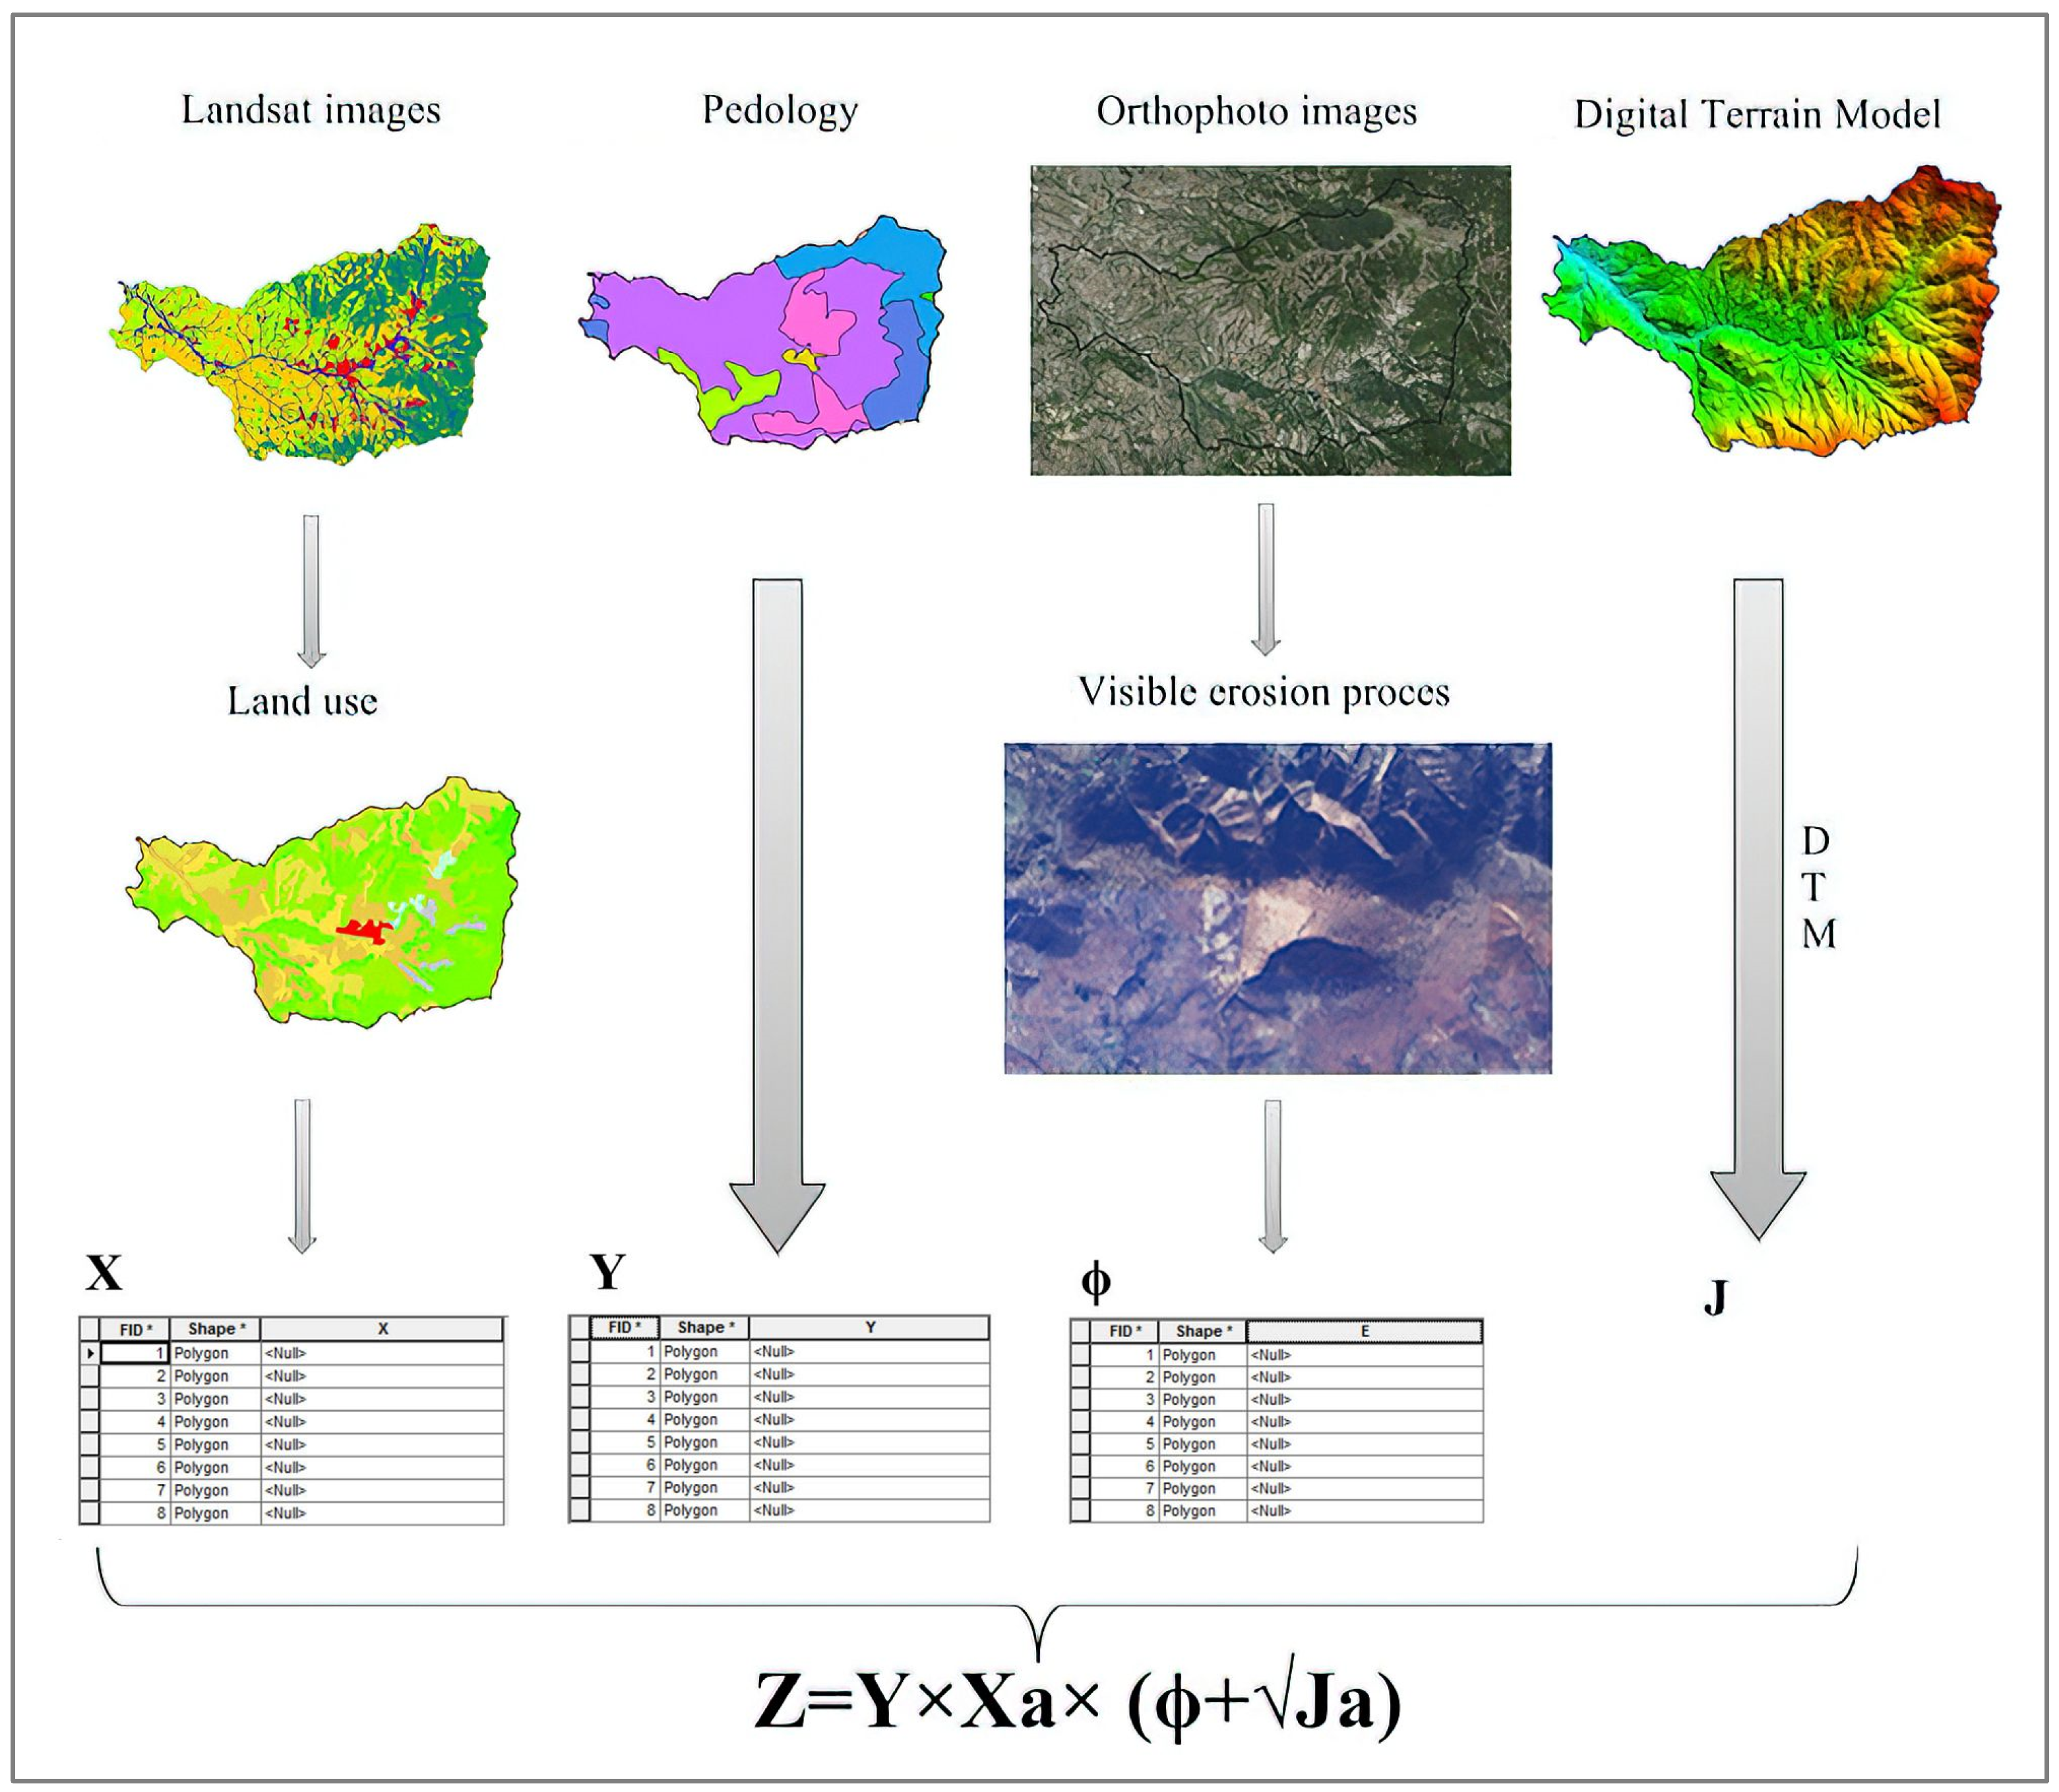
Ref. [
43] conducted a study evaluating soil erosion and its spatial distribution using two empirical models, namely the erosion potential model (EPM), also known as the Gavrilović method, and the RUSLE model. The study focused on the Venetikos River catchment, the largest tributary of Aliakmonas River, located in northern Greece. Both models demonstrated a satisfactory simulation of the phenomenon, exhibiting acceptable precision and enabling the identification of areas most susceptible to erosion and land degradation. Although both models performed quite similarly and attributed underestimated results in comparison to the “actual” (measured) values of mean annual sediment discharge and yield, the EPM approach was used in the study to generate comparable data with neighboring countries where the same approach was applied [
44,
45,
46].
The EPM model has been extensively implemented across the Balkans and in other countries worldwide, including Serbia, Croatia, Slovenia, Germany, Italy, Argentina, Belgium, and Greece [
43,
44,
45,
46,
47,
48]. Its application has provided reliable results for assessing water erosion severity, estimating mean annual soil loss and sediment yield, and implementing erosion control measures and torrent regulation at a regional scale.
Due to very favorable natural conditions as well as the human impact over the centuries, the territory of North Macedonia is highly exposed to various natural hazards [
17,
49], and geohazards [
50]. Among the most dominant geohazards in this area are excessive erosion, torrents, landslides, rockfalls, floods, etc. [
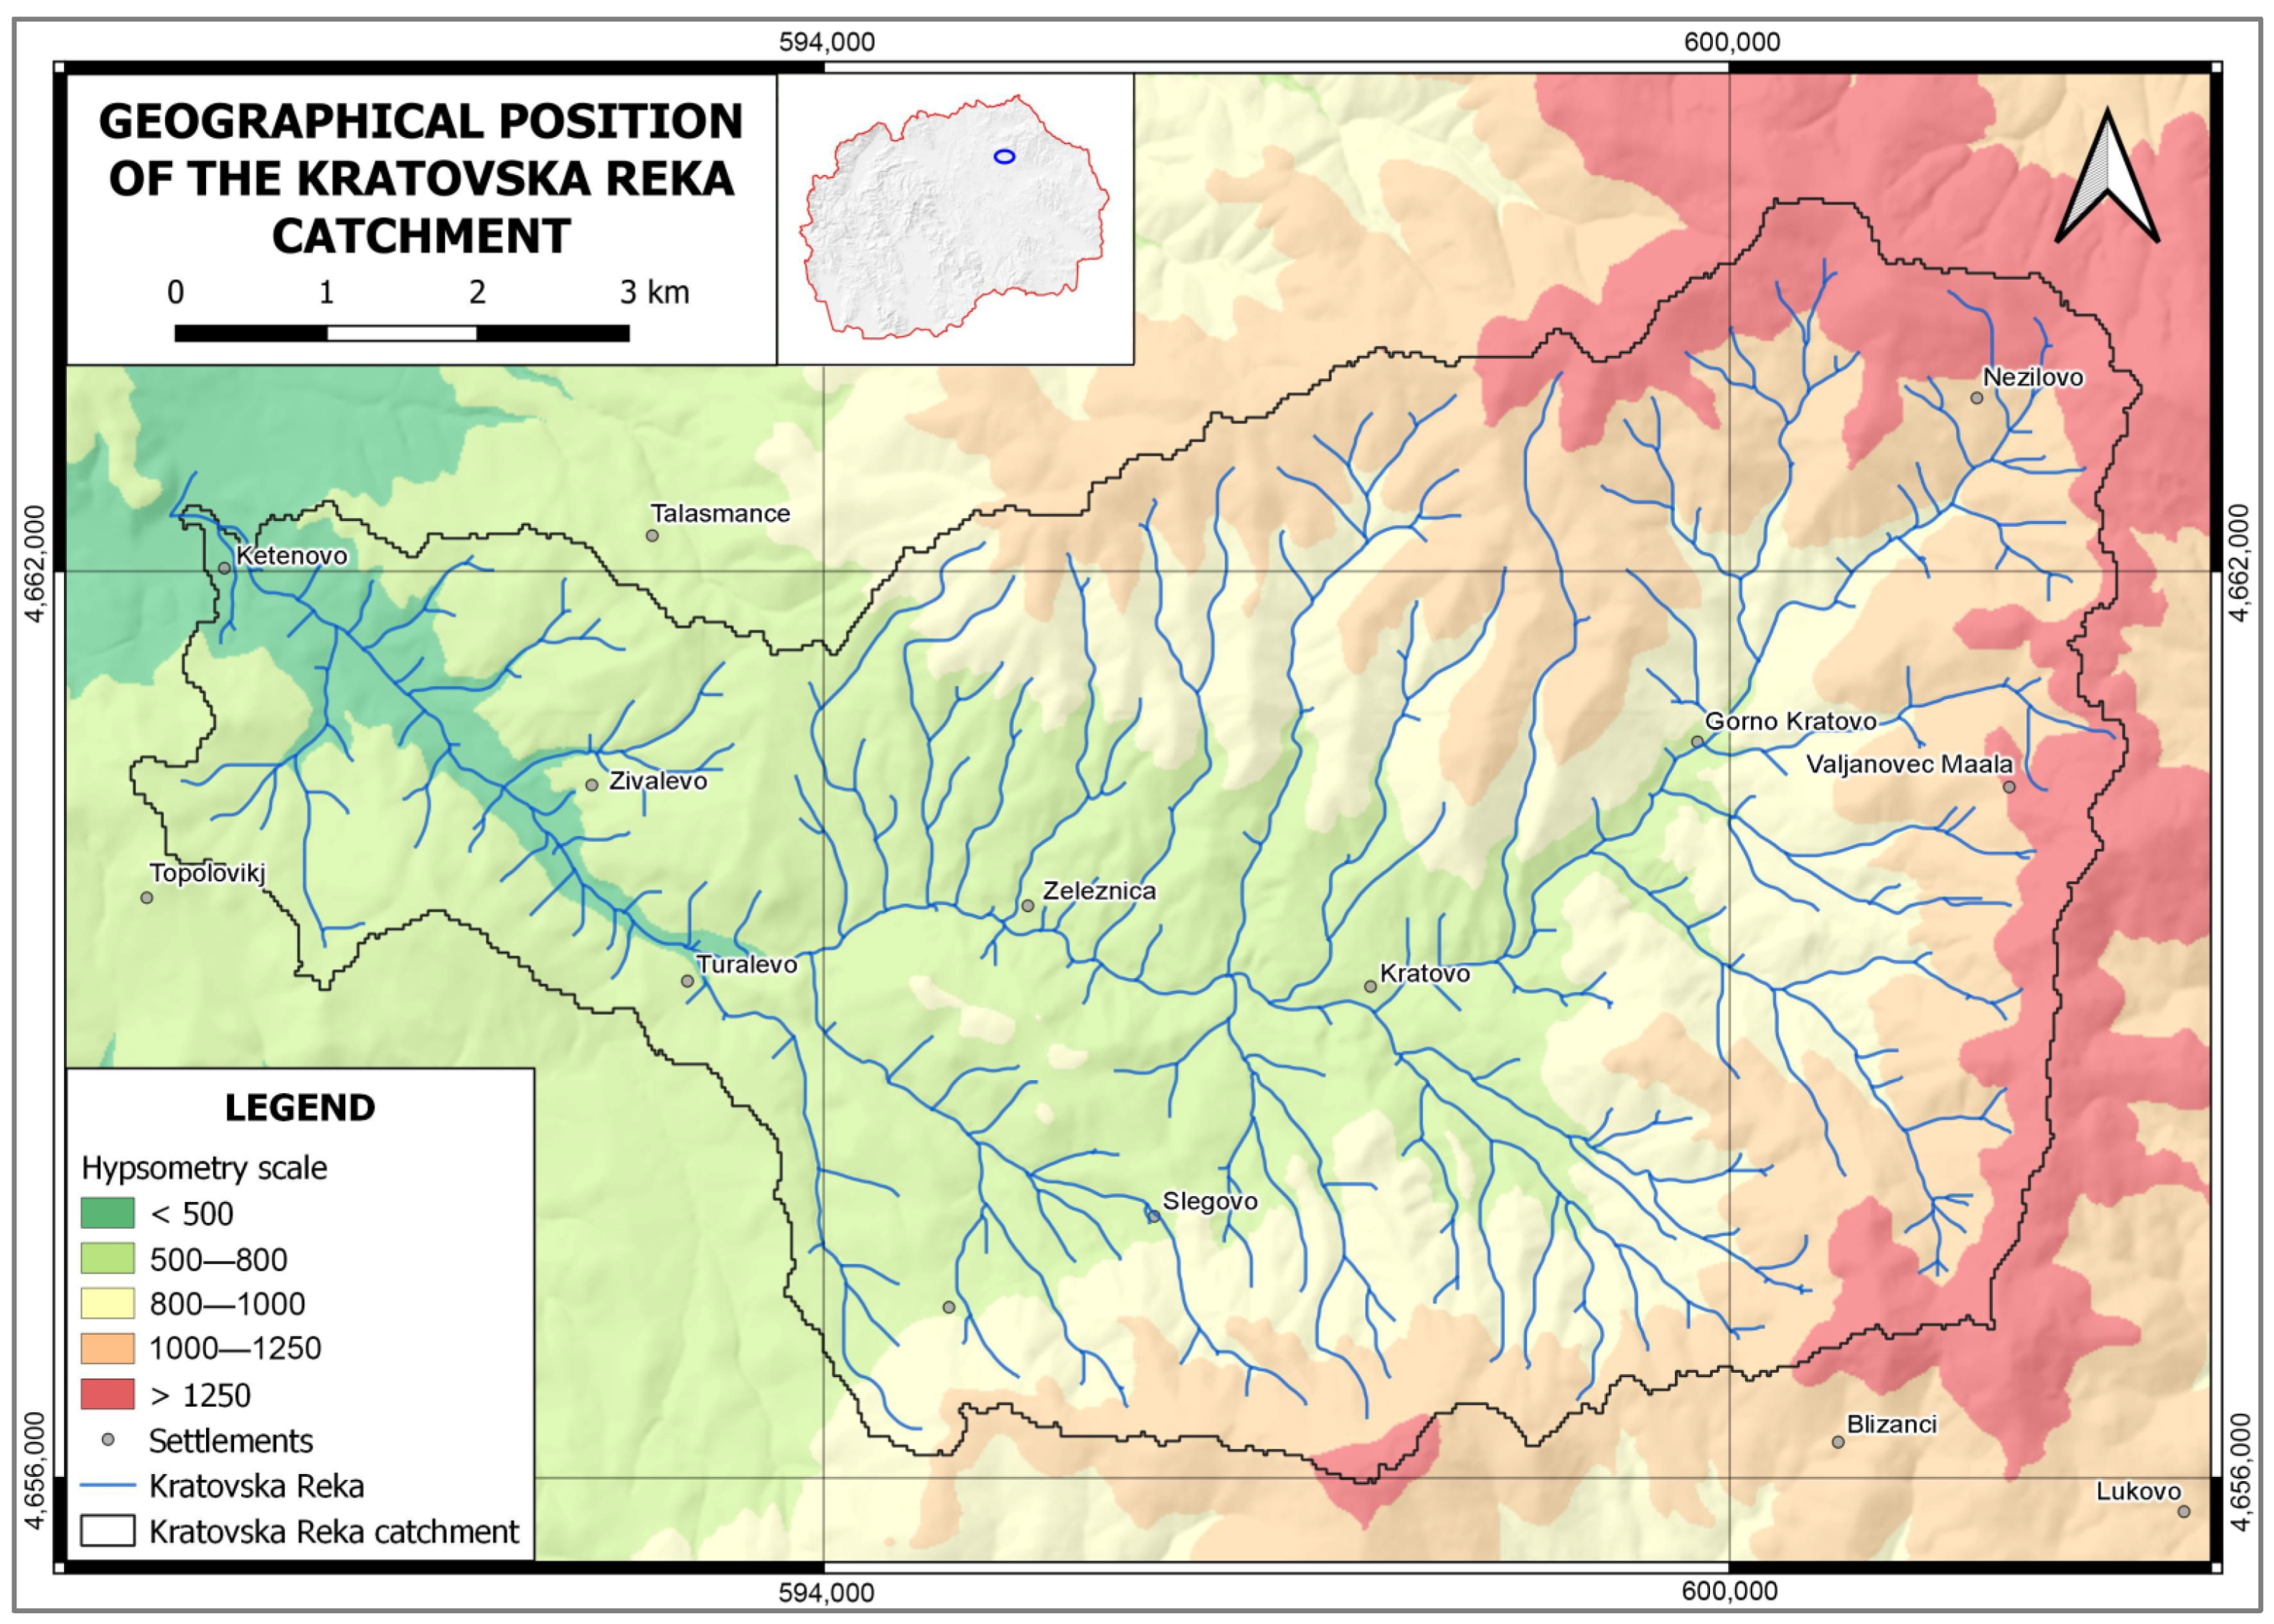
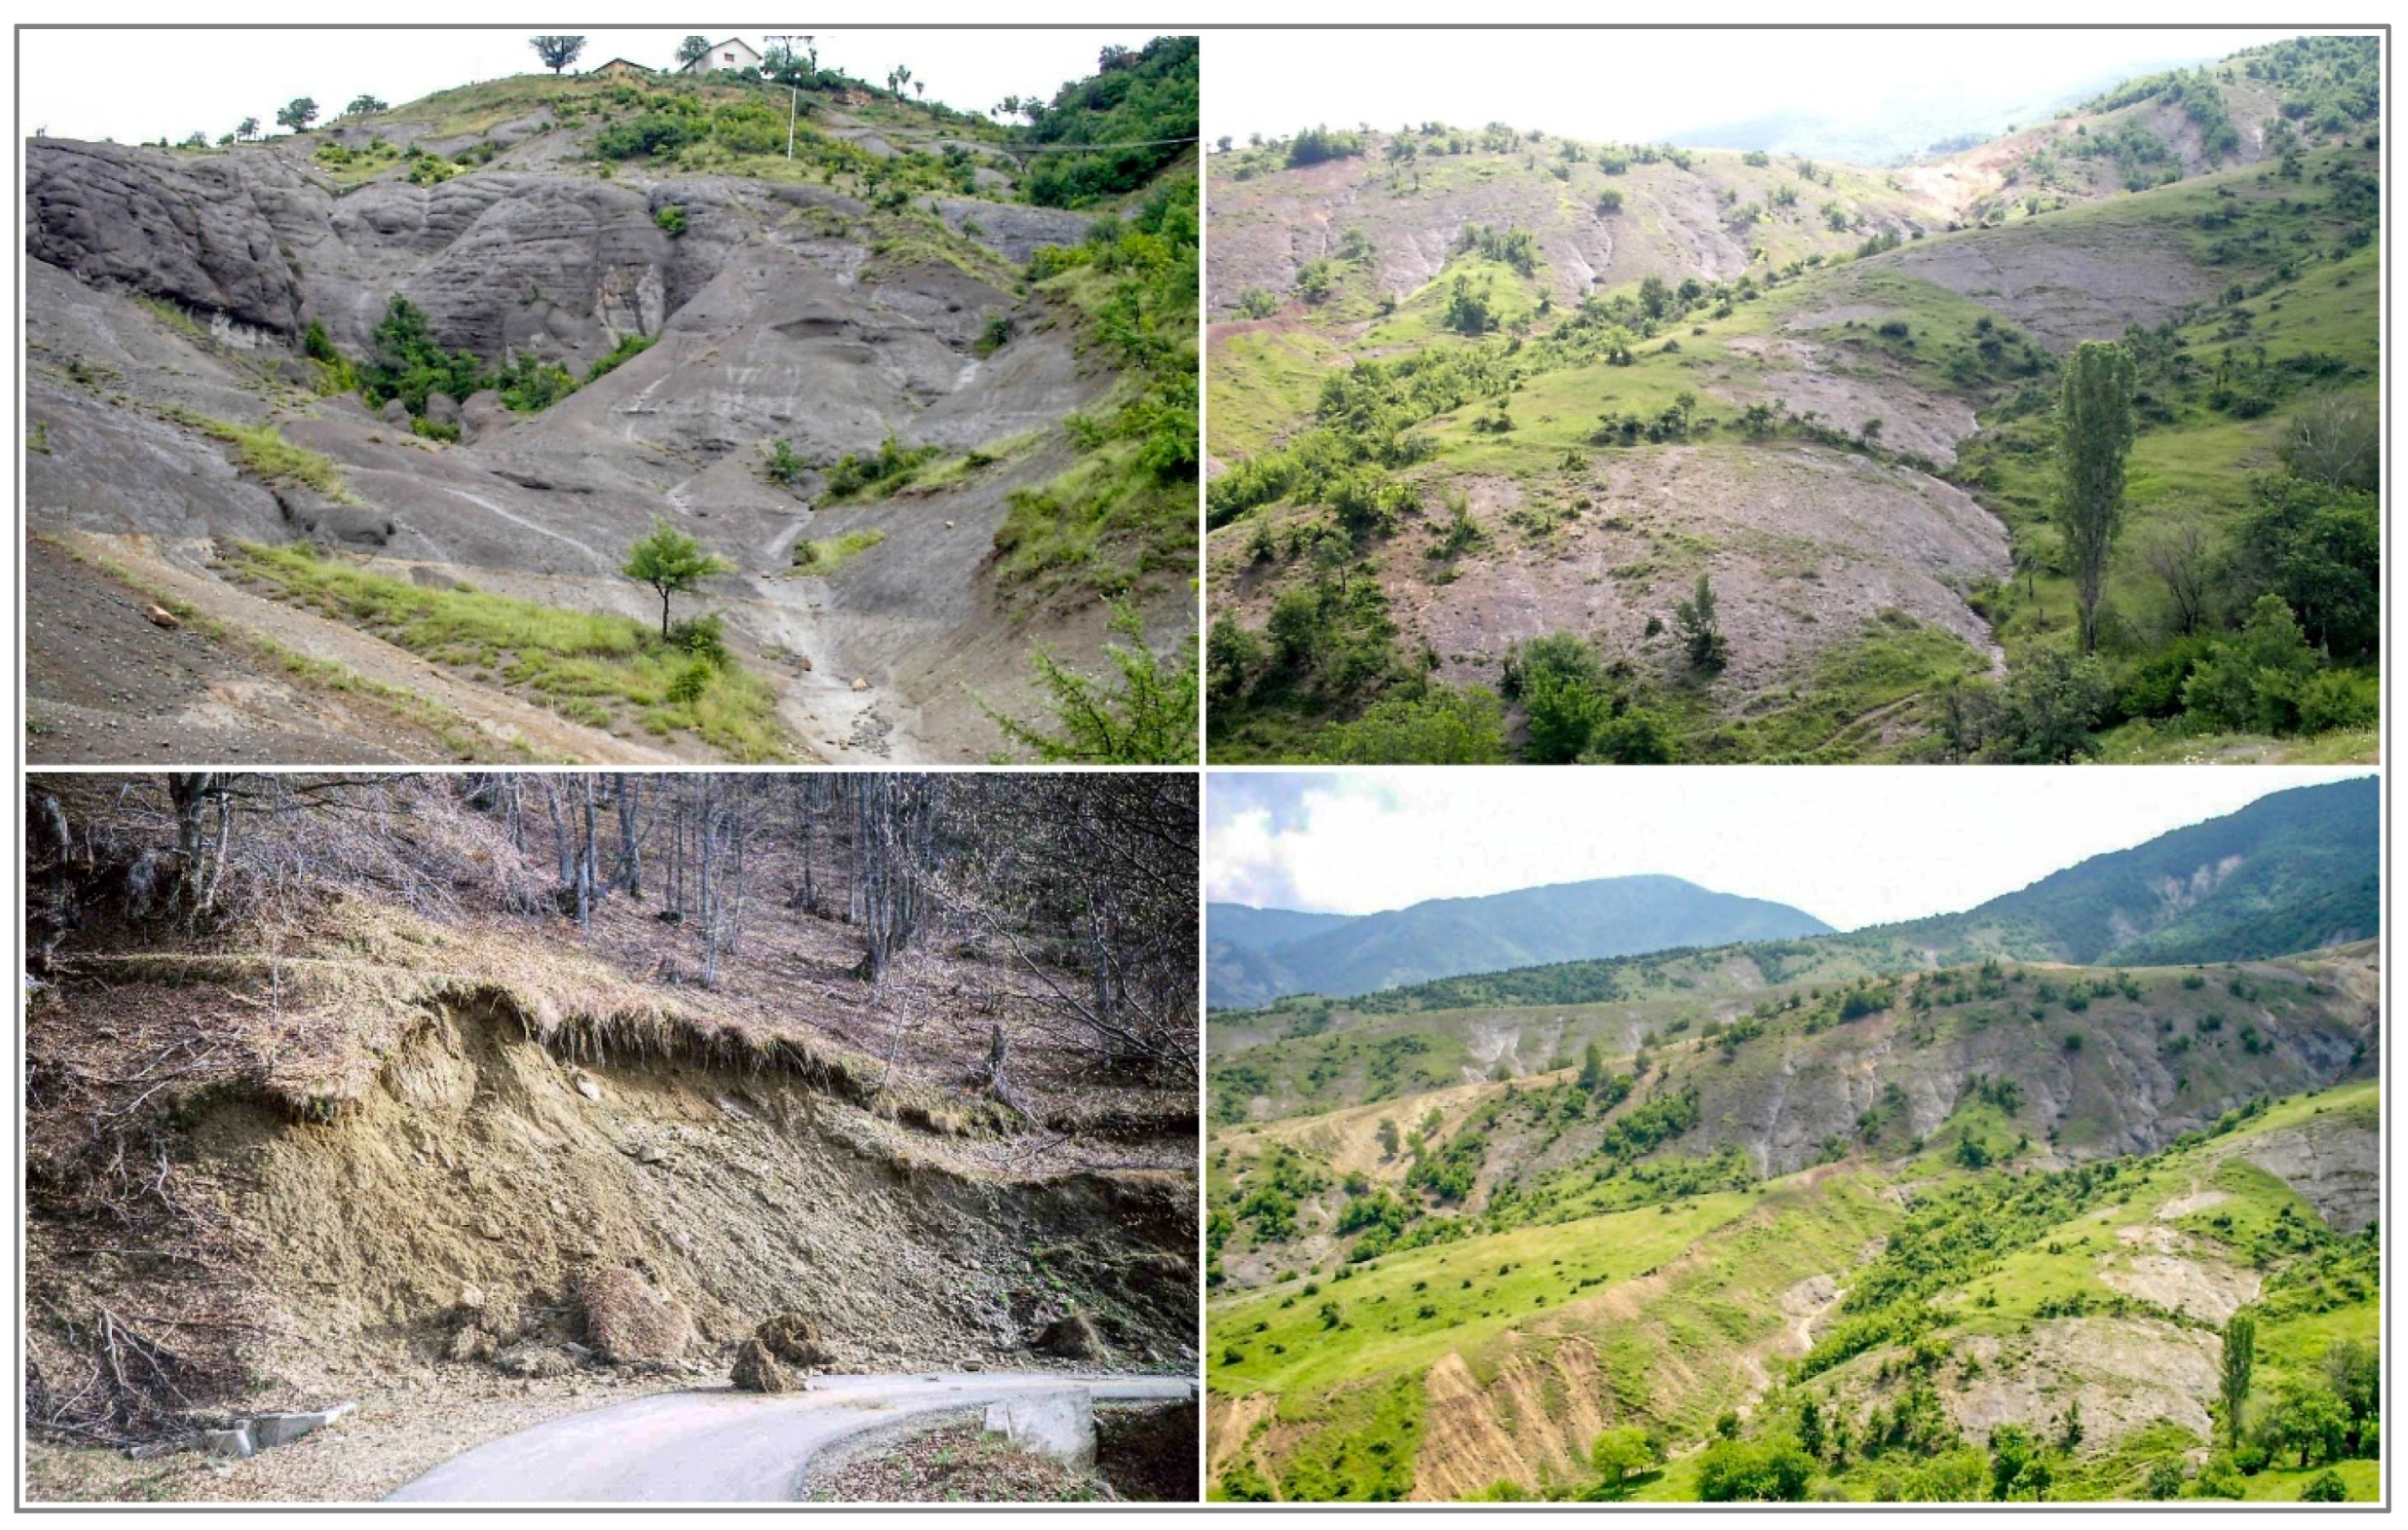
49]. Such phenomena, to a lesser extent, have also been recorded in the Kratovska Reka catchment, which is the case study in this paper. The main reasons for this are steep slopes and extensive areas covered with erodible crystalline rocks and tuffs, combined with high human impact and deforestation occurring over centuries. For those reasons, there are many sites in the catchment with severe erosion, especially along the banks and steep valley sides, with occasional threats to property and people’s lives. Landslides are frequent as well, especially those that cause material damage, and destruction of roads (for example, the Kratovo–-Probištip road), buildings, etc.
Only a few studies of geohazards in this area have previously been carried out [
50,
51,
52,
53,
54]. However, most of these studies cover larger (regional to national) areas and only briefly mention the high erosivity and landslide susceptibility in the Kriva Reka catchment, without detailed analyses.
Because of the worldwide increased threat of geohazards, new methods are being developed to access or to perform a zonation of endangered areas, especially considering landslides, flashfloods, excess erosion, etc.
According to UNDRR, the multi-hazard concept refers to the selection of multiple major hazards that an area faces and the specific contexts in which hazardous events may occur simultaneously, cascadingly, or cumulatively over time, taking into account the potential interrelated effects.
Multi-hazard techniques are very important for the analysis of hazardous events [
55,
56,
57,
58,
59,
60]. Another approach could be achieved by implementing probabilistic and deterministic stochastic processes [
61].
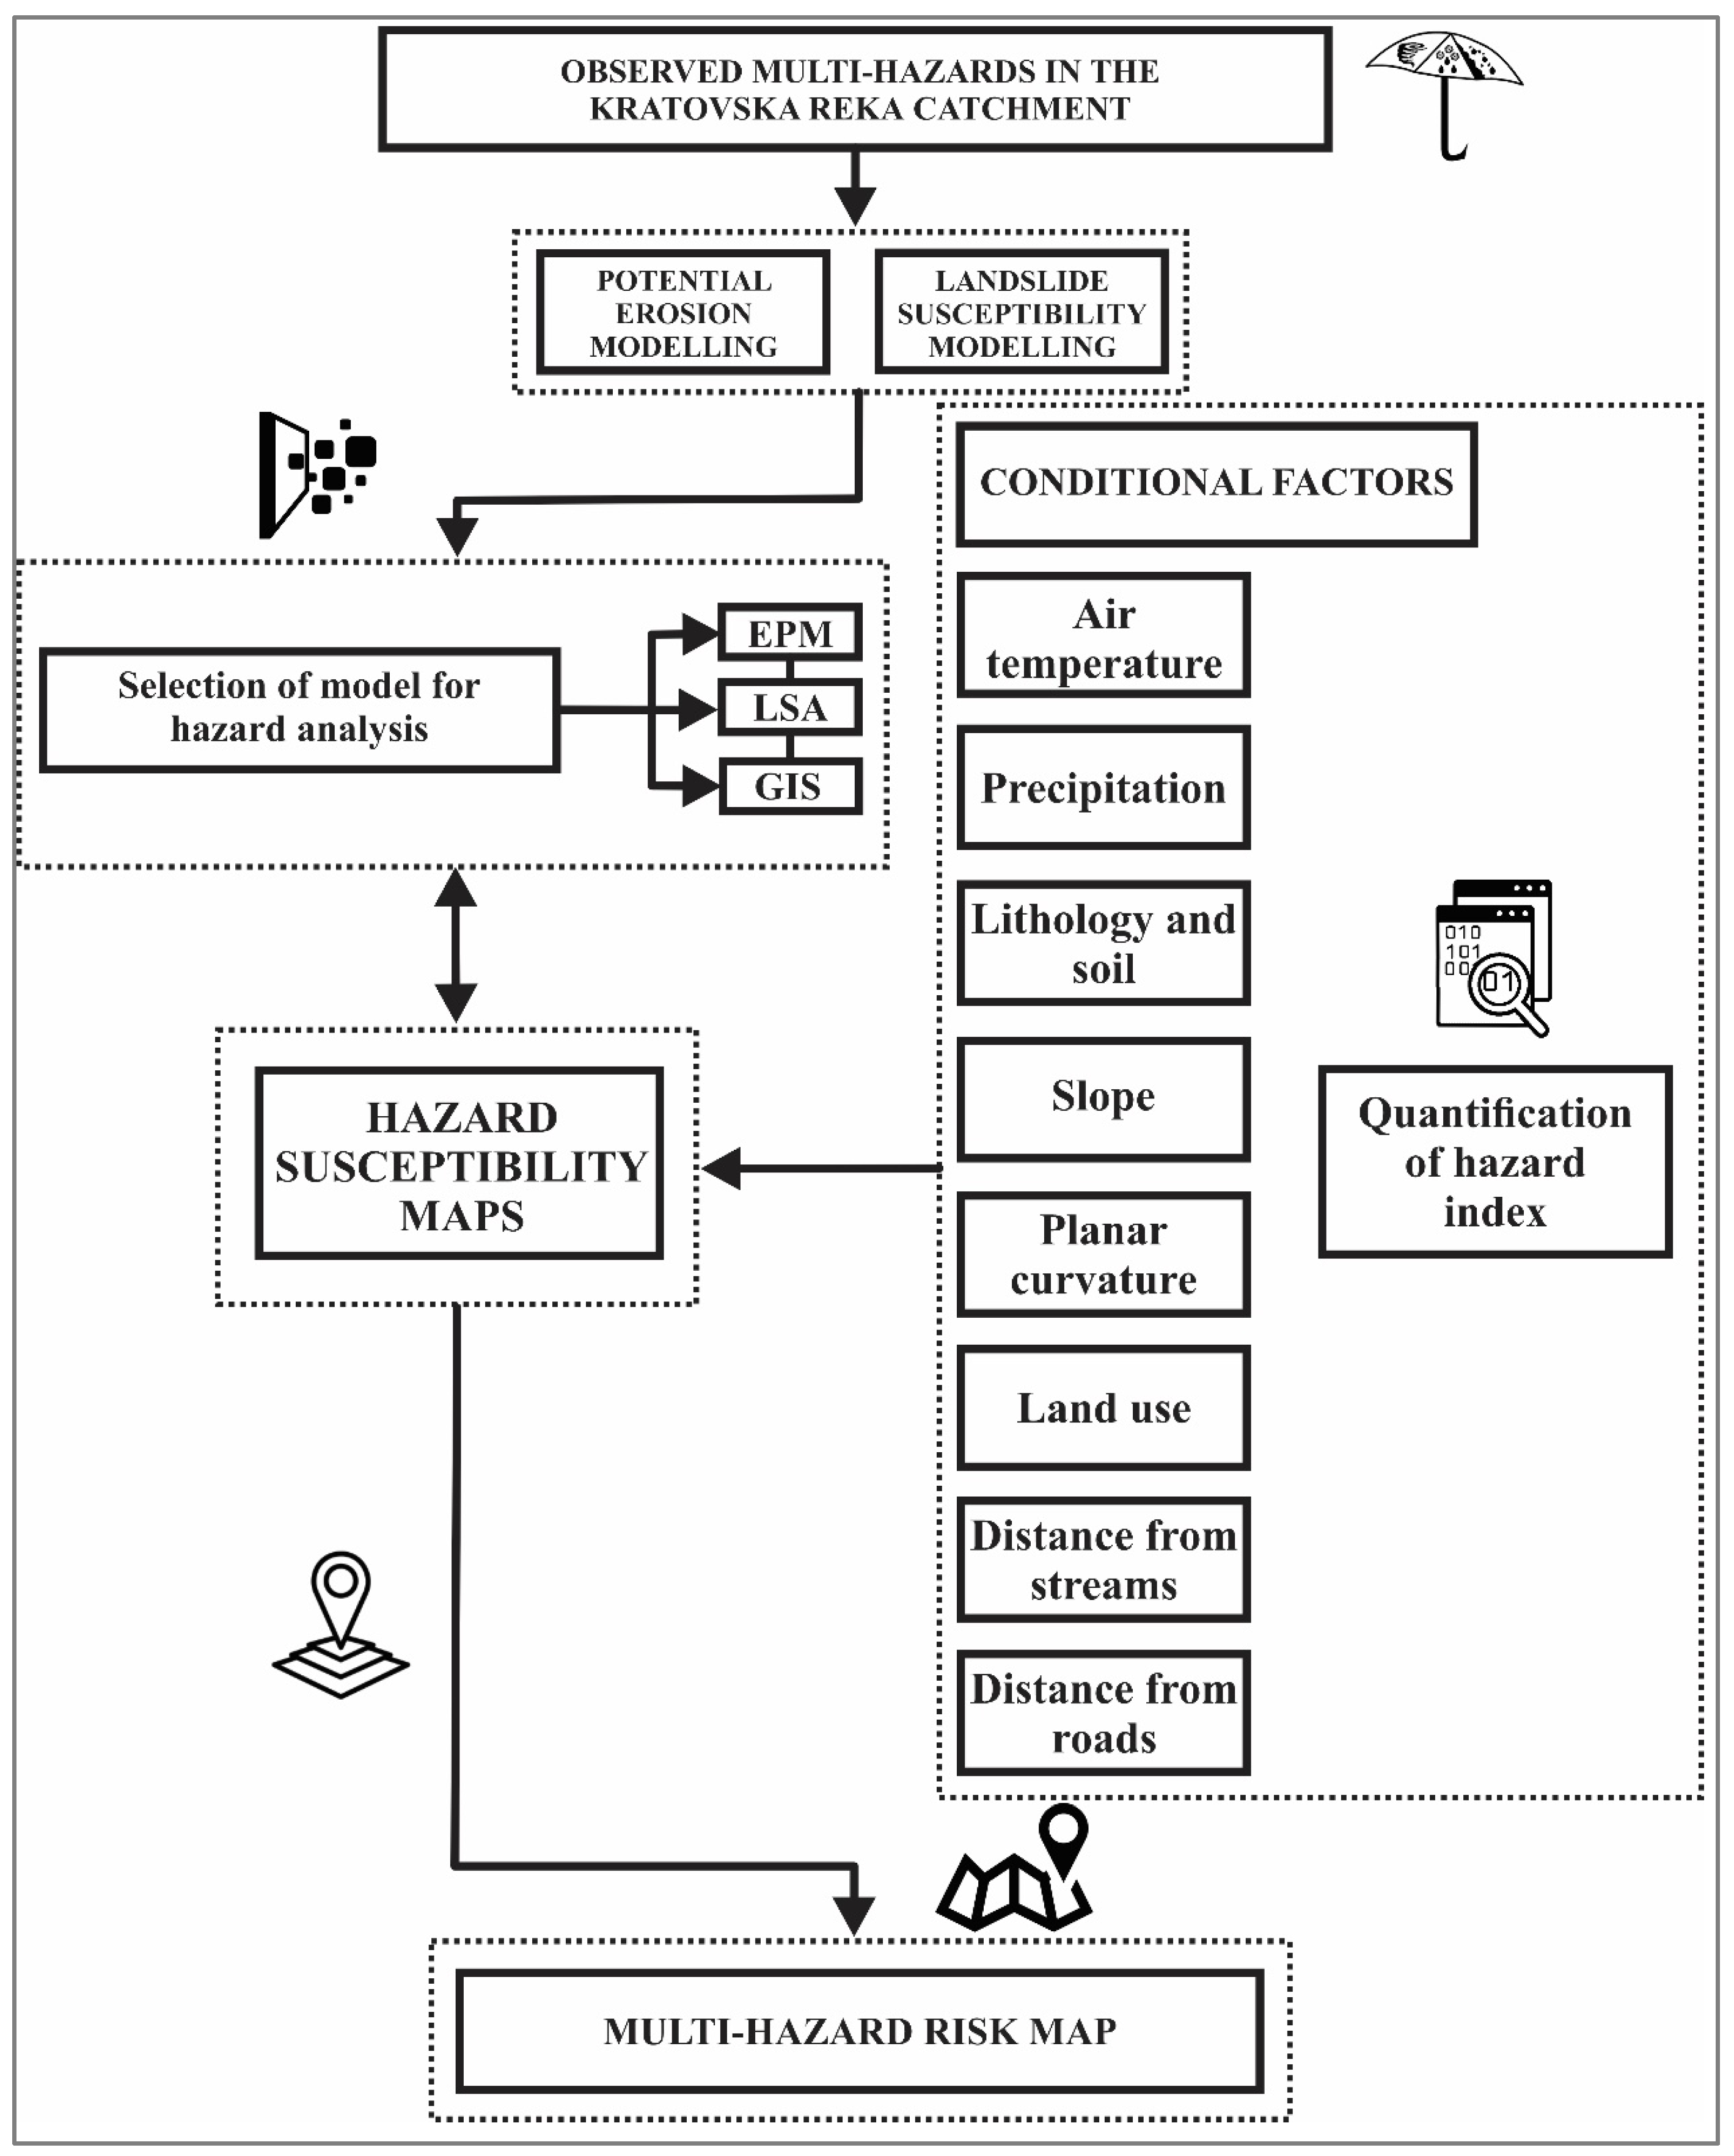
Accordingly, there is a need to develop models for the potential erosion and landslide susceptibility areas in the Kratovska Reka catchment. Therefore, the main objectives of this study are to: (1) perform multi-hazard assessment (hydro-meteorological hazards) in the study area by applying a modified erosion assessment model and joint systematic approaches; (2) produce hazard risk and susceptibility maps, and (3) identify places of greatest erosion risks as the starting point for defining and implementing suitable mitigation measures.
4. Discussion
Soil degradation has a significant impact on soil productivity, leading to reduced agricultural yields and ecosystem functionality [
44]. To effectively manage soil erosion and assist decision-makers in implementing appropriate remediation measures and mitigation strategies, it is crucial to monitor and assess the system to gather accurate and reliable information on soil erosion under current climate and land use conditions [
102]. This information serves as a foundation for understanding the extent of soil degradation and identifying areas that require intervention to prevent further erosion and restore soil health. By obtaining comprehensive data on soil erosion dynamics, policymakers and land managers can make informed decisions and develop targeted strategies for sustainable land management practices.
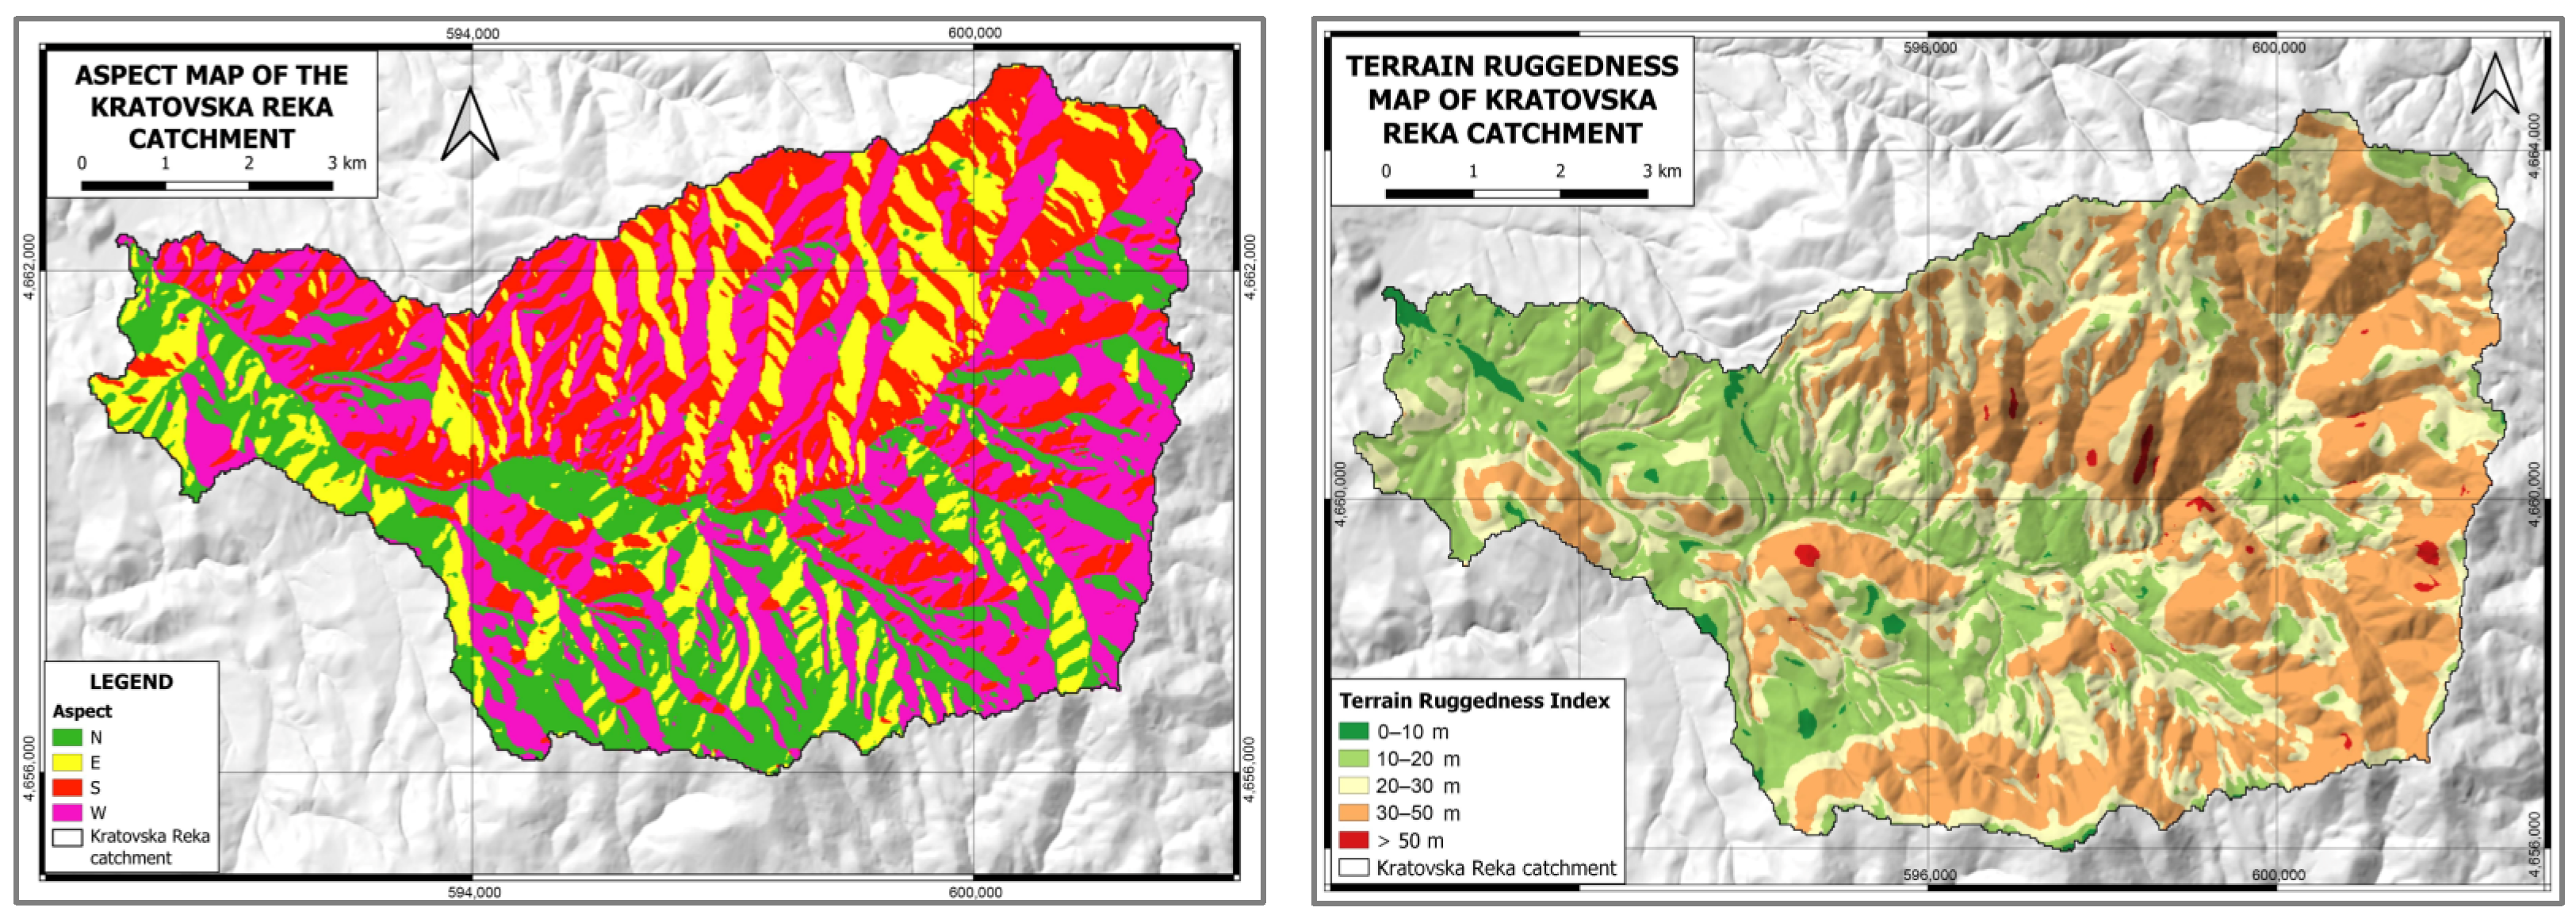
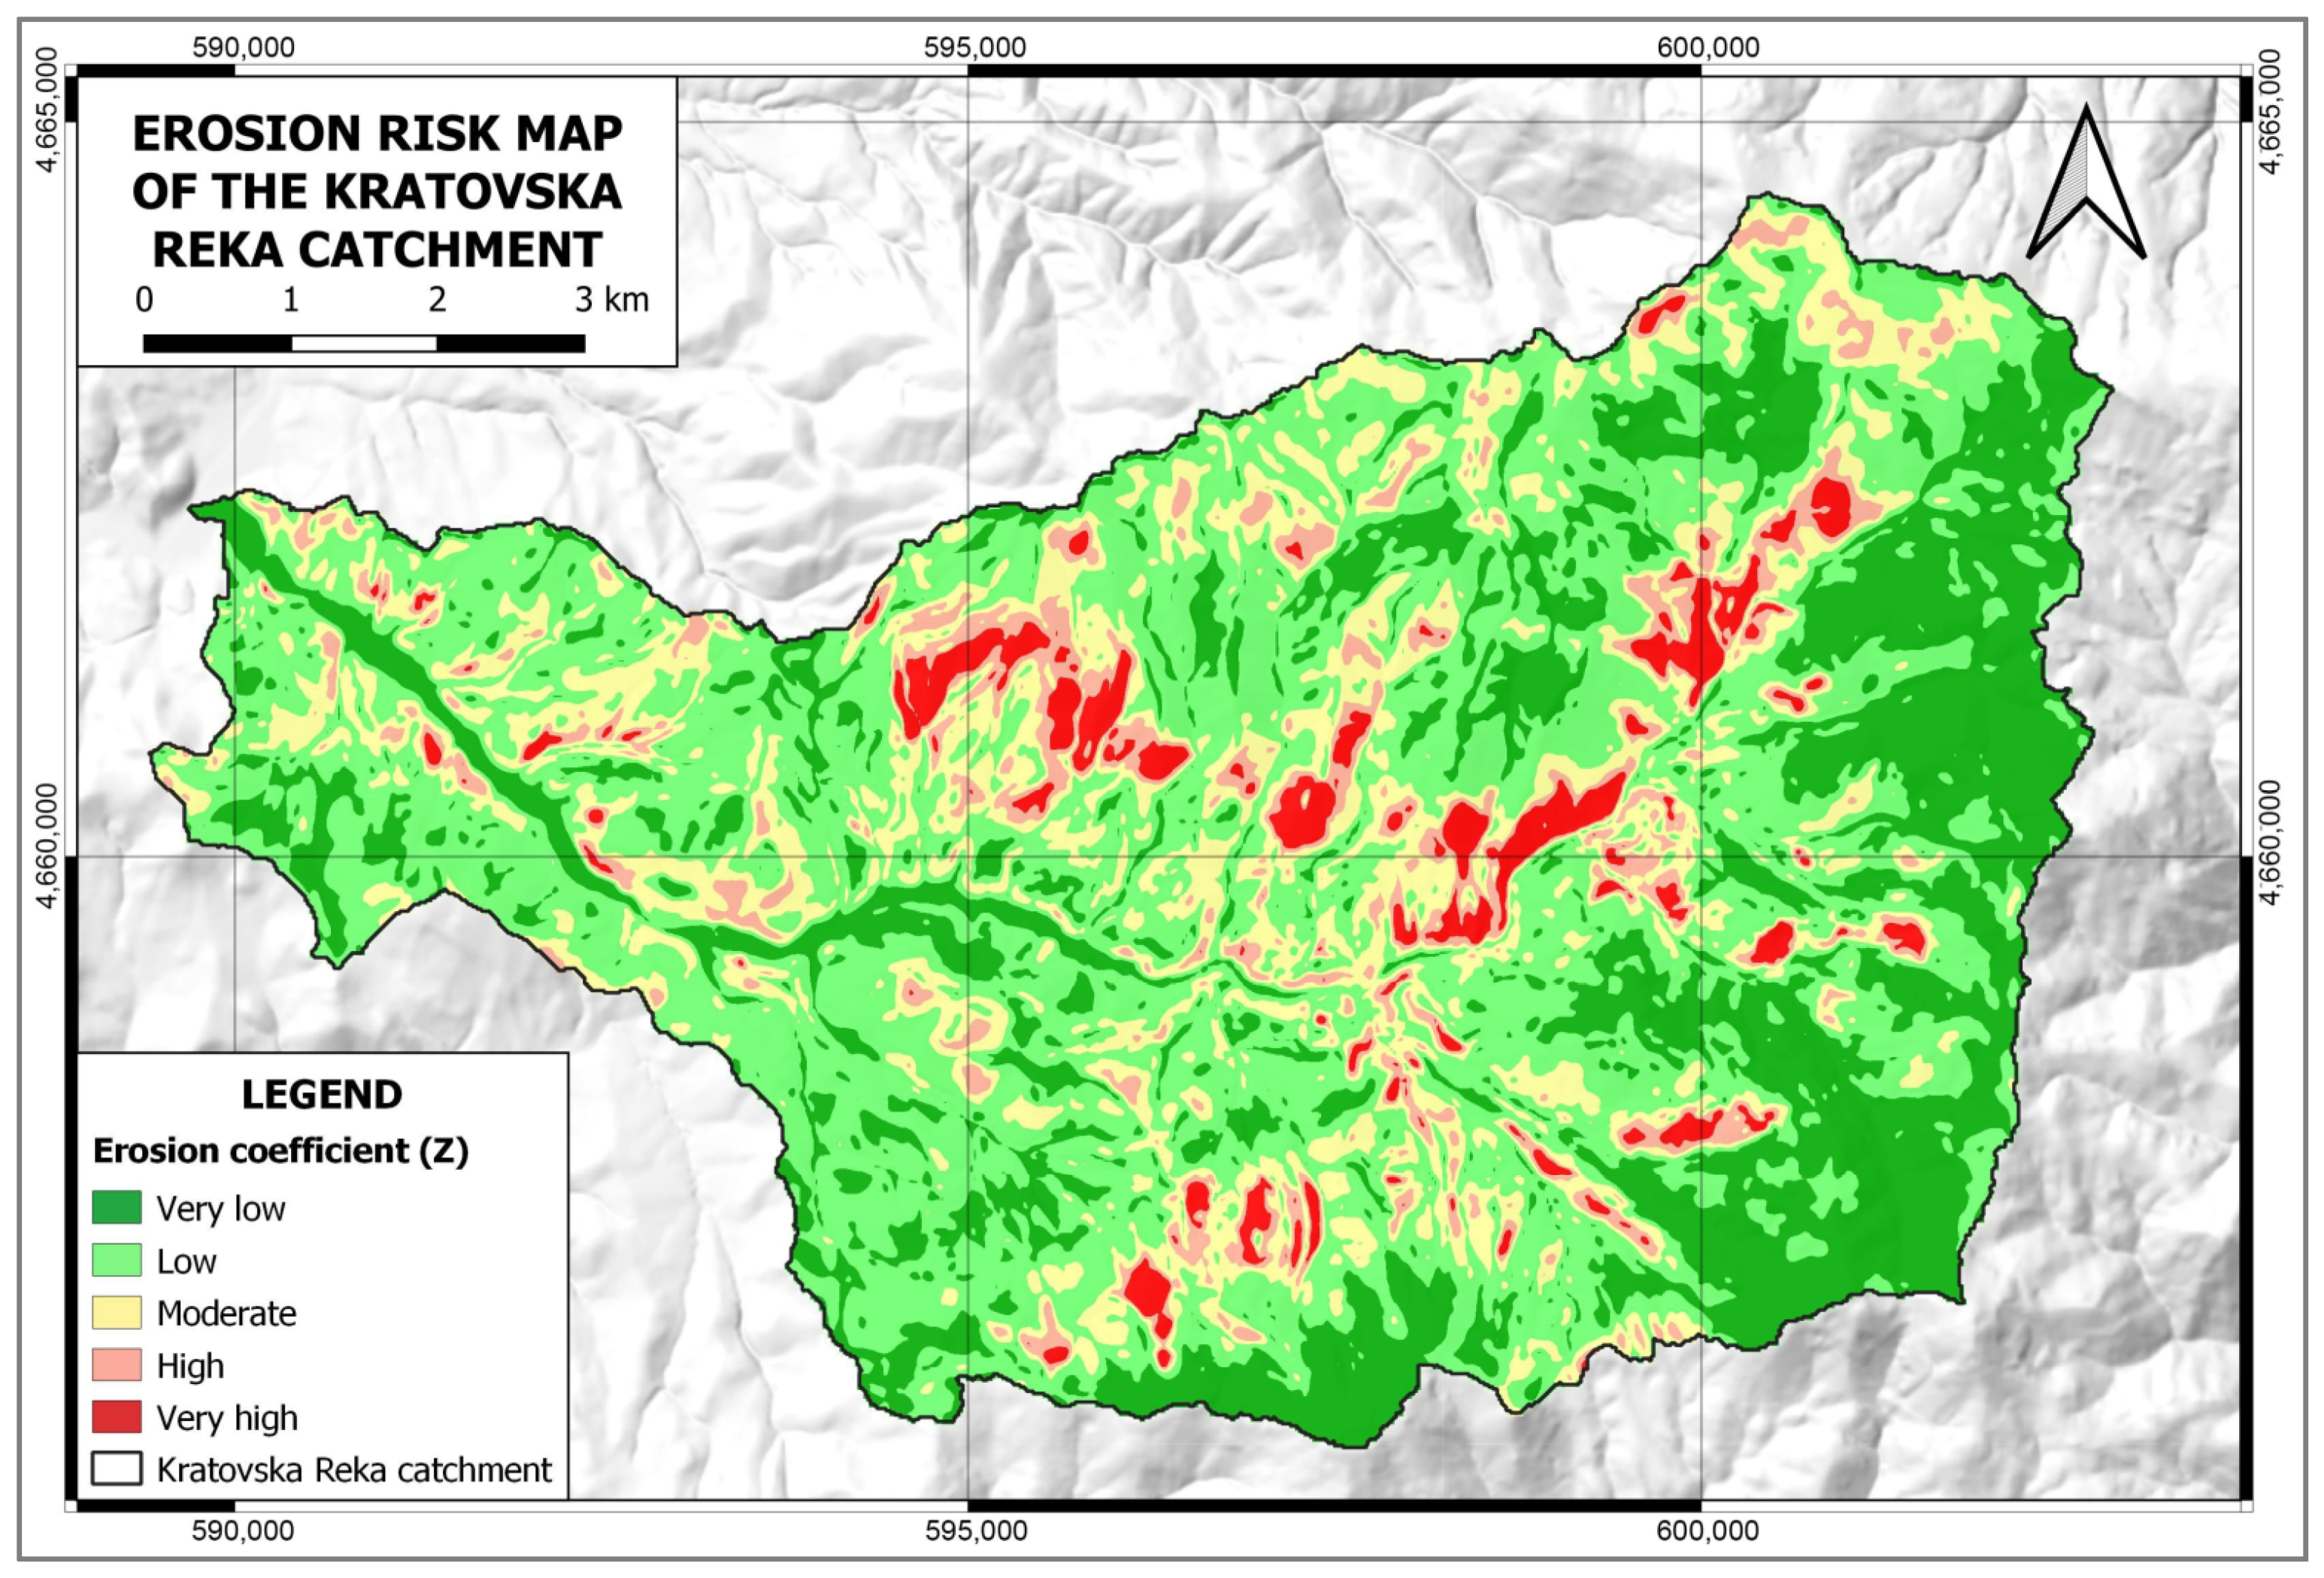
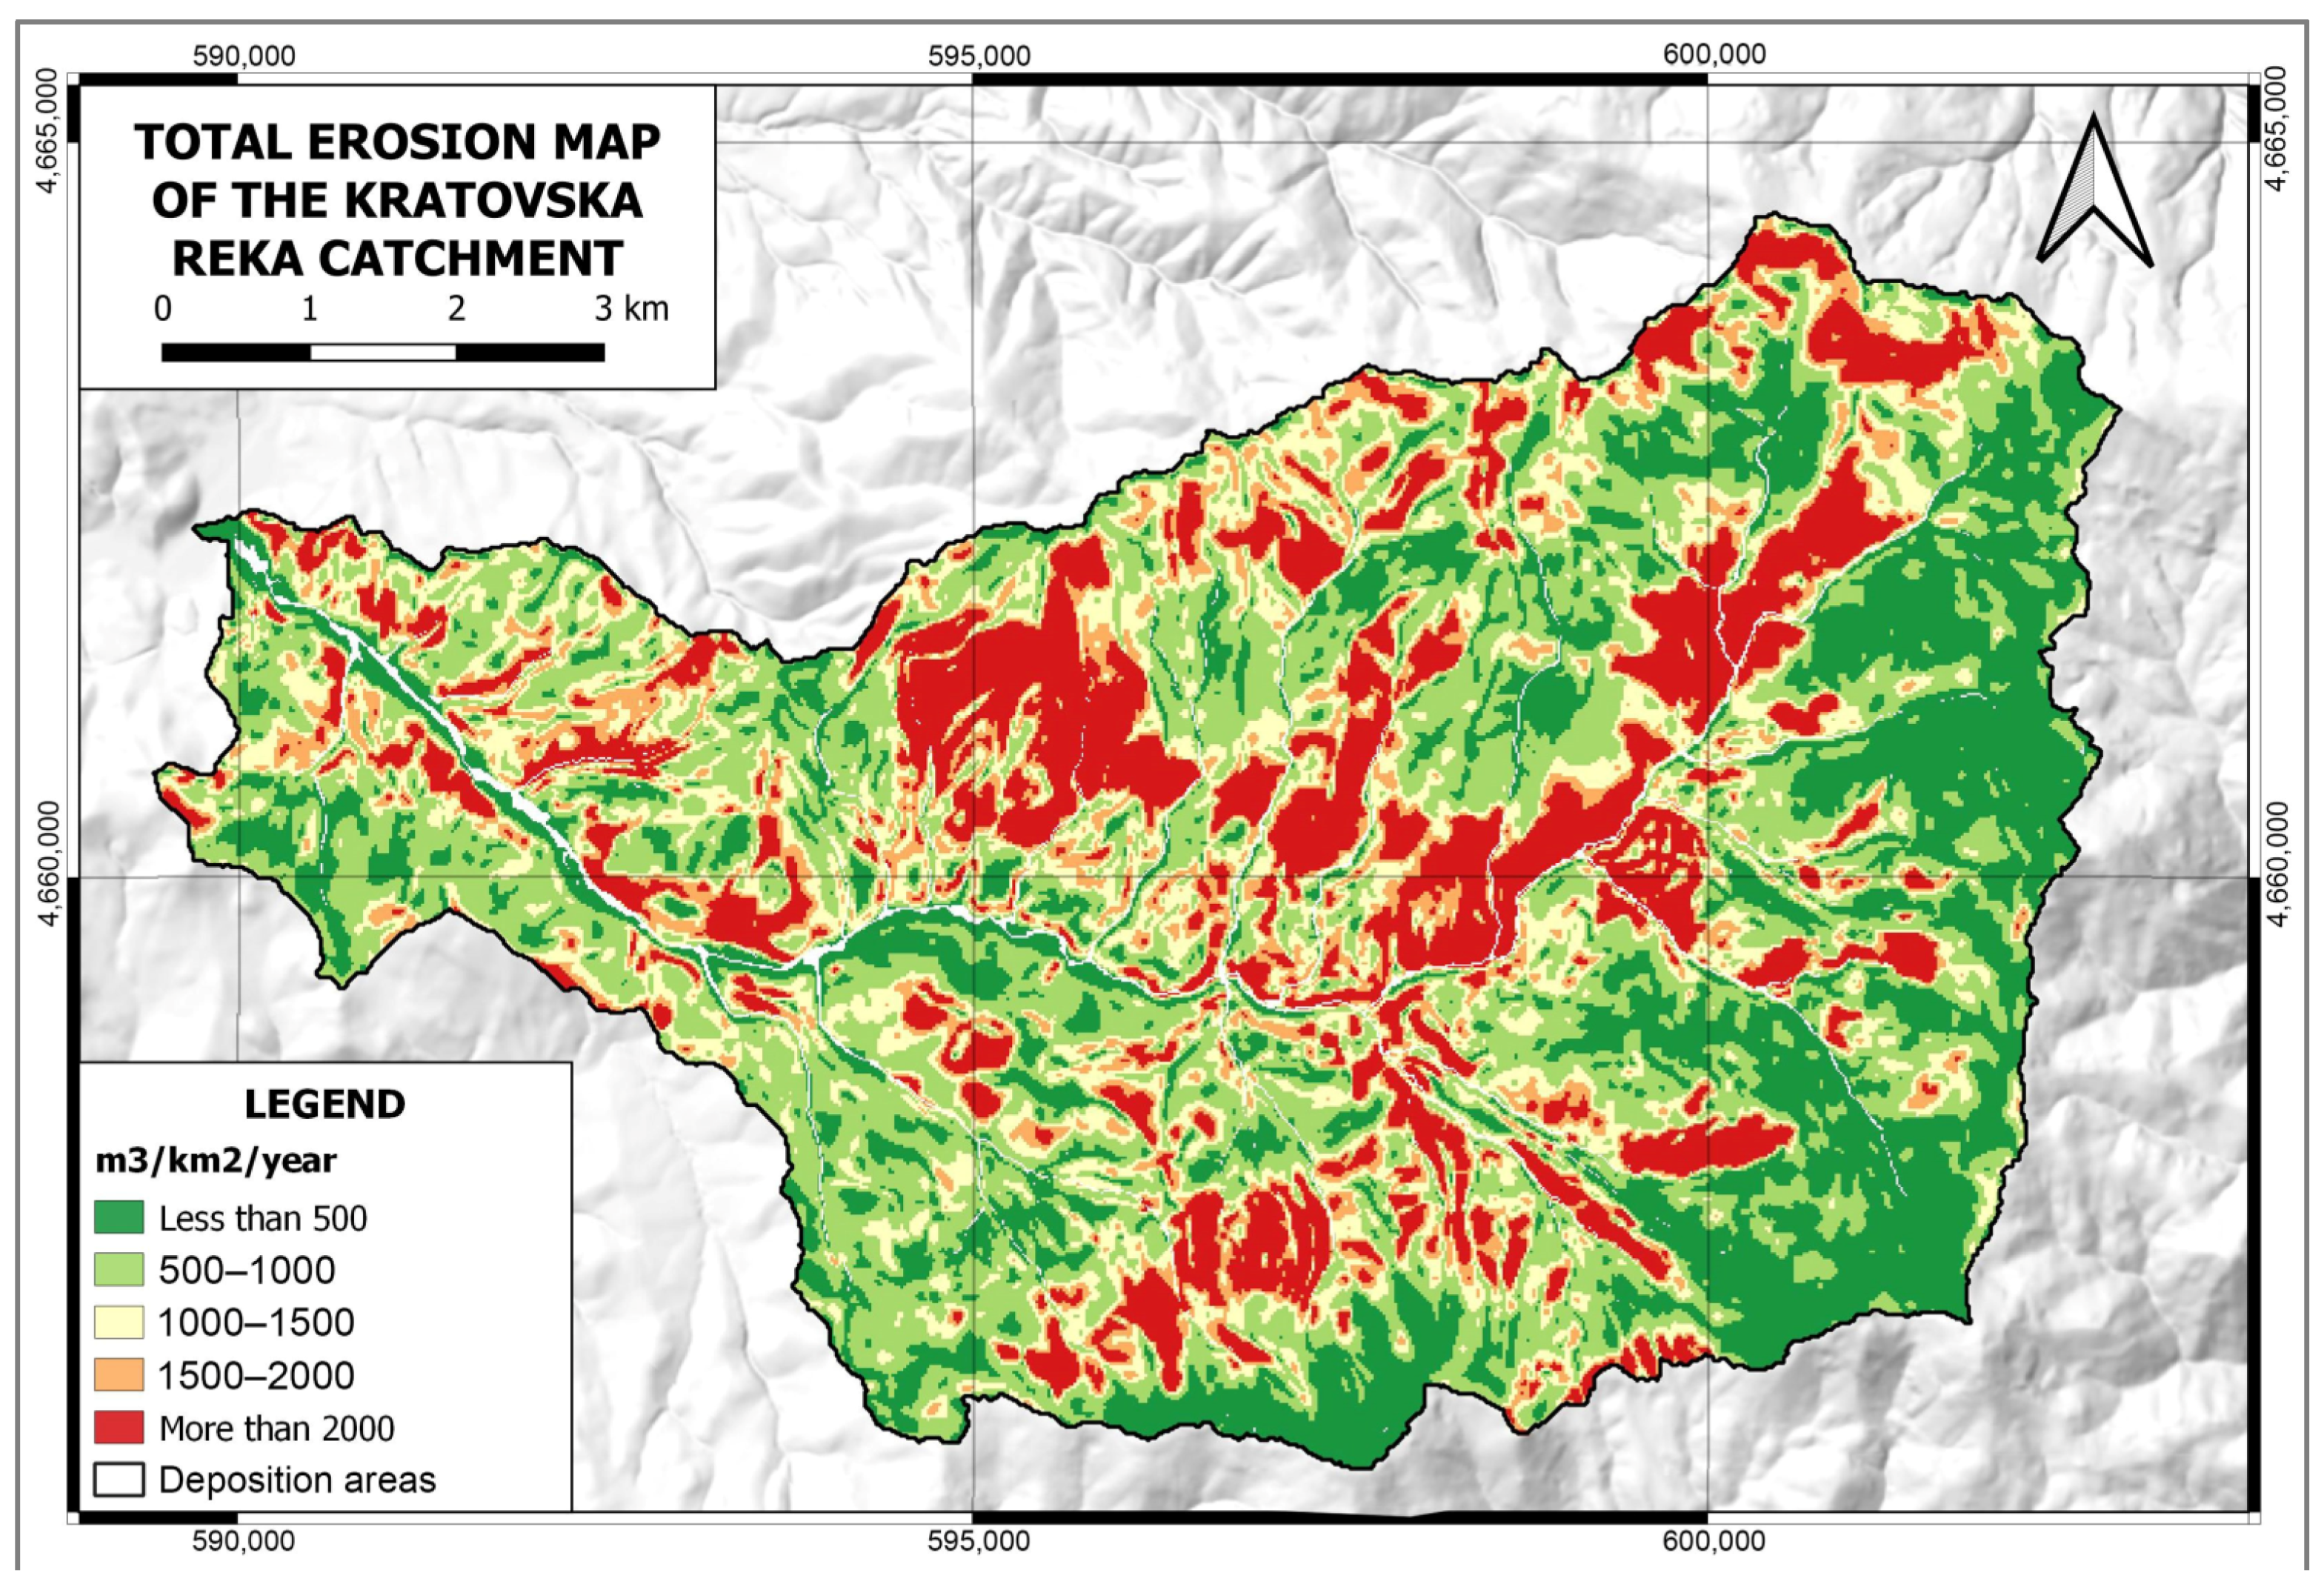
According to the obtained results of the EPM, it follows that Kratovska Reka has an erosive catchment area. The slope of the initial relief has the biggest impact on the Kratovska Reka catchment and the fluvial processes in it. The annual transfer of eroded sediment from Kratovska Reka to the estuary in Kriva Reka averages 691 m3/km2/year. The average annual sediment production is 72.709 m3. The values of the erosion coefficient (Z) show a significant presence of terrains with medium, high, and very high risk (values greater than 0.4), which comprises 28.79 km2 or almost 50% of the Kratovska Reka catchment. Otherwise, the average value of the erosion coefficient Z in the catchment is 0.56. Of the total area of the Kratovska Reka catchment, as much as 17.35% is under a very high risk of erosion, which exceeds 2000 m3/km2/year (a soil layer of 2 mm per year), which is a huge value. Excessive water erosion occurs here, which causes the creation of numerous erosive relief phenomena, the loss of fertile areas, and the filling of riverbeds with a large amount of sedimentary material. The specific erosion rate in the Kratovska Reka catchment is estimated to be 1286.5 m3/km2/year. The high specific erosion rate suggests that the investigated catchment experiences significant erosion rates, leading to the loss of soil and sediment deposition in the river system.
In comparison to the entire Kriva Reka catchment, the Kratovska Reka catchment exhibits higher erosivity, with a coefficient Z of 0.56 compared to 0.51. Additionally, the average annual erosion rate for the Kratovska Reka catchment is estimated to be 1063 m
3/km
2/year, whereas the Kriva Reka catchment has an erosion rate of 805 m
3/km
2/year. These results indicate that the average annual erosion in the Kratovska Reka catchment is nearly twice as high as the average specific erosion rate for the entire territory of North Macedonia, which is reported as 681 m
3/km
2/year according to [
50]. Furthermore, a comparison was made with a similar-sized study area, the municipality of Štrpce in southern Serbia. In a study [
103], it was found that 55.20% of the Kratovska Reka catchment exhibits low erosion rates, whereas the majority of the Štrpce municipality (50.03%) displays low erosion rates. Similar observations have been made by studies conducted by [
38,
45,
104], which indicate that the intensity of soil erosion is closely linked to dynamic interactions among natural conditions, demographic and settlement indicators, and changes in land use.
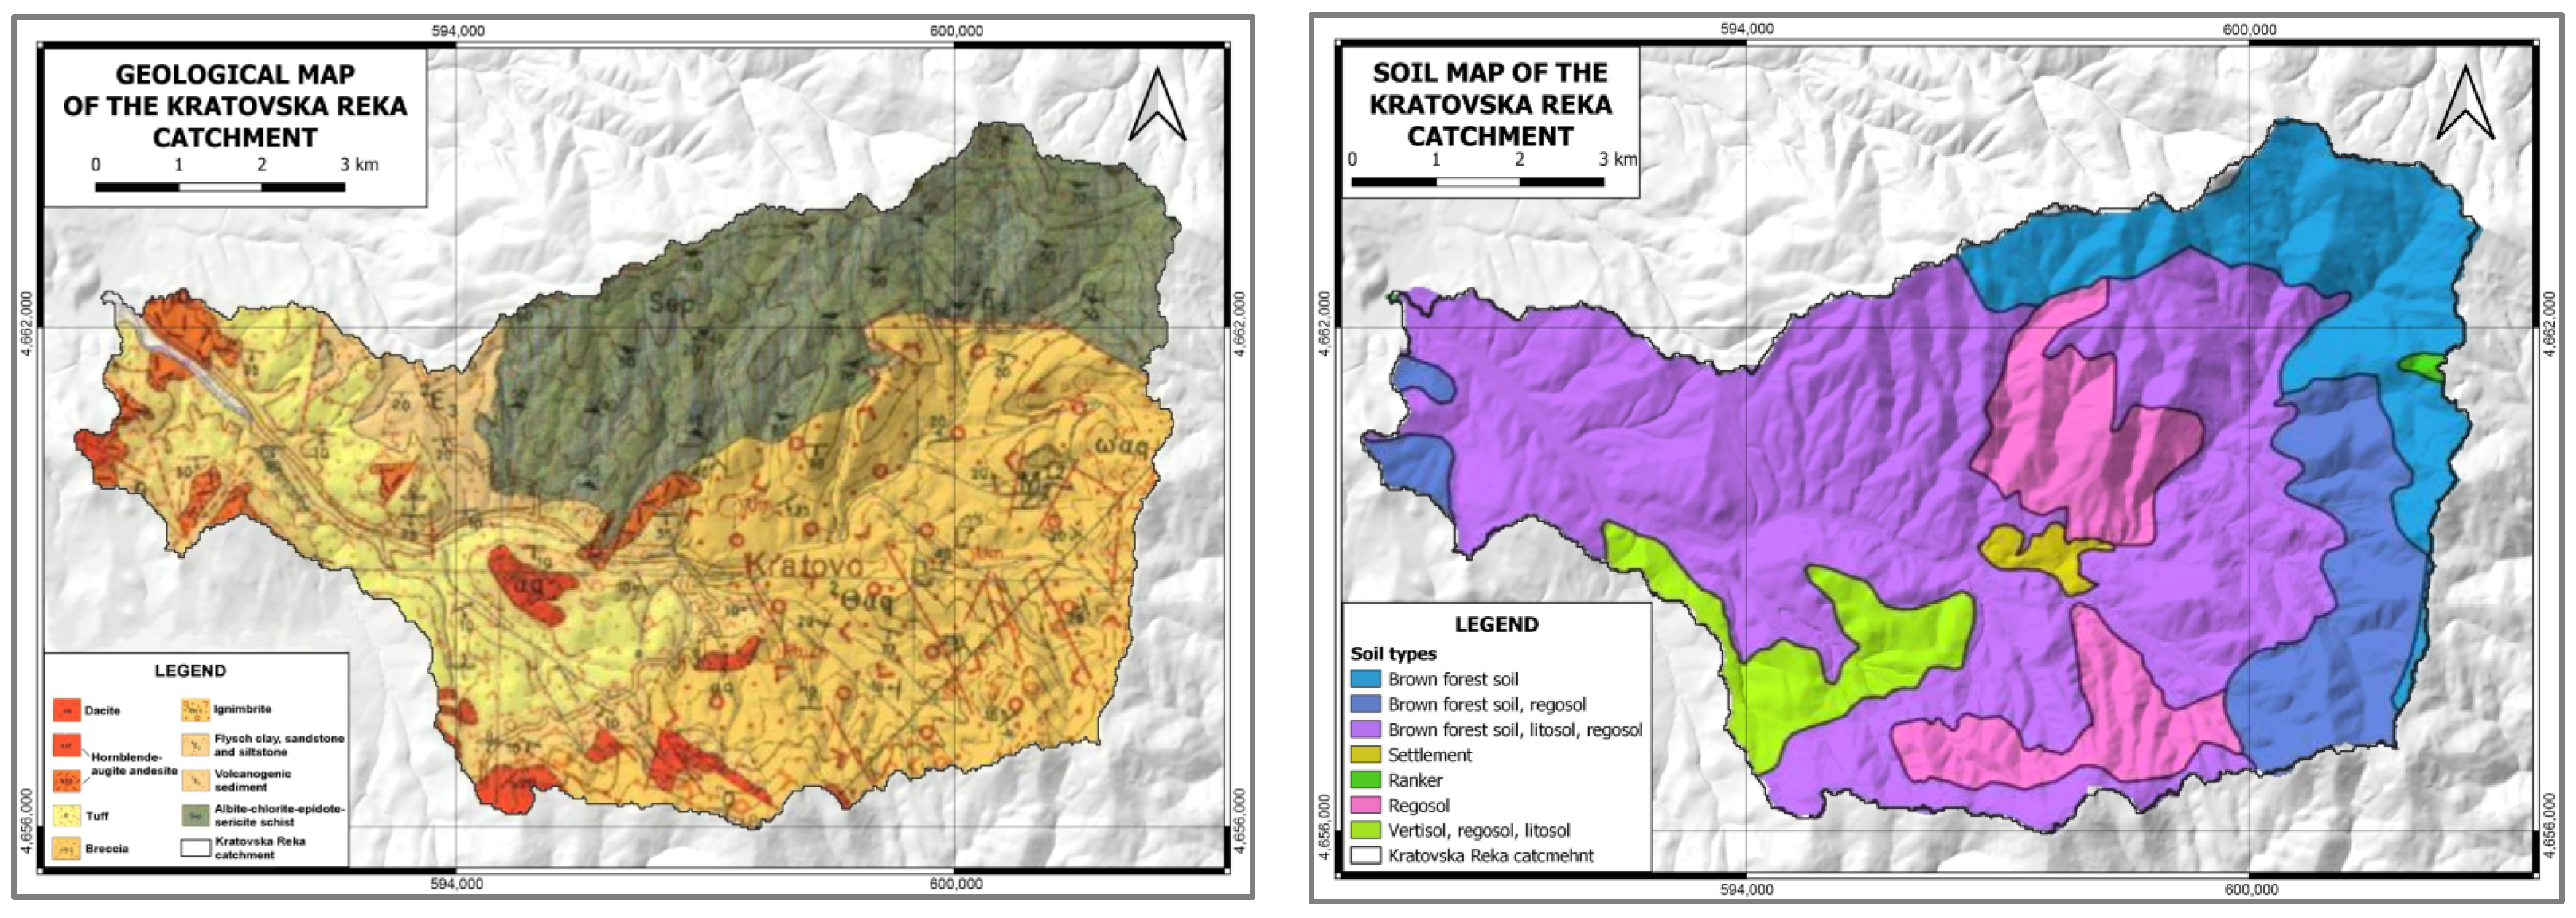
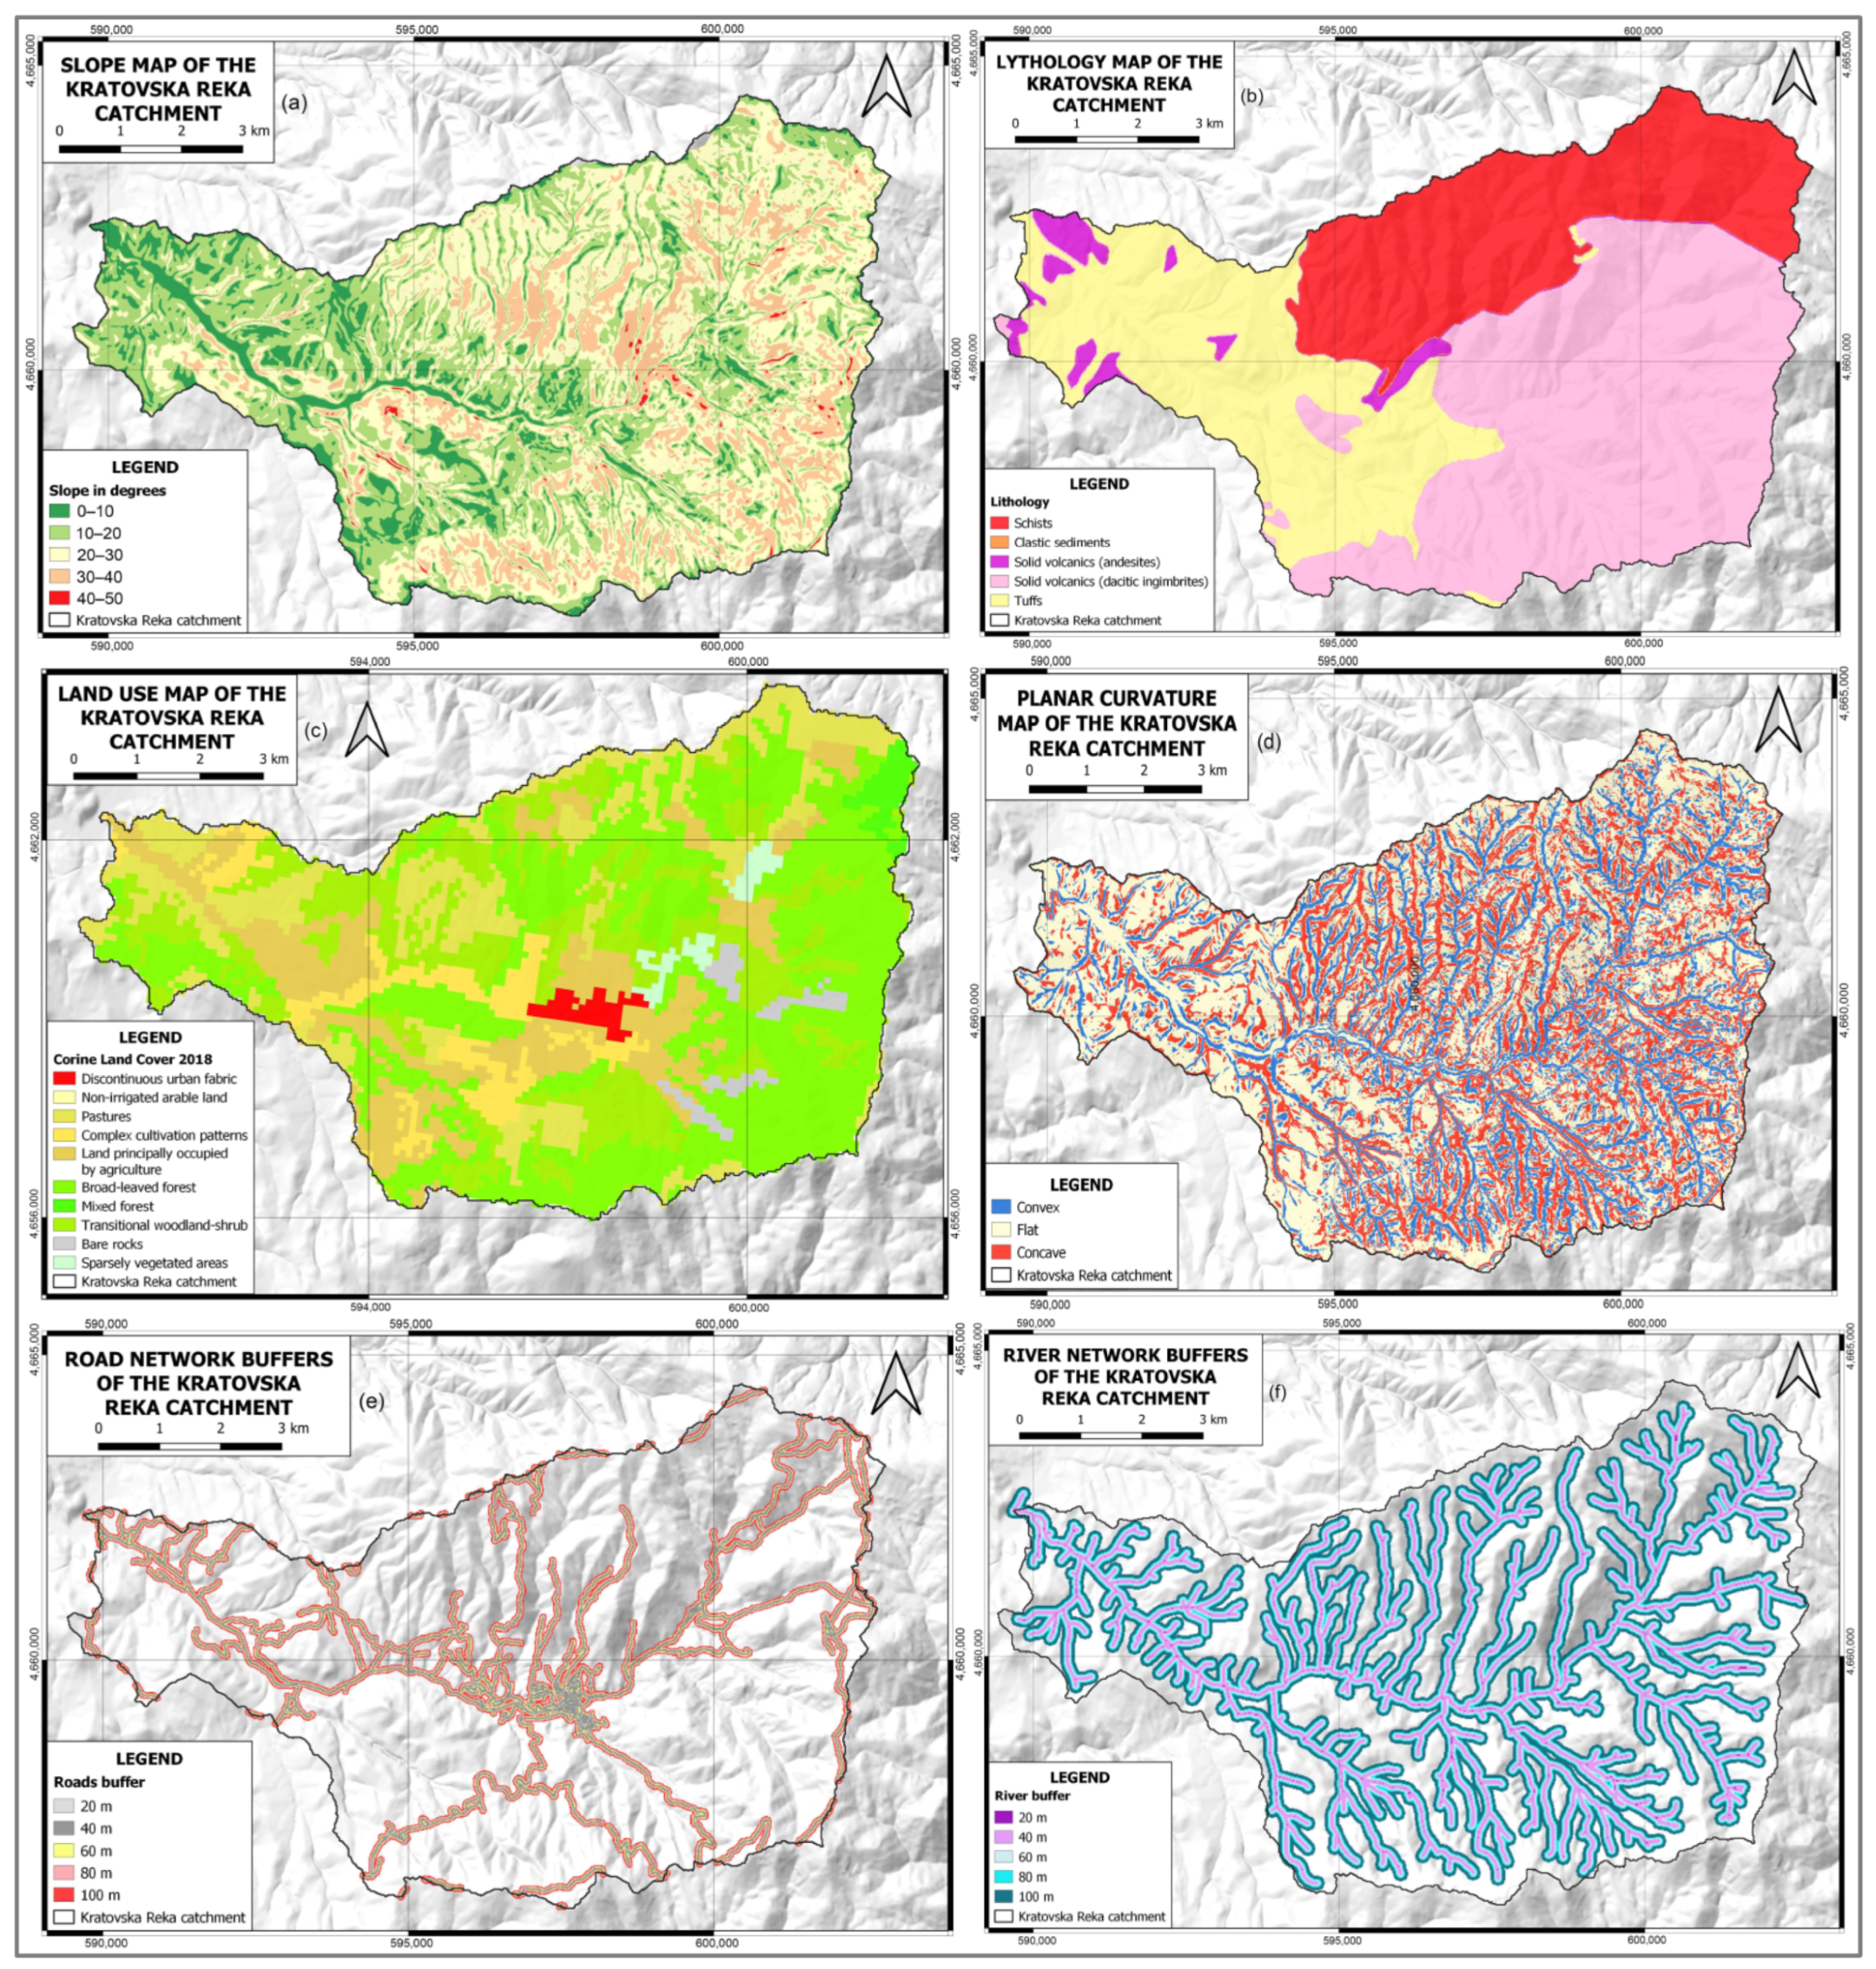
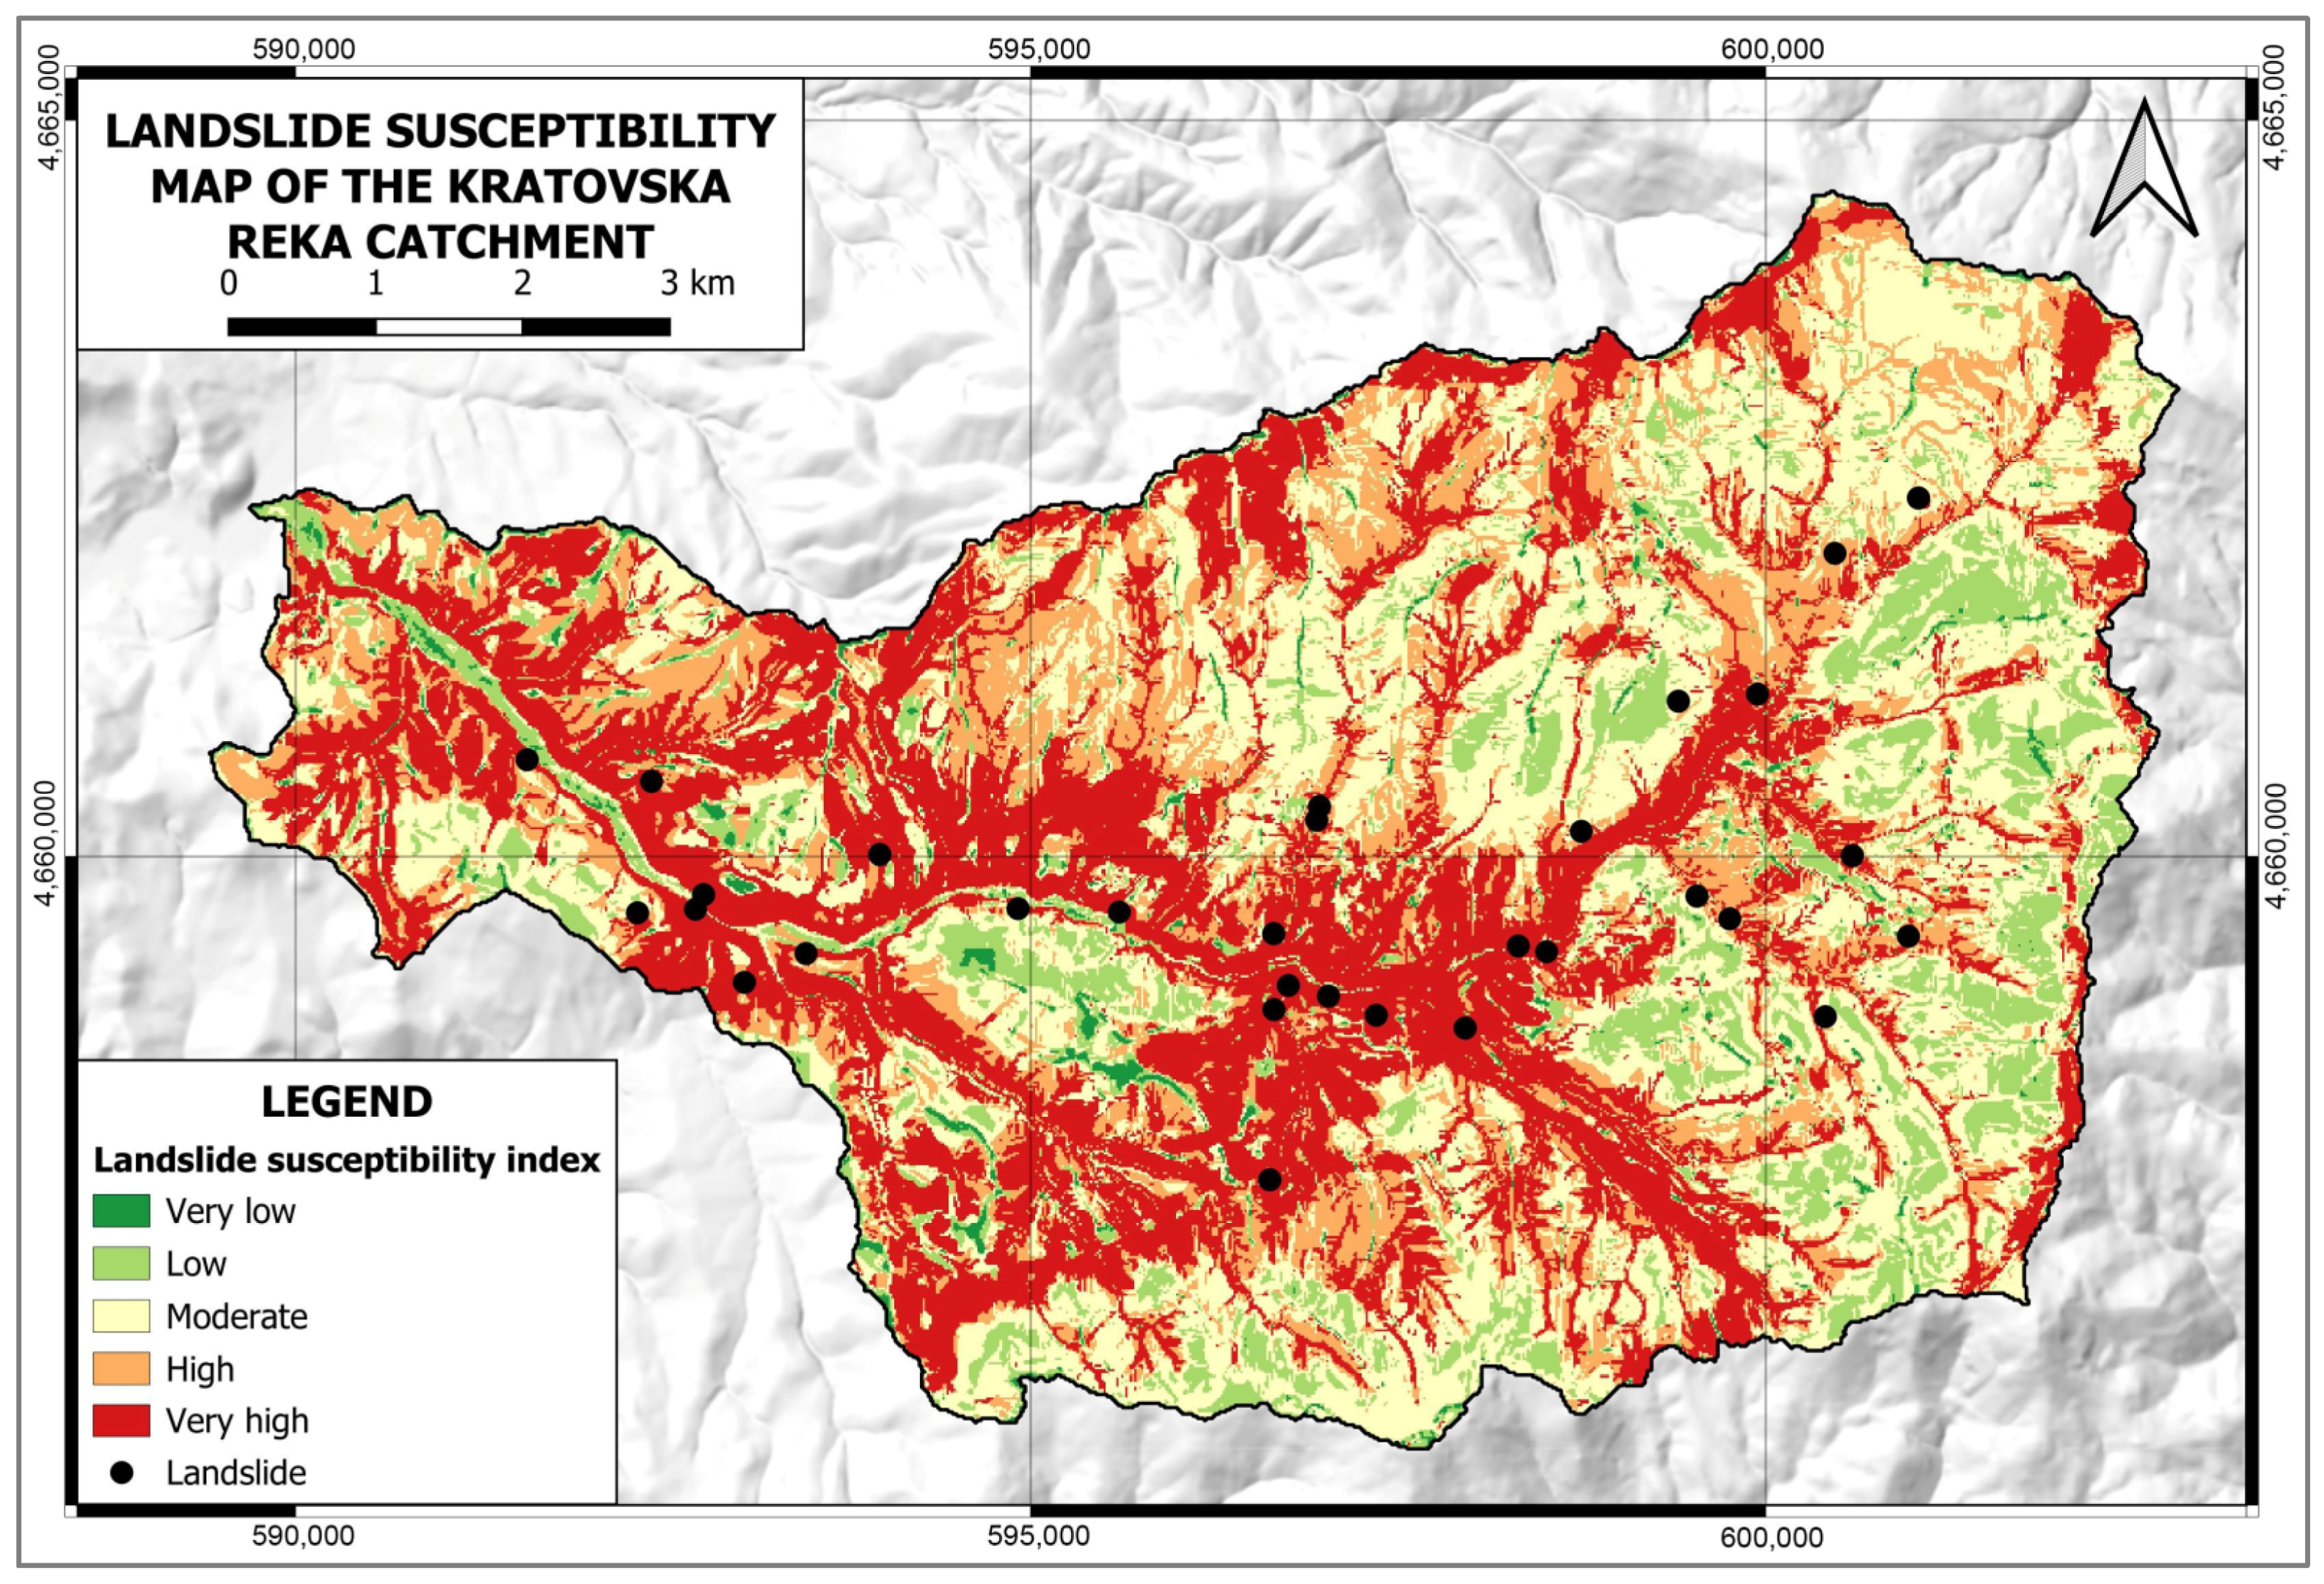
This study considered six factors as preconditions for landslide occurrence, namely slope, lithology, land cover, plan curvature, distance from streams, and distance from roads. These factors were converted into raster format and standardized to a cell size of 15 m × 15 m. The results revealed that a significant portion of the catchment (1/3) falls into the class with a very high probability of landslides, particularly in the downstream valley of the Kratovska Reka, below the city of Kratovo, and in the valleys of its left tributaries. The analysis also identified the steep valley sides of Kratovska Reka and the upper reaches of its right tributaries as areas with the highest probability of landslide occurrence. Conversely, the higher mountainous regions, characterized by lower slopes and composed of solid and compact volcanic rocks, exhibit a lower probability of landslides. Overall, the high-risk class, indicating a significant likelihood of landslides, encompasses approximately 33.03% of the Kratovska Reka catchment.
At the national level, the regions in North Macedonia with high and very high landslide susceptibility are predominantly found in hilly terrain, mountain foothills, valley bottoms, gorges, depressions, and basins [
54]. These areas are typically characterized by the presence of Neogene lacustrine sediments. In terms of the entire country, a significant portion (18.9% according to the LSI model, 33.4% according to the LSI + AHP model, and 40.1% according to the AHP model) falls into high and very high landslide susceptibility zones, as verified by the landslide dataset [
54]. In comparison, the Kratovska Reka catchment exhibits a higher susceptibility to landslides, when compared to the findings of [
54]. Results provided by this study indicate that the Kratovska Reka catchment is particularly prone to landslides, highlighting the need for appropriate measures and strategies to mitigate the associated risks in the area.
In order to enhance the mitigation measures and approaches, several aspects should be taken into consideration. Firstly, there should be a significant improvement in the inventory of landslide data, ensuring its accuracy and completeness. Additionally, the spatial resolution of the precondition data layers should be enhanced to capture more detailed information. Improving the weighting of factors is another important aspect, as it can contribute to a more accurate assessment of landslide susceptibility. This may involve refining the weights assigned to different factors based on their relative importance and influence on landslide occurrence. Furthermore, the inclusion of additional precondition factors can enhance the model’s predictive capabilities. Factors such as the topographic wetness index (TWI), stream power index (SPI), normal difference vegetation index (NDVI), geological structural elements, precipitation intensities, and other indicators can provide valuable insights into the susceptibility of an area to landslides (mass movements-wet).
Moreover, it is recommended that alternative model validation approaches, such as those proposed by [
105,
106,
107], are explored. This can help ensure the robustness and reliability of the susceptibility models. Overall, a comprehensive assessment of total susceptibility to natural hazards can provide valuable information for identifying vulnerable areas and implementing measures to protect the environment, as well as natural and cultural heritage [
79,
108,
109,
110].
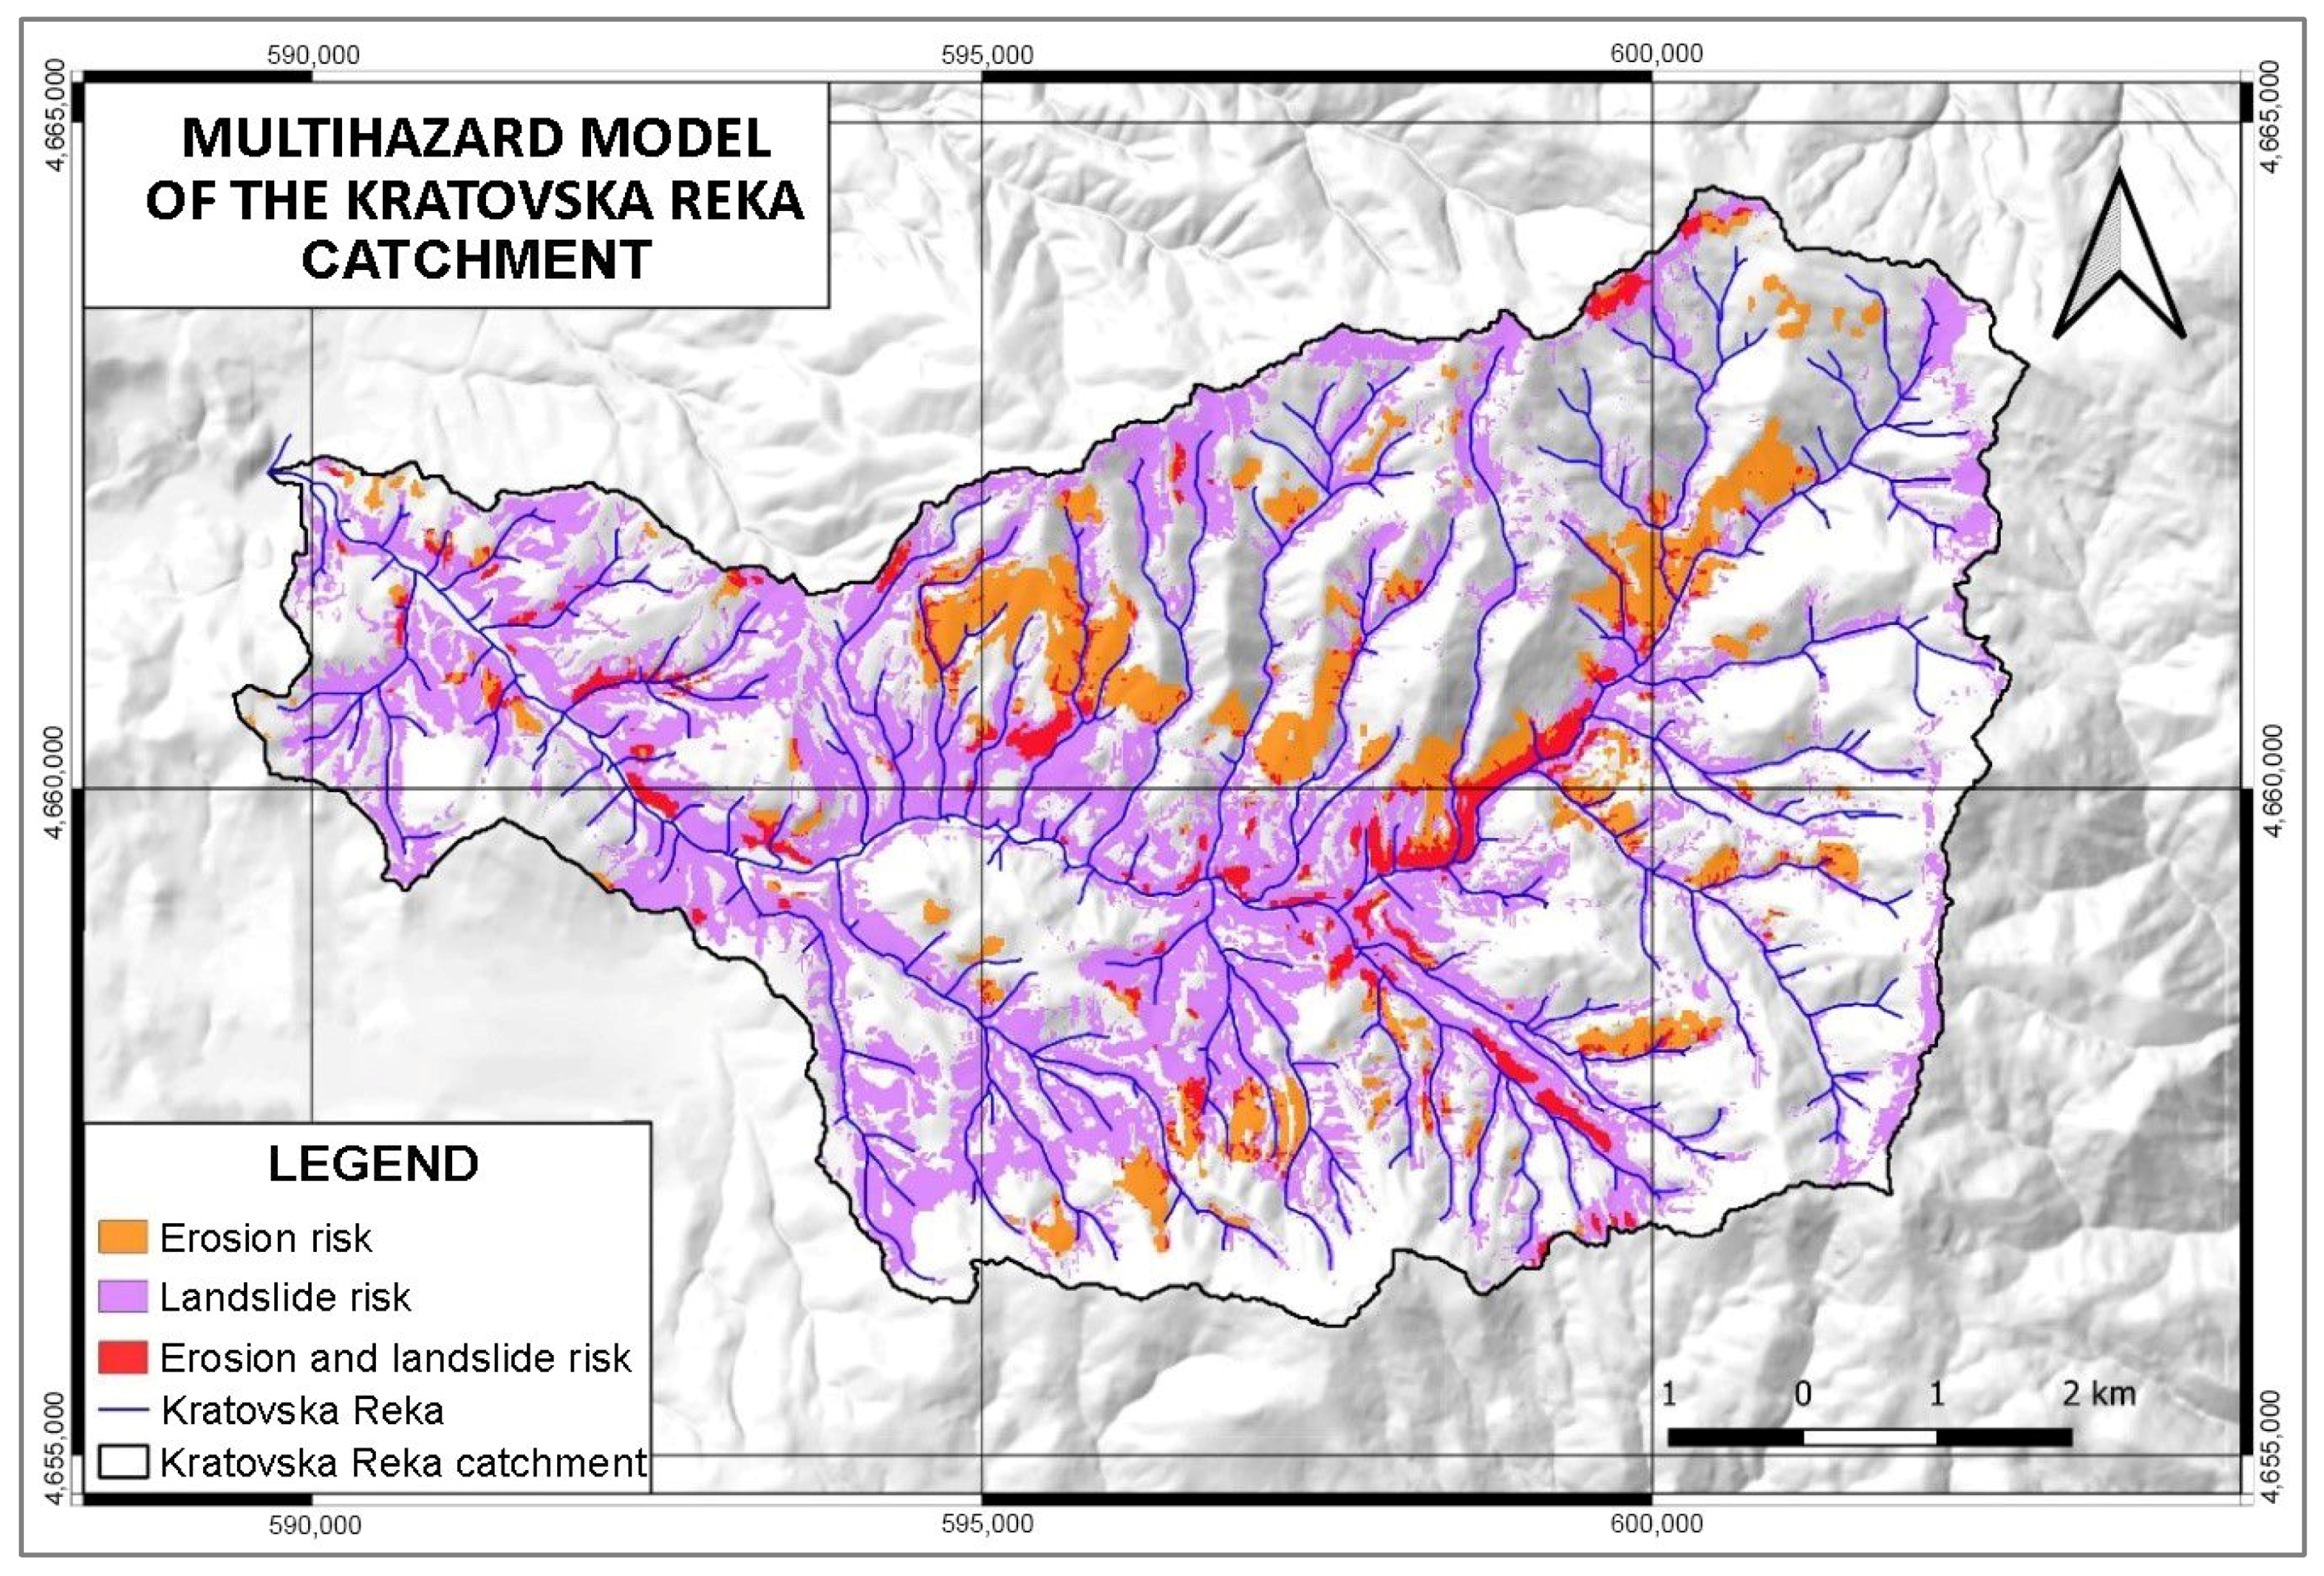
The terrain characteristics of the Kratovska Reka catchment in North Macedonia, including steep slopes and surface disintegration of rocks, make it susceptible to various geohazards (see
Figure 13). Among these hazards, excessive water erosion and landslides are particularly prominent. To assess and understand these risks, accurate GIS-based models have been developed to determine the potential occurrence of such hazards. These models indicate that a significant portion of the Kratovo municipality within the catchment area is at risk of experiencing these hazards in the upcoming multi-year period. The results hold significant importance for the local community and various institutions involved in environmental protection and emergency management. By providing an overview of the most potentially endangered locations in the area, these results serve as a valuable resource for decision-making and planning purposes [
103]. They help stakeholders identify areas that require special attention and prioritize efforts to mitigate risks, protect communities, and manage emergencies effectively.
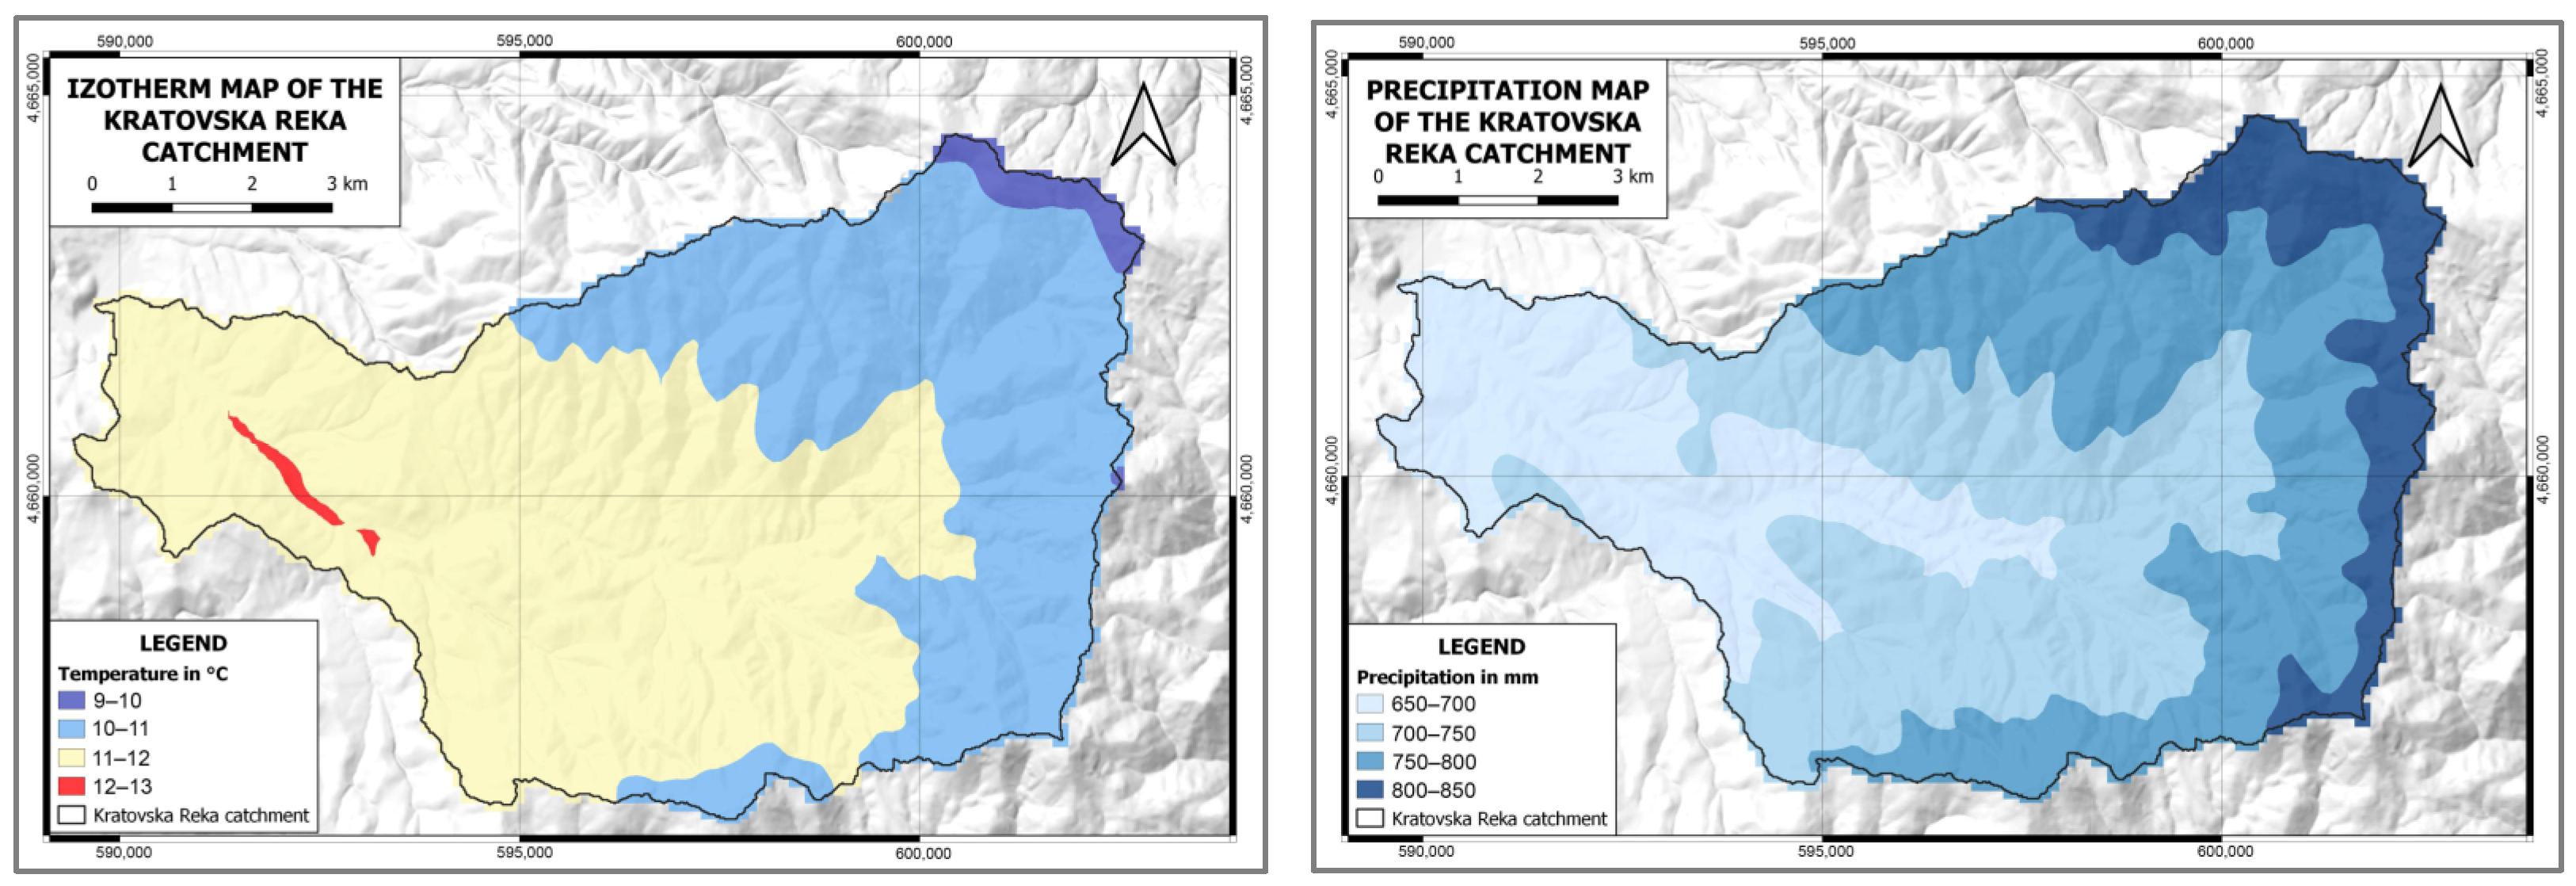
The places with the highest erosion potential and the riskiest parts for the probability of landslides are on the steep valley sides of the Kratovska Reka and its tributaries, and the source parts of the right tributaries, especially in places that are completely exposed or are under sparse grassy vegetation and unprotected from the erosive effect of rain. Precisely because of the above, the bare and steep valley sides of the Kratovska Reka and its tributaries, with an excessive amount of precipitation, can contribute to an increase in the intensity of erosion and the occurrence of landslides.
Within the Kratovska Reka catchment area, 3.13% of the total area is categorized as multi-hazard zones, meaning they are prone to both landslides and excessive water erosion. These areas are primarily located along the valley sides of the Kratovska (Tabačka) Reka, spanning from the village of Gorno Kratovo, downstream to the town of Kratovo. The terrain in these zones is characterized by deforestation, lack of vegetation cover, steep slopes, and the presence of rocks with low resistance to erosion. These factors contribute to the heightened vulnerability of these areas to multiple geohazards.
In the Kratovska Reka catchment, it is crucial to comprehensively assess the erosion situation, both remotely and in the field, in order to define and implement appropriate anti-erosion measures to mitigate the intensity of erosion and soil loss. It is important to prioritize the dominant hazards, in order to implement targeted preventive measures. Considering the specific conditions and physical characteristics of the investigated area, measures can be tailored to address the most significant hazards, such as landslides and excessive water erosion. By focusing on these dominant hazards, it is possible to develop and implement effective preventive strategies that mitigate the risks associated with soil loss and protect the environment, natural resources, and infrastructure in the catchment.
The standardization and implementation of multi-hazard methodologies would be a significant step towards enhancing the qualitative monitoring and identification of geohazards at the local and regional scale in North Macedonia. This approach would emphasize the importance of risk assessment and management programs, which are currently under development in this part of southeast Europe. Furthermore, future studies could expand on this work by conducting broader research that covers the entire territory of North Macedonia.
The maps and calculations derived from this research could serve as a foundation for a comprehensive inventory of hydro-meteorological hazardous events. Such an inventory would provide valuable knowledge for establishing appropriate management and mitigation guidelines and measures, not only within the studied area but also at regional and national levels in the region [
38]. This would greatly contribute to improving the overall understanding and response to geohazards in North Macedonia, leading to more effective risk management and enhanced resilience to natural disasters induced by climate change.
The research included a crucial aspect of validating the results obtained from the implemented approach. The most effective validation tool for the erosion potential model (EPM) is comparing the model results with the average annual sedimentation in reservoirs that rivers flow into, typically measured using echo sonars. Unfortunately, there are no such reservoirs in the Kratovska Reka catchment or its larger recipient, the main river of Kriva Reka. Another option for future investigations is comparing the model results with measured sediment load, but the only gauge station nearby is located on the main river, Kriva Reka, near the village of Trnovac. However, a similar GIS-based EPM approach implemented by [
50] on the Kriva Reka has demonstrated that the model produces highly accurate results when comparing sediment transport through the river profile. To further enhance the accuracy of the model, the installation of a gauge station with sediment transport measurements near the outlet of Kratovska Reka would provide a direct opportunity for result comparison and validation. Until then, it is considered that the model’s comparison with sedimentation data for the entire Kriva Reka catchment, as well as the heuristic approach involving opinions from three additional national erosion experts regarding soil erosion quantity based on the national maps, demonstrates acceptable accuracy of the obtained results.
Validating the landslide susceptibility model is relatively easier, as it requires at least a basic landslide inventory. In this regard, the positions of the 31 landslides recorded during the field survey were compared with the model’s zonation, resulting in an 80.7% overlap with the high and very high susceptibility zones.
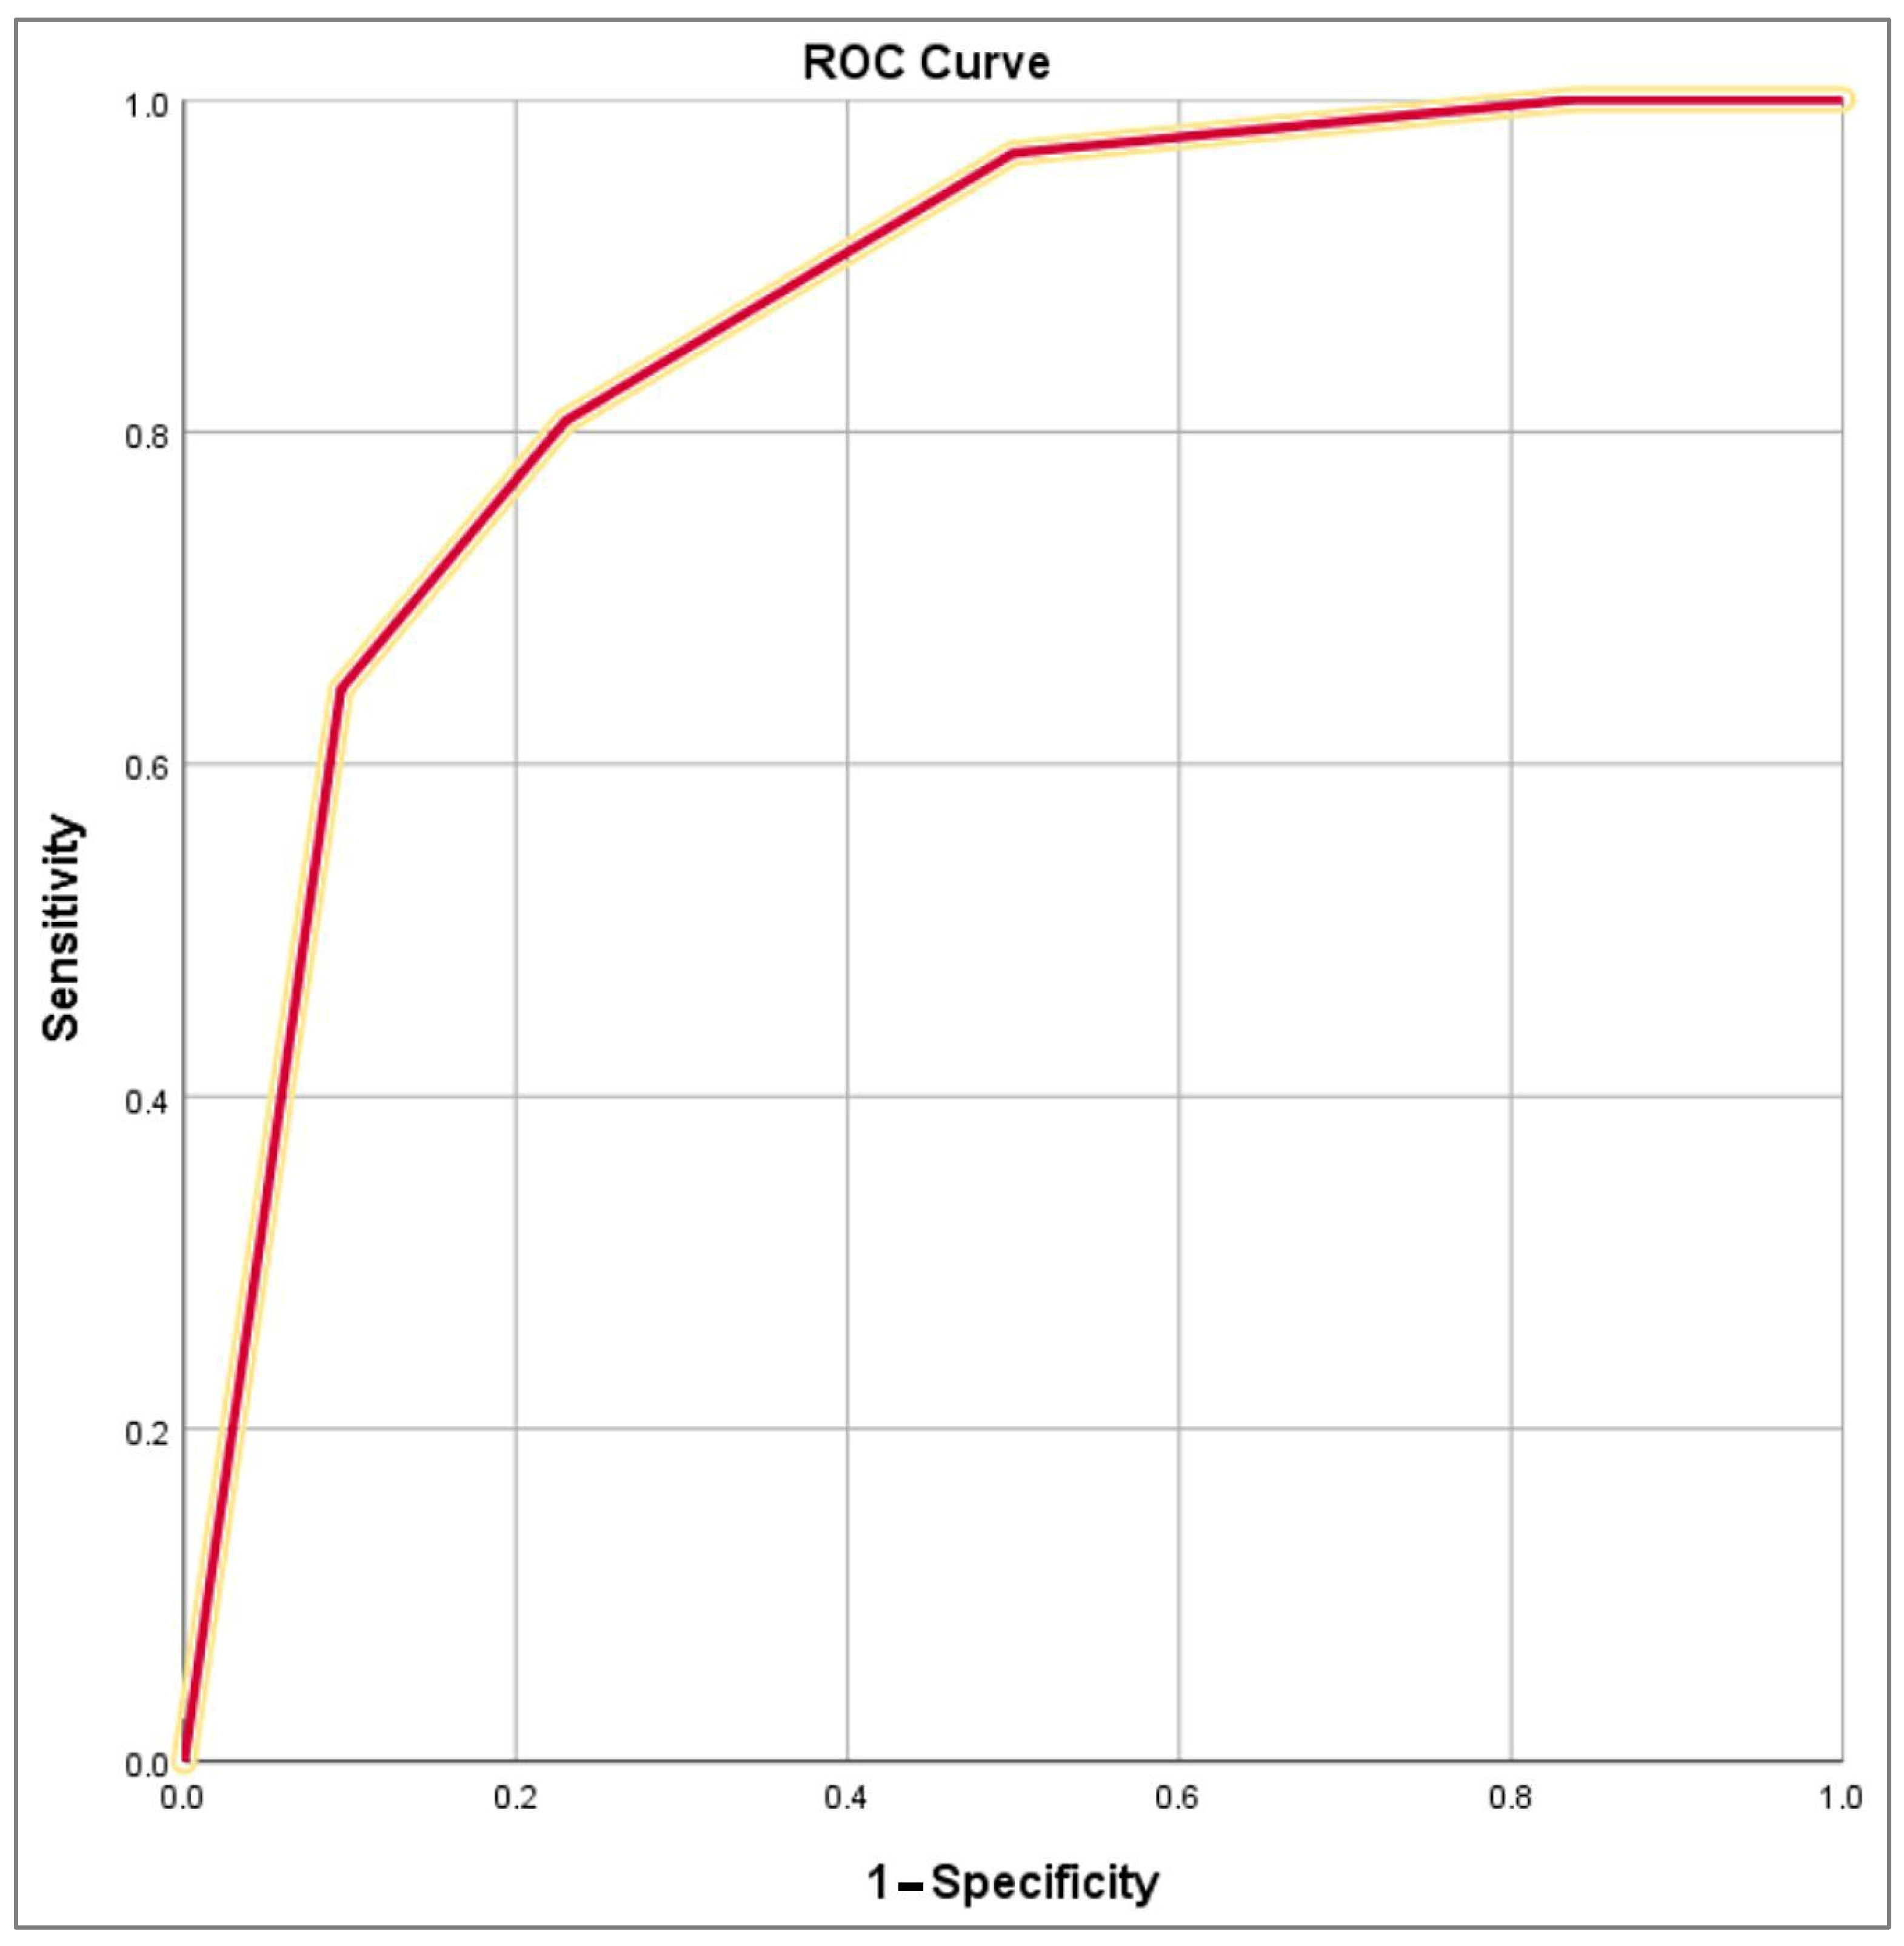
The ROC curve and AUC value in this study were also calculated. Based on the calculated data, the AUC value was determined to be 0.856, indicating a good level of accuracy for the model employed. Additional validation can be conducted by analyzing the Kappa values. Furthermore, it is crucial to emphasize the necessity for further research, particularly related to the validation of results using precise LIDAR measurements and other advanced technologies to assess whether erosion and landslide risks are increasing or decreasing in this part of North Macedonia.
5. Conclusions
The analysis of territories that are highly susceptible to geohazards plays a crucial role in facilitating the adoption of appropriate preventive measures and effective environmental management actions by local, provincial, and state services [
103]. The primary objective of a multi-hazard map is to identify and delineate hazardous areas, thereby aiding in activities aimed at reducing the hazards and mitigating future damage [
55,
56]. This becomes particularly significant when considering the impact of climate change, which is associated with increased landslide activity and excessive erosion. The approach presented in the paper has the potential to generate reliable multi-hazard maps at the national level and provide valuable information for regional planning and decision-making processes. By utilizing such maps, stakeholders can make informed choices and take appropriate measures to minimize the risks associated with geohazards and enhance overall resilience to environmental challenges.
The Kratovska Reka catchment, with its distinctive physical characteristics, geographical position, and rich geodiversity, offers an ideal setting for conducting a comprehensive analysis of geohazards on a regional basis. Utilizing Geographic Information Systems (GIS), relevant data pertaining to the entire research area were used to analyze and assess the extent of excessive and water erosion, susceptibility to landslides, and identify areas prone to multi-hazards. By leveraging the capabilities of GIS, a holistic understanding of the interaction between the geohazard and landscape within the case study was achieved. Creating a cadastre of areas endangered by geohazards in the Kratovska Reka catchment can indeed be a valuable future goal. Such a cadastre could serve as an essential tool for sustainable spatial and urban planning, thus enabling decision-makers to incorporate hazard mitigation measures into development plans, in order to reduce unfavorable effects on natural resources, the local economy, and socio-demographic processes.
Landslides have been identified as the predominant geohazard in the Kratovska Reka catchment, accounting for approximately 33.03% of the total area vulnerability. Additionally, the analysis of excessive erosion revealed a mean erosion coefficient of 0.56, indicating a high level of erosion within the analyzed catchment. Nearly 50% of the area is affected by the highlighted erosion processes. By integrating the analysis of these two geohazards using GIS techniques and employing methods such as natural breaks, a multi-hazard model combining water erosion and mass movements (wet) was derived for regional scale analysis. This model indicates that 3.13% of the catchment is highly or very highly susceptible to the combined effects of water erosion and landslides. The overall risk associated with these geohazards, including the multi-hazard susceptibility, amounts to 39.86% of the catchment area. These findings emphasize the importance of addressing both landslides and excessive erosion in the management and mitigation of geohazards within the Kratovska Reka catchment in North Macedonia.
In this area, which is a part of the Kratovo-Zletovo paleovolcanic area, combining the obtained results with field research is crucial for effectively preserving and protecting the geodiversity values. The results of this work contribute to the growing evidence of erosion risk in southeast Europe [
22], shedding light on the specific challenges and vulnerabilities within the Kratovska Reka catchment in North Macedonia. The identification and assessment of erosion risk in this part of the region provide valuable information for understanding the broader patterns and dynamics of erosion processes in southeast Europe [
25,
26,
27]. The findings can be used as a foundation for further research and refinements in erosion risk assessment methodologies, including the incorporation of additional factors, validation techniques, and improved modelling approaches [
55,
56,
57,
58,
59,
60].


 ,
, 


