Article

The Commuting Patterns and Health Effects among Urban Residents in Low-Visibility Air Pollution Environments: An Empirical Study of Gaoyou City, China

1
College of Construction Engineering, Jiangsu Open University, Nanjing 210019, China
2
Admissions Service Department, Jiangsu Open University, Nanjing 210019, China
3
Key Laboratory of Transportation Meteorology of China Meteorological Administration, Nanjing Joint Institute for Atmospheric Sciences, Nanjing 210041, China
4
Department of Financial, Nanjing Institute of Technology, Nanjing 211167, China
*
Author to whom correspondence should be addressed.
Atmosphere 2023, 14(7), 1140; https://doi.org/10.3390/atmos14071140
Submission received: 16 June 2023 / Revised: 5 July 2023 / Accepted: 6 July 2023 / Published: 12 July 2023

Abstract

:
Low-visibility air pollution frequently occurs in the major cities of China and affects residents’ physical and mental health. This study, using Gaoyou City as a case study, selected 10 typical residential communities with different locations and types and conducted a questionnaire survey for two consecutive weeks to measure commuting behavior characteristics and health effects among residents in environments with different degrees of air pollution from November to December 2022. Concerning commuting distance, the average straight distance for short-distance commuting was 1.4 km, and the median commuting distance was 13.2 km. In air-polluted environments, residents’ commuting times were mainly concentrated within 1.5 h, with a majority taking 20 min to 30 min. The working and living spaces presented a circular core distribution pattern, with low-visibility air pollution significantly affecting the choice of commuting mode and having an indirect impact on health. The proportion of people who chose bus commuting significantly increased as air pollution changed from mild to moderate, whereas the proportion of people choosing slower commuting, such as walking, significantly decreased. While no significant fluctuations in physical health levels occurred, psychological health levels significantly decreased. In high air pollution environments, residents’ sleep quality, attitudes towards life, emotional states, and other assessed factors exhibited an inverted U-shaped correlation with commuting patterns. Low-visibility air pollution indirectly damaged the health of residents by affecting their commuting patterns, reducing their physical activity intensity and commuting options, and increasing their psychological stress and anxiety.

1. Introduction

Air pollution in Chinese cities has increased in recent years. Among the 200 largest cities in China, less than 1% meet the air quality standards recognized by the World Health Organization [1]. In this study, low-visibility air conditions refer to situations in which there are varying levels of air pollution. Previous studies have mainly used the air quality index (AQI) to measure the degree of air pollution. According to Chinese national standards, air quality levels are divided into excellent (AQI ≤ 50), good (50 < AQI ≤ 100), minor (100 < AQI ≤ 150), mild (150 < AQI ≤ 200), moderate (200 < AQI ≤ 300), and severe pollution (AQI > 300) [2,3]. Research has shown that air pollution influences daily activities such as residents’ travel. In low-visibility air pollution environments, the frequency of various residents’ travel activities has been shown to decrease by varying degrees [4], with a significant effect on residents’ slower commuting such as walking [5]. In addition, when air pollution is severe, residents’ travel willingness and travel time significantly decrease.
Generally, the higher the Air Pollution Index is, the worse the visibility is. But visibility is not only affected by air pollution. Visibility is an indicator that reflects atmospheric transparency, which is not only affected by the content of pollutants in the air but also by air humidity and atmospheric fluidity. Therefore, except for hazy days, visibility is also be very low during rainy and snowy weather [5]. Experts suggest that when visibility is less than 500 m and more than 200 m, the speed of a motor vehicle should not exceed 80 km per hour. When the visibility is less than 200 m and more than 100 m, the speed of a motor vehicle shall not exceed 60 km per hour. When the visual distance is generally around 10 m, the speed of motor vehicles should be controlled below 5 km per hour [3]. Owing to severe air pollution, which can reduce travel visibility and result in varying degrees of traffic congestion, some private car owners choose public transportation [6]. Therefore, air pollution may reduce residents’ willingness to travel and affect their choice of transportation; its mechanism of action is multifaceted [7].
Commuting refers to the daily transportation behavior of residents between their places of residence and work. Commuting is a daily high-frequency behavior, and some studies have suggested that commuting behavior has a significant impact on residents’ emotional and mental states [8]. Commuting stress involves both objective and subjective moderating factors [9]. Objective factors include commuting time, commuting distance, commuting efficiency, and congestion level, while subjective factors include personal expectations of commuting conditions, personal ability to control commuting travel, and relevant personal and family characteristics [10]. Specifically, a long commute increases the likelihood of psychological stress [11], negative mental attitudes [12], and lower self-assessed health levels [13] among residents, with residents being more likely to be absent from work due to illness (Figure 1). In addition to commuting time and distance, significant differences have been reported in terms of the various modes of transportation chosen based on residents’ mental states [14]. Commuting modes are typically divided into active and passive. Active commuting modes, including walking, cycling, and other related forms of transportation, have been considered modes of commuting that can bring about relaxation and pleasure [15]. Passive commuting mainly refers to public transportation or private car travel, which is likely to cause psychological stress in individuals [15]. Some studies have found that commuting may cause personal health problems, including cardiovascular disease, hypertension, physical discomfort, and other symptoms [16], while another study reported a correlation between commuting mode and cancer [17].
In addition, low-visibility air pollution has a significant impact on residents’ travel patterns. Previous studies have demonstrated that residents are more willing to use public transportation in air-polluted environments [18]. The more severe the air pollution, the greater the density of use and distance of travel using public transportation in efforts to reduce exposure to air pollution. In different air pollution environments, the frequency, time, density, intensity, and other indicators of residents’ transportation undergo significant changes [18]. Research on residents’ travel behavior has shown that their daily commuting behavior is significantly influenced by the external environment and that residents choose different commuting modes accordingly [19]. Based on the planned behavior theory, one study has suggested that air pollution negatively affects residents’ travel pleasure and influences their choice of commuting tools [20]. Another study suggested that the impact of low-visibility air pollution has multiple effects on residents’ commuting behavior [21]. First, residents tend to choose taxis or private cars for travel, thereby reducing outdoor exposure time. Second, while some residents choose public transportation for travel, the intensity and frequency of travel significantly decreases [21]. It has also been suggested that middle-aged and older adult populations are more sensitive to low-visibility air pollution and that such populations tend to choose public transportation, allowing for their socioeconomic status [22].
Previous research has been limited to descriptions and summaries of feature patterns, and an in-depth analysis of the internal influencing mechanisms is lacking. The relationship between health issues that arise among residents and commuting is often overlooked; however, the psychological and physiological health issues that commuting may cause need to be addressed. In addition, commuters are often restricted by factors such as public transportation availability and road traffic environments during travel, resulting in various mental health problems such as fatigue, psychological stress, and depression. This study focused on Gaoyou City, Jiangsu Province, China, as a case study to investigate the effects of different commuting modes on health. Specifically, it used questionnaire surveys and on-site interviews to identify the characteristics of residents’ daily commuting behavior and to explore the impact of air pollution on residents’ commuting patterns and its health effects (Figure 2).

2. Data and Methods

2.1. Study Area and Data Source

2.1.1. Study Area

The main urban area of Gaoyou City in Jiangsu Province has a population of approximately 330,000 and a built-up area of approximately 52.12 km2 (Figure 3). According to China’s seventh census, the population aged 60 or above in Gaoyou City accounted for more than 30% of the total in 2022, with the working-age population aged between 18 and 55 years accounting for less than 37%. As an important and comprehensive regional transportation hub in Jiangsu Province, Gaoyou City has a high north–south traffic flow in the eastern region of the city. The urban scale and developmental conditions of Gaoyou City have led to different commuting modes within the city. In recent years, the construction of the Gaoyou New Urban Area has strengthened the phenomenon of spatial mismatch between workplaces and residences, thereby increasing the frequency of medium- and long-distance travel among residents. With the diversification of transportation, particularly the widespread use of motor vehicles and electric bicycles, more choices are available in terms of residents’ daily commutes. There are significant differences in the transportation routes and spatial environments corresponding to different commuting modes, resulting in different commuting experiences, which, in turn, lead to differences in residents’ psychological states and in health-related effects.
Over the past 20 years, urbanization in Gaoyou City has continuously expanded, the scale of built-up areas has increased, and the urban population has risen rapidly. Urbanization has been reported to be beneficial for the rapid aggregation of populations, resources, and other related factors, bringing greater convenience to residents’ daily lives [23]. However, at the same time, China’s rapid urbanization process has been accompanied by high-intensity industrial production and transportation, with a steady increase in the level of urban air pollution. Low-visibility air pollution restricts residents’ commuting behavior, thereby negatively affecting their physical and mental health. Furthermore, large-scale industrial production and expansion in the number of residents increases energy consumption, which generates large amounts of greenhouse gases and exacerbates air pollution at the micro-urban scale [24].

2.1.2. Data Source and Processing

(1)
Socio-economic attribute data
After considering multiple factors, such as the construction age of different residential quarters, housing quality, ownership of property rights, and distance from the city center, 11 different types of residential quarters in Gaoyou City, including Yijiatianxia, Yujingyuan, Jufuyuan, Juanli, and Haitangyuan, were selected in which to conduct a questionnaire survey. The questionnaire sought information concerning individual socioeconomic attributes, commuting behavior, and self-evaluation of health. A total of 762 questionnaires were distributed. Specifically, the survey collected detailed data on Gaoyou City residents’ living places, workplaces, and commuting behaviors as well as self-evaluation data on health status such as height, weight, daily living habits, physical comfort, mental stress, and life satisfaction. The researchers distributed questionnaires for two consecutive weeks in November and December 2022. A total of 762 questionnaires were collected during the survey, including 718 questionnaires from individuals aged 16 years and above with regular commuting behavior and complete health status data. In addition, the study quantified the working living distance of residents who filled in the questionnaire based on the Gaode electronic map, eliminated obvious erroneous outliers, and finally obtained 685 valid questionnaires, with a response rate of 89.9%. There were more females than males, most were aged between 20 and 30 years, most had an educational background of junior high school level and above, and family income presented a normal distribution (Table 1).
In addition, a confidentiality option for residents’ privacy was added to the questionnaire content. The participants consented to participate in a survey on their personal social and economic background and daily activity habits. The content of the questionnaire fully informed the respondents of the risks they faced and of their rights. In particular, the questionnaire was anonymized to protect the participants’ privacy. To further protect the participants’ privacy, we actively deleted name attributes when we obtained data through the questionnaire. This study only explored the characteristics and mechanisms of group activity and did not conduct a differential analysis of individual patients.
Reliability analysis evaluates the consistency and stability of the model by comparing multiple measurement results. This analysis mainly uses the Alpha analysis method and semi reliability analysis method, calculates the reliability coefficient through different methods, and then conducts a reliability analysis on the reliability coefficient. The reliability analysis method used in this article is Cronbach’s Alpha coefficient. The value of the reliability coefficient is between 0 and 1. When the coefficient is greater than 0.7, it is considered that the model has strong reliability and can be used for systematic analysis; between 0.5 and 0.7, it indicates that the reliability of the model is average. This article uses SPSS statistical analysis software for reliability analysis and uses Cronbach’s Alpha reliability coefficient to measure the intrinsic reliability of the questionnaire. The Alpha reliability coefficients of each indicator of the questionnaire are calculated separately (Table 2). From the results, the Cronbach’s Alpha values of the reliability coefficients of each factor in the survey questionnaire are all greater than 0.7, indicating that the internal structure of the survey questionnaire options is good. There is strong consistency among the questionnaire options, and using the questions in the questionnaire to measure the influencing factors of residents’ commuting behavior has good reliability.
(2)
Air quality data
With the continuous development of air quality monitoring and forecasting technologies in China, cities at all levels have established air monitoring stations for real-time monitoring of the urban AQI. This index includes six categories of pollutants: particulate matter (PM)2.5, PM10, carbon monoxide (CO), nitrogen dioxide (NO2), ozone (O3), and sulfur dioxide (SO2) (Table 3). The data used in this study were obtained from the Ministry of Ecology and Environment of China (http://www.cnemc.cn/ (accessed on 13 November 2022)). There are seven air monitoring stations in the Gaoyou urban area, located on Haichao Road, Wu’an Road, Qinyou Road, Wenyou Road, and Zhuguang Road. We continuously collected the daily average AQI and concentration data concerning the six types of pollutants for 2022. Correlation analysis revealed that the AQI had a significantly high correlation with the concentrations of the six types of pollutants. Therefore, this study used AQI values from the air monitoring stations in each area to represent the air pollution situation. According to Chinese national standards, air quality levels are divided into excellent (AQI ≤ 50), good (50 < AQI ≤ 100), minor (100 < AQI ≤ 150), mild (150 < AQI ≤ 200), moderate (200 < AQI ≤ 300), and severe pollution (AQI > 300). As shown in Table 1, the daily average AQI of Gaoyou City in 2022 was 68.82, and the single-day AQI ranged from excellent to highly polluted. Simultaneously, there was a significant difference in the AQI values at each monitoring station (F = 7.982, p = 0.000), indicating a significant difference in the air pollution levels in each area of the Gaoyou urban area.

2.2. Independent and Dependent Variables

This study used a binomial logistic regression quantitative analysis model to control for individual socioeconomic attribute variables and measure the effects of commuting patterns on resident health. The model comprised two dimensions and six indicators, with the dependent variables being physical and psychological health. Physical health factors included body mass index (BMI), sleep quality, and the number of sick days, which were used to quantify the physical health status of residents through objective data. Psychological health factors included psychological state, mental stress, and emotional state, which were quantified using self-evaluation data to measure residents’ mental states. This study obtained N types of commuting patterns through systematic clustering analysis, which served as the independent variables of the model. In addition, sex, age, education level, annual family income, nature of the work unit, housing tenure, number of cars, and other indicators were selected as control variables.
Specifically, the model classified health levels into two categories: “healthy” and “unhealthy” based on questionnaire responses. In terms of physical health, the study obtained the height and weight of the respondents based on the questionnaire survey and calculated BMI according to the formula weight (kg)/square of height (m2) to evaluate whether residents’ BMI was normal according to the range criteria of 18.5–24.0 [24]. Sleep quality was assessed using the question “How is your sleep quality?” with answers of “very poor” or “relatively poor” being considered unhealthy, while answers of “average”, “good”, or “very good” considered healthy. A taking leave frequency of “5 or more times” was considered unhealthy, while a taking leave frequency of “5 or less times” was considered healthy. This article considers taking 5 or more vacations per month as unhealthy. The main basis is the employee assessment policy documents formulated by the human resources management departments of most Chinese enterprises [25,26]. Chinese enterprises generally adopt a work and rest system of five days a week and two days off, with an effective working time of 20 days per month. If an employee takes 5 or more vacations per month, it will reduce their effective working hours by 1/4, which will seriously affect the normal production and operation of the enterprise. Enterprise managers may believe that the employee’s physical condition is insufficient for the job and thus consider the employee to be unhealthy [27].
In terms of attitude towards life, the questionnaire investigated four areas: “being able to handle problems well”, “getting along well with oneself and others around me”, “frequently participating in social and collective activities”, and “having many close friends, colleagues, or relatives”, with answers in relation to them of “sometimes”, “often”, or “always” considered healthy, while “never” or “rarely” were considered unhealthy. When two or more unhealthy options were selected, the participant was considered to have a negative attitude towards life. In stress measurement, the question set sought information on whether “I feel a lot of pressure”, with answers of “often” or “always” considered unhealthy, while answers of “never” or “rarely” were considered healthy. In measuring emotional states, the question set sought information on whether ‘I feel very relaxed”, with answers of “often” or “always’ considered healthy while answers of “never” or “rarely” were considered unhealthy.

2.3. Statistical Analyses

2.3.1. K-Means Clustering

The k-means clustering algorithm, an iterative clustering analysis algorithm that categorizes samples with similar properties into one class and samples with significant differences in properties into different classes, was used. The specific steps taken involve randomly selecting K objects as the initial clustering centers, calculating the distance between each object and the centers of each subclass, and assigning each object to the nearest clustering center. The algorithm iterates the above process repeatedly until the final clustering center no longer changes and reaches the local minimum of the sum of the squares of errors.
Z j = 1 N j i = 1 N j X i , X i S j
where Sj refers to the jth clustering class with a cluster center of Zj, and Nj refers to the jth aggregate class Sj and the number of samples included in j. This study used the K-means method to classify the commuting behaviors of residents. Specifically, samples with similar indicators, such as commuting mode, commuting time, and commuting distance, were clustered into one category, and the commuting mode of the residents was classified.

2.3.2. Standard Deviation Ellipse Analysis

Standard deviational ellipse (SDE) analysis is used to describe the directionality and range characteristics of the spatial distribution of geographical elements [27] and is mainly applied to active spatial analysis [28]. This study utilized the SDE measurement tool in ArcGIS to quantitatively analyze the spatial characteristics and differences in residents’ commuting travel under different air quality levels and to identify the spatial distribution pattern of residents’ commuting travel in air pollution environments.

2.3.3. Binomial Logistic Regression Model

Binomial logistic regression is a probabilistic nonlinear model involving a multivariate analysis method that is used to study the relationship between binary classification results and commuting patterns. Logistic regression can be used to predict the probability of occurrence of each categorical variable. This model addresses many limitations of multiple linear regression and does not assume a linear relationship between dependent and independent variables in advance, which can effectively take the problem of nonlinear effects in the model into account [29].
Binomial logistic regression analysis is mostly used in medical sociology and public health research to comprehensively evaluate the factors influencing health risks. There are two types of classification results for health prediction: healthy and unhealthy. The dependent variable Y follows a binomial distribution with values of 0 and 1. The overall probability of Y = 1 is π (Y = 1), and the m independent variables are X1, X2,…, Xm. The binomial logistic regression model was as follows:
π Y = 1 = exp β 0 + β 1 x 1 + β 2 x 2 + + β m x m 1 + exp β 0 + β 1 x 1 + β 2 x 2 + + β m x m = 1 1 + exp [ β 0 + β 1 x 1 + β 2 x 2 + + β m x m ]
where x1, x2, …, xm are the driving factors affecting health outcomes, β 0 refers to the intercept (or constant term), and β m is the regression coefficient corresponding to X m   (j = 1, 2, …, m). Positive (negative) values representing the relevant independent variable X m can increase (decrease) the occurrence rate of event i. The larger the absolute value of β m , the larger the independent variable X m effect on the occurrence rate of event i. We use the formula exp (m) to measure the index based on the natural logarithm [27]. The following formula was used in the logistic regression model. Specifically, the model substitutes the independent variable of an individual into the formula. When obtaining the estimated values of regression parameters (b0, ⋯, bj), the predicted value p ^ of the sample’s health probability. (Y = 1) can be obtained, as follows:
p ^ = exp ( b 0 + b 1 x 1 + b 2 x 2 + + b m x m ) 1 + exp ( b 0 + b 1 x 1 + b 2 x 2 + + b m x m )

3. Results

3.1. The Residents’ Main Daily Commuting Modes in Gaoyou City

This study first assessed the use of walking, cycling, and other slow commuting methods; public transportation and subways as public transportation commuting methods; taxis and private cars as motor vehicle commuting methods; and electric bicycles and motorcycles as other commuting methods. Overall, full-time employees in the study area mainly chose public transportation commuting (accounting for approximately 33.66%), followed by slow commuting (accounting for approximately 28.29%). There was a close connection between commuting distance, time, and mode. This study next comprehensively analyzed the health effects in relation to these factors using a systematic clustering analysis, focusing on four different commuting modes. Table 1 shows the characteristics of commuting distance, commuting time, and commuting mode in the four commuting modes, namely, Mode 1, Mode 2, Mode 3, and Mode 4. Mode 1 refers to short-distance slow travel, Mode 2 refers to medium-distance mixed travel (combined use of public transportation and small cars), Mode 3 refers to long-distance motor vehicle travel, and Mode 4 refers to long-distance mixed travel (combined use of public transportation and slow travel) (Table 4).

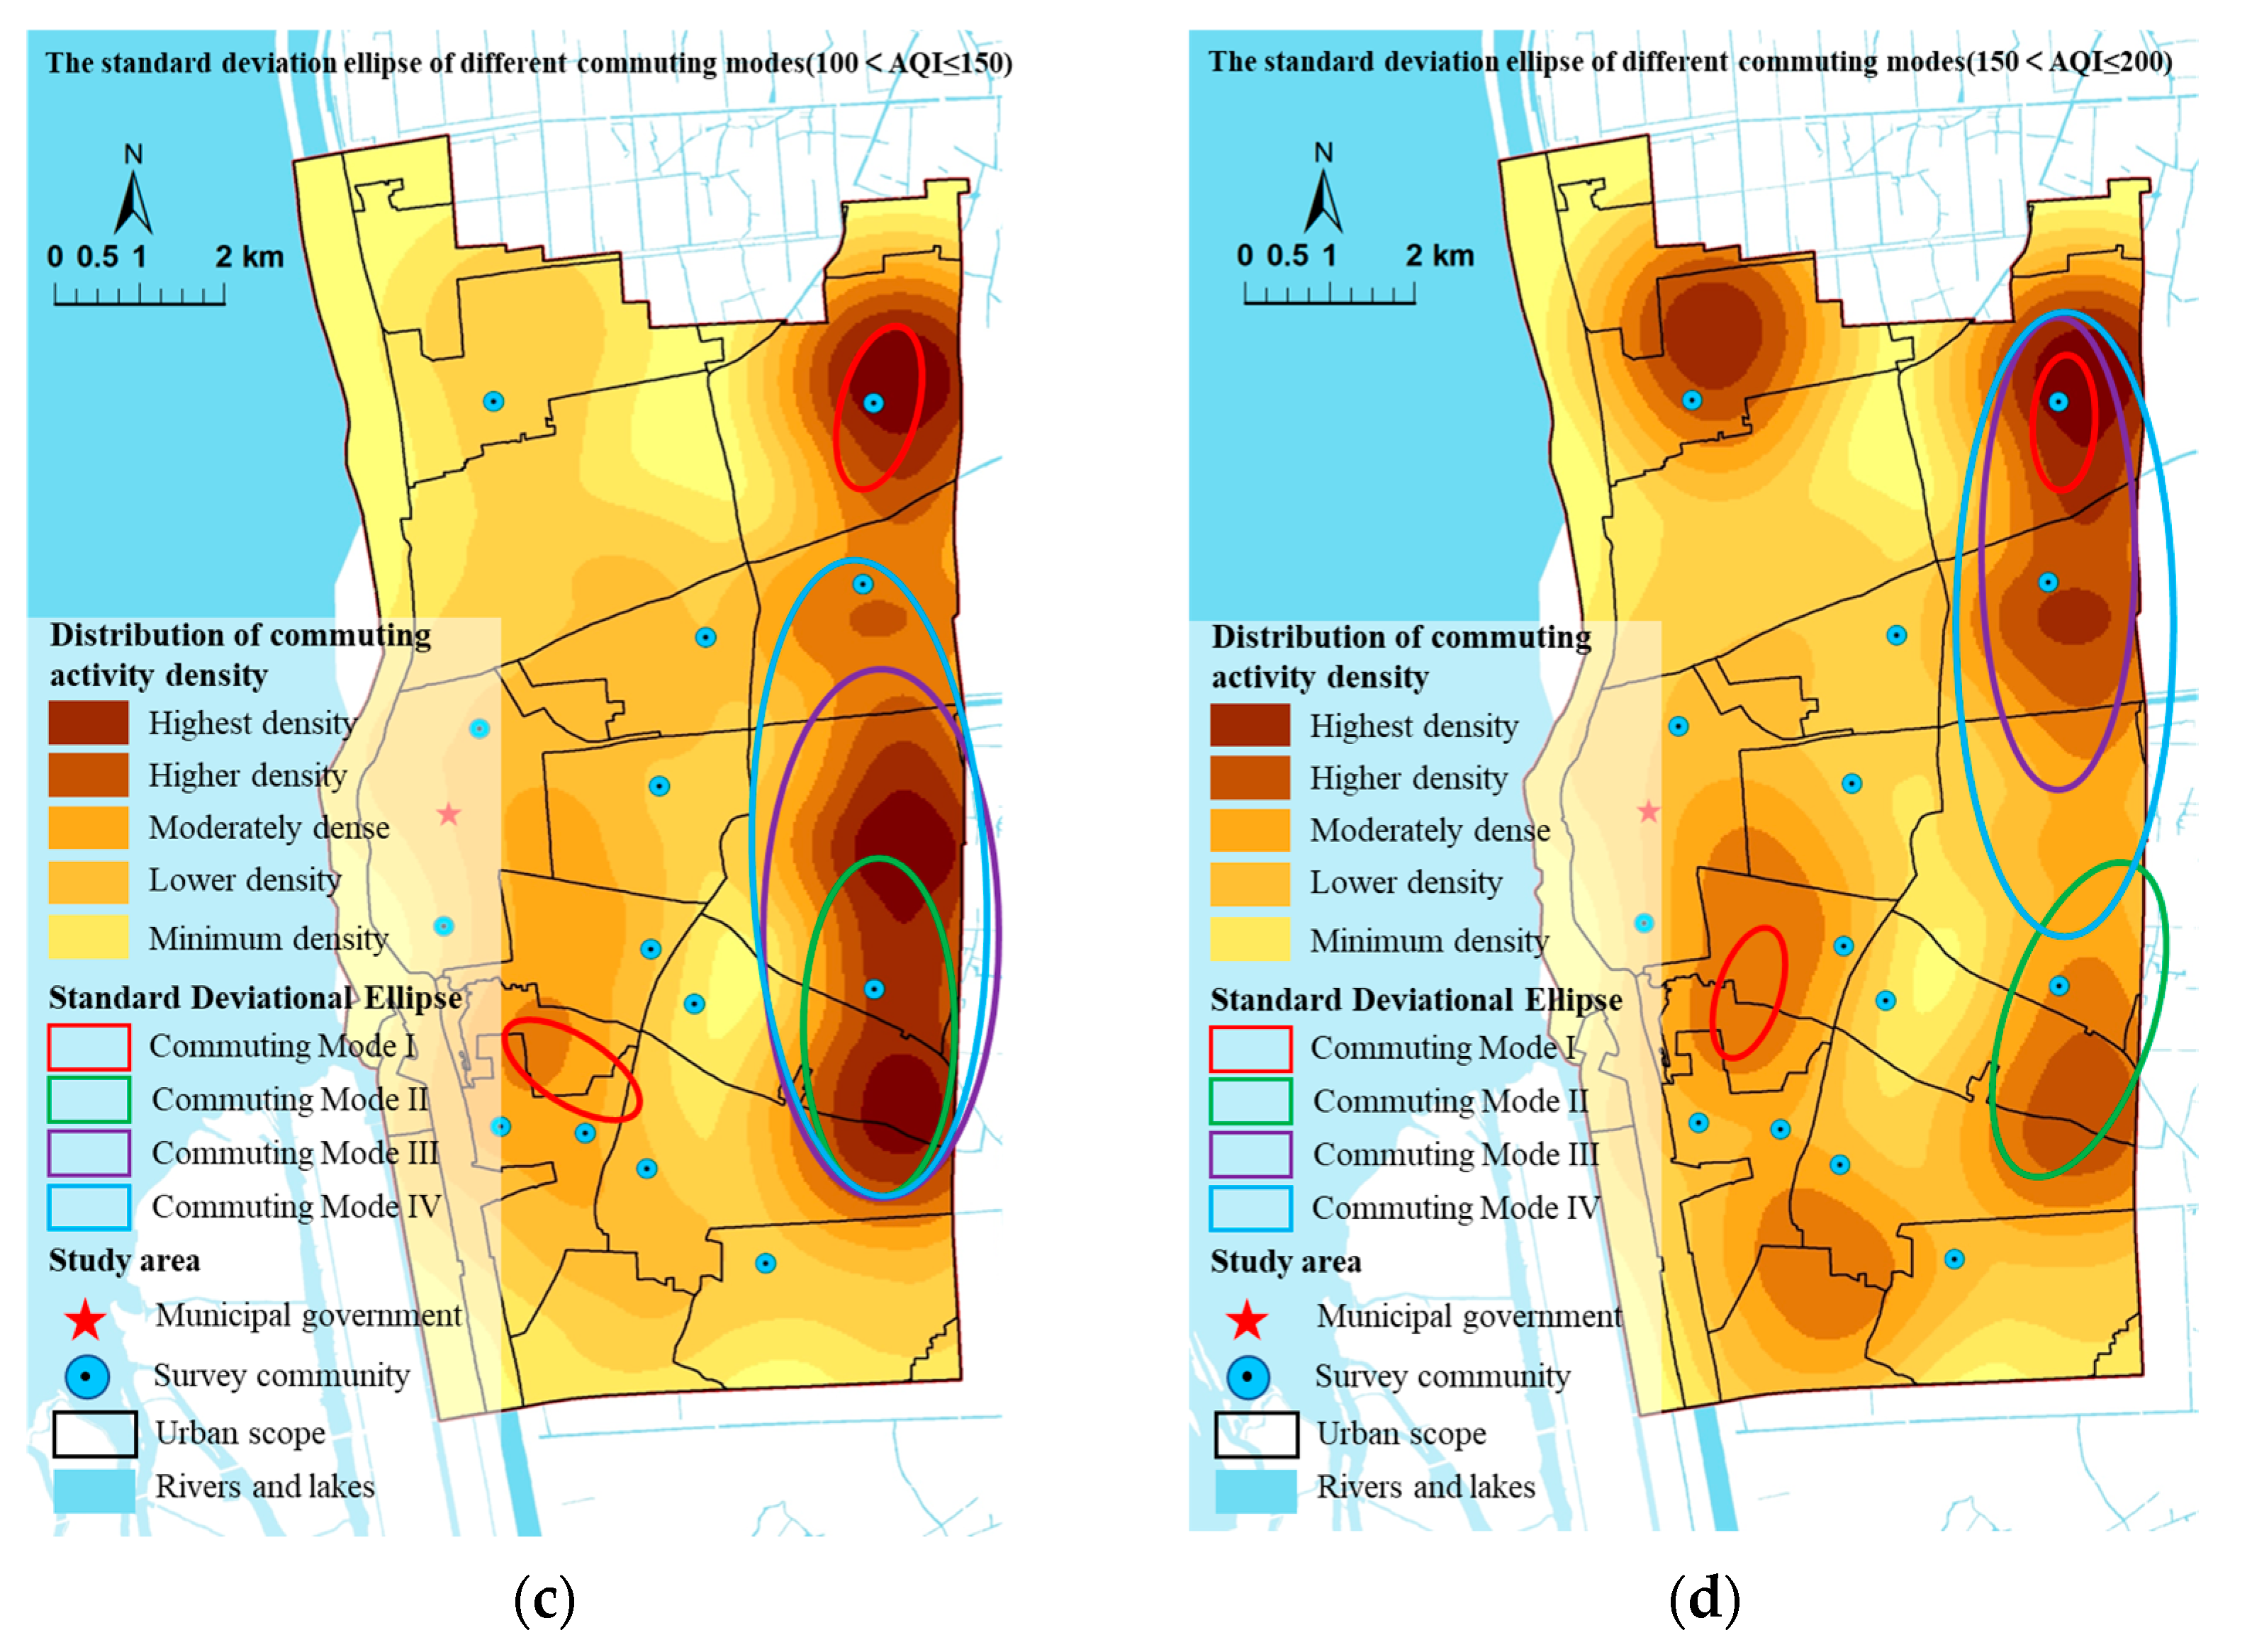
3.2. Spatial Characteristics of Commuting Behaviour under Different Air Pollution Environments

Based on the questionnaire survey data, the residential and employment addresses of the sample population were located spatially. This study used ArcGIS visualization software to perform kernel density analysis, SDE ellipse analysis, and spatial interpolation analysis of residential and employment areas to determine the commuting characteristics of the surveyed population [22,23]. The results showed that there were significant differences in the dominant direction and activity range of commuting for the same commuting mode under different degrees of air pollution (Figure 4). Concerning commuting distance, the average straight distance for short-distance commuting was 1.4 km, with a median of 0.9 km, indicating that the surveyed individuals generally had short commuting distances to cover (Table 3).
In addition, the proportion of those who engaged in long-distance commuting was not high, with 32.7% reporting commuting distances exceeding 10 km and a median commuting distance of 13.2 km. In terms of the main commuting directions, in slight air pollution environments, the long-distance commuting of residents in Gaoyou City was concentrated along both sides of the north–south expressway, while short-distance commuting areas of concentration were relatively scattered. In moderately and heavily polluted environments, the main commuting directions were concentrated in large industrial development parks in the northern part of the city as well as on both sides of the highways on the eastern side of the city, with some commuting clusters around residential areas within the city. Concerning the commuting scope, with the intensification of air pollution, the range of residents’ long-distance commuting activities significantly decreased, as did the range of short-distance slow-travel commuting. Based on the current land use in Gaoyou City, commuter travel was mostly concentrated in residential areas, industrial areas, transportation corridors, and other areas with intensive human activities. Overall, on a micro-urban spatial scale, low-visibility air pollution environments had a significantly negative impact on residents’ daily commuting behavior.

3.3. Time Characteristics of Commuting Behavior among the Residents in Different Air Pollution Environments

Overall, in terms of different air pollution environments, the commuting times of the residents could be divided into four categories: the first category was within 20 min, with an increasing trend for this category in relation to both low and moderate air pollution; the second category ranged from 20 min to 30 min, which accounted for the largest and highest proportion of commuting hours in Gaoyou City; the third category ranged from 30 min to 60 min, where the commuting time fluctuated but with an overall significant decrease as air pollution increased; and the fourth category was for 1 h or longer, with the lowest proportion of residents travelling for this time (Figure 5). In high air pollution environments, the residents tended to use motor vehicles to replace slow travel, significantly shortening the commuting time, with the proportion of short-distance travel among residents significantly increasing, while the proportion of those using long-distance travel showed a decreasing trend. In moderately polluted environments, the proportion of those with a long commute time of 20 min was the highest, whereas the proportion of those with a short commute time of 10 min was the highest.
Concerning commuting options, as air pollution worsened, the proportion of residents who chose self-driving and public transportation increased significantly. In high air pollution environments, the proportion of self-driving commuters was the highest, followed by public transportation users, slow commuters, and multimodal mixed commuters. Residents choosing faster transportation options could reach their destinations faster, reducing their exposure time to air pollution and the probability of harm, as well as being able to control their departure time more flexibly, making it easier for them to adjust their commuting behavior in response to changes in the external air environment.

3.4. The Characteristics of Residents’ Physical and Mental Health Status under Different Commuting Modes

Overall, women had a higher proportion of abnormal BMI and low emotional state variables, whereas their other health-related indicators showed better results than those of men. Among the population aged 20–65 years, there was a gradual decrease in the proportion of physical and mental health issues among residents as they aged. Those with a bachelor’s degree or above asked for sick leave more often and experienced higher psychological stress compared with those with lower educational qualifications. The proportion of participants with other unhealthy indicators was relatively low. The health statuses of residents in terms of different occupational types differed markedly, with those working in government agencies, public institutions, self-employed businesses, and freelancers having low levels of physical and mental health issues, while those working in state-owned enterprises and private enterprises had high levels. The more cars a family owned, the higher the levels of physical and mental health among the residents. In particular, the psychological stress level of residents with two or more cars was lower than that of residents without cars or with only one car, accounting for 56.5%. The physical and mental health statuses of the residents in different air pollution environments and commuting modes are shown in Table 5.

4. Discussion

4.1. The Short-Distance Slow Commuting Mode Had a Significant Positive Impact on Residents’ BMI and Sleep Quality

The correlation analysis results between different commuting modes and health indicators after controlling for socioeconomic attribute variables are presented in Table 5 and Table 6. The analysis results of some models were consistent with the conclusions of the descriptive statistical analysis presented in Table 5. First, the short-distance slow commuting mode had a significant positive impact on residents’ BMI and sleep quality. Compared with Mode 3, Mode 1 had the lowest risk of unhealthy BMI among the residents, with a significant positive correlation between the two statistical indicators. This finding accords with the results reported by Qing et al. [15]. This study examined the health effects of commuting behavior among residents, and the results showed that walking had the highest health benefits, followed by buses, subways, and private cars. In addition, middle- and long-distance commuting patterns were significantly correlated with BMI, sleep quality, psychological stress, and other indicators. Long-distance commuting also had a significant negative correlation with indicators such as residents’ attitudes towards life and emotional states. The correlations between commuting patterns and employee sick leave behavior were not significant, which may be because the effects of employee sick leave behavior are more complex and could not be captured in this model. However, the survey sample was mainly composed of middle-aged and young people who had a relatively low overall health risk. Therefore, the effects of this factor were unlikely to have been significant.
Commuting, as a daily journey between home and work, is an important factor affecting individual psychological stress, as shown by Wu Jiangjie [16], who conducted research on a national scale and found that commuting time had a significant negative impact on happiness and health. Overall, commuting was found to be closely related to the residents’ health. The effect of commuting on health includes two dimensions in temporal and spatial behavior theory. Commuting time occupies the total daily time of residents, reducing their time spent exercising and indirectly affecting their individual health. However, under different commuting modes, residents choose different modes of transportation and are exposed to different external air environments, which in turn affects individual health levels.

4.2. Long-Distance Self-Driving Commuting Had a Significant Negative Impact on Residents’ Mental Health

This study used six indicators of physical and mental health as dependent variables, with health impairment as a comparison item. The model results showed how different levels of air pollution, commuting modes, and socioeconomic backgrounds affected the health status of the residents (Table 7 and Table 8). In terms of BMI and psychological stress, the proportion of unhealthy participants increased significantly with increases in commuting distance and commuting time. The proportion of unhealthy participants in Mode 3 was relatively high, while the proportion of unhealthy participants in Mode 1 was relatively low. The results showed that the slow commuting mode increased the intensity of physical activity, and residents had a more positive perspective, thereby reducing the risk of an abnormal BMI. However, commuters in Mode 3 used buses and cars as transportation tools, and commuters sat inside these vehicles for long periods of time, resulting in less physical activity and a higher risk of an unhealthy BMI. In addition, a positive commuting mode can help guide residents to relax and look at the scenery along the way while commuting, thereby helping to relieve psychological stress.
Regarding the two indicators of negative mentality and low mood, the commuting mode showed an inverted “U” shaped relationship with health level. The probability of residents being mentally unhealthy under the conditions of Modes 1 and 2 was lower, whereas the conditions of Modes 3 and 4 corresponded to a higher probability of residents being mentally unhealthy. Additionally, there was a close correlation between sleep quality and sick leave frequency. The sleep quality of the residents under Mode 3 conditions was generally poor, and the corresponding number of sick leave requests was high. A possible reason for this is that Mode 3 mainly involves long-distance car travel, with commuters staying in their cars for extended periods. This enclosed environment may have increased residents’ mental stress. Overall, the impact mechanism of commuting modes on resident health was complex. A long commuting distance led to greater psychological stress and a worse mental state for the residents, resulting in negative health effects. However, short-distance commuting may also have resulted in poor health effects owing to changes in the commuting environment (air pollution and outdoor temperature). In addition, the health level of the residents was likely to have been influenced by various factors, such as health status, exercise habits, daily habits, dietary habits, and their type of work.

4.3. Long-Distance Commuting Had a Negative Impact on Residents’ Health under High Concentration Air Pollution

In environments with high concentrations of air pollution, the residents tended to choose a mixed travel mode, combining public transportation and slow traffic, for long-distance commuting. The residents use more physical energy when moving from their places of residence to subway/bus stations and during the transportation transfer process, which would help maintain a healthy BMI. In addition, in high air pollution environments, residents’ sleep quality, attitudes towards life, emotional state, and other factors exhibited an inverted U-shaped relationship with commuting patterns. These results indicated that commuting a moderate distance was more conducive to improving residents’ sleep quality and stabilizing their emotional and mental states, which accords with previous findings [29]. Non-motorized travel is often considered an effective way to exercise and a pleasant way to travel [30].
The residents’ socioeconomic attributes also indirectly affected their health. Those with higher levels of education had a greater probability of taking sick leave, with those having a master’s degree or above having the highest probability of taking sick leave. In contrast, those with a junior high school qualification or below had the lowest probability of taking sick leave. This may be because highly educated individuals are more likely to engage in mental labor, spend more time sitting, and have less time engaging in physical activity, with negative effects on their physical health. There was also a significant correlation between car ownership and residents’ health, with one-car owners having better health than those without cars. People who owned two or more cars had the best health status, which is consistent with the results of a previous study [31].

4.4. Short-Distance Slow Commuting Had a Significant Impact on Residents’ Mental Health under Moderate Concentration Air Pollution

In terms of mental health, especially life attitudes and psychological stress, there was also a U-shaped relationship between the commuting mode and health level (Table 7). Compared to Mode 3, Mode 1 commuters experienced less psychological stress, whereas Mode 2 commuters experienced more psychological stress. The impact of the commuting mode on residents’ mental health was not significant in moderate and low air pollution environments. This finding reflects the complex mechanisms involved in terms of what affects mental health, with commuting behavior unlikely to be an independent factor influencing the psychological state of residents. In a moderately polluted environment, the psychological stress of those in Mode 1 was less, while there was no clear significant stress in the other modes. A possible reason for this is that short commutes take less time, residents are less likely to be exposed to air pollution, and their mental states are more relaxed. This finding does not support a previous study reporting that moderate commuting is conducive to reducing residents’ psychological stress [32]. Educational background, annual family income, and housing tenure significantly affected residents’ psychological status. Among the residents, most psychological stress was reported in those qualified to at least junior high school level, followed by those with college degrees, and then by those with high school qualifications. However, there was a significant inverse relationship between annual family income levels and residents’ psychological stress. In addition, among the factors that affected residents’ emotional states, when the number of family cars was one, residents’ emotional states were worse compared with those with no or two cars or more, at a statistically significant level.
In severe pollution situations, citizens often use their own cars to commute, which can have multiple impacts on the environment. On the one hand, residents choose to drive themselves to avoid exposing themselves to polluted air environments during transportation transfers, thereby achieving the effect of protecting themselves [30]. On the other hand, excessive car travel can lead to road traffic congestion and affect travel safety. At the same time, too many cars on the road emit more exhaust gas, further exacerbating the level of air pollution [31]. This conclusion is similar to other existing research results; some scholars have paid attention to the ecological renewal of old communities and believe that reducing the concentration of air pollutants and the risk of residents’ pollution exposure can help promote residents’ physical and mental health. This study uses a computational fluid dynamics numerical simulation model to compare and analyze various spatial layout schemes, proposes spatial form optimization strategies for actively improving air environmental quality, and forms community functional layout schemes that adapt to air environmental quality [32,33].

5. Conclusions

This study examined the main patterns and health effects of commuting behavior among urban residents under different degrees of air pollution. This study used a binomial logistic regression model to examine statistical correlations between commuting patterns and various health indicators under different air pollution environments while controlling for residents’ socioeconomic attributes. The study provided corresponding explanations for the possible mechanisms of commuting behavior and the health effects on residents under different air pollution conditions.

5.1. Key Findings

The main conclusions are as follows:
(1) The daily commuting travel of the residents of Gaoyou City can be divided into four modes. Mode 1 involved short-distance slow travel, Mode 2 involved medium-distance mixed travel (combining public transportation and small car use), Mode 3 involved long-distance motor vehicle travel, and Mode 4 involved long-distance mixed travel (combining public transportation and slow travel);
(2) In air-polluted environments, residents’ commuting times were mainly concentrated within 1.5 h, with a majority taking 20 to 30 min. The proportions of those with commuting times of 40 min and 1 h were roughly equal, whereas there were very few residents with commuting times exceeding 1.5 h. Concerning commuting options, the proportion of residents choosing self-driving commuting was the highest, followed by public transportation, slow commuting, and multimodal mixed commuting in high air pollution environments;
(3) Long-distance commuting under high air pollution concentrations negatively affected the health of the residents. In high air pollution environments, residents’ sleep quality, attitudes towards life, emotional states, and other assessed factors exhibited an inverted U-shaped correlation with commuting patterns. A moderate commuting distance was more conducive to reducing the likelihood of health issues related to poor sleep quality and mental states and in stabilizing residents’ emotions and promoting their mental health. In addition, under medium-concentration air pollution conditions, short-distance slow commuting had a significantly positive effect on residents’ mental health, which is likely explained as being because short commutes take less time, residents are less likely to be exposed to air pollution, and their mental states are more relaxed.

5.2. Implications

In this study, air pollution variables were introduced into the study of behavioral geography, enriching the research results on commuting behavior in the field of behavioral geography. The study results provide a basis for relevant government departments to conduct more effective urban management and planning. First, it is necessary to optimize the urban spatial layout and ensure a balanced development of employment and housing using a sustainable development framework that is appropriately adapted to the population size and transportation capacity. Second, at the technical level, the focus needs to be on providing comprehensive support facilities across areas with differing functional requirements and improving the networking level of infrastructure and public service facilities within regions. At the same time, there needs to be a balanced allocation of employment and residential space, with transportation demands appropriately met and with regional traffic pressure alleviated, to promote efficient and orderly commuting behavior among residents.

5.3. Limitations and Future Research Directions

Owing to the complex impact of commuting patterns on health, the question remains concerning the scale at which moderate commuting behavior is more beneficial to health. This issue requires further exploration and the collection of environmental experimental data for in-depth verification. Considerable research has been conducted on commuting patterns [34], commuting differences among different groups [17,35], job residence relationships and commuting behavior [36], urban spaces [37], commuting behavior [38,39,40], and excessive commuting [41]. These studies are mostly based on questionnaire survey data such as activity logs or travel logs. Commuting distance is often measured by the straight-line distance between the home and workplace or the shortest path network distance calculated based on GIS tools rather than the actual commuting distance of residents [42,43,44]. Moreover, owing to the limitations of short-term data, in most studies, residents’ daily commuting behavior is considered fixed and undifferentiated, and few studies have explored the differences in commuting between residents on different working days. Given this situation, we intend to refine and classify the travel trajectories of residents’ commuting behavior for different population groups in subsequent studies and interpret the effects of different travel modes on residents’ physical and mental health. In addition, in the next step of research, structural equation models will be employed to identify the interrelationships and health effects of factors such as work and residence distance, commuting methods, and commuting time.

Author Contributions

Conceptualization, H.X. and Y.C.; Data curation, H.W. and Y.C.; Formal analysis, X.L.; Methodology, Y.C.; Visualization, Y.C. and S.S.; Writing—original draft, Y.C.; Writing—review & editing, H.X. All authors have read and agreed to the published version of the manuscript.

Funding

This research was funded by the Basic Research Fund of CAMS (Grant No. 2022Y023), the 333 Project of Jiangsu Province (BRA2018420), the Jiangsu Innovative and Enterpreneurial Talent Program (JSSCBS20221645, JSSCBS20220754), and the Beijing foundation of NJIAS (BJG202209).

Institutional Review Board Statement

Written informed consent has been obtained from the patient(s) to publish this paper.

Conflicts of Interest

The authors declare no conflict of interest.

References

  1. Horner, M.W. Spatial dimensions of urban commuting: A review of major issues and their implications for future geographic research. Prof. Geogr. 2004, 56, 160–173. [Google Scholar] [CrossRef]
  2. Lowe, J.C. Patterns of spatial dispersion in metropolitan commuting. Urban Geogr. 1998, 19, 232–253. [Google Scholar] [CrossRef]
  3. Sohn, J. Are commuting patterns a good indicator of urban spatial structure? J. Transp. Geogr. 2005, 13, 306–317. [Google Scholar] [CrossRef]
  4. Fagnani, J. Women’s commuting patterns in the Paris region. Tijdschr. Voor Econ. En Soc. Geogr. 1983, 74, 12–24. [Google Scholar] [CrossRef]
  5. Simoncic, V.; Pozzar, M.; Enaux, C.; Deguen, S.; Kihal-Talantikite, W. Optimization and Process Design Tools for Estimation of Weekly Exposure to Air Pollution Integrating Travel Patterns during Pregnancy. Open J. Stat. 2022, 12, 408–432. [Google Scholar] [CrossRef]
  6. Fogg-Rogers, L.; Hayes, E.; Vanherle, K.; Pápics, P.I.; Chatterton, T.; Barnes, J.; Slingerland, S.; Boushel, C.; Laggan, S.; Longhurst, J. Applying Social Learning to Climate Communications—Visualising ‘People Like Me’ in Air Pollution and Climate Change Data. Sustainability 2021, 13, 3406. [Google Scholar] [CrossRef]
  7. Fan, Y.; Palacios, J.; Arcaya, M.; Luo, R.; Zheng, S. Health perception and commuting choice: A survey experiment measuring behavioral trade-offs between physical activity benefits and pollution exposure risks. Environ. Res. Lett. 2021, 16, 054026. [Google Scholar] [CrossRef]
  8. Rafirpour, M.; Woodward, A.; Salmond, J.A.; Dirks, K.N. The Impact of Route Choice on Active Commuters’ Exposure to Air Pollution: A Systematic Review. Front. Sustain. Cities 2021, 2, 565733. [Google Scholar]
  9. Cao, X.; Mokhtarian, P.L. How do individuals adapt their personal travel? A concept exploration of the consideration of travel-related strategies. Transp. Policy 2005, 12, 199–206. [Google Scholar] [CrossRef] [Green Version]
  10. Horner, M. Extensions to the concept of excess commuting. Environ. Plan. A 2002, 34, 543–566. [Google Scholar] [CrossRef]
  11. Simonson, E.; Baker, C.; Burns, N.; Keiper, C.; Schmitt, O.H.; Stackhouse, S. Cardiovascular stress (electrocardiographic changes) produced by driving an automobile. Am. Heart J. 1968, 75, 125–135. [Google Scholar] [CrossRef] [PubMed]
  12. Kelsey, J.L.; Githens, P.B.; O’Conner, T.; Ulrich, W.; Calogero, J.A.; Holford, T.R.; White, A.A., III; Walter, S.D.; Ostfeld, A.M.; Southwick, W.O. Acute Prolapsed Lumbar Intervertebral Disc An epidemiologic study with special reference to driving automobiles and cigarette smoking. Spine 1984, 9, 608–613. [Google Scholar] [CrossRef] [PubMed]
  13. Pietri, F.; Leclerc, A.; Boitel, L.; Chastang, J.-F.; Morcet, J.-F.; Blondet, M. Low-back pain in commercial travelers. Scand. J. Work. Environ. Health 1992, 18, 52–58. [Google Scholar] [CrossRef] [PubMed] [Green Version]
  14. Lyons, G.; Chatterjee, K. A human perspective on the daily commute: Costs, benefits and trade-offs. Transp. Rev. 2008, 28, 181–198. [Google Scholar] [CrossRef] [Green Version]
  15. Fisch, T.; Forest, F.; Biener, K. Auswirkungen des Arbeitsweges auf die Gesundheit, insbesondere den Blutdruck. Soz. Prventivmedizin 1976, 21, 188–191. [Google Scholar] [CrossRef]
  16. Robinson, A.A. Cancer deaths due to all causes, its relationship with vehicle travel in Australia, Japan and European countries. Med. Hypotheses 1991, 36, 166–171. [Google Scholar] [CrossRef]
  17. Jones, P.; Clarke, M. The significance and measurement of variability in travel behavior. Transportation 1988, 15, 65–87. [Google Scholar] [CrossRef]
  18. Huff, J.O.; Hanson, S. Repetition and variability in urban travel. Geogr. Anal. 1986, 18, 97–113. [Google Scholar] [CrossRef]
  19. Pas, E.I. Intra-personal variability and model goodness-of-fit. Transp. Res. 1987, 21, 431–438. [Google Scholar]
  20. Kitamura, R.; Yamamoto, T.; Susilo, Y.O.; Axhausen, K.W. How routine is a routine? An analysis of the day-to-day variability in prism vertex location. Transp. Res. Part A Policy Pract. 2006, 40, 259–279. [Google Scholar] [CrossRef] [Green Version]
  21. Jing, Z.; Fan, Y. Study on the influencing factors of commuting well-being of metropolitan residents: A case study of Xi’an city. Urban Rural. Plan. 2017, 32, 15–25. [Google Scholar]
  22. Wu, J. Study on the Impact of Urban Commuting Time on Personal Well-Being and Health; East China Normal University: Shanghai, China, 2016. [Google Scholar]
  23. Zhao, S. CPI Analysis Based on System Clustering in SPSS; Henan Normal University: Henan, China, 2013. [Google Scholar]
  24. Yi, S.; Feng, C. Comparison of Six Common Conditional Systematic Clustering Methods. China Health Stat. 2004, 6, 19–21. [Google Scholar]
  25. Yang, C.; Chunyan, S.; Bai, Z.; Yan, L. The PM_ (2.5) control areas in China are classified based on cluster analysis. China Environ. Monit. 2017, 33, 138–145. [Google Scholar]
  26. Yang, H.; Wang, X. Research on China’s legal regulation of excessive labor under the new normal. J. Nanjing Univ. 2017, 54, 71–77. [Google Scholar]
  27. Shen, J. The Legal Structure and Genealogy of Vacation in Labor Law. Law 2021, 10, 154–166. [Google Scholar]
  28. Yu, J.Y.; He, X.H. Data Statistical Analysis and SPSS Application; People’s Posts and Telecommunications Publishing House: Beijing, China, 2003. [Google Scholar]
  29. Yu, C. SPSS and Statistical Analysis; Electronic Industry Press: Beijing, China, 2007; pp. 356–379. [Google Scholar]
  30. Song, S.; Yao, M.; Wang, Z. Study on commuting characteristics and commuting mode choice behavior of urban residents in China--Based on microscopic survey data of Tianjin City. Urban Dev. Res. 2018, 25, 115–124. [Google Scholar]
  31. Fu, T.; Zhang, Y.; Chai, Y. Study on the health impact of commuting modes of suburban residents in metropolitan cities—Taking Tiantong Garden in Beijing as an example. Prog. Geogr. Sci. 2018, 37, 547–555. [Google Scholar]
  32. Sun, B.; Yan, H.; Zhang, T. Built environmental impacts on individual mode choice and BMI: Evidence from China. J. Transp. Geogr. 2017, 63, 11–21. [Google Scholar] [CrossRef]
  33. Hansson, E.; Mattisson, K.; Björk, J.; Östergren, P.-O.; Jakobsson, K. Relationship between commuting and health outcomes in a cross-sectional population survey in southern Sweden. BMC Public Health 2011, 11, 834. [Google Scholar] [CrossRef] [Green Version]
  34. Badeenezhad, A.; Baghapour, M.A.; Sorooshian, A.; Keshavarz, M.; Azhdarpoor, A.; Goudarzi, G.; Hoseini, M. Investigating the relationship between central nervous system biomarkers and short-term exposure to PM10-bound metals during dust storms—ScienceDirect. Atmos. Pollut. Res. 2020, 11, 2022–2029. [Google Scholar] [CrossRef]
  35. Yan, W.; Li, Z.; Kan, T.; Tian, L. Ecological Renewal of Old Communities under the Guidance of Air Environment Health: Theoretical Framework and Case Practice. Urban Dev. Res. 2022, 1, 29. [Google Scholar]
  36. Xuan, Z.; Jia, X.; Hongyuan, J. Mobility or liquidity? Translation, evolution and interpretation. Tour. Trib. 2017, 32, 104–114. [Google Scholar]
  37. Shao, F.; Sui, Y.; Yu, X.; Sun, R. Spatio-temporal travel patterns of elderly people—A comparative study based on buses usage in Qingdao, China. J. Transp. Geogr. 2019, 76, 178–190. [Google Scholar] [CrossRef]
  38. Jianzhong, H.; Ruiqi, Z.; Gangyu, H. A research of the elderly’s daily life circle based on spatial-temporal behaviors—Analysis of place recognition and spatial features. Urban Plan. Forum 2019, 3, 87–95. [Google Scholar]
  39. Yanwei, C.; Chunjiang, L. Urban life cycle planning: From research to practice. City Plan. Rev. 2019, 43, 9–16. [Google Scholar]
  40. Daosheng, S.; Yanwei, C.; Yan, Z. The definition and measurement of community life circle: A case study of Qinghe area in Beijing. Urban Dev. Stud. 2016, 23, 1–9. [Google Scholar]
  41. Xiping, Y.; Zhixiang, F. Recent progress in studying human mobility and urban spatial structure based on mobile location big data. Prog. Geogr. 2018, 37, 880–889. [Google Scholar]
  42. Xiao, Q.; Feng, Z. Combination between big data and small data: New methods of urban studies in the information era. Sci. Geogr. Sin. 2017, 37, 321–330. [Google Scholar]
  43. Lee, B.S.; McDonald, J.F. Determinants of commuting time and distance for Seoul residents: The impact of family status on the commuting of women. Urban Stud. 2003, 40, 1283–1302. [Google Scholar] [CrossRef]
  44. Peng, Z.R. The jobs-housing balance and urban commuting. Urban Stud. 1997, 34, 1215–1235. [Google Scholar] [CrossRef]
Figure 1. Daily commuting activities of residents in low-visibility air pollution environments. (Picture Source: Baidu Shitu https://xsj.699pic.com/sou/xingshianquanlukuang.html (accessed on 15 June 2023)).
Atmosphere 14 01140 g001
Figure 2. The overall framework of this study.
Atmosphere 14 01140 g002
Figure 3. The study area and distribution of the surveyed communities.
Atmosphere 14 01140 g003
Figure 4. Standard deviation ellipse (SDE) features of different commuting modes under different air quality index (AQI) levels (i.e., (a) AQI ≤ 50, (b) 50 < AQI ≤ 100, (c) 100 < AQI ≤ 150, and (d) 150 < AQI ≤ 200) in Gaoyou City.
Atmosphere 14 01140 g004aAtmosphere 14 01140 g004b
Figure 5. The proportion of commuting time (a) and commuting mode selection (b) in different air pollution environments.
Atmosphere 14 01140 g005
Table 1. Descriptive statistics of study sample (N = 685).
ItemCountProportionItemCountProportionItemCountProportion
GenderMarital statusBody mass index
Male37144.2Unmarried12117.6Normal39958.2
Female38255.8Married56482.4Overweight22933.5
Obesity578.4
AgeFamily SizeSelf-rating physical health
20–3042762.3<337855.3Very good7811.4
31–4016123.53~522933.5Good29342.8
41–50517.4>57811.2Normal17525.6
51–65335.1 Not good13920.3
>65141.7
Education levelAnnual family incomeSelf-rating mental health
Primary school and below10315.14≤100,000426.2Very good497.2
Junior high school33448.71100,000–150,00016023.4Good21631.5
High school10715.61150,000–300,00038556.2Normal25637.4
Bachelor’s degree and above14120.55>300,0009814.2Not good16423.9
Note: The proportion unit is %.
Table 2. Reliability analysis of the influencing factors of commuting behavior among residents.
FactorCorbach’s Alpha ValueStandardized Corbach’s Alpha Value
Age0.88210.9014
Gender0.87450.8901
Education level0.78920.8191
Annual household income0.72330.7912
Occupation0.75630.7244
Car ownership0.81350.8227
Table 3. Air quality index (AQI) statistics and sub-indicators.
Variable (Unit)Basic DefinitionMean/DayVarianceMinimumMax
AQI (Value)Single-day AQI68.8228.5820.08167.92
PM2.5 (μg/m3)Particle index with aerodynamic equivalent diameter less than or equal to 2.5 μm in the atmosphere76.1323.2523.71103.21
PM10 (μg/m3)Particle index with aerodynamic equivalent diameter less than or equal to 10 μm in the atmosphere83.2721.0733.91112.13
CO (mg/m3)Carbon monoxide concentration index in the atmosphere4.820.153.154.97
NO2 (μg/m3)Nitrogen dioxide concentration index in the atmosphere37.219.3729.1848.27
O3 (μg/m3)Ozone concentration index in the atmosphere74.2325.4341.7292.18
SO2 (mg/m3)Sulfur dioxide concentration index in the atmosphere85.1719.1867.19103.94
Table 4. The main classification features of different commuting modes.
Commuting ModeMode 1Mode 2Mode 3Mode 4
Commuting distance/kmMean value1.4 4.2 14.1 15.8
Median0.9 3.8 13.0 13.5
Standard deviation1.3 2.2 7.5 6.6
Commuting time/minMean value7.9 19.6 44.7 28.8
Median10.0 20.0 40.0 23.0
Standard deviation2.5 6.2 11.5 16.1
Transportation vehicles (proportion)/%Walking or cycling58.3 17.9 3.7 28.4
Public transportation4.2 42.3 61.1 33.8
Car15.3 15.4 31.5 19.6
Other modes22.2 24.4 3.7 18.1
Number of samples/17215613278
Table 5. The commuting modes and health effects among residents under different air pollution environments.
Each Categorical VariablePhysical Health LevelMental Health Level
Low Body Mass Index (Proportion%)Poor Sleep Quality (Proportion%)Frequent Sick Leave (Proportion%)Negative Attitude (Proportion%)Major Psychological Pressure (Proportion%)Depression (Proportion%)
Analysis variables
Commuting modeMode 143.27.61115.333.913.6
Mode 23713.71117.843.817.8
Mode 326.58.88.88.835.311.8
Mode 412.57.23.314.224.87.9
Control variables
Air pollution environment (AQI)AQI ≤ 508.56.75.910.29.310.5
50 < AQI ≤ 1009.28.39.615.314.516.3
100 < AQI ≤ 15023.317.219.619.218.619.8
150 < AQI ≤ 2006.25.74.38.27.97.3
GenderMale44.88.89.614.435.215.2
Female29.610.211.115.738.913
Age≤2018.29.118.29.145.518.2
20–3531.51311.115.741.715.7
35–5053.17.48.614.835.813.6
50–6523.33.31013.3206.7
>6566.70033.333.333.3
EducationJunior high school and below30.44.326.18.717.40
High school29.511.58.28.237.714.8
College degrees45.39.48.522.234.217.1
Master’s degree or above31.39.49.46.359.412.5
Annual household income≤100,00041.25.99.49.423.58.2
100,000–150,00028.3101016.741.715
150,000–300,0003711.114.822.23720.4
>300,00043.5138.717.452.217.4
EmploymentGovernment agencies and institutions48.13.703.7377.4
State-owned enterprises53.803.823.142.319.2
Private enterprise32.213.89.218.435.619.5
Freelancer55.65.65.216.75.13.1
Number of family carsNone40.712.8717.433.718.6
136.35.610.511.335.511.3
≥234.817.421.726.156.513.2
Table 6. Correlation analysis between different commuting modes and health indicators.
Body Mass IndexSleep QualitySick Leave FrequencyLife AttitudePsychological StressEmotional State
Mode 1Pearson correlation0.8190.719−0.406−0.237−0.3060.3165
Significance
(Double tailed)
0.116 **0.111 **0.9430.0670.9340.027 *
Covariance0.9600.585−0.012−0.6890.0491.140
Mode 2Pearson correlation0.7540.662−0.552−0.6250.4270.636
Significance
(Double tailed)
0.477 *0.411 **0.5040.0940.717 *0.068 ***
Covariance0.0500.035−0.013−0.0730.0250.110
Mode 3Pearson correlation−0.1240.1120.105−0.0020.091−0.025
Significance
(Double tailed)
0.858 **0.1400.1810.9780.231 *0.740
Covariance−0.0570.2600.120−0.0050.367−0.092
Mode 4Pearson correlation−0.2070.1340.131−0.0320.082−0.031
Significance
(Double tailed)
0.782 *0.1290.1260.849 *0.2540.731 *
Covariance−0.0670.2730.157−0.0270.356−0.108
Note: *, **, and *** represent p = 0.1, p = 0.05, and p = 0.001, respectively.
Table 7. Regression model concerning the effect of commuting mode on physiological health.
Influence FactorAbnormal Body Mass Index Poor Sleep QualityHigh Frequency of Sick Leave
Sig.Exp(B)Sig.Exp(B)Sig.Exp(B)
Commuting mode (comparison: Mode 4)0.609/0.911/0.193/
Mode 10.434 **1.4640.866 *0.8720.088 *0.177
Mode 20.899 *0.9490.850 *1.1580.401 **0.445
Mode 30.6890.7630.8271.0920.3590.482
Air pollution level (comparison: 150 < AQI ≤ 200)0.726/0.927/0.932/
AQI≤500.9860.9810.9230.0000.9820.000
50 < AQI ≤ 1000.801 *1.2850.976 *0.0000.968 **0.000
100 < AQI ≤ 1500.659 **0.6490.9990.0000.9990.000
Gender (comparison: female)0.056/0.532/0.858/
Male0.2900.9790.3811.0280.1751.049
Education background (comparison: Master’s degree or above)0.195/0.801/0.060/
Primary school and below0.918 *0.9110.6072.2270.735 *0.609
Junior high school0.837 **1.1560.834 *1.2471.2423.330
High school0.1780.4650.432 *2.0140.1374.557
Annual household income (comparison: over 300,000 yuan)0.793/0.729 /0.954/
Below 100,0000.9990.0000.932 *0.0320.827 *0.788
100,000–150,000 0.9990.0000.927 **0.0540.795 ***0.766
150,000–300,0000.9990.0000.9080.0180.5941.779
Employment (comparison: Freelancer)0.324/0.866/0.913/
Government agencies and institutions0.207 ***0.2070.926 *0.0001.0002.619
State-owned enterprises0.447 *0.3791.0000.3280.9990.000
Private enterprise0.633 *0.5300.9990.0000.9990.000
Number of family cars (comparison: 2 or more)0.635/0.170/0.049/
None0.496 *0.6350.220 *3.0100.02610.110
10.3470.5550.0615.2110.01710.267
Marital status (comparison: unmarried)0.971/0.841/0.333/
Married0.623 *0.5660.9990.0000.9990.000
Constant0.9993.797 × 1080.9984.902 × 1020.9981.371 × 102
Number of samples472398396
Log-likelihood236.670103.52587.087
Cox & Snell R20.1290.1250.193
Nagelkerke R20.1780.2650.408
Note: *, **, and *** represent p = 0.1, p = 0.05, and p = 0.001, respectively; AQI, air quality index.
Table 8. Regression model concerning the effect of commuting mode on mental health.
Influence FactorNegative AttitudePsychological StressDepression
Sig.Exp(B)Sig.Exp(B)Sig.Exp(B)
Commuting mode (comparison: Mode 4)0.743 /0.823 /0.673 /
Mode 10.591 *0.675 0.610 **0.784 0.568 0.648
Mode 20.443 *0.607 0.980 1.011 0.375 * 0.547
Mode 30.503 *0.683 0.611 * 0.497 0.329 0.026
Air pollution level (comparison: 150 < AQI ≤ 200)0.877 / 0.512 /0.802 /
AQI≤500.766 1.600 0.153 **4.297 0.779 *1.524
50 < AQI ≤ 1000.499 0.379 0.426 * 2.140 0.534 2.568
100 < AQI ≤ 1500.796 0.687 0.569 1.728 0.714 1.750
Gender (comparison: female)0.708 /0.671 /0.344 /
Male0.596 * 0.984 0.393 0.983 0.651 0.986
Education background (comparison: Master’s degree or above)0.747 /0.153 /0.763 /
Primary school and below0.602 *2.075 0.051 6.475 0.998 1.014 × 10⁸
Junior high school0.398 2.454 0.254 ** 2.172 0.635 **0.626
High school0.883 1.132 0.070 2.725 0.777 1.267
Annual household income (comparison: over 300,000 yuan)0.518 /0.145 /0.810 /
Below 100,0000.363 5.294 0.070 7.503 0.412 3.924
100,000–150,000 0.967 1.065 0.166 4.053 0.306 4.931
150,000–300,0000.652 2.086 0.805 1.293 0.331 5.047
Employment (comparison: Freelancer)0.594 /0.481 /0.497 /
Government agencies and institutions0.319 0.000 0.253 ** 3.017 0.774 1.558
State-owned enterprises0.293 ***0.000 0.303 * 1.682 0.482 3.373
Private enterprise0.237 0.000 0.616 1.662 0.610 * 0.475
Number of family cars (comparison: 2 or more)0.369 /0.646 /0.491 /
None0.833 0.836 0.552 ** 1.465 0.245 0.283
10.447 * 1.850 0.985 1.011 0.387 * 0.410
Marital status (comparison: unmarried)0.578 /0.033 /0.877 /
Married0.162 9.055 0.685 0.583 0.269 0.000
Constant0.999 0.797 × 1060.712 0.511 × 1080.999 1.481 × 10⁹
Number of samples424379433
Log-likelihood127.480237.325125.970
Cox & snell R20.0950.1580.119
Nagelkerke R20.1840.2140.226
Note: *, **, and *** represent p = 0.1, p = 0.05, and p = 0.001, respectively; AQI, air quality index.
Disclaimer/Publisher’s Note: The statements, opinions and data contained in all publications are solely those of the individual author(s) and contributor(s) and not of MDPI and/or the editor(s). MDPI and/or the editor(s) disclaim responsibility for any injury to people or property resulting from any ideas, methods, instructions or products referred to in the content.

