Abstract
Animal supplementation during the background phase may increase greenhouse gas emissions (GHG). The inclusion of tannins in the diet of Nellore bulls can mitigate nitrous oxide (N2O), methane (CH4), and ammonia (NH3) production. The objective of this study was to quantify the effect of energy supplementation associated with sources of tannins in the diet of young Nellore bulls backgrounded in pastures with N2O, CH4, and NH3 emissions. Two experiments were conducted in a completely randomized design. The treatments were three supplementation strategies: (1) soybean hulls 0.3% of body weight (BW), (2) sorghum grain 0.3% of the BW, and (3) peanut peel 0.3% of BW, the last two being sources of tannin. The static closed chambers method was used to quantify N2O and CH4 emissions and the semi-open chamber technique to estimate NH3 volatilization. Supplementation strategies did not affect the N2O emissions (p = 0.9116). The soil water-filled pore space explained the variation in the N2O fluxes (p = 0.0071). The treatments did not change the total CH4 emissions (p = 0.3599), and no explanatory variable was correlated with the CH4 fluxes. The NH3 volatilization did not vary according to the supplements or tannin inclusion (p = 0.5170). However, the type of excreta affected the NH3 volatilization (p < 0.0001). Ammonia volatilization averaged 14.05, 4.16, and 2.25% of the applied N for urine, urine + dung, and dung, respectively. The energetic supplementation of Nellore bulls containing sources of tannins in the evaluated dosages was not a mitigation strategy for the emissions of N2O, CH4, and NH3.
1. Introduction
Bovine protein is an important source of nutrients for the increasing human population. However, to produce meat, greenhouse gas emissions are emitted, such as nitrous oxide (N2O) and methane (CH4) [1]. To mitigate greenhouse gas emissions (GHG), the adoption of strategies such as fertilization, pasture management, and animal supplementation with feeds that do not compete with human feed can increase animal production and improve forage usage efficiency, reducing environmental impacts [2].
During the digestion of the forage in the rumen, microorganisms hydrolyze the starch and polysaccharides of the plant cell wall, producing sugars and volatile fatty acids (VFAs) such as acetate, propionate, butyrate, CO2, and hydrogen (H2). Sugars and proteins are fermented and converted to VFAs, ammonia (NH3), H2, and carbon dioxide (CO2). During the feed fermentation, the methanogenic Archaea present in the rumen uses H2 to reduce CO2 to CH4 [3].
Methane has a global warming potential 28 times greater than CO2 [4] and, in livestock systems, is produced mainly by enteric fermentation through eructation and excreta. CH4 is the second-largest GHG contributor to global warming [5,6]. After the excretion of dung, CH4 continues to be produced by the anaerobic activities of the methanogenic Archaea present in the dung. The magnitude of CH4 production is driven by factors such as moisture, temperature, and soil compaction. They control the ability of Archeas to use carbohydrates, H2, and CO2 for CH4 production [6].
According to the IPCC [4], N2O has a global warming power 265 times greater than CO2 in the 100-year horizon and can be emitted from nitrogen fertilizer sources and animal excreta. Nitrous oxide production from animal excreta occurs due to microbial activities during the nitrification and denitrification processes in the soil, primarily driven by the amount of N content in the excreta [7]. Cardoso et al. [2] reported that, with increased grazing intensity, N2O emissions also increase due to the rise of N being returned to the soil through the excreta (mainly from urine). In addition, variables such as soil temperature and moisture drive the N2O production process [8].
Nitrification is a microbial process that oxidizes ammonia (NH3) to nitrate, while denitrification is an anaerobic process that reduces nitrate to gaseous dinitrogen (N2) [9,10]. Butterbach-Bahl et al. [11] stated that N2O produced from the nitrification process can be used in denitrification or diffused in the next soil layer before being released into the atmosphere, which may decrease the N2O emissions.
The “hole in the pipe” model describes all the phases and key drives variables that regulate the nitrification and denitrification processes to produce N2O. The amount of N2O produced is regulated by the N availability, while the soil moisture and temperature drive the microorganism activity [12,13]. The lack of synchronism between N and energy in the ruminant diet may lead to increases in N-ammoniacal production and its excretion via urine, which increases N availability in the soil pasture to be lost as N2O [7,10,14].
According to Carvalho et al. [10], volatilization is the loss of soil N in the form of NH3; it comes from fertilization with nitrogen fertilizers and N mineralization of animal excreta. NH3 will be volatilized directly into the atmosphere from ammonium (NH4+). Supplementation of the diet of animals can improve the utilization of forage and the efficiency of nutrient use and reduce the production of NH3 and CH4. For example, Ferrari et al. [15] found CH4 emissions around 33% lower than the IPCC emission factor for young Nellore bulls backgrounded in Marandu palisade grass pastures submitted to continuous stocking management and variable stocking rates to maintain a 25 to 30 cm pasture height and supplemented with energy supplements.
Increases in the green leaves proportion in the forage sward and high soluble protein levels in the forage have been found in Marandu pastures managed with variable stocking rates at a pasture height target of 25 cm, 50% grazing efficiency, and 150 kg N applied during the growing season [16,17]. Therefore, these higher levels of soluble protein may lead to increases in N losses through volatilization and N2O emissions in pastures. One option to address this environmental impact is supplementation with supplements that increase the efficiency of N usage by the animals. Animal supplementations have been shown to affect feed digestibility and N metabolism in the animal, providing a better ruminal fermentation and absorption of nutrients such as nitrogen (N), thus reducing emissions from animal excreta [10,18,19].
Supplements that are a source of energy (e.g., corn) increase the energy in the rumen for the growth of the microbial population, leading to an increase in the use of ammoniacal nitrogen and thus decreasing the concentration of nitrogen in the blood, consequently reducing N excretions in urine and the emissions of N2O and CH4 [3,14]. Furthermore, the efficiency of microbial protein synthesis increases. Hence, the soluble protein of pastures associated with energetic supplementation provides the substrate for protein synthesis, improving the efficiency of use by microorganisms and the performance of the animal [15].
Ammonia volatilization occurs from nitrogen fertilization and the excretion of dung and urine in the soil. N volatilization is the primary source of N loss to the environment when not used by the ecosystem (soil, plant, and animal) [14]. The type of nitrogen fertilizer; animal excreta; and variables such as the temperature, precipitation, soil temperature, moisture, nitrification, and pH influence the volatilization [13].
Energy supplementation can increase the metabolizable energy in the rumen and substrate for the consumption of microorganisms that promote microbiota growth associated with condensed tannins and increase the flux of metabolizable protein from feed, improving the nutritional profile, energy balance, and animal performance [14]. Tannins form complexes with proteins through hydrogen bonds in the rumen. The potential to form this complex is affected by the proline content, protein’s isoelectric point, pH, ionic strength, and solution composition [20].
Studies have suggested that providing diets containing tannins to ruminants can reduce protein degradation in the rumen, improving the efficiency of N use and thereby reducing N excretions via urine, reducing the production of CH4 and ammonia concentration in the rumen and potentiating animal weight gain [21,22,23]. The tannin–protein complex becomes resistant to the action of microorganisms, which reduces the degradation of protein in ammoniacal nitrogen and changes the N excretion route, reducing N in urine and increasing excretion via dung, leading to a reduction in the N2O production. Tannins can also bind to starches but do not have the same affinity as the complex formed with proteins [3,24].
Using tannin extracts or feed that has tannins may alter the excretion pathways of N and binding proteins and reduce the ruminal protein degradation [19,25]. In addition, tannins act on ruminal microorganisms, reducing bacterial hydrolytic activities, which may decrease N excretion via urine and can be an alternative to reduce N2O emissions. Still, this hypothesis requires further studies [3,19,26].
Gemeda and Hassen [27] conducted studies on the effect of condensed tannins on CH4 production. They identified that this compound reduces the production of H2, inhibiting the activity of the population of methanogenic Archaea. Furthermore, as Aboagye and Beauchemin [28] reported, tannins affect the population of methanogenic microorganisms acting on fibrinolytic bacteria, reducing the degradation of the fibrous fraction and acting as a sink for H2, thus reducing the production of CH4.
The influence of tannins on the efficiency of N use and GHG emission by ruminants, direct or indirect, in tropical areas still needs to be addressed [29,30]. Thus, we hypothesized that supplementations with different energy sources associated with tannin will reduce excretions of N through excreta, mitigate N2O and CH4 emissions, and reduce the volatilization of NH3 from urine when compared with supplementation without a tannin source.
Therefore, we aimed to quantify the emissions and possible forms of mitigation of N2O, CH4, and NH3 from young Nellore bulls supplemented with energy sources associated or not with sources of condensed tannin (soybean hull, sorghum grain, and peanut skin) and, moreover, to identify the key variables affecting the CH4 and N2O flux from soil (ammonium, nitrate, moisture, and temperature) and climatic variables (precipitation and air temperature).
2. Materials and Methods
2.1. The Experimental Site
This study was carried out in the Forage sector of the State University of São Paulo (Unesp), Jaboticabal Campus, located at 21°13′ S and 48°17′ W at 595 m altitude, with an average annual precipitation of 1424 mm and an average yearly temperature of 22.3 °C. The rainy season is distributed from September to April, and the dry season occurs from May to August.
The experiment was conducted in a pasture of Urochloa brizantha cv. Marandu (syn. Brachiaria brizantha cv. Marandu), which was established in 2001. Eighteen paddocks (1 ha each) were used. The paddocks were equipped with feeders to offer supplements to the animals and drinkers. The soil of the studies was classified as Red Latosol or Ferralsol (word reference base for soil classification), with a clayey texture in the surface layer (0–20 cm) [31].
The length of the experiments was 127 days (background phase), from 22 December 2020 to 27 April 2021. In the beginning, in December 2020, soil samples were collected at a depth of 0–20 cm with soil probes for the subsequent chemical analysis (Table 1). From the soil test results, maintenance fertilization was applied as 60 kg of potassium and 80 kg of phosphorus per hectare, according to the recommendations of Bulletin 100 (Sao Paulo State Official Fertilization Guide) [32]. N fertilization was split into 3 applications at the beginning of December, the end of January, and the beginning of March, using 50 kg of N per application in the form of urea.

Table 1.
Soil chemical analysis (0.0–0.20 m depth) according to the treatments.
Nellore bulls, with an initial average weight of 240 kg, were supplemented with energy supplementation at 0.3% body weight, and the average stocking rate among the treatments was 5.8 AU/ha (1 AU = 450 kg BW) [33]. Pasture management was carried out in a continuous stocking system with variable stocking rates using the “put-and-take” method [34]. The management target was to keep the pasture height at 25 ± 5 cm [35,36,37].
The meteorological data observed during the experiment were obtained from the database of the Agrometeorological Station of the Department of Exact Sciences of Unesp, Jaboticabal Campus, located 700 m from the sampling area. The analyses of greenhouse gases and total N were made at the LANA (Animal Nutrition Laboratory) and Forage Laboratory, located at the same university.
2.2. Treatments and Pasture Management
The first experiment was conducted in a completely randomized design to evaluate the greenhouse gas emissions. The treatments were (1) energy supplementation with soybean hull at 0.3% body weight (BW) without a tannin source; (2) energy supplementation with 0.3% BW sorghum grain, around 3% tannin; and (3) energy supplementation with peanut skin 0.3% of BW, around 6% tannin. Six replicates were used in each paddock, three paddocks were used per treatment, and the supplementation was provided daily in the feeder.
The chemical composition of Marandu palisade grass in a companion study is shown in Table 2 [33]. The chemical composition of the ingredients of the supplements used in this study is presented in Table 2.
Table 2.
Chemical composition of the diet (forage + energy supplements) provided to Nellore bulls (% of DM).
The tannins in the supplements were determined by the Folin–Denis reaction in spectrophotometry from the extract made with supplements and distilled water samples (Table 3). The composition of the Folin–Denis reagent was sodium tungstate, phosphomolybdic acid, and phosphoric acid 85%. After the reaction with saturated sodium carbonate solution, a 760 nm spectrophotometry was performed [38].
Table 3.
Tannins concentration of the supplements used in each treatment from the Folin–Denis reaction.
After 15 days of adaptation to the energy supplements, fresh dung and urine were collected from approximately 15 Nellore bulls (an average of 5 animals for each treatment). The animals were contained in a corral with a containment trunk under circular management to collect urine and dung immediately after excretion. The excreta were stored frozen in freezers, homogenized, and later applied [30].
The dung samples were dried in an oven at 105 °C to determine the dry matter contents [39], and the dung was then grounded in a Willey mill to continue the analyses. The total N of the dung and urine samples and dung carbon content was determined by dry combustion in a LECO CR-412 analyzer [40]. Nitrate (NO3−) and ammonium (NH4+) analyses of the urine samples were performed separately using the same soil analysis methodology. The results of the chemical analyses of the excreta are presented in Table 4.
Table 4.
Chemical composition of dung collected from Nellore bulls according to treatment used for the quantification greenhouse gas emissions and ammonia volatilization.
2.3. Experiment 1—Quantification of N2O and CH4 Emissions
The experiment was divided into three phases for gas collection to ensure the occurrence of dung and urine excretion at least once in each experimental unit (static chamber, distributed six units per paddock). The CH4 and N2O emissions evaluations began on 22 December 2020; the first excreta application occurred on 30 January 2021 and the second on 15 March 2021. Six chambers were used in each experimental paddock to guarantee the maximum representativeness of the paddock and random distribution of the experimental units. Two were arranged close to the feeders, two centrally, and another two randomly. This strategy was used to better determine the results according to soil topography. Furthermore, this distribution was chosen to ensure the three main areas within a grazing area.
In the first phase, gas sampling occurred for 40 days, and there was no added dung and urine in the chambers, and the collections occurred once a week. The second phase started after the first application of excreta. It lasted 44 days, and the samplings occurred on days 1, 3, 5, and 7 after the excreta application and then once a week until the next application. In the chambers located in the central region and on the sides of the paddock, 1.5 kg of dung was added in one chamber and 1.5 L of urine in another chamber. In the chambers allocated near the feeder, the two excreta (1.5 kg of fresh dung + 1.5 L of urine) were added to better represent the behavior of the excretions of the animals raised in the pasture [37]. The third phase also lasted 44 days, and new applications of bovine excreta were performed. As a result, the chambers that previously received dung had added urine and vice versa.
Greenhouse gas samplings were performed from 9 a.m. to 10 a.m. during the last two periods [41,42,43]. The N2O and CH4 fluxes were quantified using standardized static closed chambers [30] composed of a metal base and upper part with rectangular shapes inserted 7 cm deep in the soil 15 days before the first collection. The upper part was composed of a plastic container 30 cm high. The metal base was 28 cm in diameter, coated with a thermal insulator, and was positioned on top of the base only at the time of gas collection.
Gas samples were collected with sterile 50 mL polypropylene syringes and stored in vials (Shimadzu vials), with 20 mL sealed, and evacuated at −800 Pa. Samples were collected at 0, 20, and 40 min after chamber closure. The concentrations were quantified by gas chromatography (Shimadzu Green House Gas Analyzer GC-2014; Kyoto, Japan) and calibrated for N2O reading with the injector at 250 °C, column at 80 °C, using N2 as the carrier gas (30 mL min−1), and an electric capture detector at 325 °C. For CH4, H2 was used as a carrier gas (30 mL min−1) flame ionization detector at 280 °C. During gas collection, the temperatures inside and outside the chamber were measured with digital thermometers.
The fluxes of N2O (N-N2O in μg N-N2O m−2 h−1) and CH4 (C-CH4 in μg m−2 CH4 h−1) were corrected for the NTPs (Normal Temperature and Pressure Conditions) and calculated according to changes in the gas concentration inside the chamber during the incubation period, according to the following equation:
where δgas is the increase in gas concentration during the incubation period (L−1 μL), δT is the incubation period (h), M is the molar mass of the gas in N or C, Vm is the molecular volume corrected by temperature and pressure at the sampling time (L mol−1), V is the volume of the camera (m3), and A is the area that the chamber covers (m2).
Gas flux = δgas/δT × M/Vm × V/A
The observed values were multiplied by 24, making it possible to determine the daily emissions since the day has 24 h, and integrated by interpolation, thus calculating the cumulative emission. The calculations included negative fluxes to avoid sampling bias in the results [44].
In January 2021, samples of 10 cm in diameter and 5 cm in height were collected to determine the soil density. Soil samples were collected near the chambers 0 to 10 cm in depth for the moisture analysis, NO3− and NH4+. Approximately 10 g of soil was dried at 105 °C for 48 h to determine the moisture by the gravimetric method. From the gravimetric method, the volumetric humidity of the samples and the water-filled pore space (% WFPS) were determined using the soil density and particle density (2.65 g cm−3).
To quantify NO3− and NH4+, 10 g of fresh soil was mixed at 50 mL 2 M KCl, stirred for 40 min at 240 rpm (rotations per minute), and filtered. The filtered solution was frozen until the N-nitrate (plus N-nitrite) and N-ammonium were determined. To determine the ammonium (NH4+) and nitrate (NO3−), the Berthelot reaction [41] and reduction by vanadium chloride-III [42] were used, respectively.
Climatic variables such as precipitation and the minimum, average, and maximum air temperature were collected from an agrometeorological station installed near the experimental area (approximately 700 m). At the time of sampling, the soil temperature was evaluated using digital thermometers.
2.4. Experiment 2—Ammonia Volatilization Assessment
Simultaneously, a second experiment was conducted in an isolated area accessed by the animals. In this second experiment, the N losses in NH3 were evaluated by applying animal dung and urine according to the supplementation sources. The experimental design was a randomized block. The treatments were arranged into 2 factors: (1) type of excreta (dung and urine) and (2) type of supplementation (sorghum, soybean hulls, or corn) and treatment to evaluate background NH3 emissions without excretion application.
Semi-open chambers were introduced in a place with the same characteristics as the paddocks of the experiment; however, there was no grazing. After applying bovine excreta, NH3 samplings were performed at 5 p.m. on the first, third, fifth, ninth, fourteenth, and twenty-first days. The length of the experiment was chosen based on the capture of N volatilized. After the ninth day, NH3 volatilized dropped to the background level in this study.
The volatilized NH3 was collected using static-free semi-open chambers (SALE) described by Araújo et al. [45], elaborated with a transparent plastic bottle of ethylene polyethylene (PET) with a volume of 2 L and an area of 0.008 m2. An ammonia absorber system was installed in the chamber composed of a foam slide 0.3 cm thick, 2.5 cm wide, and 25 cm long and soaked with an acid solution (H2SO4) plus glycerin (2% v/v) inside a container with a volume of 50 mL, hanging vertically. The N-NH3 retained in foam was determined by distillation and titration, according to the Kjeldahl method [46].
2.5. Statistical Analyses
Data were analyzed for the homoscedasticity of the variances and normality of the residues. Then, ANOVA was performed, and when significant at 5% probability, the means were compared using Tukey’s test. In Experiment 1, the total N2O and CH4 emissions were compared. The statistical model used for ANOVA was:
in which Yj is the observed value of the gas production in treatment i (i = 1, 2,..., I) and in repetition j (j = 1, 2,..., J); m is the overall average (of all observations) of the experiment; ti is the effect of the supplementation type i; eij is the error associated with the Yij observation or effect of uncontrolled factors on the Yij observation.
Yij = m + ti + eij
In Experiment 2, the total percentage of volatilized N was compared following the statistical model:
where μ = general mean; Si = effect of the excreta type i; Ej = effect of the supplementation strategy j; SEij = interaction effect between excreta type j and supplementation strategy i; εijk = random error associated with each observation.
Yijk = μ + Si+ Ej + (SE)ij + εijk.
Finally, to identify the drivers of GHG production, single and multivariate linear correlation analyses between gas and moisture fluxes, temperatures, ammonium, and soil nitrate were performed to identify the key variables that explain emissions. All statistical analyses were performed using Statistical Program SAS (version 9.2).
3. Results and Discussions
3.1. Rainfall and Temperature Patterns
The average mean temperature of the experimental period was 24 °C, the minimum 12.8 °C, and the maximum 34.8 °C. The total rainfall during the experimental period was 511 mm. Precipitation was more intense at the beginning of the experimental period in December 2020 and January 2021 (Figure 1). The pattern of temperature and precipitation was within the range observed in the area since 1971.
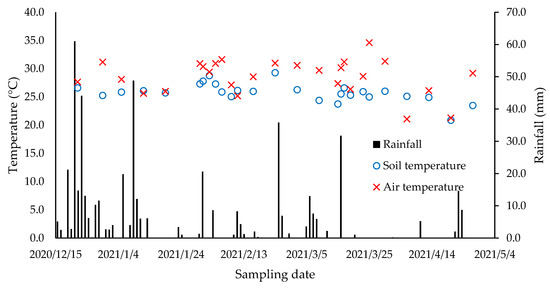
Figure 1.
Rainfall, soil, and air temperatures from December 2020 to May 2021 in the experimental area. Rainfall data from the agrometeorological station of the São Paulo State University, College of Agricultural and Veterinarian Sciences, Campus of Jaboticabal.
Climatic variables play the most important role in the magnitude of the N2O, CH4 fluxes, and NH3 volatilized [30,47,48]. In the present study, variations in the patterns of N2O production were found to be explained by climatic variations during the experimental period.
3.2. Greenhouse Gas Emissions
The total N2O and CH4 emissions did not differ between treatments (p > 0.05) (Table 5). We calculated the N2O emissions per head considering the average stocking rate (5.8 AU/ha; 1 AU = 450 kg BW) and N excretion of 72 g N/day/AU from the companion study [33]. On average, one head emitted 0.31 g N-N2O/day, which was within the range of 0.0 to 1.1 g N-N2O/day observed before [30]. Additionally, this represents approximately 0.043% of the N excreted by the animals being emitted as N2O, a similar proportion to that observed in grazing experiments in the same climate area [9,14,30]. After the applications of bovine excreta, we observed the greatest N2O fluxes (Figure 2). The topmost N2O emissions were found at the first application, followed immediately by the second excreta application.
Table 5.
Effect of supplementation strategies during the background phase of young Nellore bulls on the total CH4 and N2O emissions.
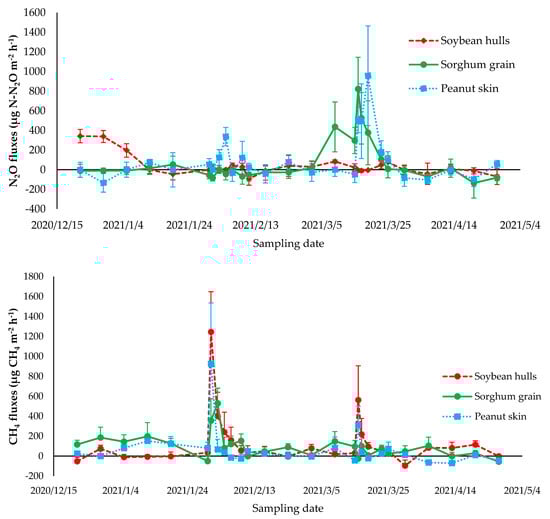
Figure 2.
Nitrous oxide fluxes (μg N-N2O m−2 h−1) and methane fluxes (μg CH4 m−2 h−1) emitted from the excreta of Nellore bulls backgrounded in a Marandu grass pasture, supplemented with 0.3% CP of peanut skin, 0.3% CP of soybean hull, and 0.3% CP of sorghum grain, in the growing season period from the second half of December 2020 to the end of April 2021.
The variations in the N2O fluxes during the experimental period were explained by variations in the soil moisture. We found a positive correlation between the N2O fluxes and the %WFPS (p = 0.0071) (Figure 2). In the present study, the soil concentrations of NH4+ and NO3− (Figure 3) and soil temperature (Figure 1) did not drive the emission of N2O, with p-values of 0.77, 0.96, and 0.18, respectively. Several studies have reported soil moisture as a main driver of N2O fluxes. This occurs especially when the available N is not limited to producing N2O. Increases in the soil moisture stimulate the production of soil nitrifying and denitrifying, leading to N losses as N2O [47].
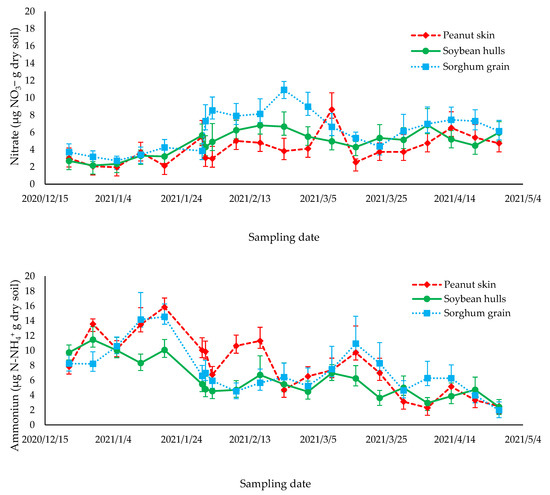
Figure 3.
Mineral N content (μg N g dry soil) in the 0–10 cm soil layer during the sampling period from December 2020 to April 2021.
Initially, when excreta are deposited in the soil, the N availability for the activities of aerobic and anaerobic microorganisms is higher, increasing the N nitrification and denitrification. The increase in N loss is driven by soil temperature and moisture. A conceptual framework called the “hole in the pipe” model describes the pattern that was typical in the present study. Greater N2O emissions were observed in several studies after bovine excretion (urine or feces). Increases in the N2O after excreta application observed in this study confirm the previous knowledge regarding the pattern of N2O emissions in grazing studies [2,13,49,50,51].
Delevatti et al. [16] and Leite et al. [17] showed that N fertilization increases the amount of soluble protein in the forage. Animal grazing in these pastures will present a high degradable protein content in the rumen, which can cause the low efficiency of microbial protein synthesis if the amount of energy is not sufficient for the activity of the microorganisms (limiting effect) [16,17]. When the animal presents low efficiency in the use of N in the rumen, this may lead to an increase in urea losses through urine and, thereafter, an increase in the N2O production from the animal excreta path [7,51]. The addition of energy sources in the diet or increasing the protein balance in the diet to meet the exigencies of the animals has been shown to decrease N excretion to the environment by the bovines and can reduce N2O emissions in pasture soils [19].
Energy supplementation at 0.3% body weight associated or not with tannins did not influence the N2O emissions from bovine excreta (Figure 2 and Table 6). Therefore, our hypothesis that energy supplementation with the addition of tannins can mitigate N2O was not proven. Our results disagree with previous findings that N2O emissions would be mitigated by adding tannin to the diet [19,26,52]. According to previous studies, the complex formed by tannins and proteins makes ruminal degradation less accessible and may alter the N excretion route [3,24,25], reducing urine and increasing via dung, being a less costly form to the environment, with less N2O emissions, due to the N contained in urine in the organic form [30]. However, the magnitude of these changes may not be large enough to lead to a reduction in N2O production in grazing soils.
Table 6.
Total ammonia volatilized (% of applied N lost as NH3) due to different supplementation strategies and excreta types in the backgrounding phase of Nellore bulls.
Energy supplementation with or without the addition of tannins did not affect the total CH4 production (p > 0.05) (Figure 2 and Table 5). We observed two peaks in the flux of CH4, corresponding to the applications of the bovine excreta; the largest peak was observed in the first excreta application and the second topmost flux after the second application. The variation in the CH4 was not explained by any of the studied variables. The p-values from the linear correlation were 0.32, 0.34, 0.38, and 0.43 for the % WFPS, NH4+, NO3−, and soil temperature.
The inclusion of condensed tannins in the ruminant diet can directly affect the population of methanogenic microorganisms; tannins act on fibrinolytic bacteria by decreasing the degradation of the fibrous fraction and act as a sink for H2 [3,27,28,35]. However, reduction in the CH4 produced from enteric fermentation from animals submitted to Marandu palisade grass grazing and energy supplementation, as found by Ferrari et al. [15] and, subsequently, CH4 emissions from dung were not confirmed in the present study.
With high-quality forage grazing, supplementation of the diet may mitigate CH4. However, Berça et al. [53] reported that CH4 production is strictly related to the composition of the diet, and the degradation of the feed supplied will result in the production of short-chain fatty acids (acetate, propionate, and butyrate). This may explain the absence of a mitigation effect on CH4 production from the feces of animals receiving tannins supplementation. The reduction of the CH4 flux a few days after the excreta application was also verified by Cardoso et al. [30] and Bretas et al. [54]. This reduction was attributed to the reduction in the carbohydrates available to the methanogenesis or a drying effect of the excreta.
From a practical perspective, animal supplementation with energy supplementation or tannins addition in the supplements were not proven to be an alternative to mitigate total N2O or CH4 production. However, animal supplementation increases animal weight gain and leads to a reduction in life at slaughtering, which may lead to a reduction in these gases per kg of meat produced. Further studies calculating the GHG budget or carbon footprint are needed to better assess the environmental effect of bovine supplementation. Additionally, the emissions per head per day found in this study (0.31 g N-N2O/head/day) were in the bottom levels found in several studies [2,14,30], which might not be worthy of additional reduction.
3.3. Ammonia Volatilization
Ammonia volatilization was similar among the supplements used, i.e., the peanut skin, soybean hulls, and sorghum grain treatments (p = 0.5170). However, N losses as NH3 were affected by excreta type (p < 0.001). The average dung and dung + urine total volatilization was 2% and 4% excreta N lost as NH3, respectively. While in the urine, N volatilization was significantly higher, with an average of 15% (Table 6). The range of N excreta lost as NH3 in the present study was in the range of 2–21% observed in previous studies in the tropical region [10,12,30]. However, they were lower than the IPCC default emission factor of 21% from the national guidelines for greenhouse gas emissions [1,8]. Ammonia emissions are an indirect source of N2O; therefore, studies quantifying its emissions are important to refine GHG inventories and environmental assessments of bovine production in grazing systems.
Similarly, to the Carvalho et al. [10] study, a greater loss of N from urine was identified and greater than through dung or dung + urine. This fact was due to the volatilization process being faster in urine due to the physical and chemical composition of this excreta, which was the result of ammonium before going through the mineralization process in the urine; additionally, urine presents a higher amount of N, which explains the greater N losses as NH3 [10,19,25].
The ammonia volatilization from urine was around seven times higher when compared to dung and around four times higher when compared to dung + urine. This greater volatilization of ammonia from urine was also observed in other studies [29,30,54]. This fact can be explained by the different physical and chemical compositions between dung and urine, where the N present in urine is deposited in the form of urea. In contrast, dung is N organic [29,30,54].
In the dung treatment, N losses as NH3 presented the lowest rate, around 2%. This low percentage was because, after deposition in the soil, the excretion tended to form a crust, which prevented the emission of NH3 into the atmosphere. Instead, the soil absorbed another portion, which was converted to NH4+ [29,30].
When comparing the ammonia volatilization of dung + urine with urine or dung, we observed that the percentage was around 11% less than the liquid excreta and 2% more than the solid excreta, respectively. The mixture of the two excreta can explain this reduction compared to urine alone. The N present in dung is recalcitrant and, when associated with urine, may have a slower release, as well as the mineralization process for releasing NH4+ [30].
Different from previous findings by Cardoso et al. [30] and Longhini et al. [29], climatic variables such as temperature and precipitation did not influence NH3 volatilization in the present study. Indeed, neither temperature nor precipitation was a limiting factor in NH3 volatilization during the experimental period from December to April. In the above-mentioned studies, the authors evaluated N losses across several seasons (wet, dry, warm, and cold), which might explain this difference.
Even though our study did not prove that tannins addition to a supplement is an option to mitigate NH3 losses, the significant lesser volatilization from dung N confirmed that the manipulation of an animal’s diet to reduce N excretion through urine might lead to a reduction in N environmental pollution. Moreover, the significantly lower N excreta fraction of lost NH3 suggests that the impact of bovine production in the grazing system is minor compared to that estimated when using the IPCC default emissions factors.
4. Conclusions
The use of supplements to background bovines in pasture systems can improve animal performances. The hypotheses that the use of energetic supplements can mitigate N2O, CH4, and NH3 emissions were not proven, and the addition of tannins was not shown to reduce the production of these gases. However, the N2O and CH4 emissions were at the bottom-line levels reported before, while the N losses of 2, 4, and 16% of excreta N for dung, urine + dung, and urine were lower than the emissions factor default for national GHG inventories from the Intergovernmental Pannel on Climate Change.
Few studies have been conducted in a grazing system, and more research involving different strategies of supplementation and ingredients is needed, particularly considering the interaction between forage management, fertilization, and supplements. Future improvements could include a comprehensive life cycle assessment of the supplementation strategies. The quantification of N2O, CH4, and NH3 from young Nellore bulls backgrounded in pastures can be used to develop models of these gas emissions and improvements in ammonia emissions inventories.
Author Contributions
Conceptualization, I.L.R., A.d.S.C. and R.A.R.; methodology, I.L.R., A.d.S.C. and A.S.R.d.S.B.; formal analysis, I.L.R., A.S.R.d.S.B. and F.O.; investigation, I.L.R., N.V.B.F., M.M.S., I.A.D. and F.O.; data curation, I.L.R.; writing—original draft preparation, I.L.R., A.d.S.C. and R.A.R.; writing—review and editing, A.d.S.C.; visualization, I.L.R.; supervision, A.d.S.C. and R.A.R.; project administration, R.A.R.; and funding acquisition, R.A.R. All authors have read and agreed to the published version of the manuscript.
Funding
This research was funded by the Fundação de Amparo à Pesquisa do Estado de São Paulo (grant numbers: 2017/11274-5 and 2019/25234-0). The authors received scholarships from the Coordenação de Aperfeiçoamento do Pessoal de Nível Superior and the Conselho Nacional de desenvolvimento e Tecnologico.
Data Availability Statement
Data will be made available directly from the authors upon request.
Acknowledgments
This work was conducted as a part of the first author’s thesis. We are grateful for the help of UnespFor (study group) for their assistance in conducting the experiments. Special thanks to Debora Siniscalchi for all her assistance during the experiment.
Conflicts of Interest
The authors declare no conflict of interest.
References
- da Silva, H.M.; Dubeux, J.C., Jr.; Silveira, M.L.; Lira, M.A., Jr.; Cardoso, A.S.; Vendramini, J.M. Greenhouse gas mitigation and carbon sequestration potential in humid grassland ecosystems in Brazil: A review. J. Environ. Manag. 2022, 323, 116269. [Google Scholar] [CrossRef]
- Cardoso, A.S.; Barbero, R.P.; Romanzini, E.P.; Teobaldo, R.W.; Ongaratto, F.; Fernandes, M.H.M.R.; Ruggieri, A.C.; Reis, R.A. Intensification: A key strategy to achieve great animal and environmental beef cattle production sustainability in Brachiaria grasslands. Sustainability 2020, 12, 6656. [Google Scholar] [CrossRef]
- Berça, A.S.; Tedeschi, L.O.; Cardoso, A.S.; Reis, R.A. Meta-analysis of the Relationship Between Dietary Condensed Tannins and Methane Emissions by Cattle. Anim. Feed Sci. Technol. 2023, 298, 115564. [Google Scholar] [CrossRef]
- Intergovernmental Panel on Climate Change—IPCC. 2019 Refinement to the 2006 IPCC Guidelines for National Greenhouse Gas Inventories. 2019. Available online: https://www.ipcc.ch/report/2019-refinement-to-the-2006-ipcc-guidelines-for-nationalgreenhouse-gas-inventories (accessed on 1 May 2023).
- Aluwong, T.; Wuyep, P.A.; Allam, L. Livestock environment interactions: Methane emissions from ruminants. Afr. J. Biotechnol. 2011, 10, 1265–1269. [Google Scholar]
- Cardoso, A.S.; Berndt, A.; Leytem, A.; Alves, B.J.; de Carvalho, I.D.N.; Soares, L.H.B.; Urquiaga, S.; Boddey, R.M. Impact of the intensification of beef production in Brazil on greenhouse gas emissions and land use. Agric. Syst. 2016, 143, 86–96. [Google Scholar] [CrossRef]
- Grossi, G.; Goglio, P.; Vitali, A.; Williams, A.G. Livestock and climate change: Impact of livestock on climate and mitigation strategies. Anim. Front. 2019, 9, 69–76. [Google Scholar] [CrossRef]
- Cardoso, A.S.; Alari, F.O.; de Andrade, N.; Nascimento, T.S.; van Cleef, F.D.O.S.; Alves, B.J.R.; Ruggieri, A.C.; Malheiros, E.B. Nitrous oxide emissions in silvopastoral systems: Key driving variables and seasonality. Agric. For. Meteorol. 2022, 316, 108851. [Google Scholar] [CrossRef]
- Guimarães, B.C.; Gomes, K.F.; Homem, B.G.; Lima, I.B.G.; Spasiani, P.P.; Boddey, R.M.; Alves, B.J.R.; Casagrande, D.R. Emissions of N2O and NH3 from cattle excreta in grass pastures fertilized with N or mixed with a forage vegetable. Nutr. Cycl. Agroecosystems 2022, 1, 22. [Google Scholar]
- Carvalho, G.M.; Brito, L.D.F.; Coelho, L.D.M.; Cardoso, A.S.; Messana, J.D.; Colovate, P.H.D.; Ganga, M.J.G.; da Cruz, M.C.P.; Malheiros, E.B.; Berchielli, T.T. Ammonia, nitrous oxide and methane emissions from the excreta of cattle receiving rumen undegradable protein. Agron. J. 2022, 114, 1655–1671. [Google Scholar] [CrossRef]
- Butterbach-Bahl, K.; Baggs, E.M.; Dannenmann, M.; Kiese, R.; Zechmeister-Boltenstern, S. Nitrous oxide emissions from soils: How well do we understand the processes and their controls? Philos. Trans. R. Soc. B Biol. Sci. 2013, 368, 20130122. [Google Scholar] [CrossRef]
- Firestone, M.K.; Davidson, E.A. Microbiological basis of NO and N2O production and consumption in soil. In Exchange of Trace Gases between Terrestrial Ecosystems and the Atmosphere; Andreae, M.O., Schimel, D.S., Eds.; John Wiley and Sons: New York, NY, USA, 1998; pp. 7–21. [Google Scholar]
- Cardoso, A.S.; Brito, L.F.; Janusckiewicz, E.R.; Morgado, E.S.; Barbero, R.P.; Koscheck, J.F.W.; Reis, R.A.; Ruggieri, A.C. Impact of grazing intensity and seasons on greenhouse gas emissions in a tropical grassland. Agric. Syst. 2017, 20, 845–859. [Google Scholar] [CrossRef]
- Coelho, L.M.; Brito, L.F.; Messana, J.D.; Cardoso, A.S.; Carvalho, G.M.; Torres, R.Z.S.; Carlos, R.S.; Malheiros, E.B.; da Cruz, M.C.P.; Berchielli, T.T. Effects of rumen undegradable protein sources on nitrous oxide, methane and ammonia emission from the manure of feedlot-finished cattle. Sci. Rep. 2022, 12, 9166. [Google Scholar] [CrossRef]
- Ferrari, A.C.; Leite, R.G.; Fonseca, N.V.B.; Romanzini, E.P.; Cardoso, A.S.; Barbero, R.P.; Costa, D.F.A.; Ruggieri, A.C.; Reis, R.A. Performance, nutrient use, and methanogenesis of Nellore cattle on a continuous grazing system of Urochloa brizantha and types fed supplement varying on protein and energy sources. Livest. Sci. 2021, 253, 104716. [Google Scholar] [CrossRef]
- Delevatti, L.M.; Romanzini, E.P.; Koscheck, J.F.W.; Araújo, T.L.R.; Renesto, D.M.; Ferrari, A.C.; Barbero, R.P.; Mulliniks, J.T.; Reis, R.A. Forage management intensification and supplementation strategy: Intake and metabolic parameters on beef cattle production. Anim. Feed Sci. Technol. 2019, 247, 74–82. [Google Scholar] [CrossRef]
- Leite, R.G.; Cardoso, A.S.; Fonseca, N.V.B.; Silva, M.L.C.; Tedeschi, L.O.; Delevatti, L.M.; Ruggieri, A.C.; Reis, R.A. Effects of nitrogen fertilization on protein and carbohydrate fractions of Marandu palisade grass. Sci. Rep. 2021, 11, 14786. [Google Scholar] [CrossRef]
- D’aurea, A.P.; Cardoso, A.S.; Guimarães, Y.S.R.; Fernandes, L.B.; Ferreira, L.E.; Reis, R.A. Mitigating Greenhouse Gas Emissions from Beef Cattle Production in Brazil through Animal Management. Sustainability 2021, 13, 7207. [Google Scholar] [CrossRef]
- Siniscalchi, D.; Cardoso, A.S.; Corrêa, D.C.D.C.; Ferreira, M.R.; Andrade, M.E.B.; da Cruz, L.H.G.; Ruggieri, A.C.; Reis, R.A. Effects of condensed tannins on greenhouse gas emissions and nitrogen dynamics from urine-treated grassland soil. Environ. Sci. Pollut. Res. 2022, 29, 85026–85035. [Google Scholar] [CrossRef]
- Adamczyk, B.; Simon, J.; Kitunen, V.; Adamczyk, S.; Smolander, A. Tannins and their complex interaction with different organic nitrogen compounds and enzymes: Old paradigms versus recent advances. Chem. Open 2017, 6, 610–614. [Google Scholar] [CrossRef]
- Beauchemin, K.A.; McGinn, S.M.; Martinez, T.F.; McAllister, T.A. Use of condensed tannin extract from quebracho trees to reduce methane emissions from cattle. J. Anim. Sci. 2007, 85, 1990–1996. [Google Scholar] [CrossRef]
- Teobaldo, R.W.; Cardoso, A.S.; Brito, T.R.; Leite, R.G.; Romanzini, E.P.; Granja-Salcedo, Y.T.; Reis, R.A. Response of Phytogenic Additives on Enteric Methane Emissions and Animal Performance of Nellore Bulls Raised in Grassland. Sustainability 2022, 14, 9395. [Google Scholar] [CrossRef]
- Ebert, P.J.; Bailey, E.A.; Shreck, A.L.; Jennings, J.S.; Cole, N.A. Effect of condensed tannin extract supplementation on growth performance, nitrogen balance, gas emissions, and energetic losses of beef steers. J. Anim. Sci. 2017, 95, 1345–1355. [Google Scholar] [CrossRef] [PubMed]
- Avila, A.S.; Zambom, M.A.; Faccenda, A.; Fischer, M.L.; Anschau, F.A.; Venturini, T.; Tinini, R.C.R.; Dessbesell, J.G.; Faciola, A.P. Effects of black wattle (Acacia mearnsii) condensed tannins on intake, protozoa population, ruminal fermentation, and nutrient digestibility in Jersey steers. Animals 2020, 10, 1011. [Google Scholar] [CrossRef] [PubMed]
- Koenig, K.M.; Beauchemin, K.A.; McGinn, S.M. Feeding condensed tannins to mitigate ammonia emissions from beef feedlot cattle fed high-protein finishing diets containing distillers grains. J. Anim. Sci. 2018, 96, 4414–4430. [Google Scholar] [CrossRef] [PubMed]
- Zhao, G.Y. Modulation of protein metabolism to mitigate nitrous oxide (N2O) emission from excreta of livestock. Curr. Protein Pept. Sci. 2017, 18, 525–531. [Google Scholar] [CrossRef] [PubMed]
- Gemeda, B.S.; Hassen, A. Effect of Tannin and Species Variation on In vitro Digestibility, Gas, and Methane Production of Tropical Browse Plants. J. Anim. Sci. 2015, 28, 188–199. [Google Scholar] [CrossRef] [PubMed]
- Aboagye, I.A.; Beauchemin, K.A. Potential of molecular weight and structure of tannins to reduce methane emissions from ruminants: A review. Animals 2019, 9, 856. [Google Scholar] [CrossRef]
- Longhini, V.Z.; Cardoso, A.S.; Berça, A.S.; Boddey, R.M.; Reis, R.A.; Dubeux Junior, J.C.B.; Ruggieri, A.C. Nitrogen supply and affect rainfall emissions from dairy cattle excreta and urea applied on warm-climate pastures. J. Environ. Qual. 2020, 49, 1453–1466. [Google Scholar] [CrossRef]
- Cardoso, A.S.; Oliveira, S.C.; Janusckiewicz, E.R.; Brito, L.F.; Silva, E.M.; Reis, R.A.; Ruggieri, A.C. Seasonal effects on, nitrous oxide, and methane emissions for beef cattle excreta and urea fertilizer applied to a tropical pasture. Soil Tillage Res. 2019, 194, 104–341. [Google Scholar] [CrossRef]
- Ruggieri, A.C.; Cardoso, A.S.; Ongaratto, F.; Casagrande, D.R.; Barbero, R.P.; Brito, L.D.F.; Azenha, M.V.; Oliveira, A.A.; Koscheck, J.F.W.; Reis, R.A. Grazing Intensity Impacts on Herbage Mass, Sward Structure, Greenhouse Gas Emissions, and Animal Performance: Analysis of Brachiaria Pastureland. Agronomy 2020, 10, 1750. [Google Scholar] [CrossRef]
- Van Raij, B.; Cantarella, H.; Quaggio, J.A.; Furlani, A.M.C. Recommendations for Fertilization and Liming for the State of São Paulo, 2nd ed.; Technical Bulletin, 100; IAC: Campinas, Brazil, 1997; 285p. [Google Scholar]
- Fonseca, N.V.B.; Cardoso, A.S.; Berça, A.S.; Dornellas, I.A.; Ongaratto, F.; Silva, M.L.C.; Ruggieri, A.C.; Reis, R.A. Effect of different nitrogen fertilizers on nitrogen efficiency use in Nellore bulls grazing on Marandu palisade grass. Livest. Sci. 2022, 263, 105012. [Google Scholar] [CrossRef]
- Allen, V.G.; Batello, C. An international terminology for grazing lands and grazing animals. Grass Forage Sci. 2011, 66, 2–28. [Google Scholar] [CrossRef]
- Barbero, R.P.; Malheiros, E.B.; Araújo, T.L.R.; Nave, R.L.G.; Mulliniks, J.T.; Berchielli, T.T.; Ruggieri, A.C.; Reis, R.A. Combining Marandu grazgrassing height and supplementation level to optimize growth and productivity of yearling bulls. Anim. Feed Sci. Technol. 2015, 209, 110–118. [Google Scholar] [CrossRef]
- Koscheck, J.F.W.; Romanzini, E.P.; Barbero, R.P.; Delevatti, L.M.; Ferrari, A.C.; Mulliniks, J.T.; Mousquer, J.T.; Berchielli, T.T.; Reis, R.A. How do animal performance and methane emissions vary with forage management intensification and supplementation? Anim. Prod. Sci. 2020, 60, 1201–1209. [Google Scholar] [CrossRef]
- Cardoso, A.S.; José Neto, A.; Azenha, M.V.; Morgado, E.S.; Brito, L.D.F.; Janusckiewicz, E.R.; Reis, R.A.; Ruggieri, A.C. Mineral salt intake effects on faecal-N concentration and the volume and composition of beef cattle urine. Trop. Anim. Health Prod. 2019, 51, 171–177. [Google Scholar] [CrossRef]
- Schofield, P.; Mbugua, D.M.; Pell, A.N. Analysis of condensed tannins: A review. Anim. Feed Sci. Technol. 2001, 91, 21–40. [Google Scholar] [CrossRef]
- AOAC. Official Methods of Analysis of Association of Official Analytical Chemists, 16th ed.; AOAC International: Arlington, TX, USA, 1995. [Google Scholar]
- Parkinson, J.A.; Allen, S.E. A wet oxidation procedure suitable for the determination of nitrogen and mineral nutrients in biological materials. Commun. Soil Sci. Plant Anal. 1975, 6, 1–11. [Google Scholar] [CrossRef]
- Forster, J.C. Soil sampling, handling, storage and analysis. In Methods in Applied Soil Microbiology and Biochemistry; Kassem, A., Paolo, N., Eds.; Academic Press: London, UK, 1995; pp. 49–121. [Google Scholar]
- Doane, T.A.; Horwáth, W.R. Spectrophotometric determination of nitrate with a single reagent. Anal. Lett. 2003, 36, 2713–2722. [Google Scholar] [CrossRef]
- Alves, B.J.R.; Smith, K.A.; Flores, R.A.; Cardoso, A.S.; Oliveira, W.R.D.; Jantalia, C.P.; Urquiaga, S.; Boddey, R.M. Selection of the most suitable sampling time for static chambers for the estimation of daily mean N2O flux from soils. Soil Biol. Biochem. 2012, 46, 129–135. [Google Scholar] [CrossRef]
- Van Der Weerden, T.J.; Luo, J.; Di, H.J.; Podolyan, A.; Phillips, R.L.; Saggar, S.; Klein, C.A.M.; Cox, N.; Ettema, P.; Rys, G. Nitrous oxide emissions from urea fertiliser and effluent with and without inhibitors applied to pasture. Agric. Ecosyst. Environ. 2016, 219, 58–70. [Google Scholar] [CrossRef]
- Araújo, E.S.; Marsola, T.; Miyazawa, M.; Soares, L.H.B.; Urquiaga, S.; Boddey, R.M.; Alves, B.J.R. Static semi-open chamber calibration for quantification of volatilized ammonia from the soil. Pesqui. Agropecu. Bras. 2009, 44, 769–776. [Google Scholar] [CrossRef]
- Cardoso, A.S.; Longhini, V.Z.; Berça, A.S.; Ongaratto, F.; Siniscalchi, D.; Reis, R.A.; Ruggieri, A.C. Pasture management and greenhouse gases emissions. Biosci. J. 2022, 64, 1–11. [Google Scholar] [CrossRef]
- Dobbie, K.E.; McTaggart, I.P.; Smith, K.A. Nitrous oxide emissions from intensive agricultural systems: Variations between crops and seasons, key driving variables, and mean emission factors. J. Geophys. Res. 1999, 104, 26891–26899. [Google Scholar] [CrossRef]
- Rivera, A.R.; Berchielli, T.T.; Messana, J.D.; Velasquez, P.T.; Franco, A.V.M.; Fernandes, L.B. Ruminal fermentation and methane production in cattle fed tifton 85 grass hay and concentrated with additives. Rev. Bras. Zootec. 2010, 39, 617–624. [Google Scholar] [CrossRef]
- Cardoso, A.S.; Junqueira, J.B.; Reis, R.A.; Ruggieri, A.C. How do greenhouse gas emissions vary with biofertilizer type and soil temperature and moisture in a tropical grassland? Pedosphere 2020, 30, 607–617. [Google Scholar] [CrossRef]
- Rowlings, D.W.; Grace, P.R.; Scheer, C.; Liu, S. Rainfall variability drives interannual variation in N2O emissions from a humid, subtropical pasture. Sci. Total Environ. 2015, 512, 8–18. [Google Scholar] [CrossRef]
- Calsamiglia, S.; Ferret, A.; Reynolds, C.K.; Kristensen, N.B.; Van Vuuren, A. Strategies for optimizing nitrogen use by ruminants. Animal 2010, 4, 1184–1196. [Google Scholar] [CrossRef]
- Yang, K.; Wei, C.; Zhao, G.Y.; Xu, Z.W.; Lin, S.X. Dietary supplementation of tannic acid modulates nitrogen excretion pattern and urinary nitrogenous constituents of beef cattle. Livest. Sci. 2016, 191, 148–152. [Google Scholar] [CrossRef]
- Berça, A.S.; Cardoso, A.S.; Longhini, V.Z.; Tedeschi, L.O.; Boddey, R.M.; Berndt, A.; Reis, R.A.; Ruggieri, A.C. Methane production and nitrogen balance of dairy heifers grazing palisade grass cv. Marandu alone or with forage peanut. J. Anim. Sci. 2019, 97, 4625–4634. [Google Scholar] [CrossRef]
- Bretas, I.L.; Paciullo, D.S.; Alves, B.J.R.; Martins, M.R.; Cardoso, A.S.; Lima, M.A.; Rodrigues, A.R.R.; Silva, F.F.; Chizzotti, F.H. Nitrous oxide, methane, and ammonia emissions from cattle excreta on Brachiaria decumbens growing in monoculture or silvopasture with Acacia mangium and Eucalyptus grandis. Agric. Ecosyst. Environ. 2020, 295, 106896. [Google Scholar] [CrossRef]
Disclaimer/Publisher’s Note: The statements, opinions and data contained in all publications are solely those of the individual author(s) and contributor(s) and not of MDPI and/or the editor(s). MDPI and/or the editor(s) disclaim responsibility for any injury to people or property resulting from any ideas, methods, instructions or products referred to in the content. |
© 2023 by the authors. Licensee MDPI, Basel, Switzerland. This article is an open access article distributed under the terms and conditions of the Creative Commons Attribution (CC BY) license (https://creativecommons.org/licenses/by/4.0/).