Article

Temporal Variations and Spatial Distribution of Air Pollutants in Shaoxing, a City in Yangtze Delta, China Based on Mobile Monitoring Using a Sensor Package

1
School of Environmental and Energy Engineering, Beijing University of Civil Engineering and Architecture, Beijing 100044, China
2
College of Environment, Zhejiang University of Technology, Hangzhou 310014, China
3
Shaoxing Ecological and Environmental Monitoring Center of Zhejiang Province, Shaoxing 312000, China
4
National Institute of Metrology, Beijing 102200, China
5
Green Intelligence Environmental School, Yangtze Normal University, Chongqing 408100, China
6
State Key Laboratory of Desert and Oasis Ecology, Key Laboratory of Ecological Safety and Sustainable Development in Arid Lands, Xinjiang Institute of Ecology and Geography, Chinese Academy of Sciences, Wulumuqi 830011, China
*
Authors to whom correspondence should be addressed.
Atmosphere 2023, 14(7), 1093; https://doi.org/10.3390/atmos14071093
Submission received: 8 June 2023 / Revised: 27 June 2023 / Accepted: 27 June 2023 / Published: 29 June 2023

Abstract

:
Currently, traffic-related sources are considered to be one of the major contributors to air pollutants in urban areas. As the number of motor vehicles increases, the impact of traffic-related air pollutants (TRAPs) on human health has also increased in recent years. People are easily exposed to TRAPs in their daily lives. However, long-term exposure to TRAPs can have adverse health effects. Mobile monitoring is more flexible compared to traditional urban monitoring stations and can effectively obtain the spatial variation characteristics of air pollutants. We mounted a sensor package on an electric bicycle and conducted mobile measurements of CO, NO2 and SO2 on a circular road in the center of Shaoxing, a city in the center of the Yangtze Delta, China. The CO, NO2 and SO2 concentrations were observed to be higher in the morning and evening rush hours, and the three pollutants show different seasonal and spatial variation characteristics. CO concentration was higher in urban arterial and crossroads. NO2 concentration was variable, alternating between high and low concentrations. SO2 concentration was relatively stable and aggregated. This study provides important information on the spatial and temporal variations of TRAPs, which helps commuters understand how to effectively reduce pollutant exposure during personal travel.

1. Introduction

In densely populated cities, environmental pollution has become a public health concern. As the result of continuous research on ambient air pollution issues, researchers have an increasing recognition of the relationship between air pollution and human health. There is much evidence that air pollutants can cause respiratory airway injury [1,2], increase the prevalence of cardiovascular disease [3,4], and have effects on the brain leading to dementia [5]. The risk of morbidity and mortality due to ambient air pollution has been increasing in recent years [6,7,8]. A European study shows positive associations between residential exposure to PM2.5, nitrogen dioxide and black carbon and deaths due to natural causes, cardiovascular disease and respiratory disease. These associations remain even at low exposure levels [9]. Low concentration refers to concentrations lower than the values set by the EU, US Environmental Protection Agency and WHO 2005 air quality guidelines [10]. Therefore, in 2021, the WHO released new global air quality guidelines that further improve the control requirements for PM2.5, PM10 and NO2. Transportation is an integral part of people’s daily lives. However, people are exposed to air pollution during their daily commute and are more likely to be exposed to high levels of traffic-related air pollutants (TRAPs) when bicycling and walking alongside roads [11].
PM10, PM2.5, NO2, SO2, CO and O3 are common air pollutants and conventional parameters monitored by air monitoring stations. Among them, the most important sources of NO2 and CO are transportation-related fossil fuel combustion, SO2 is not only directly derived from industrial emissions but also produced by transportation sources, and the complexity of the transportation process leads to spatial variability in TRAPs [12,13]. However, the number of fixed monitoring stations in cities is usually limited, and it is difficult to reflect the spatial and temporal variation of pollutants on the small scale of the road. Air pollution hotspots inside the city center or around industrial areas can not be identified by fixed monitoring stations. The spatial variability of air pollution is influenced by local pollution enhancement, which may vary even at a scale of 10 m [14]. Especially for TRAPs, the differences in pollution levels can occur on a small scale [15]. To overcome this problem, mobile monitoring is increasingly applied to environmental monitoring to obtain high spatial resolution for air pollutant concentrations [16]. There are various means of transportation used in mobile monitoring, including buses, taxis, cars, bicycles, etc. [17,18,19,20,21,22]. Numerous previous studies have shown that using an instrument to perform multiple mobile measurements for a certain area to obtain air quality data is an effective way [23,24,25,26]. However, fewer studies have focused on rapid changes in gaseous pollutant concentrations on urban roads.
Mobile monitoring has been widely used to understand air quality and exposure in different travel modes. Crocchianti et al. [27] conducted a three-year campaign by deploying portable instrumentation on a mobile cabin of a public transport system in Perugia, Italy (10 s corresponding to 50 m). They used models to analyze the spatiotemporal autocorrelations of size-selected particulate matter (PM) and nitrous oxide and the effects of traffic and meteorological covariates on particulate matter concentrations. de Souza et al. [28] evaluated exposure to multiple pollutants in four different transport modes in downtown Zhengzhou city in four different transport modes (bike, taxi, subway and bus). The results show that the concentrations of PM and O3 were lowest in the taxi and bus and highest for the bike rider. The concentrations of NO2, CO and SO2 were highest in the taxi and bus. However, the highest inhaled dose of all pollutants was observed in the bicycle mode due to high inhalation rates and commuting times. Chen et al. [29] conducted mobile monitoring in three California cities using an air sensor mounted on the roof of a hybrid sport-utility vehicle (SUV). They studied community-level air pollution patterns by integrating mobile measurement and a data analysis approach. The study reported that 15–30 repeated measurements may be sufficient to map the general air pollution patterns within the community. Van Poppel et al. [20] measured the concentrations of UFP, PM and BC by bicycle in a small city of Flanders to study spatial variability in pollutants in different micro-environments. The results show that UFP and BC concentrations increase by a factor of 2–3 on moderate- to high-traffic streets, while PM2.5 concentrations increase by less than 10% compared to urban background location.
In order to further understand the pollutant emissions from mobile sources of motor vehicles on urban roads, we conducted several rounds of measurements of CO, NO2 and SO2 concentrations on the central roads of Shaoxing City using a self-developed sensor package including a GPS device. The sensor package was mounted on an electric bicycle. We conducted mobile measurements of traffic-related air pollutants during specific periods in four seasons to obtain high-temporal-resolution pollutant concentrations in the transport microenvironment. The spatiotemporal variations in CO, NO2 and SO2 concentrations are described, thereby providing a reference for the formulation of relevant policies and reducing the harm of traffic pollutants to human health during daily commuting.

2. Materials and Methods

2.1. Sampling Site

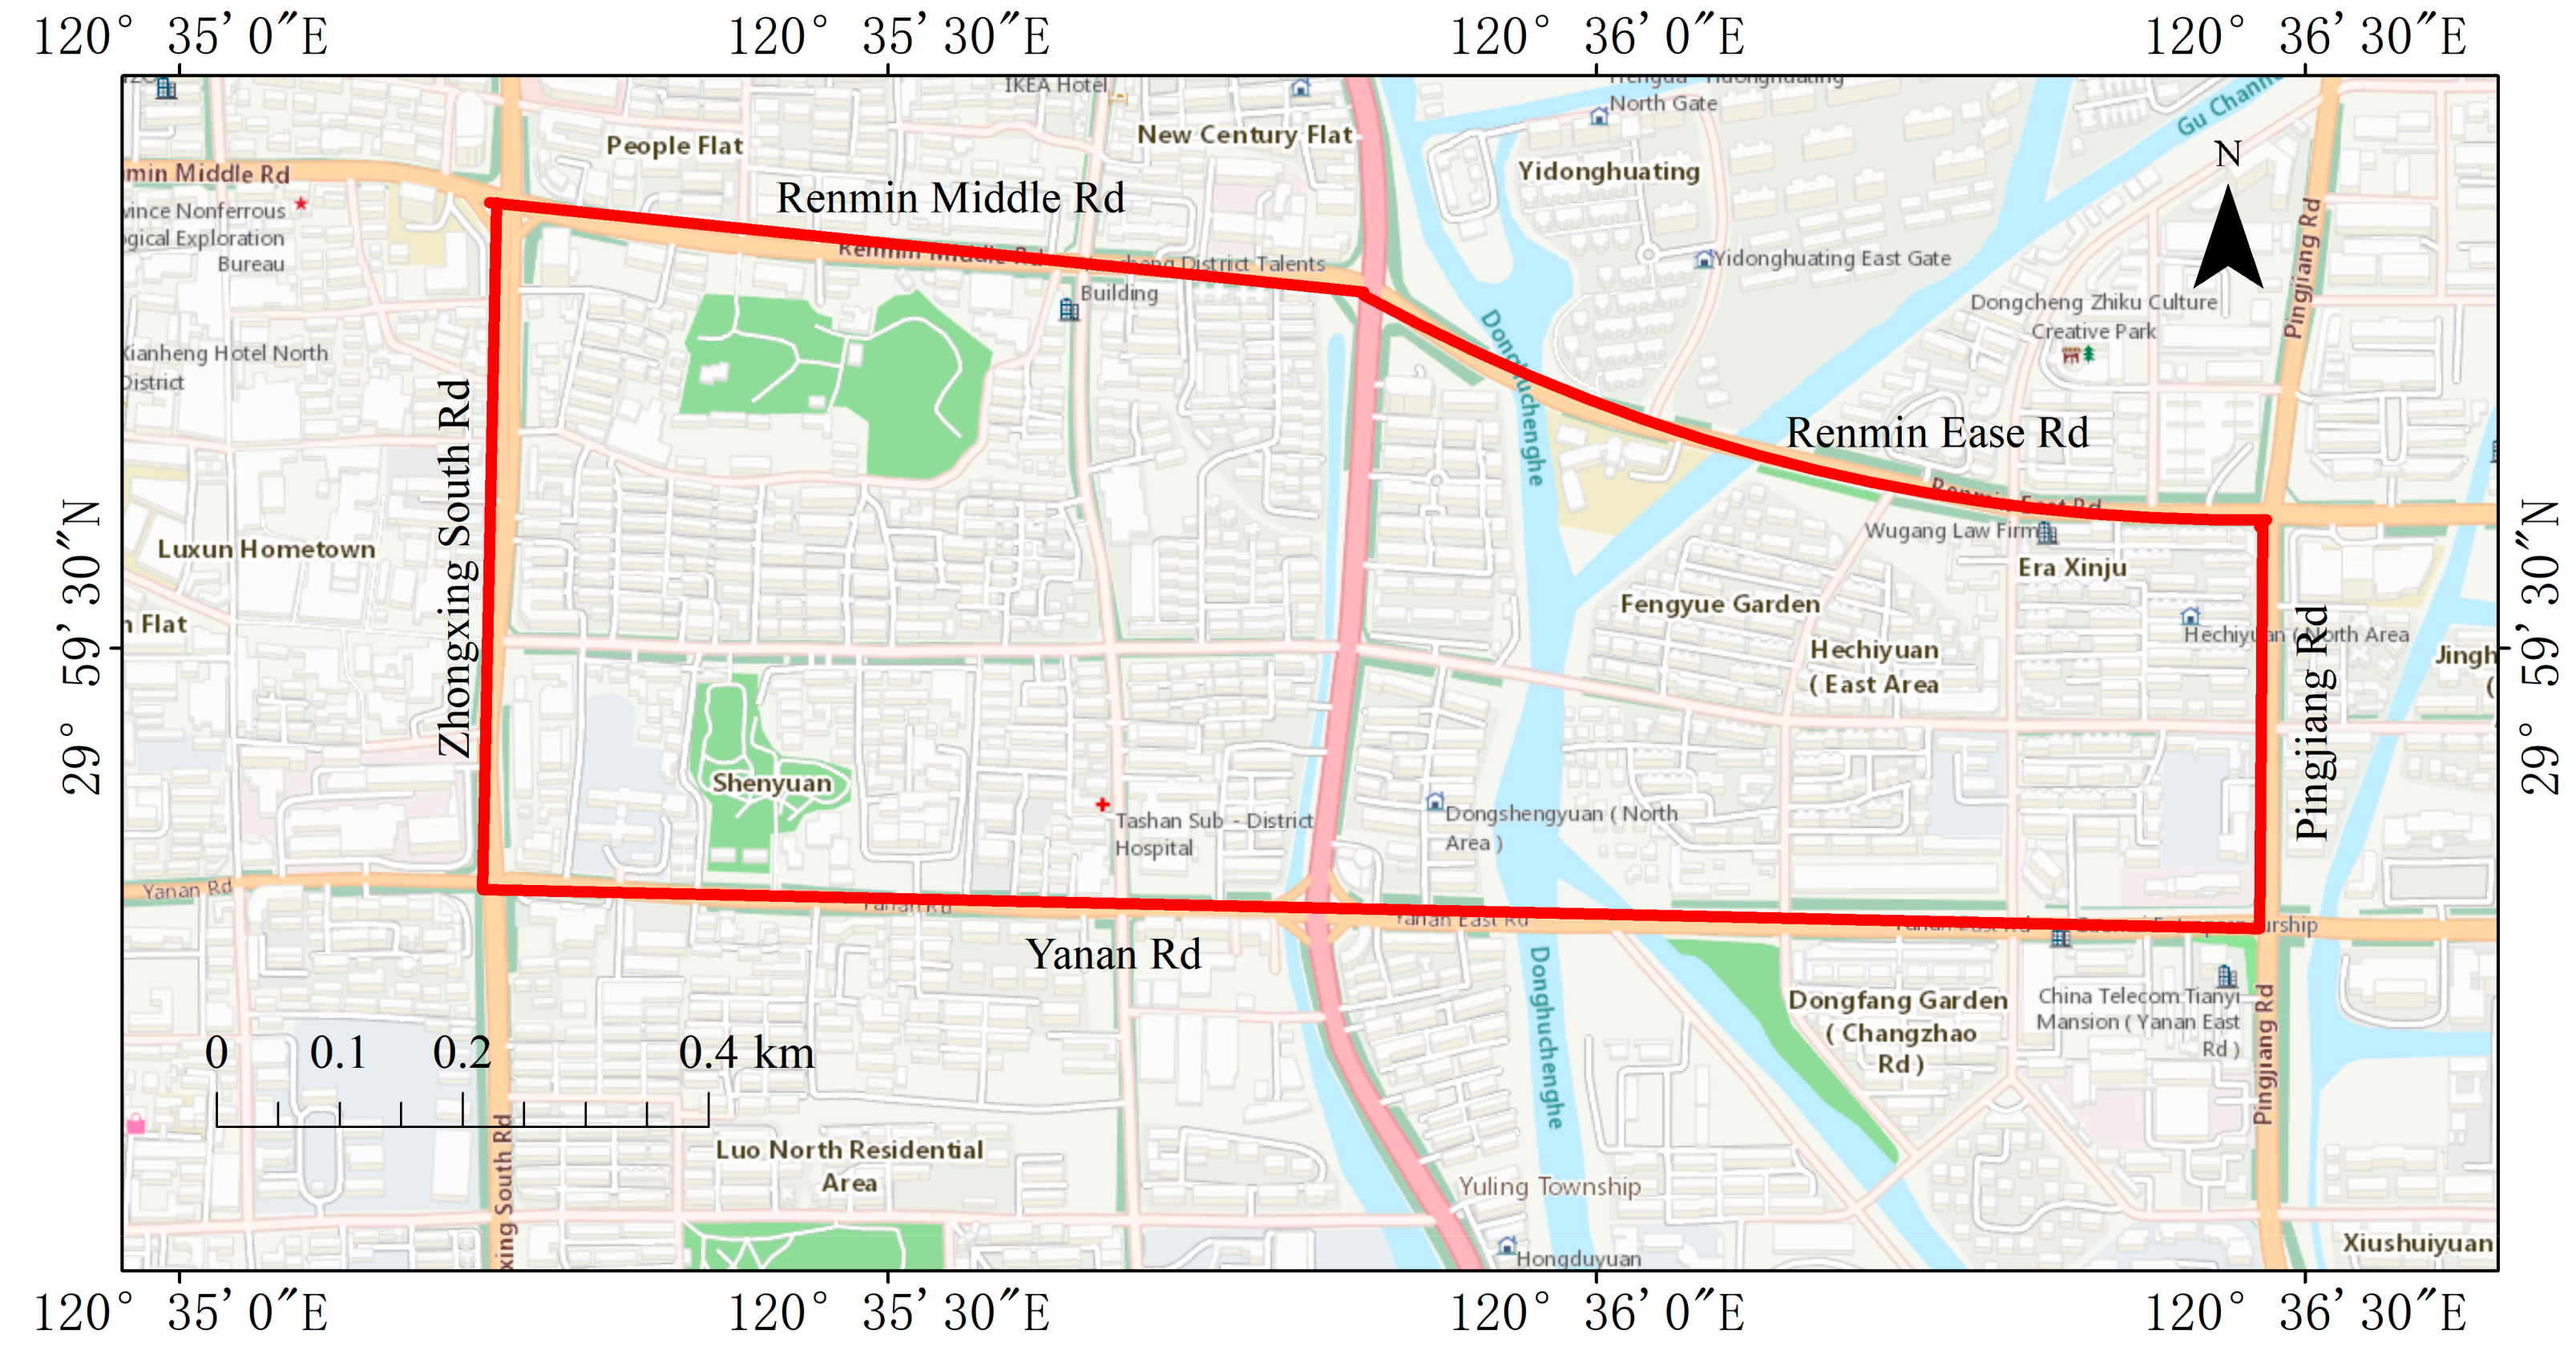
Located in the north of Zhejiang Province, Shaoxing City is one of the 26 cities in the Yangtze River Delta city cluster. The specific location is shown in Figure 1. The mobile monitoring activity was carried out in the prosperous central area of Shaoxing City (120°59′ E, 29°99′ N), and the selected route (Figure 2) was the main traffic road where people’s daily activities are more frequent and the number of driving vehicles is high. The selected route is 5 km long. The main locations on both sides of the monitoring route include Hechi Park with relatively more green vegetation, Shaoxing Children’s Park, Shenyuan Garden, the scenic spot of Lu Xun’s hometown, and two hospitals, Shaoxing Chinese Medicine Hospital and Shaoxing Second Hospital; the other locations are neighborhoods composed of several multi-story houses. The residential areas are concentrated in the eastern part of the whole area, and the parks and hospitals are concentrated in the western part of the area. The north–south section of the entire mobile monitoring route on the west side is Zhongxing South Road, a two-way three-lane urban trunk road, through which more vehicles may pass than other roads. Therefore, the main source of pollutants of the selected route is traffic pollution, and there is no industrial source.
According to the Shaoxing Municipal Bureau of Statistics, at the end of 2021, the city’s motor vehicle ownership (including motorcycles) was 1.817 million, an increase of 6.8% over the end of the previous year (Shaoxing Statistical Yearbook 2022).

2.2. Monitoring Time

Mobile measurements were conducted 108 times in total across 18 days in May (spring), July (summer), November (autumn) 2022 and February (winter) 2023. The daily sampling times were set to 8:00, 11:00, 14:00, 17:00, 19:00, and 20:30, covering the morning and evening peak travel times. The mobile monitoring covered four seasons to observe seasonal changes in the concentration of traffic pollutants. As shown in Table 1, the meteorological conditions were stable without strong wind interference during the monitoring period (https://www.zq12369.com/, accessed on 23 April 2023). In order to facilitate cycling, the measurement campaign was usually performed under low wind speed conditions, which were 1.2 m/s, 1.6 m/s, 1.0 m/s and 1.2 m/s in the four seasons of spring, summer, autumn and winter, respectively. We chose to drive an electric bicycle on non-motorized lanes to obtain the exposure of traffic-related air pollutants when bicycle is the mode of travel. The average driving speed was 10 km/h, and the average time spent to make a circuit along the mobile monitoring route was about 30 min.

2.3. Instrumentations

The device used for mobile monitoring was our self-developed sensor package, which includes electrochemical gas sensors for measuring CO, NO2, SO2, temperature sensors, humidity sensors, pressure sensors, GPS modules and data logging units, all housed in a plastic enclosure. The design of the sensor package can be seen in our previous study [30]. The concentrations of CO, NO2 and SO2 are measured every 2 s. The sensors have the characteristics of high sensitivity, small volume, low power consumption and low cost. These advantages also allow them to be applied to measure the vertical distribution of pollutant concentrations [31]. The specific parameters are shown in Table 2. The gas is introduced into the sensor through a Teflon tube, and the sensor reacts with the measured gas to produce an electrical signal proportional to the gas concentration, which is collected using a data collector and converted into a concentration value in ppb. Then, the data are recorded using software and saved using a Windows 10-controlled system. The sensor package is equipped with a GPS module capable of recording time and spatial location information in real time, mainly including travel speed, travel distance, longitude and latitude of the location it is in. The whole sensor package is light, powered by rechargeable batteries, easy to carry and suitable for mobile monitoring.
In addition, we also carried small weather stations to measure ambient temperature, humidity, atmospheric pressure, wind speed, wind direction and solar radiation during our mobile monitoring activities.
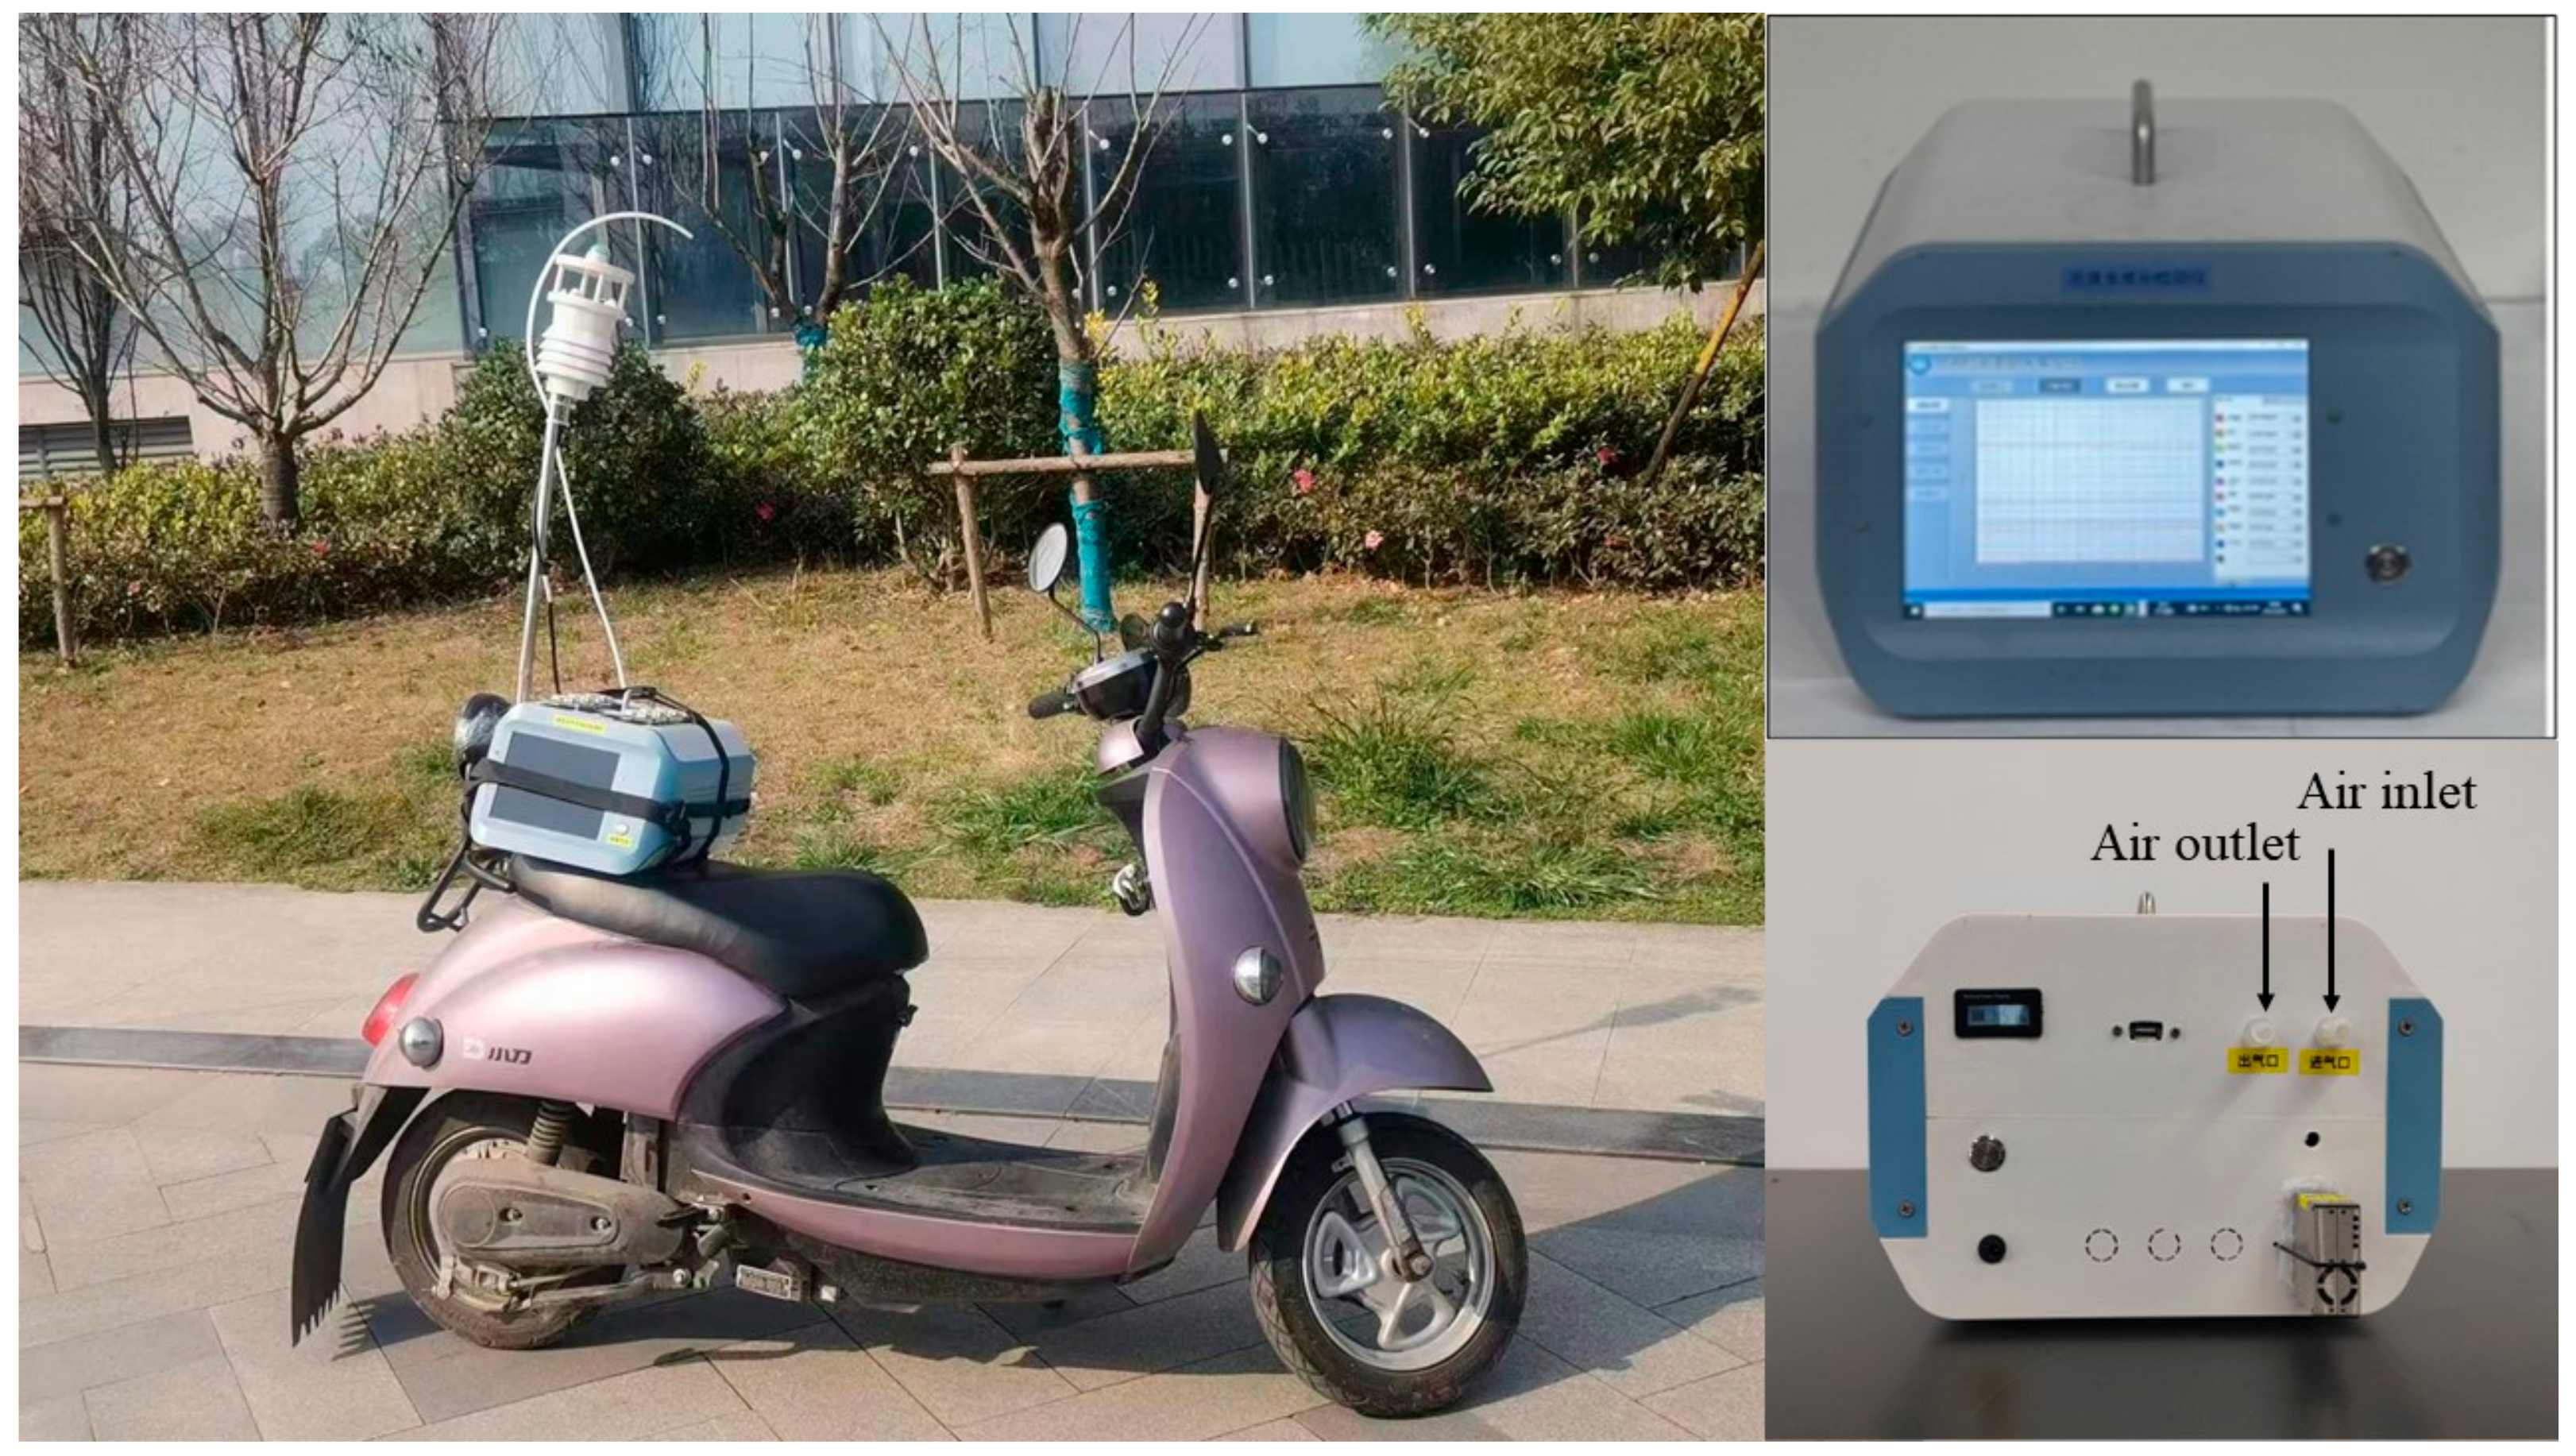
As shown in Figure 3, the device was fixed on an electric bicycle. The electric bicycle is a common mode of transportation for a large portion of people, and is also a commuting mode with a relatively high dose of pollutant inhalation. The use of electric bicycles for mobile monitoring can more objectively reflect the concentration of pollutants on both sides of the road, which is a more flexible method.

2.4. Data Quality Assurance

Before each mobile measurement activity, we calibrated the sensors in the laboratory to improve the accuracy of the gas sensors. The known concentrations of the CO, NO2, and SO2 standard gases were passed into the corresponding gas sensors until stable gas concentration data were obtained. To verify the reliability of the sensor, five concentration gradients were compared between each sensor and the standard gas produced by the reference apparatus. Then, standard curves were made to determine the calibration effect. R2 refers to the consistency between the sensor package and the reference apparatus. The closer R2 is to 1, the better the agreement between the sensors and the reference instrument. After calibration, the R2 values of the CO, NO2 and SO2 sensors were all greater than 0.99, indicating good agreement with the standard gases. We also compared the sensor package with the reference instrument during the measurement to reduce the impact of weather conditions. This can be seen in our previous study [32]. We checked the time displayed by the data acquisition system prior to the specific sampling time point on the sampling day to ensure the time accuracy of the measured data.

3. Results and Discussion

3.1. Temporal Variability of TRAPs

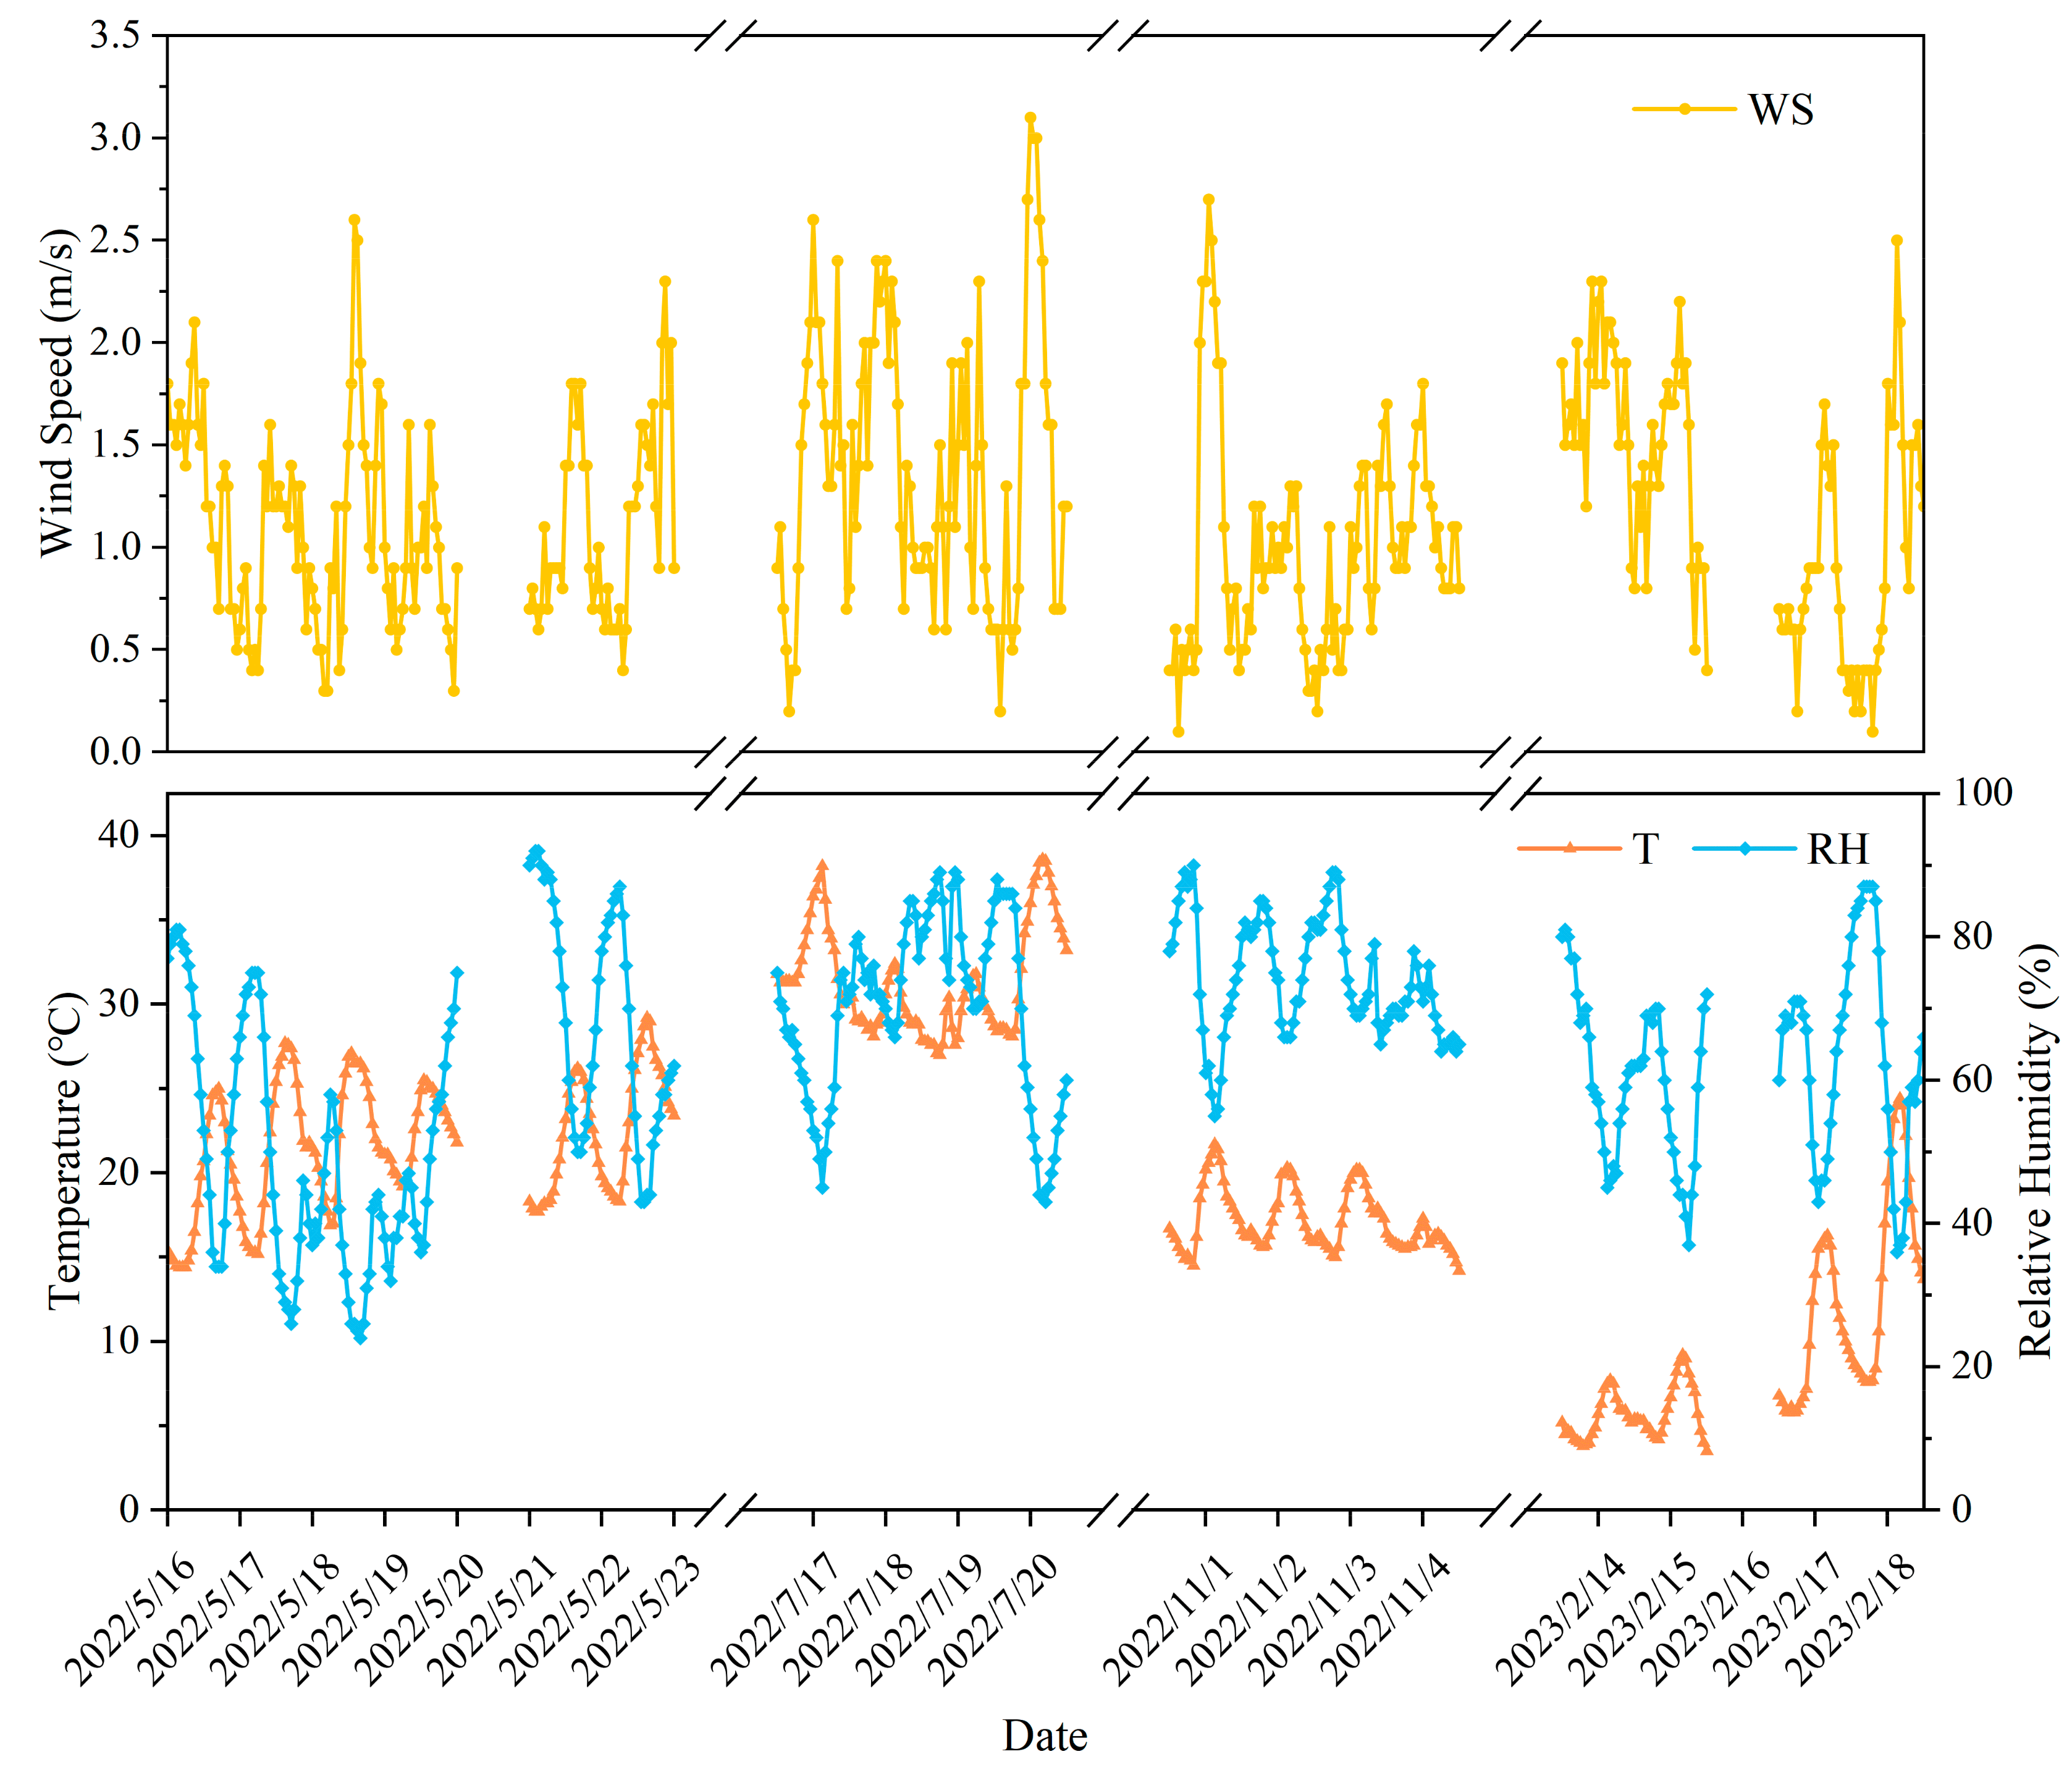
The meteorological conditions during the mobile monitoring period are shown in Figure 4. Hourly meteorological data for temperature, humidity, and wind speed were obtained from the ambient air quality monitoring station located near the sampling site. We calculated the correlation between pollutant concentrations and meteorological parameters by Spearman correlation analysis, as shown in Table 3. The results show that CO and NO2 concentrations were significantly negatively correlated with temperature and wind speed and significantly positively correlated with relative humidity. In particular, the correlation between temperature and NO2 was strong (r = −0.644, p < 0.01). The effects of temperature, humidity, and wind speed on SO2 concentration were weak.
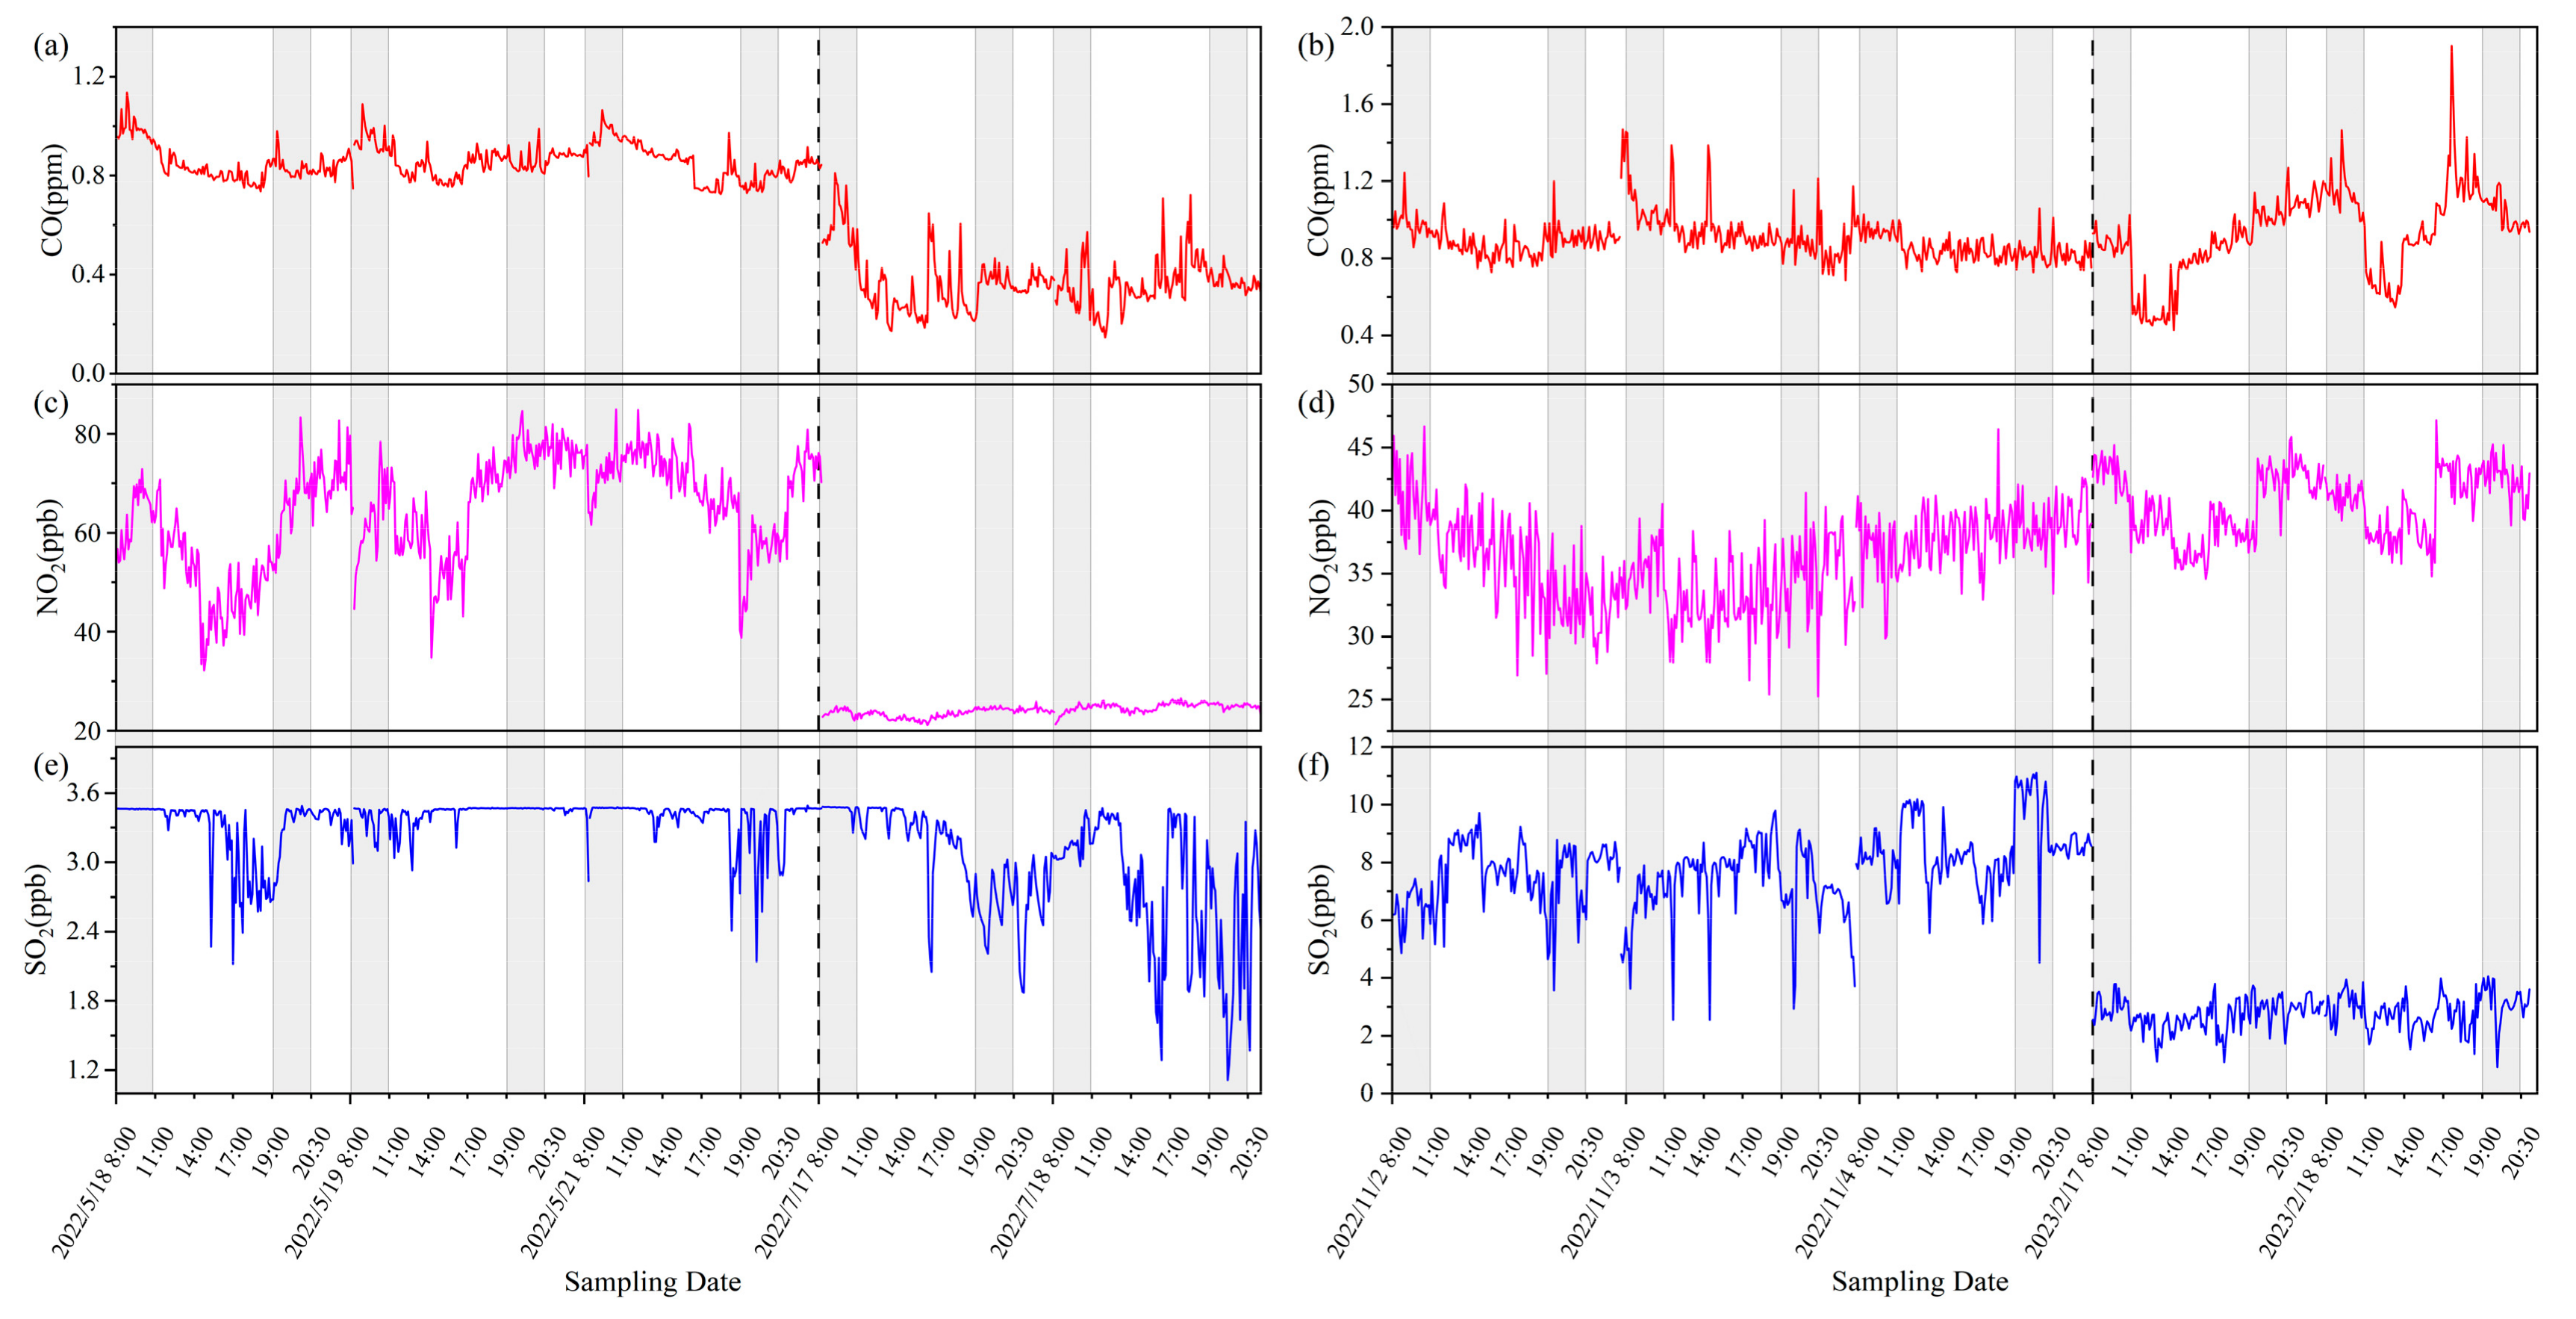
The time series of the CO, NO2, and SO2 concentrations during mobile observations are presented in Figure 5 with a time resolution of 2 s. The daily average concentrations and standard deviations (AVG ± SD) of three traffic-related air pollutants (TRAPs), CO, NO2, and SO2, are listed in Table 4. The diurnal variations during the 18-day mobile monitoring period can be observed by comparing the average concentrations of pollutants on different days. The pollutant concentrations all show small differences in the same season and significant differences across different seasons. There were two precipitation processes during the daytime on 20 May 2022 and the night of 18 July 2022, which had some removal effect on pollutants, but the impact was minimal. Air pollutants are not only affected by the amount of transportation, but the temperature, wind and humidity also play a very important role in affecting the dispersion or accumulation of pollution in the city. As shown in Figure 5, the time series of CO, NO2, and SO2 are all sawtooth-shaped. This could be the result of a variety of factors such as changes in the boundary layer and motor vehicle exhaust emissions [33]. Additionally, NO2 is also involved in photochemical reactions. Due to the high volume of traffic during the morning and evening peak travel times, it is easy to form extreme peak values of pollutants when cars idle at crossroads [34]. It should be noted that the SO2 concentration maintained its peak concentration for a long time in the morning and evening peaks of the spring. Because traffic pollutants were measured at close range in the non-motorized lanes, a more realistic picture of pollutant exposure during people’s non-motor vehicle travel can be obtained [35].
The large dispersion of CO concentrations in winter, NO2 concentrations in spring and SO2 concentrations in autumn in Figure 5 indicates that the spatial distribution of TRAPs differs in different seasons. The mobile monitoring results are shown in Table 4, where it can be seen that the micro-scale spatial variations in pollutants are more obvious in seasons with greater concentration dispersion by comparing standard deviations. Compared to other seasons, the number of tip peaks in CO concentrations was higher in winter, and the concentration fluctuation range was larger, while the variation range of SO2 concentration was smaller. The variation range of NO2 concentration was greater in spring than in other seasons. In addition, the average CO concentration on non-working days was slightly higher than the average concentration on working days during the same period (Table 3). The non-working days were 21 May, 22 May, 17 July 2022 and 18 February 2023.
As shown in Figure 6 and Table 5, the peak concentrations of CO, NO2 and SO2 usually occurred around 8:00 a.m. and 19:00 p.m., which was the peak traffic travel period, and the exhaust emissions from a large number of motor vehicles were the main cause of the increase in TRAP concentrations within a short period of time. Specifically, the concentration of CO was higher during 8:00–8:30 a.m. than in other time periods of the same day. This may be due to the calm atmospheric flow in the morning, which causes air pollutants to not spread easily. The concentration of NO2 was higher at 19:00 p.m. than at 8:00 a.m. The nitrogen oxides (NO and NO2) produced by the cylinder of the internal combustion engine during the driving process of the vehicle mainly exist in the form of NO [36]. From the perspective of fuel combustion, NO accounts for about 95% of initial NOX emissions, but NO reacts very easily with atmospheric oxygen to produce NO2. The ambient temperature in the afternoon is higher than that in the morning, and the accumulated morning NO is also oxidized to NO2, resulting in higher NO2 concentrations in the afternoon [37]. There are many factors that affect a single vehicle’s pollutant emissions, such as driving speed, vehicle age, fuel type, vehicle load, etc. [38]. The concentration of CO and NO2 was reduced to the minimum value at 14:00 p.m., the time of day when the temperature was the highest and solar radiation was stronger, and NOX and hydrocarbons reacted with each other to form ozone under the action of ultraviolet light, thus reducing NO2 concentrations [39]. The increase in atmospheric boundary layer height was also conducive to pollutant dispersion.
TRAPs have very obvious seasonal variation characteristics. CO and NO2 concentrations were strongly correlated with meteorological factors, while SO2 concentrations were less influenced by meteorological factors. Ambient air pollutant concentrations were lowest in summer, and the overall concentrations of pollutants measured in spring were higher than those of pollutants in summer. Specifically, the average concentrations of CO, NO2 and SO2 in spring were 241%, 254% and 124% higher than those in summer, respectively. This is generally due to the fact that the atmosphere is in an unstable stratification in summer, with intense vertical motion and enhanced turbulent activity in the atmosphere, which is conducive to the diffusion of pollutants [40]. Especially for NO2, strong solar radiation and high temperature in summer were favorable for the photochemical reactions of nitrogen oxides and volatile organic compounds, which generated near-ground ozone, so the concentration of nitrogen oxides decreased in summer. The NO2 concentrations were highest in spring. The SO2 concentrations were higher in autumn than in winter, probably due to the reduced human activity in winter influenced by epidemic prevention and the effect of long-range transport of air pollutants.

3.2. Spatial Variability of TRAPs

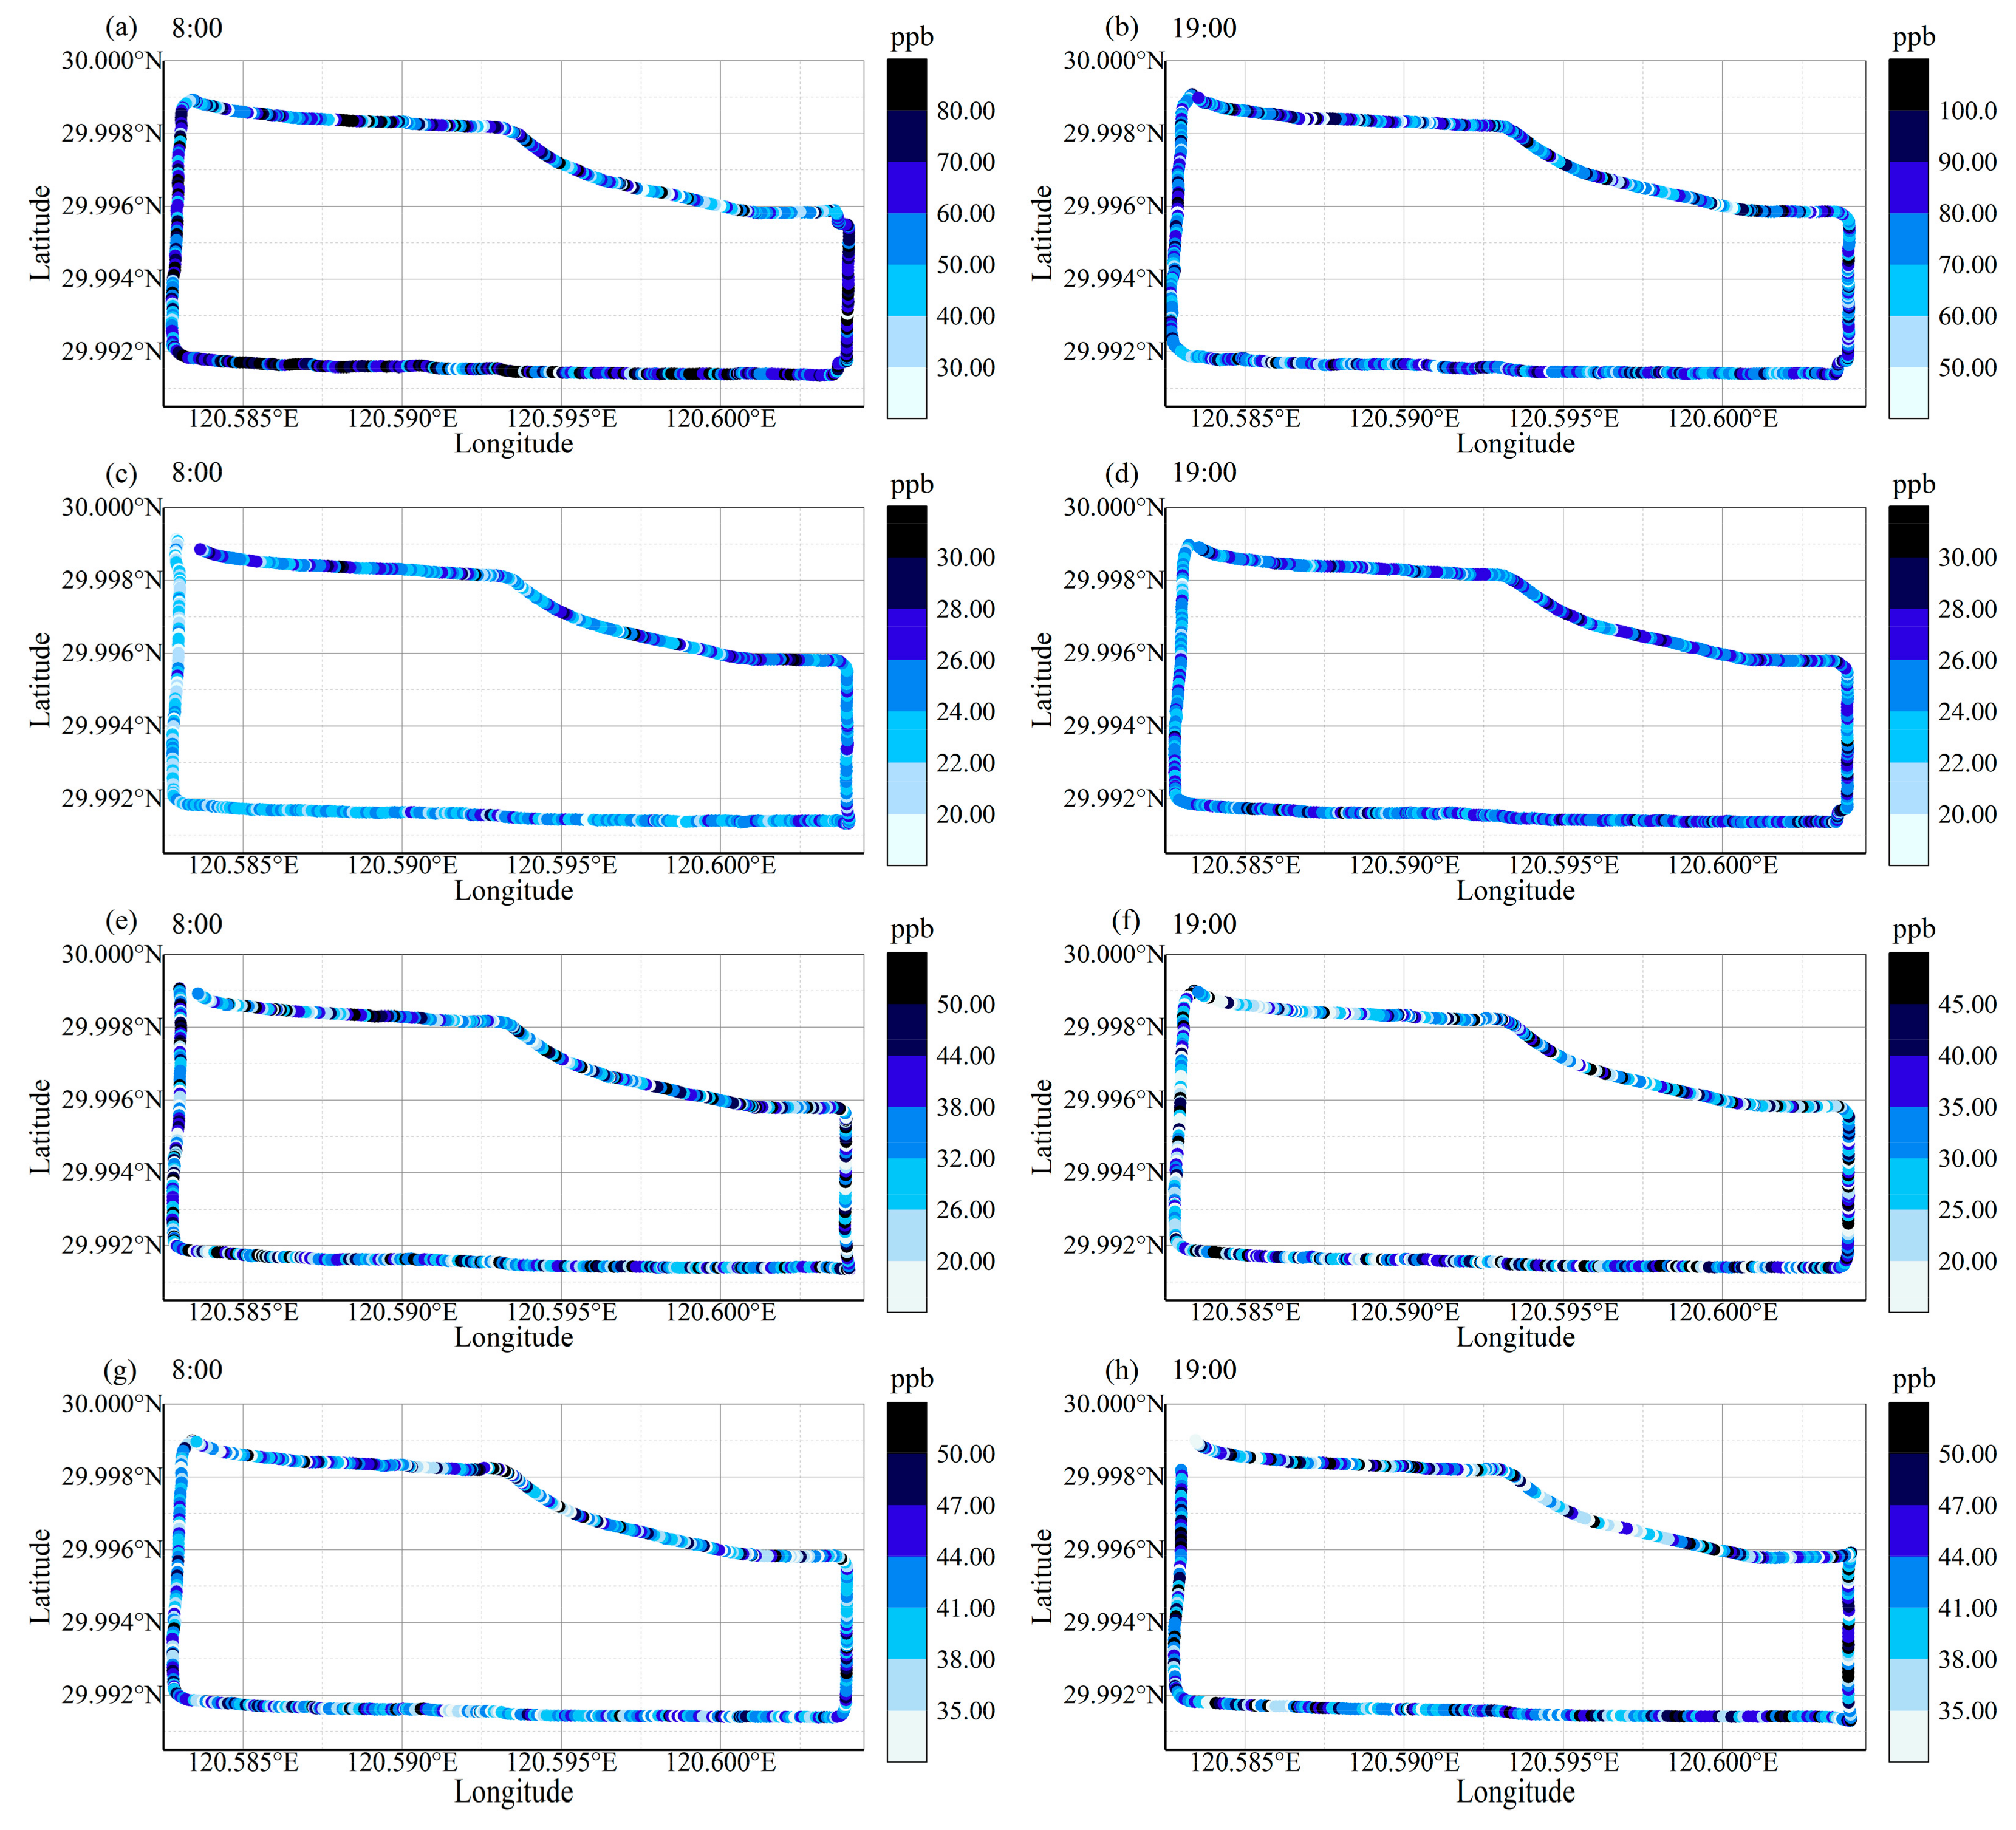
Figure 7 shows the spatial distribution of CO concentration during the morning and evening peaks in different seasons. Figure 7a,b show the spatial variation of CO concentration in the morning peak 8:00–8:30 h and the evening peak 19:00–19:30 h of spring travel, and it can be seen that there is a strong spatial variability in CO concentration. The pollutant concentrations shown are those measured on the same day to reduce the effect of background concentrations in the region on the measurement results. The shade of the line color corresponds to the level of CO concentration: dark color represents high concentration, while light color represents low concentration. During the morning and evening peak hours, there were high concentrations of CO for a short period of time, and the locations of the high concentration were the crossroads formed by the intersection of the moving route and other urban arterial roads. When cars encounter a red light at a crossroads, the gasoline in the cylinder is incompletely combusted and produces CO [34]. The higher CO concentration in the section of Renmin East Road in Figure 7a may be due to the fact that the road is a two-way two-lane road surrounded by residential areas, with a high population density and more vehicles traveling in the morning peak hour, and the section includes three traffic lights, a configuration prone to vehicle congestion.
The spatial variation in CO concentration during the summer travel peak is shown in Figure 7c,d. During the rush hour, the CO concentration presented the characteristic of “low east and high west”, probably due to the fact that the eastern area of the selected route was mostly residential and the western commercial and office areas were predominant. Secondly, the western road was the main urban road, and the concentration of CO was high on the main urban road during the morning and evening peaks. As shown in Figure 7e,f, the spatial distribution of CO concentration in autumn was uniform without high concentration aggregation. The spatial distribution of CO concentration during the winter travel peak is shown in Figure 7g,h. The concentration was higher on the Renmin East Road section during the evening peak, and the distribution was similar to that of the spring morning peak.
Nitrogen oxides (NOXs) are the important precursors of PM2.5 and O3. NO emitted by motor vehicles is easily oxidized to NO2 by ozone (O3) and peroxygenated organic matter (RO2) [41]. Some studies have found that during COVID-19 lockdown, the concentration of NO2 on the surface declined, indicating a significant effect of human activities on NO2 concentrations [42,43].
The distribution of NO2 concentrations along the road during the travel peak in different seasons is shown in Figure 8. The concentration of atmospheric nitrogen dioxide was affected by multiple factors, including complex atmospheric chemical reactions, meteorological conditions, and emission sources. In terms of spatial distribution, high and low concentrations of NO2 were relatively evenly distributed, and there were no particular discrepancies in different sections of the selected route.
Since the beginning of summer in 2022, many places in the northern hemisphere have experienced persistent high-temperature weather. The number of high-temperature days above 40 °C in July in Shaoxing City broke the historical record, the average number of high-temperature days above 35 °C was 18.4 days, and the average temperature in July was also a record high. Under high-temperature conditions in summer, the phenomena of high radiation conditions, low humidity, poor atmospheric diffusion conditions, and the presence of inversions were all conducive to ozone generation. The NO2 concentration was slightly higher during the evening peak than the morning peak in summer, and the NO accumulated during the day tended to react with O3 to produce NO2, which led to higher NO2 concentration at night.
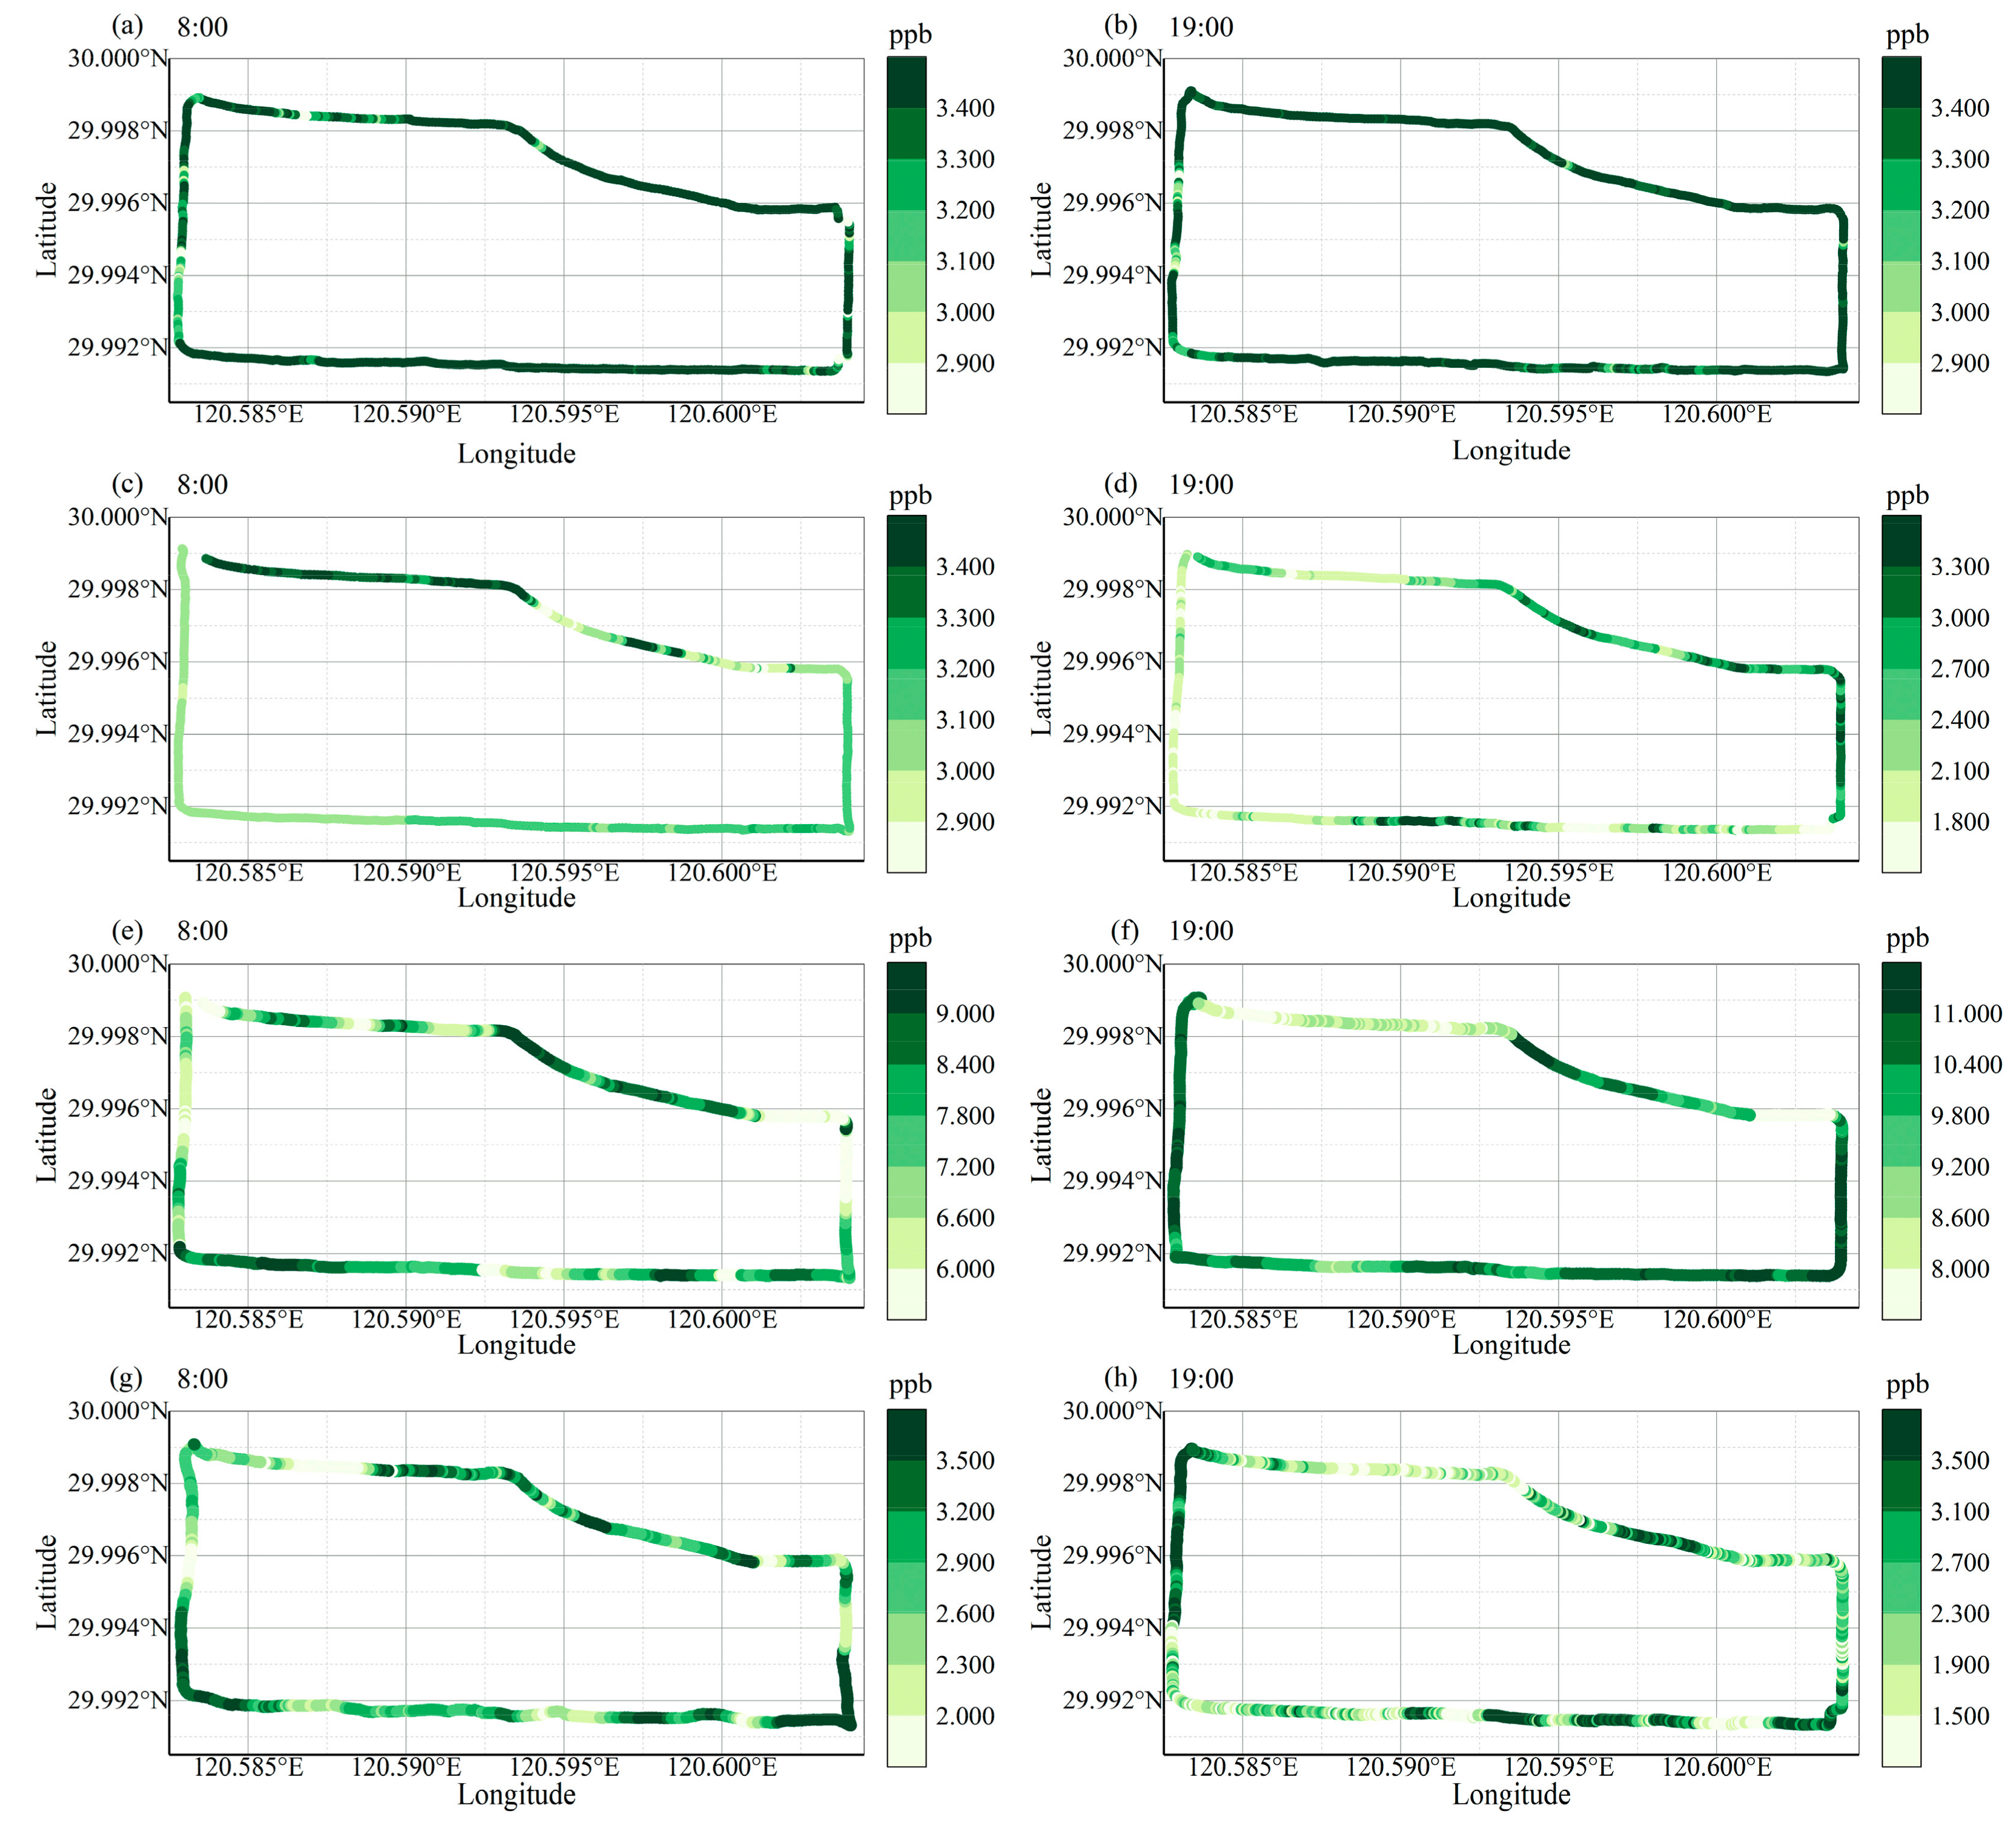
The SO2 in the atmosphere mainly comes from the sources of industrial pollution, transportation, and coal burning. As shown in Figure 9a,b, the spatial variation in SO2 concentration in spring was not obvious, and the maximum concentration of SO2 during the morning and evening travel peaks was around 3.4 ppb. The concentration of SO2 was higher in the morning peak hours in summer on the section of Renmin Middle Road (Figure 9c), which may be attributed to traffic congestion caused by the high volume of traffic in this section. The spatial variation in SO2 concentrations was more significant in autumn and winter. Continuous relatively high concentrations of SO2 were observed in different road sections in autumn, probably influenced not only by motor vehicle emissions but also by transport from other high-concentration areas in autumn. The SO2 concentrations were higher at road corners during the morning peak in winter (Figure 9g). In addition, the primary source of SO2 is industrial emissions, and urban SO2 comes mainly from diesel buses and trucks.
Shaoxing City is dominated by light industry and is located in the central area of Zhejiang Province, which is not susceptible to emissions from marine vessels, so the concentration of SO2 is not high. The SO2/NO2 ratio is an indicator used to determine whether air pollutants come from stationary sources (e.g., industrial emissions) or mobile sources (e.g., traffic emissions) [44], with high ratios (>0.60) indicating significant contributions from stationary sources and low ratios (0.04 to 0.12) indicating significant contributions from mobile sources [45,46]. The SO2/NO2 ratios were 0.05, 0.10, 0.21 and 0.07 for the four seasonal mobile monitoring periods, indicating that the measured pollutants were mainly from traffic.

4. Conclusions

We studied the emissions of CO, NO2 and SO2, common traffic-related air pollutants on roads in central Shaoxing to facilitate the understanding of commuter exposure to pollutants during daily travel. In general, CO, NO2 and SO2 all have traffic pollution as a source, but CO and NO2 are more closely associated with motor vehicle emissions. The concentrations of CO and NO2 were higher during 8:00–8:30 a.m. and 19:00–19:30 p.m. than in other time periods of the same day, mainly due to morning and evening travel peaks and poor dilution conditions. CO, NO2 and SO2 had seasonal variation characteristics. According to a Spearman correlation analysis, CO and NO2 were significantly negatively correlated with temperature and positively correlated with humidity, and the correlation between SO2 and temperature and humidity was weak.
Measurements of pollutant concentration with high spatial and temporal resolution help us understand people’s exposure to pollutants while commuting, especially for cyclists with long commute times. This study also provides a reference for relevant departments to formulate appropriate pollution prevention measures.
Mobile monitoring can help us understand spatial variability that is not provided by fixed monitors and is a suitable method for mapping urban air quality with high spatial resolution. One strength of our study is that we conducted multiple rounds of mobile measurement at different time periods over four seasons. Our measurements allowed us to better understand the temporal variation of pollutants on roads in the urban center area. The other strength is that the temporal resolution of the measurement is 2 s, which captured the fine and dynamic spatial variability of pollutants. This study is valuable for health risk assessment during daily commuting.
In addition, there are some limitations in this study. For example, traffic volume is an important factor affecting pollutant concentrations, but we did not record the relevant information in detail. In the future, similar studies will need to be conducted in different locations of the city to identify city hotspots and further analyze the impact of traffic volume and topography on pollutants.

Author Contributions

G.Z.: conceptualization, data curation and writing—original draft preparation. X.P.: writing—review and editing, data curation, software editing, project investigation and project administration. J.L.: writing—review and editing and supervision. B.X.: investigation and data curation. S.S.: project administration. L.C.: conceptualization, writing—review and editing, funding acquisition, supervision and project administration. Y.L. (Youhao Lu): data curation. Q.S. (Qianqian Sun): data curation. Q.S. (Qianqian Shang): data curation. Z.W.: data curation. K.Y.: investigation and data curation. H.W.: investigation and project administration. S.D.: investigation and project administration. H.L.: investigation and project administration. Y.L. (Yi Liu): investigation and project administration. All authors have read and agreed to the published version of the manuscript.

Funding

This work was supported by Xinjiang Uygur Autonomous Region Natural Science Foundation (2020D01A134), National Natural Science Foundation of China (41727805), Zhejiang Province “Lingyan” Research and Development Project (2022C03073), the Natural Science Foundation of Zhejiang Province, China (LZ20D050002), Shaoxing Science and Technology Plan Project (2022B41006) and General Project of Natural Science Foundation of Chongqing Bureau of Science and Technology (cstc2019jcyj-msxmX0872).

Institutional Review Board Statement

Not applicable.

Informed Consent Statement

Not applicable.

Data Availability Statement

The data presented in this study are available on request from the corresponding author. The data are not publicly available due to the fact that the study continues and the data is still being worked on.

Conflicts of Interest

The authors declare no conflict of interest.

References

  1. Parajuli, R.P.; Shin, H.H.; Maquiling, A.; Smith-Doiron, M. Multi-pollutant urban study on acute respiratory hospitalization and mortality attributable to ambient air pollution in Canada for 2001–2012. Atmos. Pollut. Res. 2021, 12, 101234. [Google Scholar] [CrossRef]
  2. Rodríguez-Villamizar, L.A.; Rojas-Roa, N.Y.; Fernández-Niño, J.A. Short-term joint effects of ambient air pollutants on emergency department visits for respiratory and circulatory diseases in Colombia, 2011–2014. Environ. Pollut. 2019, 248, 380–387. [Google Scholar] [CrossRef]
  3. Dominski, F.H.; Lorenzetti Branco, J.H.; Buonanno, G.; Stabile, L.; Gameiro Da Silva, M.; Andrade, A. Effects of air pollution on health: A mapping review of systematic reviews and meta-analyses. Environ. Res. 2021, 201, 111487. [Google Scholar] [CrossRef]
  4. Chen, Q.; Wang, Q.; Xu, B.; Xu, Y.; Ding, Z.; Sun, H. Air pollution and cardiovascular mortality in Nanjing, China: Evidence highlighting the roles of cumulative exposure and mortality displacement. Chemosphere 2021, 265, 129035. [Google Scholar] [CrossRef] [PubMed]
  5. Hu, C.-Y.; Fang, Y.; Li, F.-L.; Dong, B.; Hua, X.-G.; Jiang, W.; Zhang, H.; Lyu, Y.; Zhang, X.-J. Association between ambient air pollution and Parkinson’s disease: Systematic review and meta-analysis. Environ. Res. 2019, 168, 448–459. [Google Scholar] [CrossRef] [PubMed]
  6. Hales, S.; Atkinson, J.; Metcalfe, J.; Kuschel, G.; Woodward, A. Long term exposure to air pollution, mortality and morbidity in New Zealand: Cohort study. Sci. Total Environ. 2021, 801, 149660. [Google Scholar] [CrossRef]
  7. Knibbs, L.D.; Cortés De Waterman, A.M.; Toelle, B.G.; Guo, Y.; Denison, L.; Jalaludin, B.; Marks, G.B.; Williams, G.M. The Australian Child Health and Air Pollution Study (ACHAPS): A national population-based cross-sectional study of long-term exposure to outdoor air pollution, asthma, and lung function. Environ. Int. 2018, 120, 394–403. [Google Scholar] [CrossRef] [PubMed]
  8. Ju, K.; Lu, L.; Chen, T.; Duan, Z.; Chen, D.; Liao, W.; Zhou, Q.; Xu, Z.; Wang, W. Does long-term exposure to air pollution impair physical and mental health in the middle-aged and older adults?—A causal empirical analysis based on a longitudinal nationwide cohort in China. Sci. Total Environ. 2022, 827, 154312. [Google Scholar] [CrossRef] [PubMed]
  9. Strak, M.; Weinmayr, G.; Rodopoulou, S.; Chen, J.; De Hoogh, K.; Andersen, Z.J.; Atkinson, R.; Bauwelinck, M.; Bekkevold, T.; Bellander, T.; et al. Long term exposure to low level air pollution and mortality in eight European cohorts within the ELAPSE project: Pooled analysis. Brit. Med. J. 2021, 374, n1904. [Google Scholar] [CrossRef]
  10. Stafoggia, M.; Oftedal, B.; Chen, J.; Rodopoulou, S.; Renzi, M.; Atkinson, R.W.; Bauwelinck, M.; Klompmaker, J.O.; Mehta, A.; Vienneau, D.; et al. Long-term exposure to low ambient air pollution concentrations and mortality among 28 million people: Results from seven large European cohorts within the ELAPSE project. Lancet Planet. Health 2022, 6, e9–e18. [Google Scholar] [CrossRef]
  11. Marquart, H.; Stark, K.; Jarass, J. How are air pollution and noise perceived en route? Investigating cyclists’ and pedestrians’ personal exposure, wellbeing and practices during commute. J. Transp. Health 2022, 24, 101325. [Google Scholar] [CrossRef]
  12. Bala, G.P.; Rajnoveanu, R.M.; Tudorache, E.; Motisan, R.; Oancea, C. Air pollution exposure-the (in)visible risk factor for respiratory diseases. Environ. Sci. Pollut. Res. 2021, 28, 19615–19628. [Google Scholar] [CrossRef]
  13. Raysoni, A.U.; Sarnat, J.A.; Sarnat, S.E.; Garcia, J.H.; Holguin, F.; Luevano, S.F.; Li, W.W. Binational school-based monitoring of traffic-related air pollutants in El Paso, Texas (USA) and Ciudad Juarez, Chihuahua (Mexico). Environ. Pollut. 2011, 159, 2476–2486. [Google Scholar] [CrossRef]
  14. Van Den Bossche, J.; Peters, J.; Verwaeren, J.; Botteldooren, D.; Theunis, J.; De Baets, B. Mobile monitoring for mapping spatial variation in urban air quality: Development and validation of a methodology based on an extensive dataset. Atmos. Environ. 2015, 105, 148–161. [Google Scholar] [CrossRef] [Green Version]
  15. Rivas, I.; Kumar, P.; Hagen-Zanker, A.; Andrade, M.D.F.; Slovic, A.D.; Pritchard, J.P.; Geurs, K.T. Determinants of black carbon, particle mass and number concentrations in London transport microenvironments. Atmos. Environ. 2017, 161, 247–262. [Google Scholar] [CrossRef] [Green Version]
  16. Zwack, L.M.; Paciorek, C.J.; Spengler, J.D.; Levy, J.I. Characterizing local traffic contributions to particulate air pollution in street canyons using mobile monitoring techniques. Atmos. Environ. 2011, 45, 2507–2514. [Google Scholar] [CrossRef]
  17. Wei, P.; Brimblecombe, P.; Yang, F.; Anand, A.; Xing, Y.; Sun, L.; Sun, Y.; Chu, M.; Ning, Z. Determination of local traffic emission and non-local background source contribution to on-road air pollution using fixed-route mobile air sensor network. Environ. Pollut. 2021, 290, 118055. [Google Scholar] [CrossRef] [PubMed]
  18. Yu, Y.T.; Xiang, S.; Li, R.; Zhang, S.; Zhang, K.M.; Si, S.; Wu, X.; Wu, Y. Characterizing spatial variations of city-wide elevated PM10 and PM2.5 concentrations using taxi-based mobile monitoring. Sci. Total Environ. 2022, 829, 154478. [Google Scholar] [CrossRef]
  19. Deshmukh, P.; Kimbrough, S.; Krabbe, S.; Logan, R.; Isakov, V.; Baldauf, R. Identifying air pollution source impacts in urban communities using mobile monitoring. Sci. Total Environ. 2020, 715, 136979. [Google Scholar] [CrossRef]
  20. Van Poppel, M.; Peters, J.; Bleux, N. Methodology for setup and data processing of mobile air quality measurements to assess the spatial variability of concentrations in urban environments. Environ. Pollut. 2013, 183, 224–233. [Google Scholar] [CrossRef]
  21. Apte, J.S.; Messier, K.P.; Gani, S.; Brauer, M.; Kirchstetter, T.W.; Lunden, M.M.; Marshall, J.D.; Portier, C.J.; Vermeulen, R.C.H.; Hamburg, S.P. High-Resolution Air Pollution Mapping with Google Street View Cars: Exploiting Big Data. Environ. Sci. Technol. 2017, 51, 6999–7008. [Google Scholar] [CrossRef] [PubMed]
  22. Samad, A.; Vogt, U. Mobile air quality measurements using bicycle to obtain spatial distribution and high temporal resolution in and around the city center of Stuttgart. Atmos. Environ. 2021, 244, 117915. [Google Scholar] [CrossRef]
  23. Li, B.; Lei, X.-N.; Xiu, G.-L.; Gao, C.-Y.; Gao, S.; Qian, N.-S. Personal exposure to black carbon during commuting in peak and off-peak hours in Shanghai. Sci. Total Environ. 2015, 524–525, 237–245. [Google Scholar] [CrossRef]
  24. Yang, Z.; He, Z.; Zhang, K.; Zeng, L.; De Nazelle, A. Investigation into Beijing commuters’ exposure to ultrafine particles in four transportation modes: Bus, car, bicycle and subway. Atmos. Environ. 2021, 266, 118734. [Google Scholar] [CrossRef]
  25. Tan, Y.; Lipsky, E.M.; Saleh, R.; Robinson, A.L.; Presto, A.A. Characterizing the Spatial Variation of Air Pollutants and the Contributions of High Emitting Vehicles in Pittsburgh, PA. Environ. Sci. Technol. 2014, 48, 14186–14194. [Google Scholar] [CrossRef] [PubMed]
  26. Yu, C.H.; Fan, Z.; Lioy, P.J.; Baptista, A.; Greenberg, M.; Laumbach, R.J. A novel mobile monitoring approach to characterize spatial and temporal variation in traffic-related air pollutants in an urban community. Atmos. Environ. 2016, 141, 161–173. [Google Scholar] [CrossRef]
  27. Crocchianti, S.; Del Sarto, S.; Ranalli, M.G.; Moroni, B.; Castellini, S.; Petroselli, C.; Cappelletti, D. Spatiotemporal correlation of urban pollutants by long-term measurements on a mobile observation platform. Environ. Pollut. 2021, 268, 115645. [Google Scholar] [CrossRef]
  28. Desouza, P.; Lu, R.; Kinney, P.; Zheng, S. Exposures to multiple air pollutants while commuting: Evidence from Zhengzhou, China. Atmos. Environ. 2021, 247, 118168. [Google Scholar] [CrossRef]
  29. Chen, Y.; Gu, P.; Schulte, N.; Zhou, X.; Mara, S.; Croes, B.E.; Herner, J.D.; Vijayan, A. A new mobile monitoring approach to characterize community-scale air pollution patterns and identify local high pollution zones. Atmos. Environ. 2022, 272, 118936. [Google Scholar] [CrossRef]
  30. Pang, X.B.; Chen, L.; Shi, K.L.; Wu, F.; Chen, J.M.; Fang, S.X.; Wang, J.L.; Xu, M. A lightweight low-cost and multipollutant sensor package for aerial observations of air pollutants in atmospheric boundary layer. Sci. Total Environ. 2021, 764, 142828. [Google Scholar] [CrossRef]
  31. Lu, Y.; Pang, X.; Wu, Z.; Wang, B. Measurement of Fine Particulate Matter Emission from Chimneys in Textile Printing and Dyeing Industrial Area by UAV. Ecol. Environ. Monit. Three Gorges. Available online: http://kns.cnki.net/kcms/detail/50.1214.x.20221125.1034.002.html (accessed on 26 June 2023).
  32. Chen, L.; Li, J.; Pang, X.; Shi, K.; Chen, J.; Wang, J.; Xu, M. Impact of COVID-19 Lockdown on Air Pollutants in a Coastal Area of the Yangtze River Delta, China, Measured by a Low-Cost Sensor Package. Atmosphere 2021, 12, 345. [Google Scholar] [CrossRef]
  33. Patton, A.P.; Perkins, J.; Zamore, W.; Levy, J.I.; Brugge, D.; Durant, J.L. Spatial and temporal differences in traffic-related air pollution in three urban neighborhoods near an interstate highway. Atmos. Environ. 2014, 99, 309–321. [Google Scholar] [CrossRef] [PubMed] [Green Version]
  34. Wang, Z.Y.; Lu, Q.C.; He, H.D.; Wang, D.S.; Gao, Y.; Peng, Z.R. Investigation of the spatiotemporal variation and influencing factors on fine particulate matter and carbon monoxide concentrations near a road intersection. Front. Earth Sci. 2017, 11, 63–75. [Google Scholar] [CrossRef]
  35. Pattinson, W.; Longley, I.; Kingham, S. Using mobile monitoring to visualise diurnal variation of traffic pollutants across two near-highway neighbourhoods. Atmos. Environ. 2014, 94, 782–792. [Google Scholar] [CrossRef]
  36. Lee, J.D.; Helfter, C.; Purvis, R.M.; Beevers, S.D.; Carslaw, D.C.; Lewis, A.C.; Moller, S.J.; Tremper, A.; Vaughan, A.R.; Nemitz, E. Measurement of NO(x) fluxes from a tall tower in Central London, UK and comparison with emissions inventories. Environ. Sci. Technol. 2015, 49, 1025–1034. [Google Scholar] [CrossRef] [PubMed] [Green Version]
  37. Wang, X.; Yin, S.; Zhang, R.-Q.; Yuan, M.; Ying, Q. Assessment of summertime O3 formation and the O3-NOX-VOC sensitivity in Zhengzhou, China using an observation-based model. Sci. Total Environ. 2021, 813, 152449. [Google Scholar] [CrossRef] [PubMed]
  38. Wang, J.M.; Jeong, C.-H.; Zimmerman, N.; Healy, R.M.; Evans, G.J. Real world vehicle fleet emission factors: Seasonal and diurnal variations in traffic related air pollutants. Atmos. Environ. 2018, 184, 77–86. [Google Scholar] [CrossRef]
  39. Lu, Y.; Pang, X.; Lyu, Y.; Li, J.; Xing, B.; Chen, J.; Mao, Y.; Shang, Q.; Wu, H. Characteristics and sources analysis of ambient volatile organic compounds in a typical industrial park: Implications for ozone formation in 2022 Asian Games. Sci. Total Environ. 2022, 848, 157746. [Google Scholar] [CrossRef]
  40. Zhang, H.; Wang, Y.; Hu, J.; Ying, Q.; Hu, X.M. Relationships between meteorological parameters and criteria air pollutants in three megacities in China. Environ. Res. 2015, 140, 242–254. [Google Scholar] [CrossRef]
  41. Wang, Q.; Pang, X.; Li, J.; Lyu, Y.; Zhang, B.; Wang, J. Variation Characteristics of Air Pollutants in Hangzhou During the 13th Five-Year Plan Period. Ecol. Environ. Monit. Three Gorges 2022, 7, 23–34. [Google Scholar]
  42. Kovács, K.D. Determination of the human impact on the drop in NO2 air pollution due to total COVID-19 lockdown using Human-Influenced Air Pollution Decrease Index (HIAPDI). Environ. Pollut. 2022, 306, 119441. [Google Scholar] [CrossRef]
  43. Wang, J.; Alli, A.S.; Clark, S.; Hughes, A.; Ezzati, M.; Beddows, A.; Vallarino, J.; Nimo, J.; Bedford-Moses, J.; Baah, S.; et al. Nitrogen oxides (NO and NO2) pollution in the Accra metropolis: Spatiotemporal patterns and the role of meteorology. Sci. Total Environ. 2022, 803, 149931. [Google Scholar] [CrossRef] [PubMed]
  44. Aneja, V.P.; Agarwal, A.; Roelle, P.A.; Phillips, S.B.; Tong, Q.; Watkins, N.; Yablonsky, R. Measurements and analysis of criteria pollutants in New Delhi, India. Environ. Int. 2001, 27, 35–42. [Google Scholar] [CrossRef] [PubMed]
  45. Wang, Y.; Yuan, Y.; Wang, Q.; Liu, C.; Zhi, Q.; Cao, J. Changes in air quality related to the control of coronavirus in China: Implications for traffic and industrial emissions. Sci. Total Environ. 2020, 731, 139133. [Google Scholar] [CrossRef] [PubMed]
  46. Wang, Y.; Ali, M.A.; Bilal, M.; Qiu, Z.F.; Mhawish, A.; Almazroui, M.; Shahid, S.; Islam, M.N.; Zhang, Y.Z.; Haque, M.N. Identification of NO2 and SO2 Pollution Hotspots and Sources in Jiangsu Province of China. Remote Sens. 2021, 13, 3742. [Google Scholar] [CrossRef]
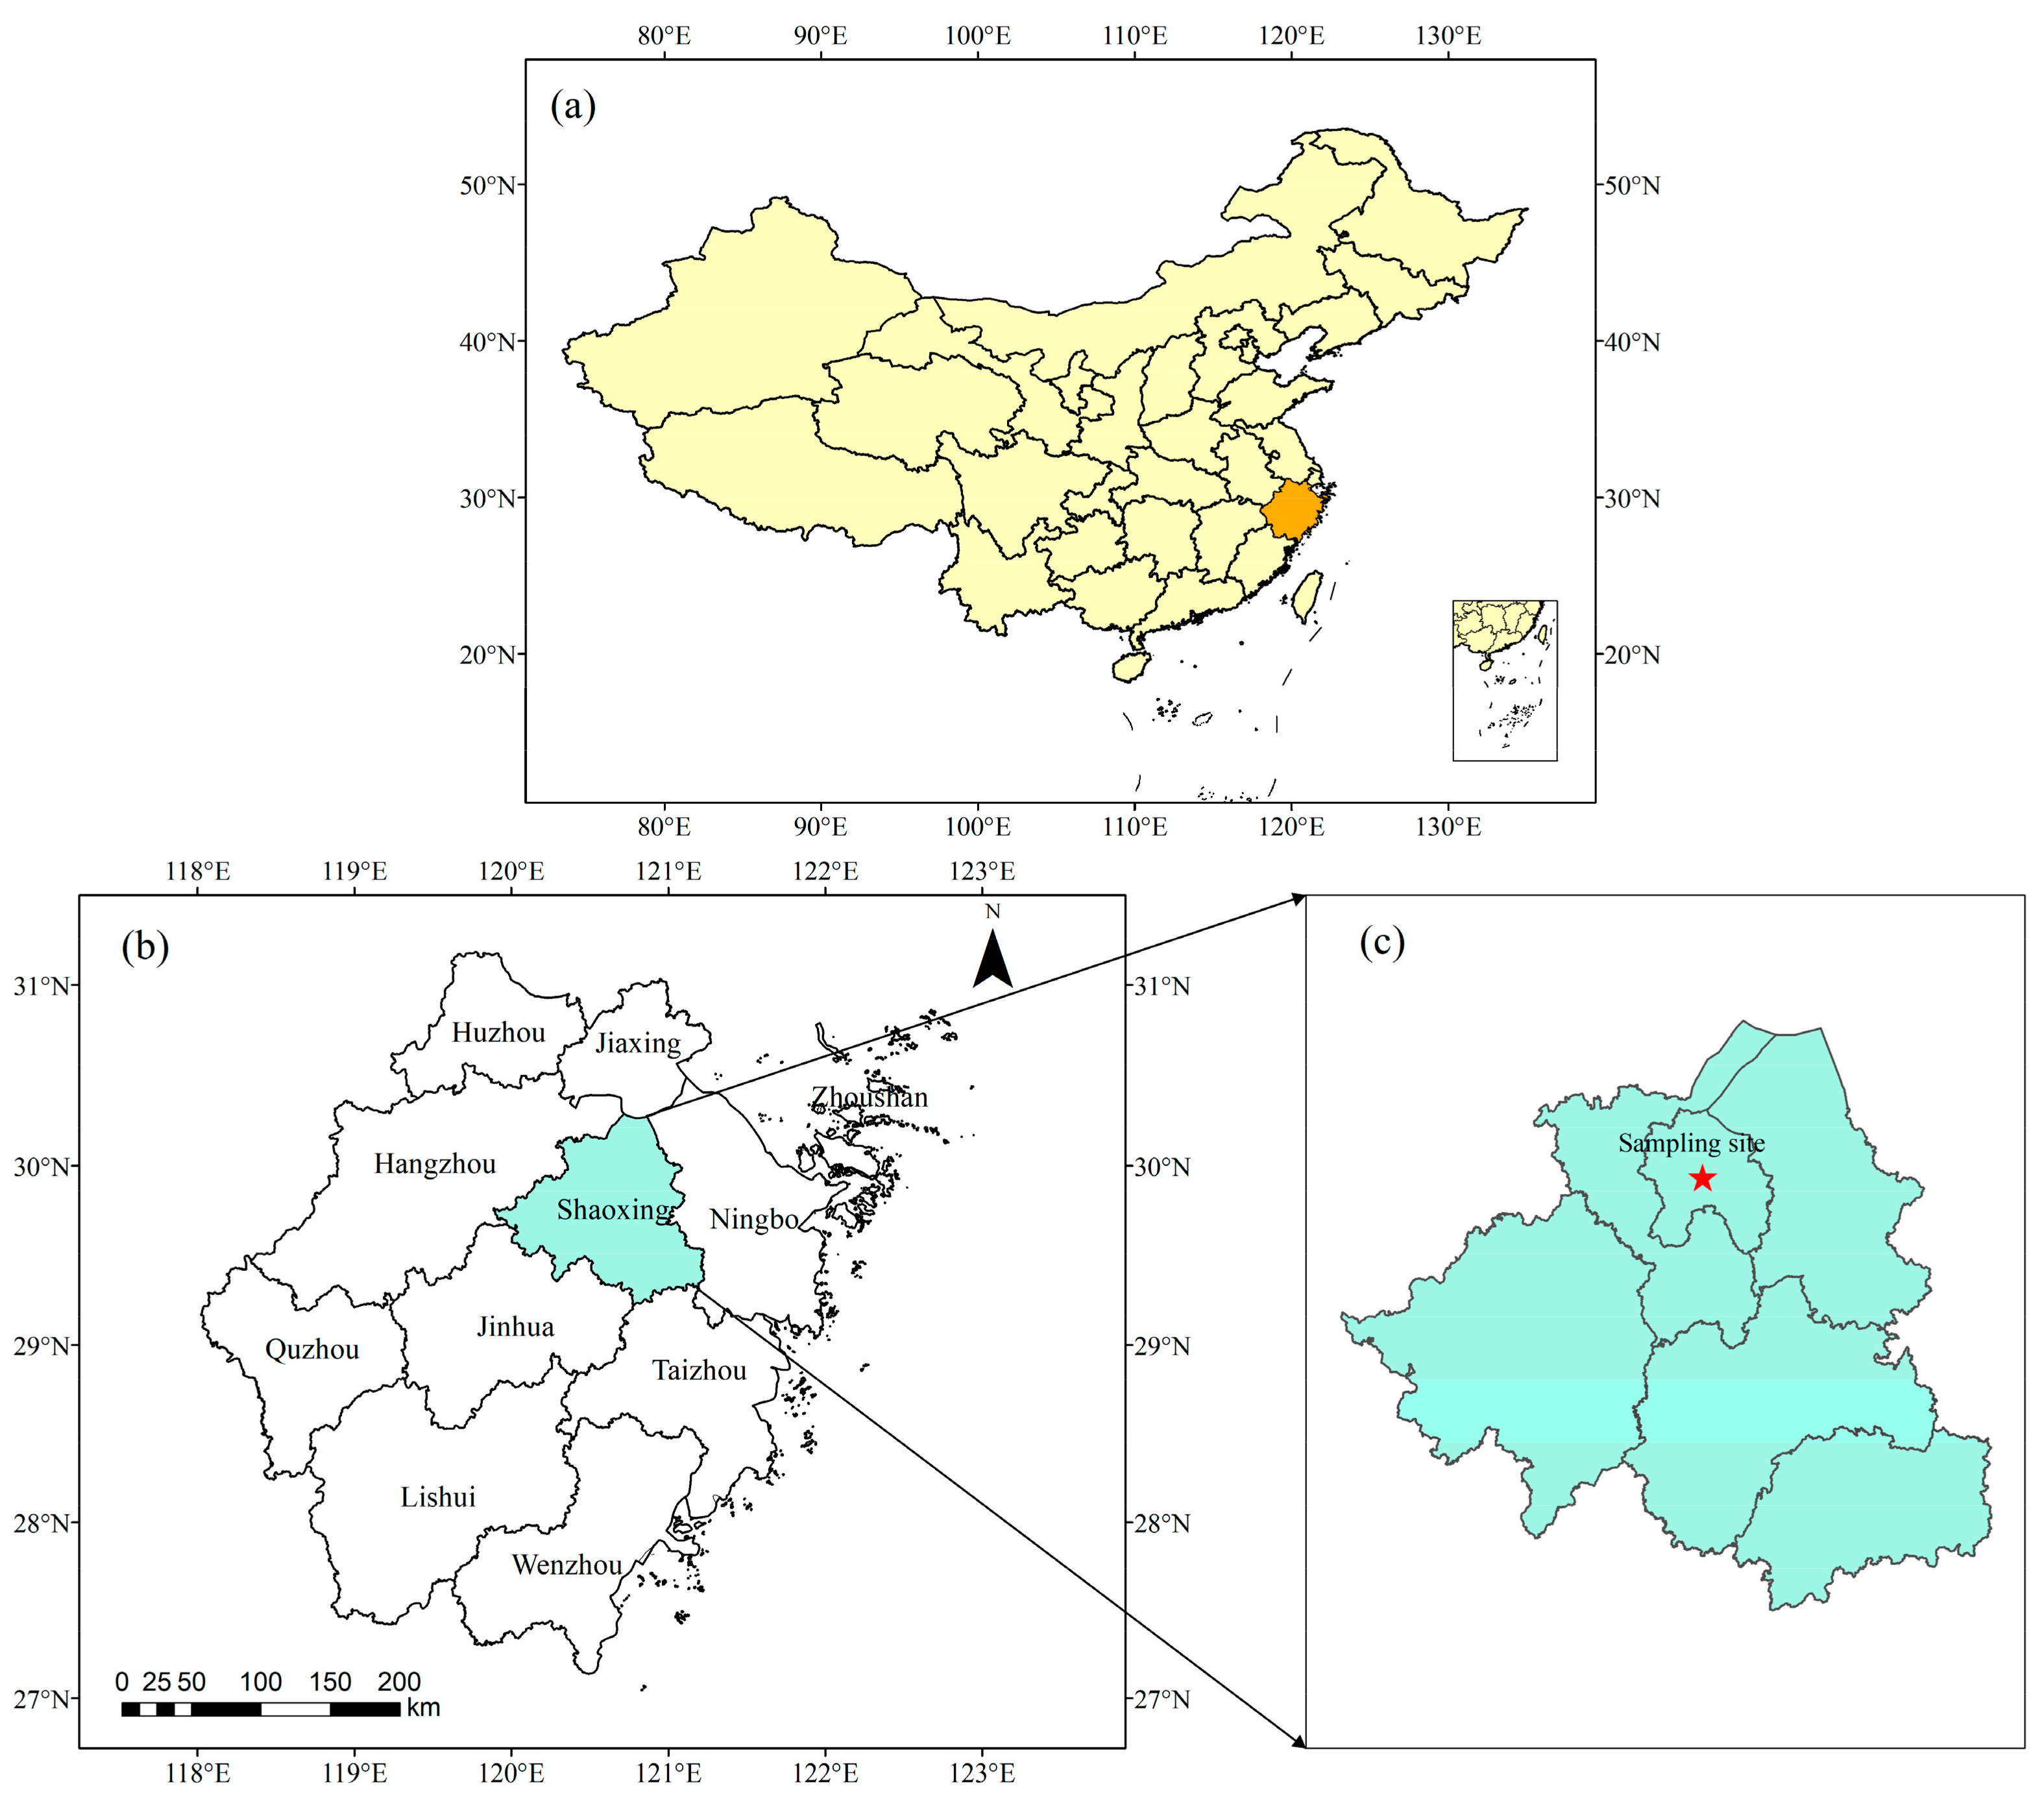
Figure 1. Overview of the location of sampling site. (a) Location of Zhejiang Province and (b) location of Shaoxing City in Zhejiang Province; (c) the sampling site is located in Shaoxing City.
Atmosphere 14 01093 g001
Figure 2. Mobile monitoring routes (red) and passing roads along the way in Shaoxing City, China. Passing roads include Renmin Road, Pingjiang Road, Yan’an Road and Zhongxing Road. Zhongxing Road is urban arterial.
Atmosphere 14 01093 g002
Figure 3. The sensor package fixed position on the bicycle (left panel) and the air inlet position of the sensor package (right panels).
Atmosphere 14 01093 g003
Figure 4. Wind speed, temperature and relative humidity at the measurement location during the monitoring period.
Atmosphere 14 01093 g004
Figure 5. Time series of CO, NO2 and SO2 concentrations during mobile monitoring in Shaoxing City. The concentrations of air pollutions in different seasons are divided by vertical dashed line.
Atmosphere 14 01093 g005
Figure 6. Box plots of (a) CO, (b) NO2 and (c) SO2 measurements at different sampling times. The specific sampling time points are shown at the top of the box plots. In the box plots, the square represents the mean value and the diamond represents the outlier. The black boxes represent pollutant concentrations during the spring, the red boxes represent the pollutant concentrations during the summer, the blue boxes represent the pollutant concentrations during the autumn and the green boxes represent the pollutant concentrations during the winter.
Atmosphere 14 01093 g006
Figure 7. The concentration distribution of CO on roads in the center area of Shaoxing City during the spring (a,b), summer (c,d), autumn (e,f) and winter (g,h) peak hours. The peak periods include morning peak 8:00–8:30 and evening peak 19:00–19:30.
Atmosphere 14 01093 g007
Figure 8. The concentration distribution of NO2 on roads in the center area of Shaoxing City during the spring (a,b), summer (c,d), autumn (e,f) and winter (g,h) peak hours. The peak periods include morning peak 8:00–8:30 and evening peak 19:00–19:30.
Atmosphere 14 01093 g008
Figure 9. The concentration distribution of SO2 on roads in the center area of Shaoxing City during the spring (a,b), summer (c,d), autumn (e,f) and winter (g,h) peak hours. The peak periods include morning peak 8:00–8:30 and evening peak 19:00–19:30.
Atmosphere 14 01093 g009
Table 1. The meteorological conditions during the monitoring period.
DateWeatherTemperature (°C)Relative Humidity (%)Wind Scale
16 May 2022Clear1958Level II
17 May 2022Cloudy2151Level I
18 May 2022Cloudy2238Level I
19 May 2022Cloudy2250Level I
21 May 2022Overcast2272Level I
22 May 2022Cloudy2464Level I
17 July 2022Cloudy3361Level I
18 July 2022Overcast2974Level I
19 July 2022Overcast2979Level I
20 July 2022Clear3363Level II
1 November 2022Cloudy1779Level I
2 November 2022Cloudy1682Level I
3 November 2022Cloudy1780Level I
4 November 2022Cloudy1572Level II
14 February 2023Cloudy564Level II
15 February 2023Clear562Level I
17 February 2023Clear968Level I
18 February 2023Cloudy1469Level I
Table 2. The parameters of sensors used in the mobile measurement.
MeasuringManufacturerWeight/gEC/WRangeLODTR/s
COAlphasense120.50–20 ppm1 ppb1
NO2Alphasense100.50–20 ppm0.5 ppb1
SO2Alphasense120.50–200 ppm5 ppb1
TemperatureTexas Instru.50.1−10–100 °C0.3 °C1
HumidityHoneywell50.10–100%2%1
PressureNXP50.20–700 kPa150 Pa1
EC: energy consumption; LOD: limit of detection; TR: time resolution.
Table 3. Correlation coefficients between air pollutant concentrations and meteorological parameters.
ParameterTemperatureRelative HumidityWind Speed
CO−0.424 **0.432 **−0.221 **
NO2−0.644 **0.401 **−0.426 **
SO20.107 **−0.084 **−0.050 *
** Significant correlation at 0.01 level (two sides). * Significant correlation at 0.05 level (two sides).
Table 4. The daily average concentrations of CO, NO2 and SO2 during the observation period (average ± standard deviations; n: number of samples).
NumberDateCO (ppm)NO2 (ppb)SO2 (ppb)
116 May 20220.84 ± 0.07 (n = 3874)44.07 ± 23.78 (n = 3874)3.44 ± 0.06 (n = 3874)
217 May 20220.86 ± 0.06 (n = 4683)62.23 ± 18.17 (n = 4683)3.14 ± 0.45 (n = 4683)
318 May 20220.86 ± 0.11 (n = 5181)58.55 ± 19.03 (n = 5181)3.28 ± 0.33 (n = 5181)
419 May 20220.87 ± 0.08 (n = 5155)66.62 ± 18.28 (n = 5155)3.42 ± 0.11 (n = 5155)
521 May 20220.86 ± 0.11 (n = 5956)69.07 ± 16.60 (n = 5956)3.34 ± 0.28 (n = 5956)
622 May 20220.92 ± 0.34 (n = 4538)59.84 ± 23.70 (n = 4538)3.40 ± 0.17 (n = 4538)
717 July 20220.40 ± 0.21 (n = 5087)23.56 ± 2.02 (n = 5087)3.08 ± 0.42 (n = 5087)
818 July 20220.37 ± 0.12 (n = 4588)24.85 ± 1.90 (n = 4588)2.76 ± 0.64 (n = 4588)
919 July 20220.36 ± 0.15 (n = 4723)24.97 ± 2.09 (n = 4723)2.52 ± 1.15 (n = 4723)
1020 July 20220.30 ± 0.22 (n = 4373)22.70 ± 2.57 (n = 4373)2.10 ± 1.29 (n = 4373)
111 November 20220.94 ± 0.21 (n = 5061)34.99 ± 12.57 (n = 5061)7.37 ± 2.17 (n = 5061)
122 November 20220.89 ± 0.19 (n = 4572)36.04 ± 12.63 (n = 4572)7.50 ± 1.25 (n = 4572)
133 November 20220.93 ± 0.24 (n = 4817)35.33 ± 12.68 (n = 4817)7.36 ± 2.01 (n = 4817)
144 November 20220.85 ± 0.21 (n = 5362)37.90 ± 11.91 (n = 5362)8.52 ± 1.32 (n = 5362)
1514 February 20230.84 ± 0.20 (n = 5793)37.84 ± 5.98 (n = 5793)2.78 ± 1.35 (n = 5793)
1615 February 20230.87 ± 0.26 (n = 4686)40.26 ± 6.32 (n = 4686)2.73 ± 0.67 (n = 4686)
1717 February 20231.00 ± 0.23 (n = 4119)40.80 ± 5.89 (n = 4119)2.86 ± 0.71 (n = 4119)
1818 February 20231.22 ± 0.32 (n = 3606)41.92 ± 10.87 (n = 3606)2.92 ± 0.84 (n = 3606)
Table 5. Daily and seasonal variation in CO, NO2 and SO2 concentration (average ± standard deviations; n: number of samples).
Sampling Time8:0011:0014:0017:0019:0020:30
CO (ppm)May1.05 ± 0.30
(n = 5112)
0.85 ± 0.05
(n = 5044)
0.79 ± 0.04
(n = 4810)
0.82 ± 0.06
(n = 5528)
0.86 ± 0.05
(n = 4252)
0.86 ± 0.05
(n = 3346)
July0.55 ± 0.24
(n = 2930)
0.37 ± 0.23
(n = 3025)
0.26 ± 0.06
(n = 3083)
0.33 ± 0.14
(n = 2943)
0.33 ± 0.11
(n = 4456)
0.33 ± 0.08
(n = 2337)
November1.02 ± 0.23
(n = 4095)
0.86 ± 0.19
(n = 3178)
0.84 ± 0.21
(n = 2983)
0.88 ± 0.18
(n = 3563)
0.89 ± 0.21
(n = 3080)
0.87 ± 0.22
(n = 2921)
February1.03 ± 0.39
(n = 3209)
0.68 ± 0.22
(n = 3053)
0.88 ± 0.28
(n = 2925)
1.01 ± 0.22
(n = 3732)
1.12 ± 0.16
(n = 2724)
1.04 ± 0.08
(n = 2564)
NO2 (ppb)May65.22 ± 19.34
(n = 5112)
63.21 ± 17.22
(n = 5044)
43.39 ± 23.15
(n = 4810)
52.58 ± 19.05
(n = 5528)
71.24 ± 15.95
(n = 4252)
72.15 ± 15.57
(n = 3346)
July24.63 ± 2.03
(n = 2930)
24.73 ± 2.17
(n = 3025)
22.57 ± 2.06
(n = 3083)
23.52 ± 2.81
(n = 2943)
24.24 ± 2.15
(n = 4456)
24.56 ± 1.93
(n = 2337)
November38.22 ± 12.50
(n = 4095)
37.37 ± 12.30
(n = 3178)
36.68 ± 12.50
(n = 2983)
34.23 ± 12.46
(n = 3563)
34.42 ± 12.42
(n = 3080)
35.20 ± 12.33
(n = 2921)
February40.88 ± 6.42
(n = 3209)
37.97 ± 6.37
(n = 3053)
37.10 ± 7.35
(n = 2925)
39.32 ± 6.84
(n = 3732)
42.23 ± 8.36
(n = 2724)
41.75 ± 7.64
(n = 2564)
SO2 (ppb)May3.45 ± 0.08
(n = 5112)
3.41 ± 0.11
(n = 5044)
3.38 ± 0.24
(n = 4810)
3.25 ± 0.32
(n = 5528)
3.32 ± 0.33
(n = 4252)
3.14 ± 0.47
(n = 3346)
July3.39 ± 0.16
(n = 2930)
3.39 ± 0.13
(n = 3025)
2.96 ± 0.63
(n = 3083)
2.23 ± 1.00
(n = 2943)
1.91 ± 1.06
(n = 4456)
2.15 ± 0.99
(n = 2337)
November7.27 ± 1.33
(n = 4095)
7.63 ± 2.32
(n = 3178)
7.80 ± 1.23
(n = 2983)
7.61 ± 1.83
(n = 3563)
8.33 ± 2.28
(n = 3080)
7.76 ± 1.41
(n = 2921)
February3.13 ± 0.90
(n = 3209)
2.30 ± 0.75
(n = 3053)
2.46 ± 0.71
(n = 2925)
2.90 ± 1.06
(n = 3732)
2.85 ± 0.98
(n = 2724)
3.26 ± 1.03
(n = 2564)
Disclaimer/Publisher’s Note: The statements, opinions and data contained in all publications are solely those of the individual author(s) and contributor(s) and not of MDPI and/or the editor(s). MDPI and/or the editor(s) disclaim responsibility for any injury to people or property resulting from any ideas, methods, instructions or products referred to in the content.