Article

A Numerical Study of Critical Variables on Artificial Cold Cloud Precipitation Enhancement in the Qilian Mountains, China

1
School of Computer and Artificial Intelligence, Zhengzhou University, Zhengzhou 450001, China
2
School of Geoscience and Technology, Zhengzhou University, Zhengzhou 450001, China
3
State Key Laboratory of Atmospheric Boundary Layer Physics and Atmospheric Chemistry, Institute of Atmospheric Physics, Chinese Academy of Sciences, Beijing 100029, China
4
College of Atmospheric Sciences, Chengdu University of Information Technology, Chengdu 610225, China
*
Author to whom correspondence should be addressed.
Atmosphere 2023, 14(7), 1086; https://doi.org/10.3390/atmos14071086
Submission received: 30 May 2023 / Revised: 24 June 2023 / Accepted: 25 June 2023 / Published: 28 June 2023
(This article belongs to the Section Meteorology)

Abstract

:
In this study, a mesoscale Weather Research and Forecast (WRF) model coupled with an AgI (silver iodide) cold cloud catalytic module were used to explore the potential impact of the catalytic position and rate in the catalytic module based on a ground rain enhancement operation in the Qilian Mountains, on 16 August 2020. Results show that the simulated precipitation, liquid water content (LWC), and water vapor content (PWV) are in good agreement with the observations, demonstrating that the WRF model using the coupled AgI cloud-seeding scheme is well-applicable to the precipitation simulation of the Qilian Mountains. It is also observed that there are some differences in the catalytic effect of catalysis at different cloud temperatures. The precipitation enhancement effect is the most favorable in the fifth layer of 15 km, followed by that in the fourth layer of 12 km and the sixth layer of 18 km. Considering the flight cost and catalytic efficiency, the fourth layer is highly recommended for seeding. Furthermore, the AgI seeding rate also plays a crucial impact on ground precipitation. In the case of a seeding rate of about 1.2 g·s−1, the precipitation enhancement effect tends to be stable, and the percentage of the precipitation increase reaches up to 10.4%. While in the case of a seeding rate of about 1.5 g·s−1, the percentage of ground precipitation increase is 10%, which is 0.4% lower than that of 1.2 g·s−1. In summary, the introduction of a AgI catalyst with a seeding rate of 1.2 g·s−1 can significantly increase the ground precipitation at a height of 12 km and a temperature of −3 °C in the Qilian Mountains.

1. Introduction

The adverse effects of emissions-induced climate change, such as extreme weather events, are causing significant damage to the production system [1,2,3]. In particular, the shortage of water resources is getting more and more serious in the background of global warming across the whole world [4,5,6], especially in the arid-semiarid area, such as Northwest China [7,8,9]. In general, artificial ground precipitation enhancement is an essential way to resolve this issue [10,11], and seeding AgI catalysts on super-cooled cloud systems is potentially one of the frontier technologies of artificial conscious precipitation catalysis at present [12,13].
In recent decades, a variety of cloud-seeding methods have been developed by worldwide meteorologists. For example, Hsie et al. established a conservation equation to simulate the nucleation of silver iodide particles, considered the process of contact nucleation, condensation (and adsorption) nucleation of silver iodide, and added the equation to the two-dimensional convective cloud model for simulating the effect of silver iodide seeding on precipitation enhancement in strong convective clouds [14]; Chen et al. simulated the summer cloud precipitation process in the Qilian Mountains using the GRAPES model coupled with the two parameters’ explicit cloud physics scheme, and found that the results were consistent with the observation results and that the precipitation enhancement efficiency was the highest after 500 hPa seeding [15]. Fang et al. performed catalytic simulations by introducing the interaction process between silver iodide and micro-physics in clouds into the mesoscale numerical model WRF and found that different seeding rates exercise different effects on precipitation and that the precipitation enhancement effect is not obvious in the case of a low seeding rate but it will inhibit the total precipitation when the seeding rate is high [16]. Xue et al. embedded AgI cloud-seeding parameterization to the Thompson microphysics scheme of the WRF model and found that the optimized model can reasonably reproduce the physical process of cloud-seeding by simulating the two-dimensional ideal wet flow on the bell-shaped mountain to check the sensitivity of parameterization to meteorological conditions, cloud characteristics, and seeding rate [17]. Xue et al. simulated the seeding experiments on the ground and in the air using the WRF model coupled with a parameterization process of a wintertime silver iodide (AgI) seeding. They reported that these simulations capture the dynamics, thermodynamics, and precipitation processes [18]. Chae et al. simulated three aerial seeding experiments in Pyeongchang, South Korea, in 2016 by coupling the AgI catalytic process in the Morrison two-parameter scheme of the WRF model, and found that the spatial model of simulated precipitation and liquid water was consistent with the observation results in quality and that the simulated spatial–temporal distribution of seeding materials, AgI, and snow enhancement was reasonable. According to these attempts, different cloud catalytic models capable of accurately simulating the characteristics of clouds and precipitation have been established [19].
Fang et al. carried out a catalytic simulation by introducing the interaction process between silver iodide and cloud into the mesoscale numerical model, WRF. To understand the influence of different seeding positions and the rate of catalysts on cloud development and precipitation in catalysis, four groups of catalytic experimental schemes were designed, and it was found that silver iodide sown in the maximum updraft region can be transported faster to the super-cooled water region with airflow diffusion. The precipitation enhancement effect is the most favorable in the case of a seeding rate of 0.6 g s−1, which is not obvious when the seeding rate is 0.1 g s−1, and the total precipitation may be inhibited in the case of a seeding rate of 1.2 g s−1 [16]. Qi et al. conducted a catalytic test of a stratiform cloud precipitation process in Beijing at different heights and times by introducing the interaction process between AgI particles and clouds into the Morrison two-parameter scheme of the mesoscale WRF model and found that the precipitation enhancement effect is significant in areas with rich supercooled water and less ice and snow crystals [17]. Xue et al. simulated four cloud-seeding cases in Southern Idaho in the winter of 2010–2011 using the mesoscale model WRF coupled with a AgI catalytic process and explored the effects of ground and air seeding and model physics, seeding rate, location, time, and cloud attributes on the seeding effect, finding that aerial seeding is usually more efficient than ground seeding in targeting and that the seeding effect is positively correlated with the seeding rate [18]. Liu et al. conducted a numerical simulation study on the precipitation catalysis of a rainfall weather process in North China from 9 to 11 May 2014 using the mesoscale numerical model WRF with the silver iodide cold cloud catalysis module, and carried out two groups of sensitivity tests for the catalytic height and the amount of catalyst, finding that the introduction of the silver iodide cold cloud catalyst into the cold cloud area with a height of 5–6 km and a temperature of about −20–−15 °C can significantly increase the ground precipitation. It can be seen that different catalytic heights and catalyst rates will significantly affect the precipitation enhancement effect [12].
The Qilian Mountains are located in the hinterland of arid and semi-arid areas in Northwest China [19], adjacent to the Qinghai Tibet Plateau in the South and the Hexi Corridor in the North [20]. The maximum annual precipitation in Qilian is about 800 mm, 4–16 times higher than that in the plain of the Hexi corridor, making it a veritable “alpine water tower” [21]. Figure 1 shows the topography and distribution of the main observation stations in the Qilian Mountains. In meteorological views, the lift motions forced by embedded terrains act as a vital role in triggering the more frequent precipitations in the mountains than their adjacent plains, while the Qilian mountain area has complex topographic and geomorphic conditions. The cloud water resources in the Qilian Mountains are rich and with special topographic conditions; it has great potential for the development of cloud water resources. Artificial precipitation enhancement and the development of cloud water resources in the Qilian Mountains are of great significance to solving the water shortage problem in Northwest China and realizing the national key strategy of sustainable development of the regional social economy. Therefore, further explorations of research on the catalytic technology for the precipitation enhancement operation of the stratocumulus system in the Qilian Mountains, including the catalytic location and catalyst rate, are considered to be conducive to the efficient artificial precipitation enhancement operation in Qilian Mountains.
At present, the determination of indicators and parameters such as the timing, catalytic range, dosage, and method of artificial precipitation enhancement operations are a challenge in the process of artificial precipitation enhancement. On a complex terrain, there is currently a lack of suitable numerical models for simulation research to obtain such indicators and parameters. In this study, on the basis of an artificial precipitation enhancement operated in the Qilian mountains, a WRF model coupled with a AgI catalytic process was employed for the explorations on the actual artificial precipitation enhancement process. Results prove the potential applicability of the WRF model in the Qilian Mountains area was verified, and the effects of different operation methods were compared by designing sensitivity tests with different catalyst rates and catalytic heights, studying the catalytic technology suitable for the precipitation enhancement operation of the cloud system in the Qilian Mountains. This study can provide a reference for the formulation of the ground operation plan of weather modification in the early stage and the actual operation information can be input for catalytic simulation in the later stage. Comparative verification and analysis can improve and optimize the process algorithm and continuously improve the scientific and technological level of the formulation of the ground operation plan.

2. Methodology

2.1. Artificial Precipitation Enhancements

A campaign on artificial precipitation enhancements in Tianzhu County (37.6° N, 102.3° E) in the Qilian Mountains was conducted on 16 August 2020 (Figure 1b–d), a rainy day with 24-h cumulative precipitation of 30 mm affected by the intersection of cold and warm air flow behind the front ridge of the high trough (Supplementary Materials Figure S1). In total, 62 precipitation-enhancement rockets were launched throughout the day, of which, the WR-98 rockets widely used in the Chinese meteorological system carried a 725-g catalyst and seeded 43 ± 5 s; the silver iodide content was 36 g, and the nucleation rate was 1.8 × 10¹⁵ number·g−1 at −10 °C, with a maximum theoretical range of 8–10 km.

2.2. Model Optimization and Numerical Experiments

2.2.1. Catalytic Processing

The Weather Research and Forecasting model (WRF, version-4.3), a mesoscale model jointly developed by the National Center for Atmospheric Research (NCAR), National Centers for Environmental Prediction (NCEP), and the National Oceanic and Atmospheric Administration (NOAA), was adopted in this study to design and perform numerical simulations [22,23,24,25,26,27,28,29]. The Thompson scheme embedded in the WRF model includes specific water content prediction of cloud water, rainwater, cloud ice, snow, graupel, etc., and an ice crystal number concentration prediction [30]. In order to investigate the effect of cold cloud catalysis on precipitation, the prediction equation of silver iodide was implemented into the Thompson microphysics scheme of the WRF model, which mainly considers the contact freezing nucleation of cloud droplets and raindrops with AgI particles and the condensation nucleation of water vapor on artificial ice nuclei (including condensation freezing nucleation). The specific prediction equations and cloud micro-physical processes are described as follows.
We added the silver iodide prediction equation to the model,
d X s d t = D X S + S 1 + S 2
where, XS is the specific content of silver iodide particles and DXS is the sub-grid scale mixing term of XS. S1 and S2 denote the source term and sink term of XS. S2 can be estimated through
S 2 = S b c + S i c + S b r + S i r + S d v
where, Sbc, Sic, Sbr, and Sir represent the process of collision freezing and nucleation of cloud drops and rain drops with artificial ice nuclei due to Brownian motion and inertial motion. Sdv represents the condensation and nucleation of water vapor on artificial ice nuclei.
S1 is expressed by the initial concentration XS0 of silver iodide particles uniformly distributed in a rectangular space. The main assumptions are as follows: Silver iodide particles are monodisperse with a radius of 0.1 μm. Ignoring the final falling velocity, the average mass is ms = 2.38 × 10⁻¹⁴ g. An amount of one droplet can only capture one activated ice nucleus to generate contact nucleation. The collision between ice particles and silver iodide particles and the photolysis activation of silver iodide particles are neglected. All silver iodide particles are activated at t < −20 °C. The activation curve of artificial ice nuclei Chen et al., 2011 [15] is as follows:
N a Δ T = exp 0.022 × Δ T 2 + 0.88 × Δ T 3.8 ,   5   ° C Δ T < 20   ° C
N a Δ T = 1.6 × 10 2 , Δ T 20   ° C
The conversion rate formulas of XS are given below [20,21]:
  • Freezing and nucleation of cloud and rain drops in contact with silver iodide particles:
S b c = Δ X s / Δ t = 4 π D s X s N c R c
S i c = Δ X S / Δ t = π R c 2 X s V c E c s N c
S br = Δ X s / Δ t = 4 π D s X s 0 1 2 D r N 0 r exp λ r D r d D r = 2 π D s X s N 0 r / λ r 2
S i r = Δ X s / Δ t = π a X s E r s 0 1 2 D r 2 D r b N 0 r exp λ r D r d D r = π a X s E r s N 0 r Γ 3 + b / 4 λ r 3 + b
where, NC is the cloud drop concentration, N0r = 0.08 cm−4, and λr = (πρωN0r/ρqr)1/4.
In the Thompson scheme,
N 0 r = N 1 , r N 2 , r 2 tanh 4 q r 0 q r q r 0 + N 1 , r + N 2 , r 2
where, N1, r = 100 cm−4; N2, r = 0.08 cm−4; qr0 = 1 × 10⁻⁴; a and b are empirical constants for the final velocity of raindrops falling(a = 2115 cm1−b, b = 0.8); Rc and Vc are the radii and falling velocities of cloud droplets(Rc = 10 μm, Vc = 0.1 cm/s); Ecs and Ers are the collision efficiencies of clouds and raindrops with silver iodide particles, respectively, (Ecs = 10−4, Ers = 0.5 × 10 microphysics); Ds is the diffusion coefficient of silver iodide particles; and Ds = kTB.
B = 1 + a d / R s 6 π η R s
a′ = 0.9, d = 0.1 μm, Rs = 0.1 μm, η = 1.81 × 10⁻⁵ kg m−1 s−1, and k = 1.38 × 10⁻²³ J K−1.
ii.
Condensation and nucleation of water vapor on an artificial ice core:
When qvqvs (saturated) and 5 °C ≤ ΔT < 20 °C
S dv = m s d N a D Δ T d t = ω X s N a Δ T Z / N a 20
When ΔT ≥ 20 °C
S dv = m s N a D Δ T = X s N a Δ T / N a 20 .
N a D = X s N a Δ T N a 20 m s 1
where, NaD is the condensation activation number of artificial ice nuclei at temperature ΔT.
The interaction between silver iodide and cloud includes contact nucleation and the condensation nucleation process. In the model, the process is as follows:
U c s i = q c N ac Δ T Δ t N c
U r s s = q r N a r Δ T Δ t N r
U v s i = m i 0 S d v m s 1
where, Ucsi and Urss represent the rate of cloud water conversion to cloud ice and rainwater conversion to snow through contact nucleation. Uvsi indicates that water vapor deposits into ice crystals on artificial ice nuclei under saturated water surface conditions. NacT) and NarT) are the numbers of activated ice nuclei collected by clouds and raindrops at temperature ΔT.
N ac Δ T = S b c + S i c N a Δ T N a 20   Δ t   m s 1
N a r Δ T = S b r + S i r N a Δ T N a 20   Δ t   m s 1
To verify the simulation effect of liquid water and water vapor content, the simulated liquid water and water vapor content were compared with the liquid water and water vapor content observed by the microwave radiometers at Qilian and Minle stations in the study area. The formula for calculating the liquid water and water vapor content of the model is as follows:
L W C = Q C L O U D 1000 ρ L
P W V = Q V P A O R 1000 ρ V
ρ L = P 287 × T × 1 + 0.608 × Q CLOUD
ρ V = P 287 × T × 1 + 0.608 × Q VAPOR
where, LWC is the liquid water content in kg·m−2. PWV is water vapor content, in kg·m−2. QCLOUD and QVAPOR are the cloud water content and water vapor content of the model output results, respectively, with the unit of kg·kg−1· ρL and ρV are the densities of liquid water and water vapor, respectively, in kg·m−3.

2.2.2. Numerical Experiments

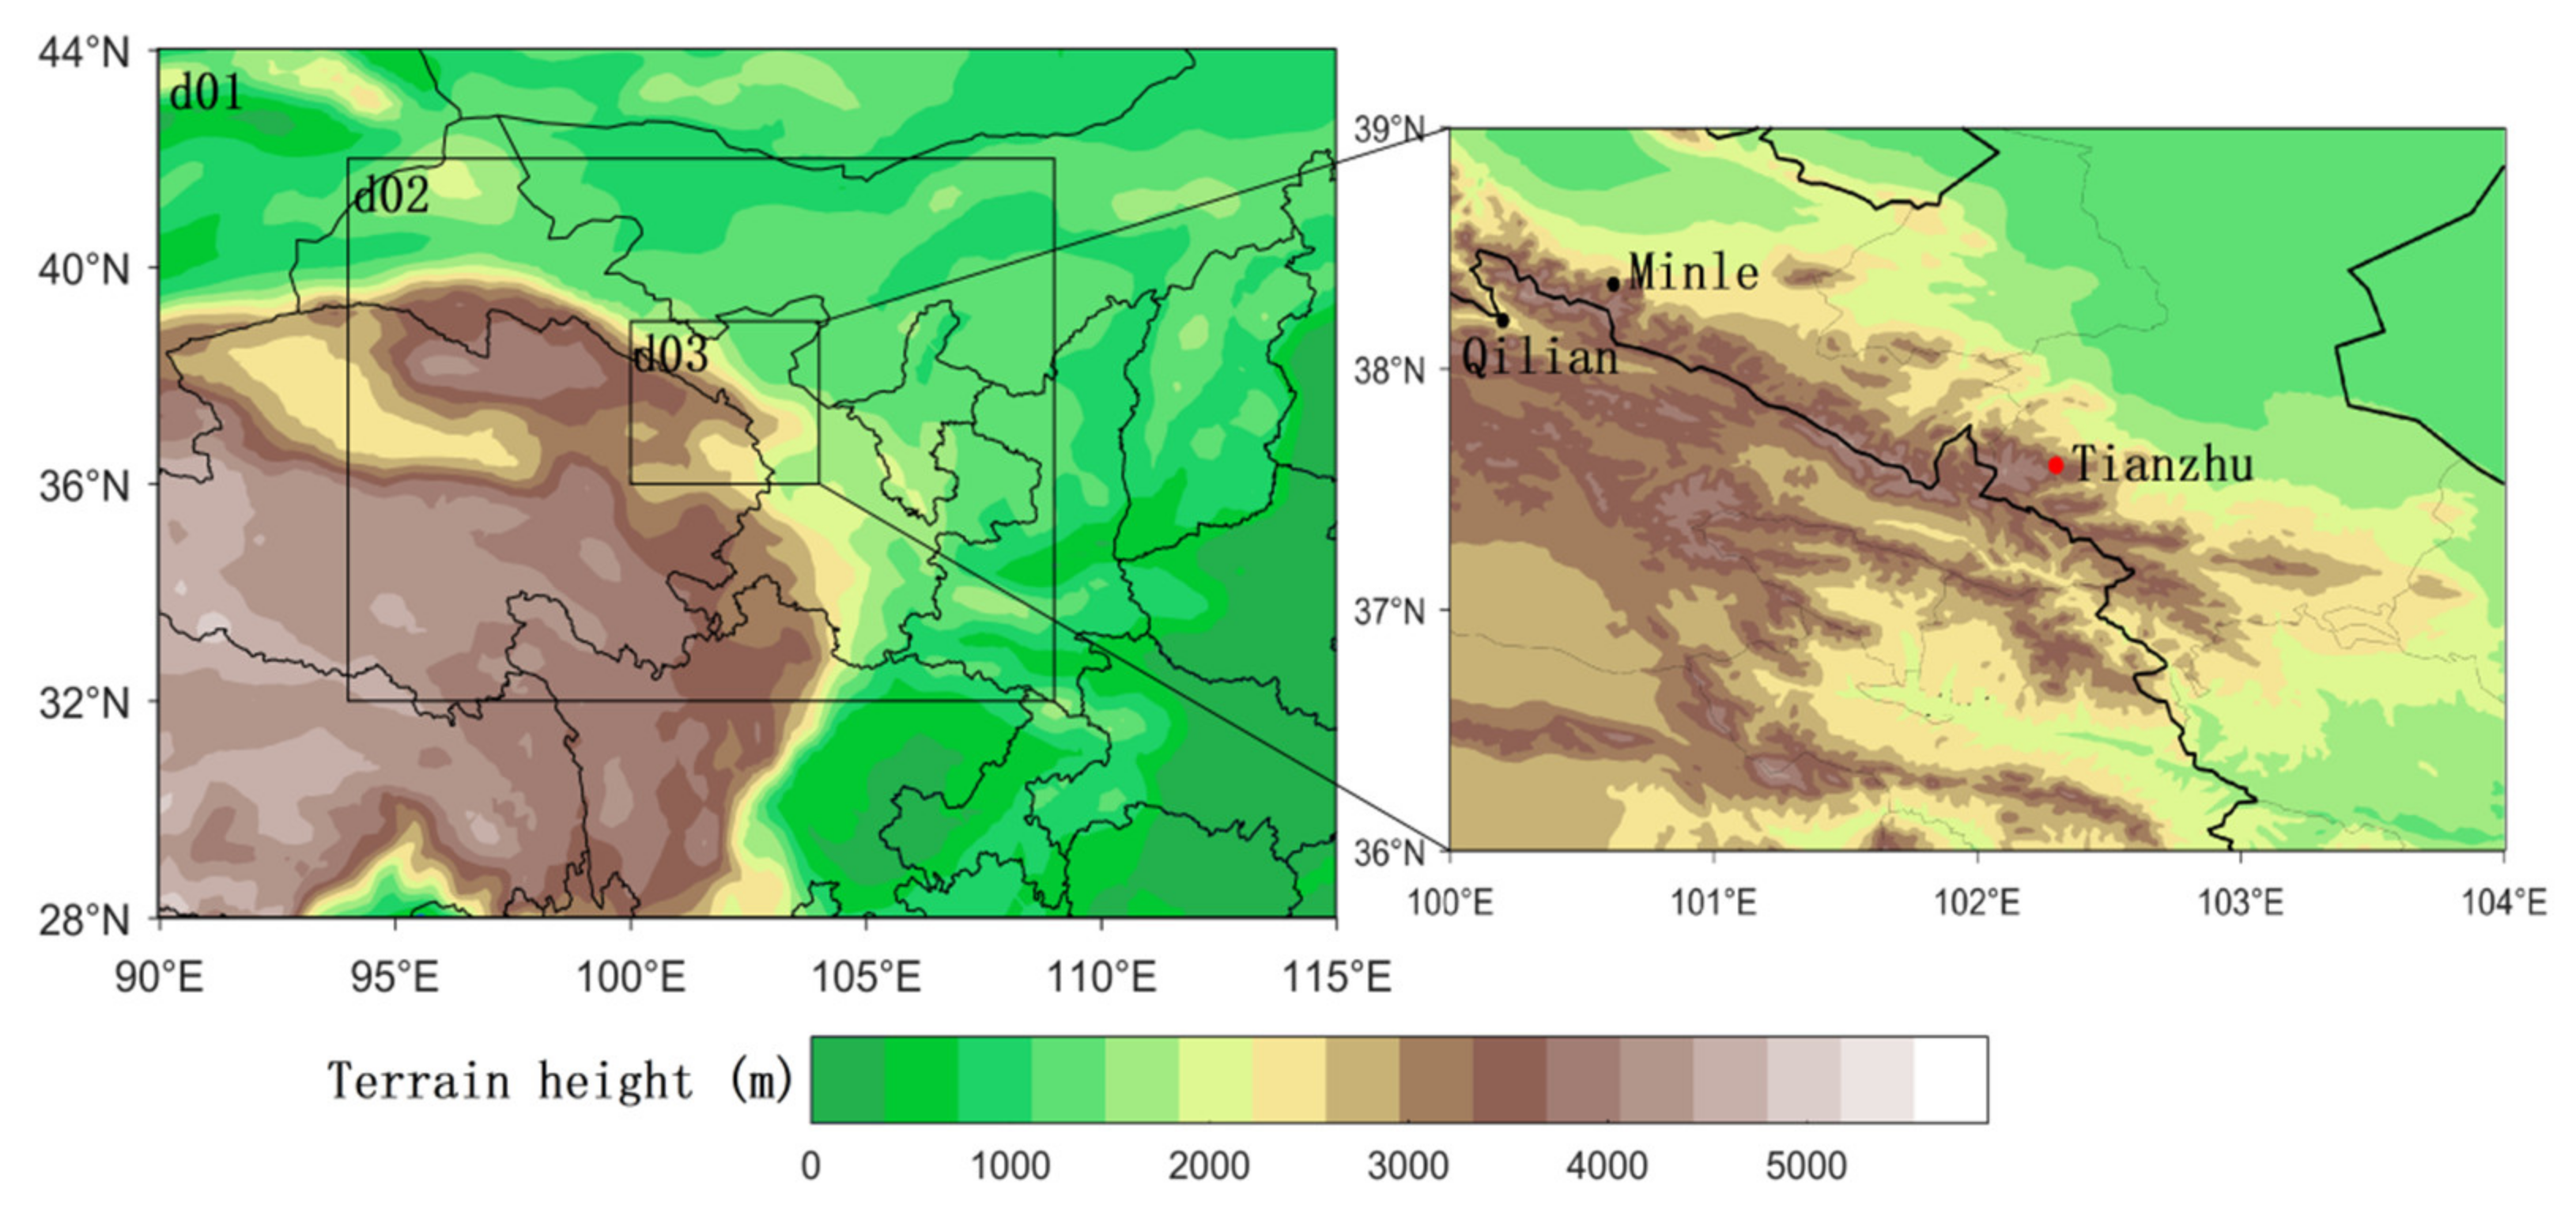
For the settings of numerical experiments, simulations ran 36 h from 20:00 on 15 August to 08:00 on 17 August 2020. The spatial configuration of the model consisted of three one-way nested domains. As shown in Figure 2, centering at (37° N, 102° E), three nested domains were adopted with the Arakawa-C grid in the horizontal direction and mixed vertical coordinates in the vertical direction. NCEP/FNL reanalysis data with a time interval of 6 h and a resolution of 1° × 1° were used for initializing the WRF model. Details regarding the selections of different modules were presented in Table 1. Specifically, what needs to be emphasized is that the Thompson scheme coupled with the AgI catalytic module was switched on for the inducement of the cloud microphysics process.
In the numerical test, the catalytic numerical sensitivity test was carried out with reference to the actual situation of the above-ground rain enhancement operation, and the simulation results after catalysis were compared with the observation results to analyze the catalytic effect. The catalytic time was selected at 09:00 on 16 August 2020. The catalytic height was 10 km, and the corresponding temperature range was −5.8–−10.2 °C. The catalysis method adopts the method of seeding silver iodide catalyst, and the seeding rate refers to the actual operating rate (62 precipitation rockets, each carrying 36 g silver iodide). A total of 2232 g of silver iodide was sown. Based on the seeding time and range of the actual ground precipitation enhancement rocket, the mode catalytic time was set to 10 min, and the seeding rate was 1.0 g·s−1. On this basis, manual seeding sensitivity tests with different catalyst heights and different seeding rates were carried out, and the effects of different operation schemes were compared and analyzed.

2.3. Data Used for Validating Simulations

Microwave Radiometer Observations

The microwave radiometer is an instrument that passively receives the microwave radiation emitted by the environment for remote sensing detection. Due to how the microwave wavelength is long and can penetrate certain clouds, it has the advantages of high space-time resolution and all-weather detection, and it is widely used in atmospheric remote sensing detection. According to the different platforms, it is mainly divided into ground-based, space-based, and satellite-based microwave radiometers, of which ground-based microwave radiometers are widely used in atmospheric vertical detection.
The Qilian (100.2° E, 38.2° W) and Minle(100.62° E, 38.35° W) stations set up by the National Northwest Regional Weather Modification Capacity Construction Project in the middle and east section of the Qilian Mountains were selected as the locations of the ground-based microwave radiometers on the south(altitude 2727 m) and north(altitude 2834 m) slopes, respectively. The two microwave radiometers were observed in zenith mode with a time resolution of 5 min, and the data at the height of 0–10 km were retrieved using a local neural network. The microwave radiometer on the south slope is QFW-6000, and the inversion errors of water vapor and liquid water content are less than 5 mm and 0.05 mm, respectively. The northern slope microwave radiometer is an FT-500 type, and the inversion error of water vapor and liquid water content was less than 5 mm and 0.03 mm, respectively. The two instruments are calibrated with external liquid nitrogen every half year, and the internal blackbody is calibrated irregularly.

3. Results

3.1. Comparison of Measured and Simulated Results

3.1.1. Comparison of Measured and Simulated Precipitation, Water Vapor and Liquid Water Content

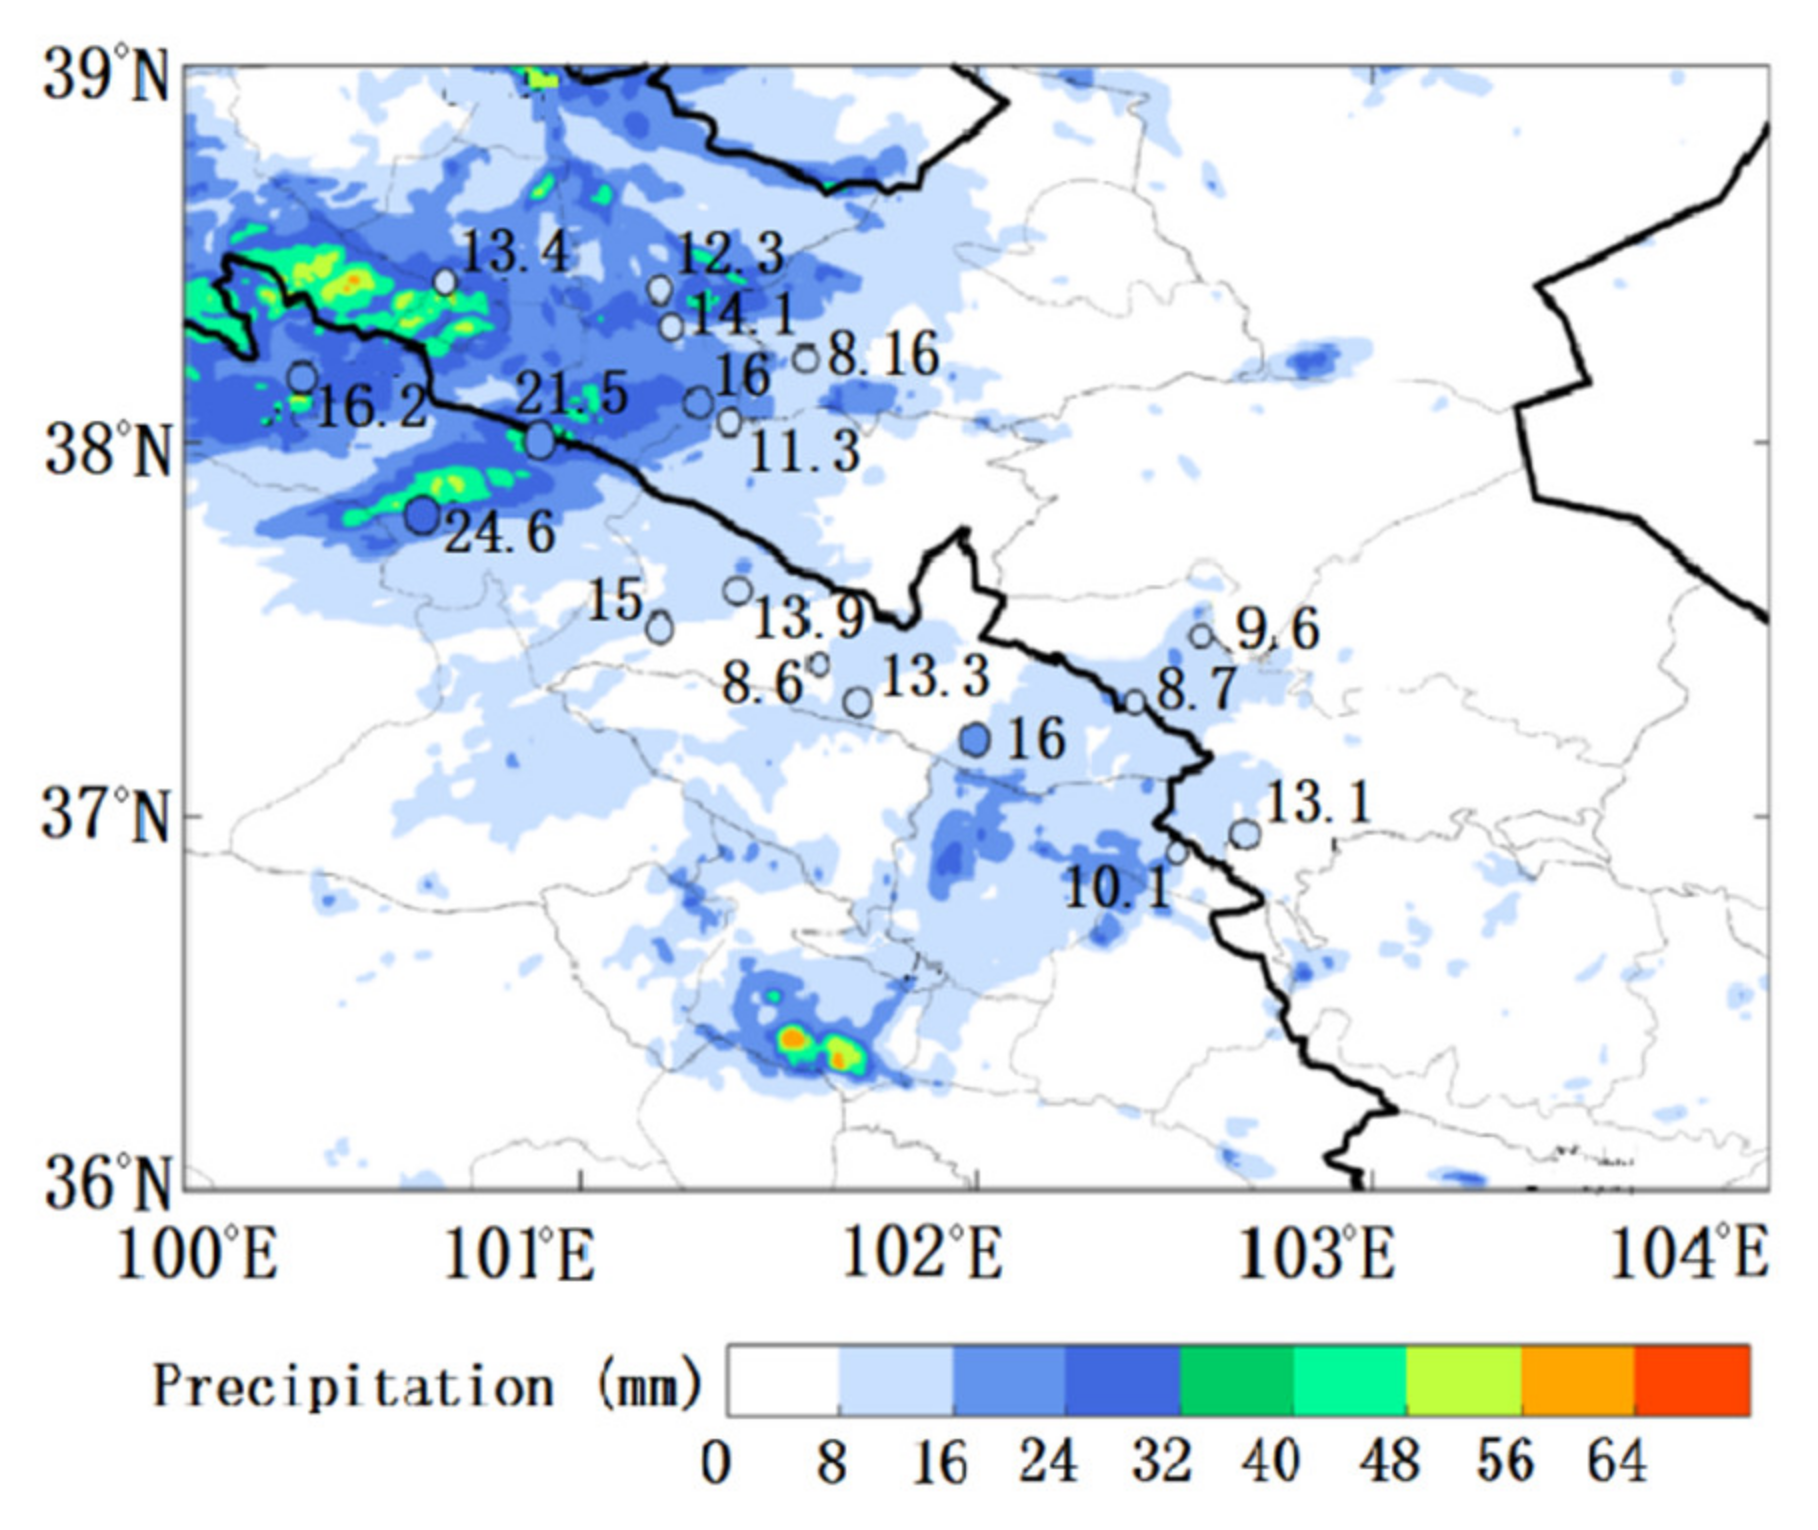
Figure 3 shows the difference between the observed and simulated precipitation at the D03 domain. It is observed that there were minimal differences between the measured and simulated precipitations at the stations, whereas an obvious enlargement of the difference is found along the elevation of terrain height, indicating that the gradient of airflow or topographic uplift plays an important role in regulating the precipitation of the cloud system. The Thompson parameterization scheme well-reproduced the approximate location of the rain belt and the center of heavy precipitation. However, both the simulated rainfall and rain belt range are found to be larger than the measurements. For example, the average of the simulated heavy precipitation center range was 38.83 mm, which was around 1.5 times higher than the measured 25.32 mm.
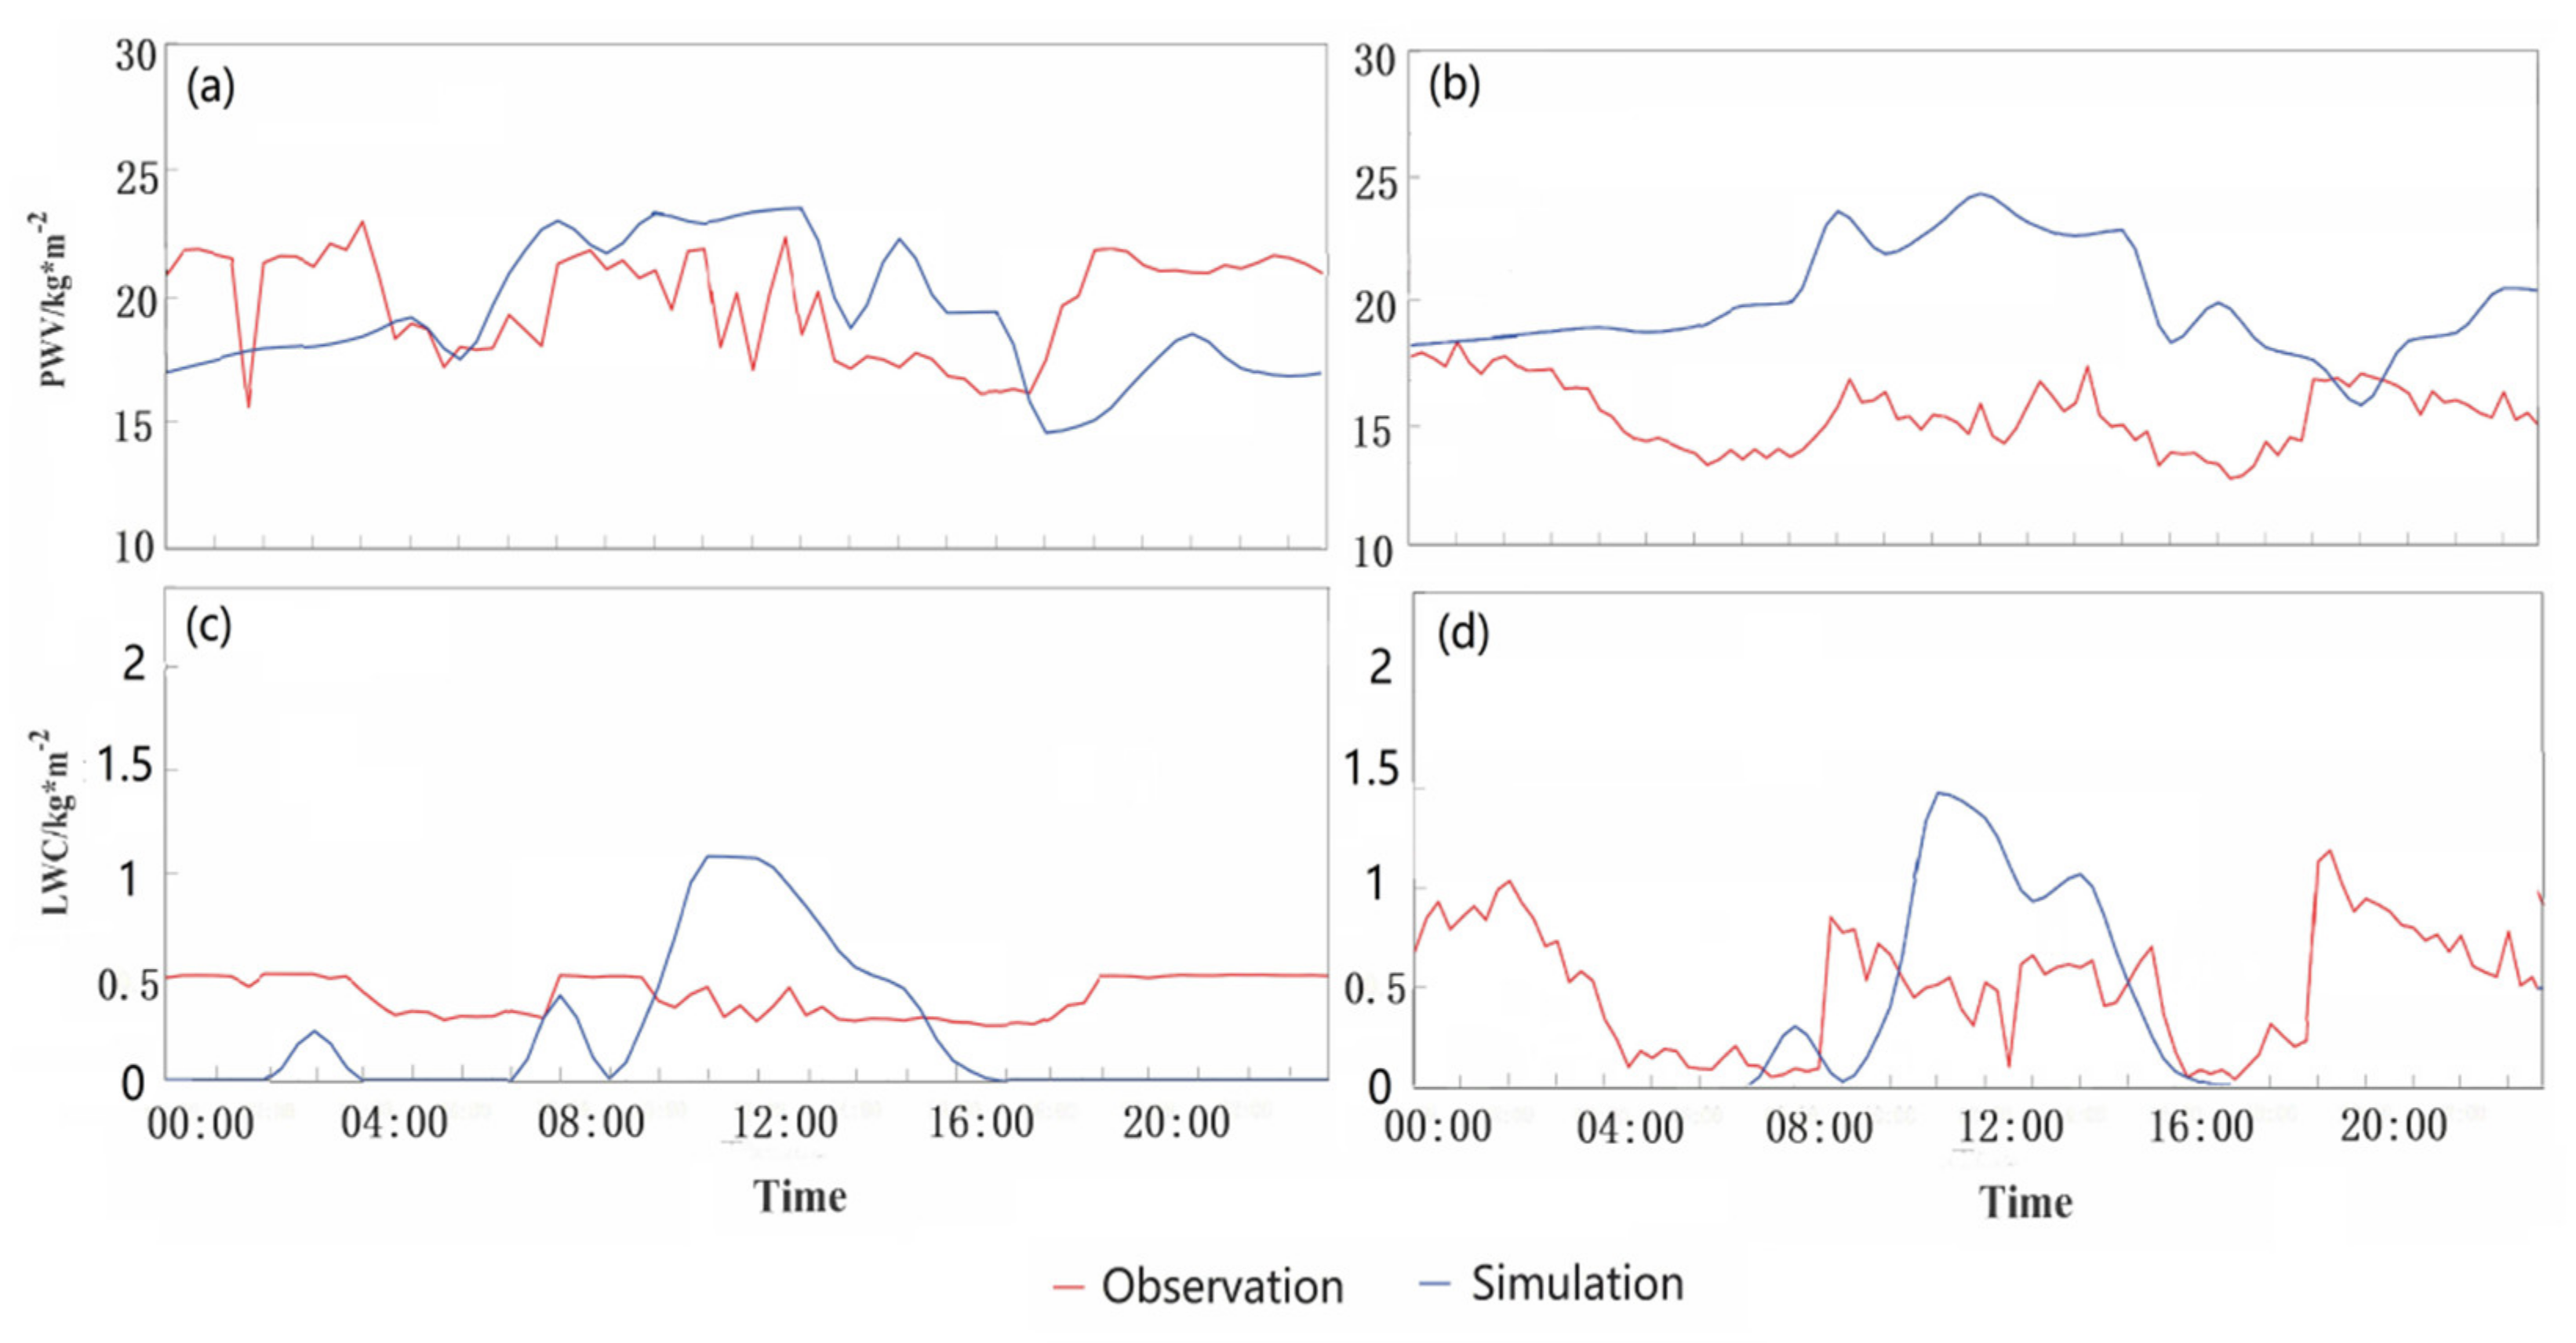
Figure 4 shows the comparisons between WRF-simulated and radiometer-measured PWV and LWC in Qilian and Minle stations. After catalyzing, the measured PWV in Qilian began to fluctuate and increase, decrease after 13:00, and continue to increase after 18:00; the variation range was 15.86–22.75 kg·m−2 (Figure 4a). The simulated PWV in Qilian continued to increase after catalyzing, decreasing briefly from 13:00 to 14:00, increasing briefly from 14:00 to 15:00, continuing to decrease after 15:00, and continuing to increase after 18:00. The variation range was 15.22–23.52 kg·m−2 (Figure 4a). The change range of LWC in Qilian was not large after catalyzing, it fluctuated and rose first, then fluctuated and fell, and then remained unchanged. The variation range was 0.4–0.6 kg·m−2 (Figure 4c). The simulated LWC in Qilian continued to increase after catalyzing and continued to decrease after 12:00, and finally remained unchanged. The variation range was 0–1.1 kg·m−2 (Figure 4c). After catalyzing, the measured and simulated PWV in Qilian presented similar trends, both of which increased first, then decreased, and then increased, and values of PWV were relatively close. With the progress of catalysis, the simulated LWC was larger than the measured value but the difference was always within 1 kg·m−2. The difference between the measured PWV and the simulated PWV was large in the high-value period. Qilian Station is located on the south slope of Qilian Mountain and close to the ridge. Due to the influence of topography, the numerical simulation may be different from the observation, leading to the deviation of the LWC.
After catalyzing, the measured and simulated PWV in Minle presented similar bimodal variations trends but with a remarkable difference in peak values (Figure 4b). Minle is located on the north slope of the Qilian Mountains. Affected by the westerlies, the numerical simulation of clouds possibly deviated from the observations, which leads to sustainable errors of the PWV. For LWC, the measurements in Minle first decreased and then increased after catalyzing, which ranged from 0.1 to 1.25 kg·m−2. The simulated LWC showed similar variation characteristics but finally stabilized at 0.1 kg·m−2, varying in a section of 0–1.5 kg·m−2 (Figure 4d). The difference between the simulated and measured LWC remained within 1 kg·m−2.

3.1.2. Movement and Diffusion of Silver Iodide

In view of the horizontal distribution of a AgI number concentration, AgI was evenly distributed at the initial stage of catalysis (09:00) and the number concentration was as high as 8 × 10⁻⁹ g·kg−1 (Figure 5a). After five hours, AgI moved to the southeast along with the northwest airflows, and a little of the dilution phenomenon was observed (Figure 5b). Then, the AgI turned back to the northwest at 19:00, and finally, AgI was dissipated to be lower than 4 × 10⁻⁹ g·kg−1 because of the strong southeastern wind (Figure 5c,d).
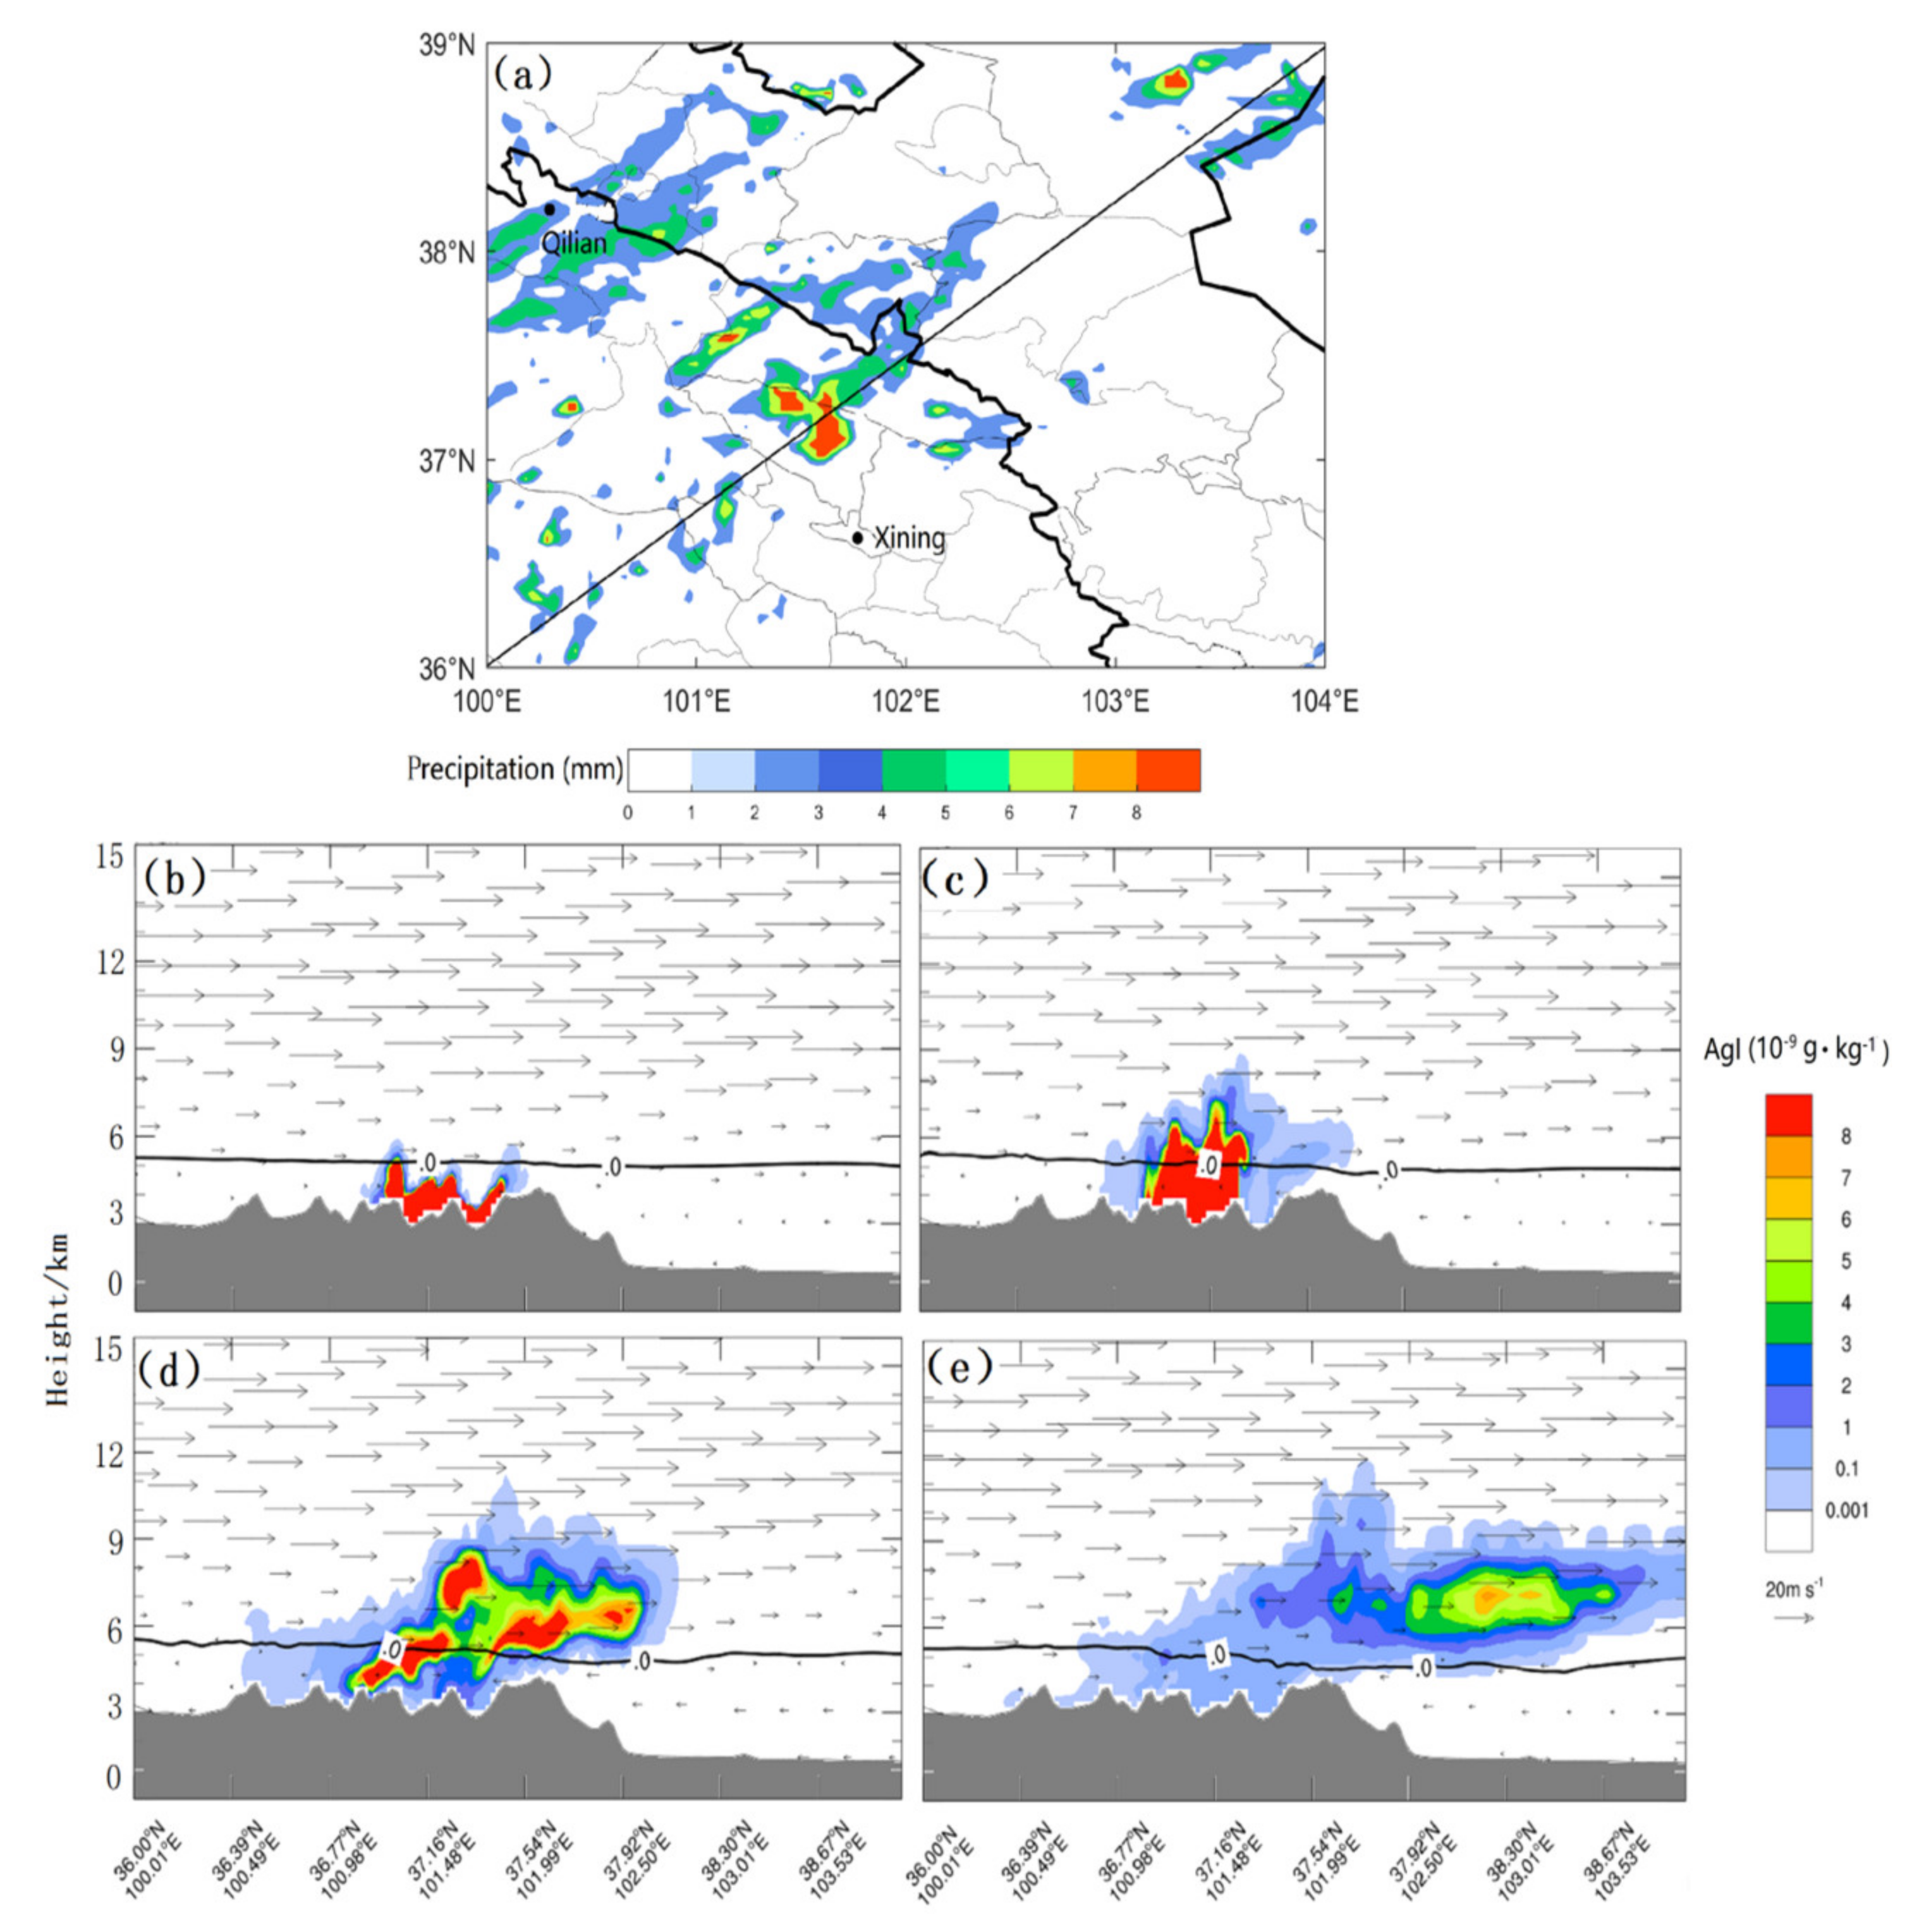
Figure 6 presents the vertical cross-section along the southwest (100° E, 36° N) to the northeast (104° E, 39° N). At the very beginning of catalysis (09:00), AgI was primarily distributed between 3–4.5 km (−9–0 °C) (Figure 6b). Then, AgI spread horizontally toward the southeast direction along with northwest air flows and vertically transported upward to a height of 3–7 km by the updraft force (Figure 6c). In Figure 6d,e, further movements of AgI were observed with the continuous diffusion of mass concentrations. These catalyzes reached around 4.5–10 km and the AgI dropped to 4 × 10⁻⁹ g·kg−1. In summary, as the horizontal airflow in the upper part of the cloud was very strong, AgI gradually diffused upward to this zone driven by the updraft. It can diffuse to the super-cooled water area in the upper part of the cloud. During the movement, reactions occurred between AgI and cloud water and water vapor suspending within the cloud, resulting in a dilution of AgI content.

3.1.3. Evolution of Precipitation after Catalysis

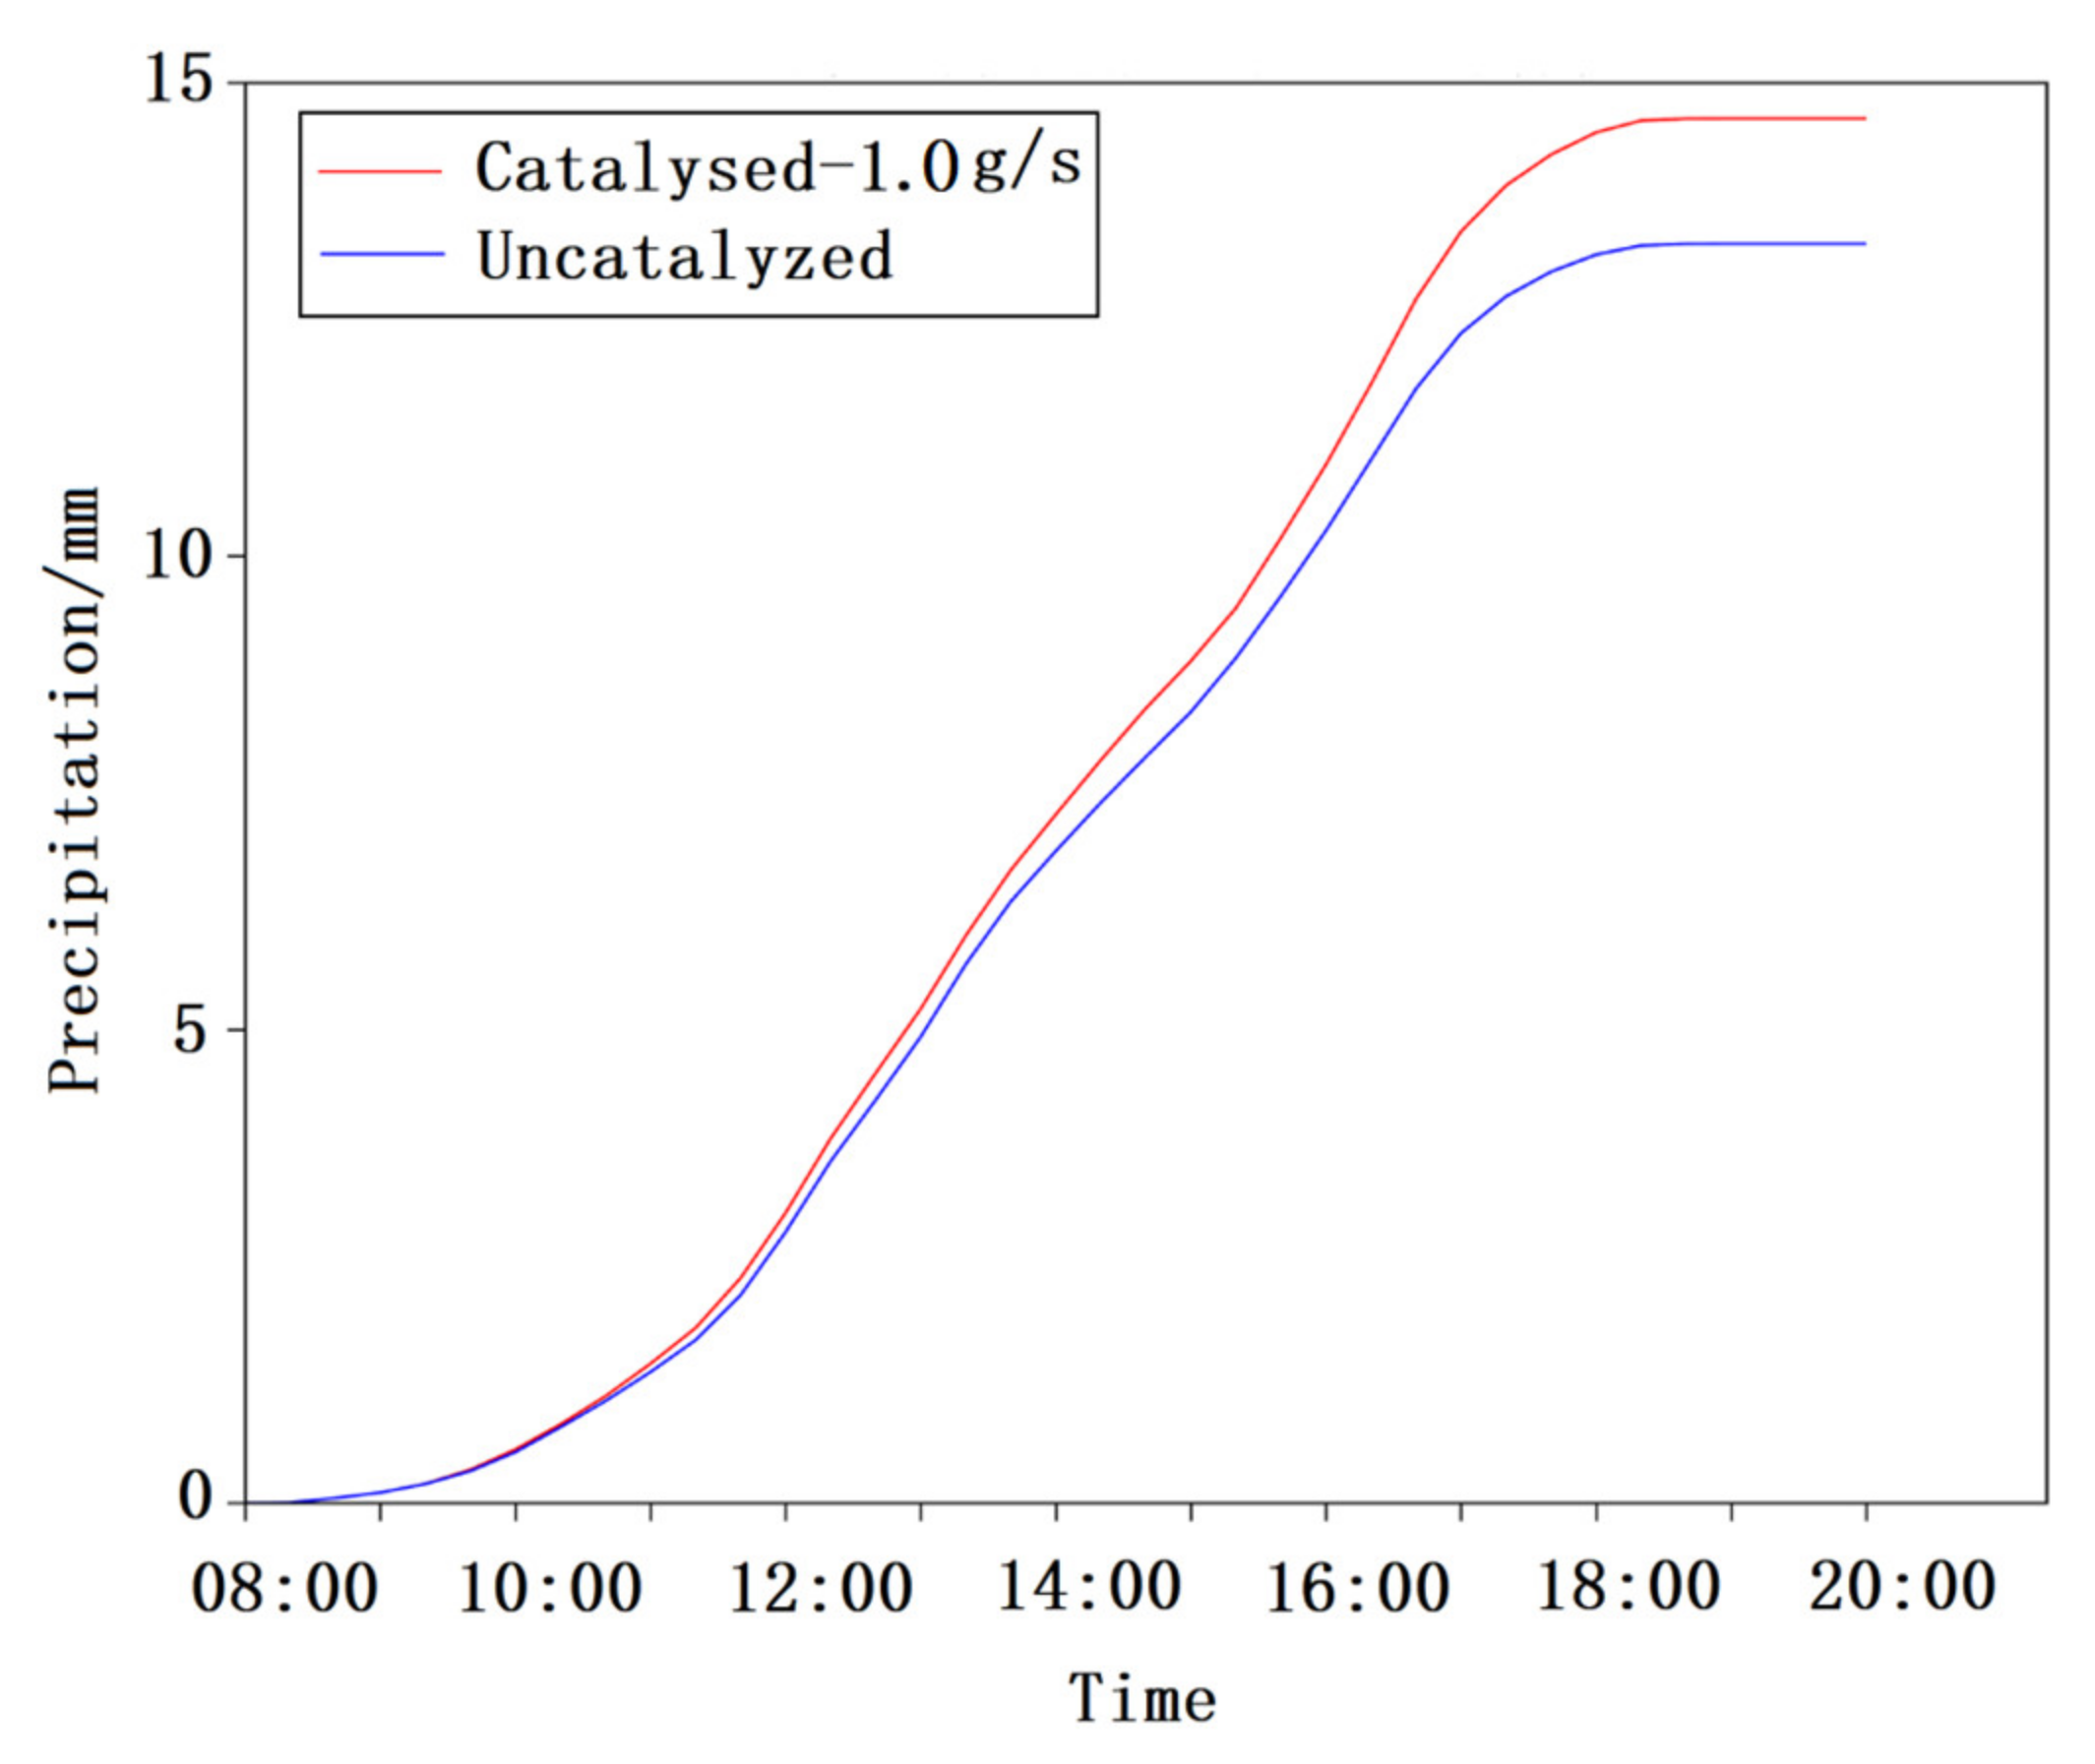
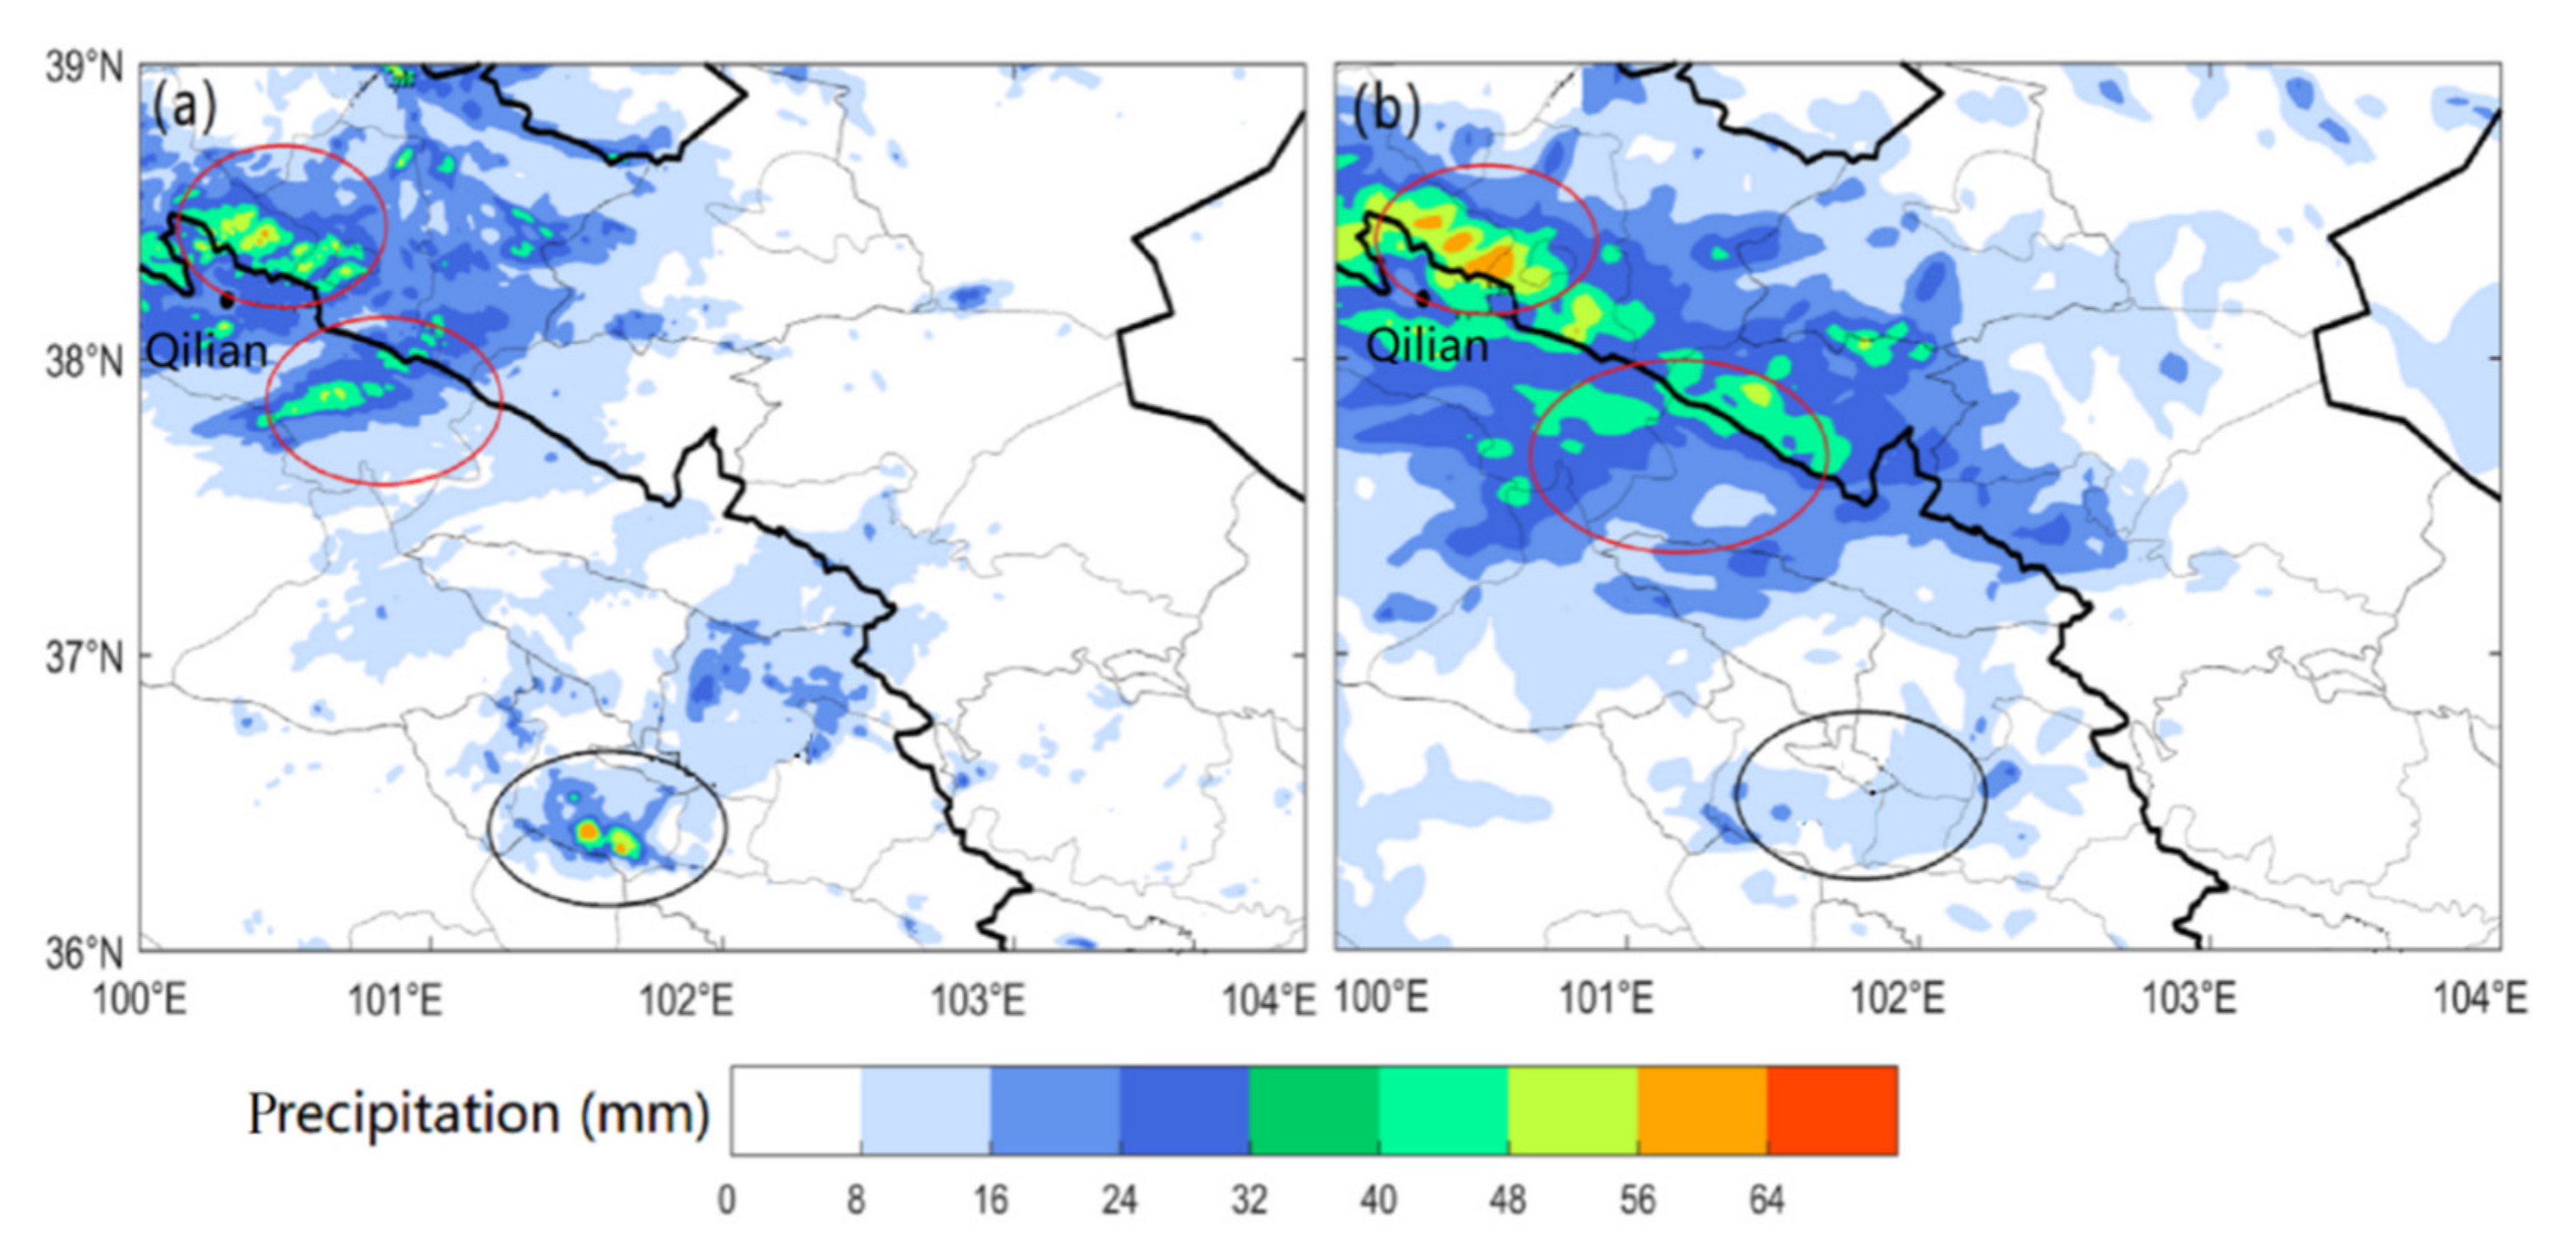
Figure 7 and Figure 8 show the diurnal evolution and spatial distribution of hourly-cumulated precipitation of catalytic and non-catalytic operations. After 1 h of seeding operation (i.e., 10:00), the catalytic effect of precipitation enhancement began to work. Visible differences in the range and magnitude of precipitation appeared at 11:00, and then, the differences were further widened until around 18:00 in sunset time and the precipitation processes both for catalytic and non-catalytic experiments stabilized at 1.3 mm. As depicted in Figure 8a,b, precipitation enhancement was mainly distributed in Qilian Mountains, whereas the precipitation reduction area was located in the neighboring regions of Xining City (Qinghai province). In total, the 24 h cumulative precipitation of this artificial precipitation enhancement operation was 14.2 mm, 10% higher than that of 12.9 mm, indicating a significant enhancement of catalytic precipitation.

3.1.4. Analysis of Precipitation Enhancement Mechanism

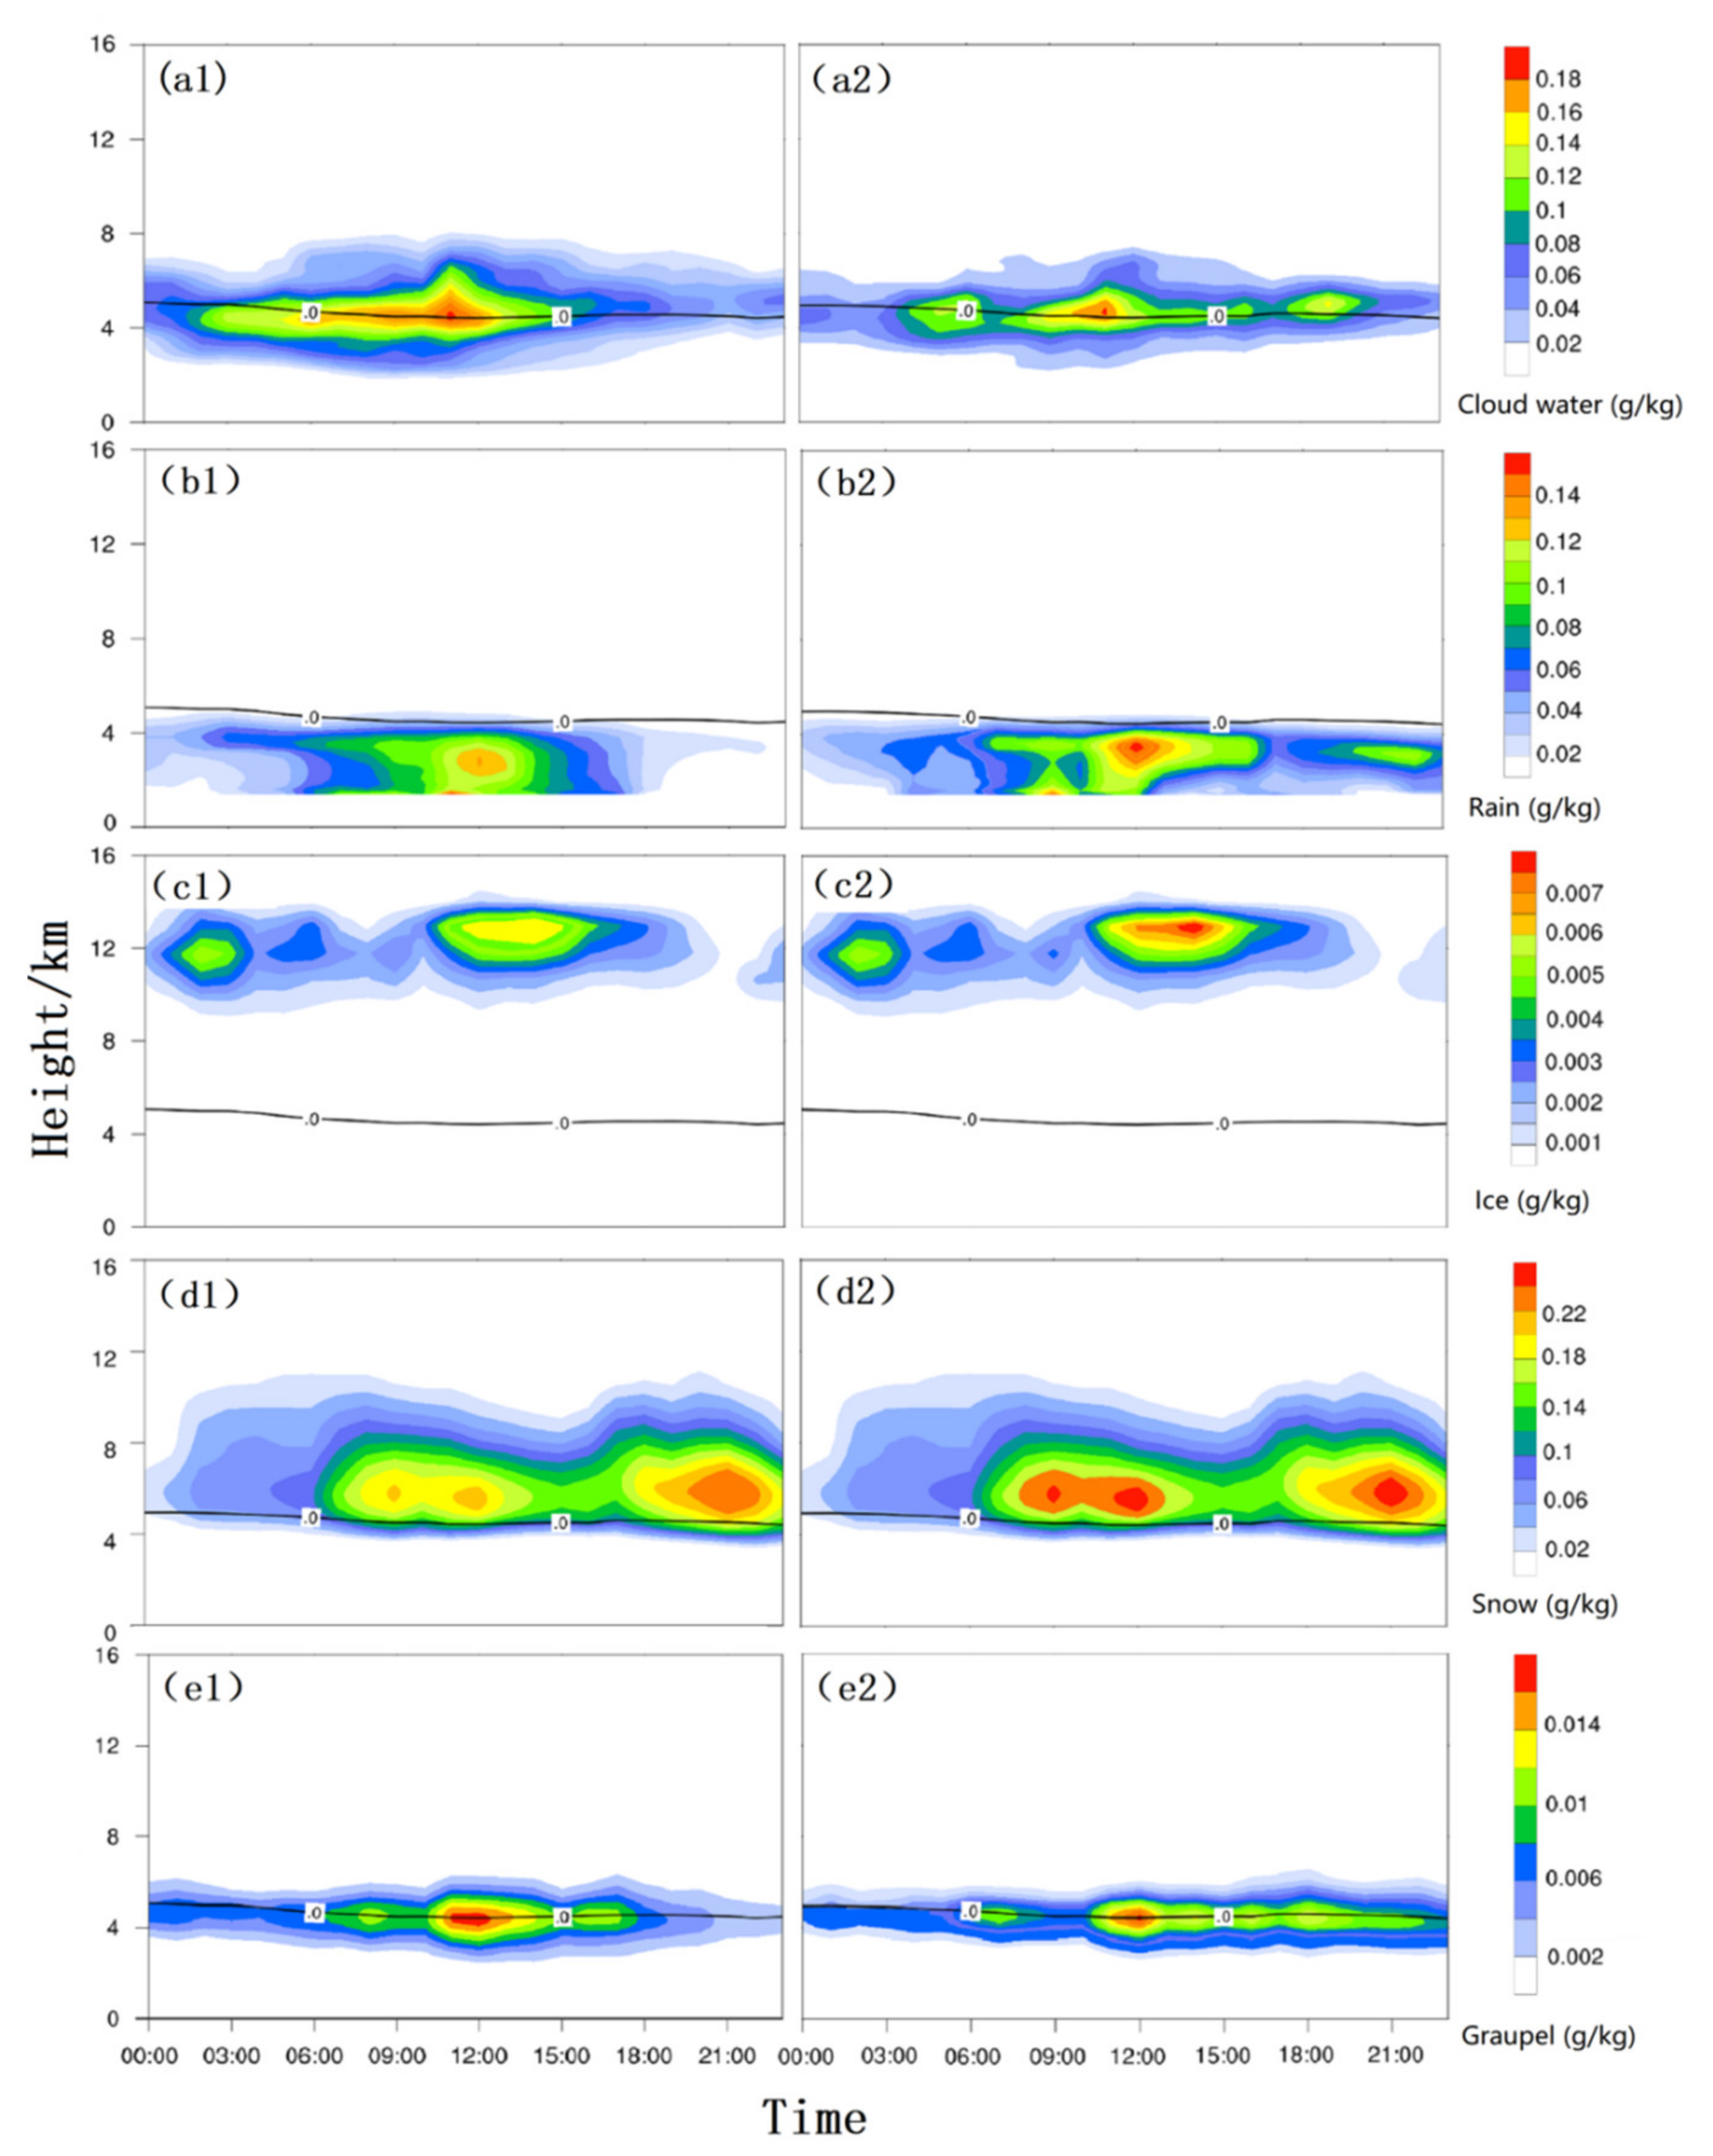
Figure 9 shows the diurnal variation of each hydrometeor of natural cloud and catalytic cloud in the study area. The content of super-cooled cloud water (Figure 9(a1,a2)) above 0 °C layer in the catalytic area showed a very significant decrease, whereas the specific mass of ice (Figure 9(c1,c2)) and snow crystals (Figure 9(d1,d2)) inversely increased. The explanation is that the contact freezing nucleation between the disseminated AgI particles and the super-cooled cloud water in the cloud was quite active, leading to an intensive transformation of cloud water into ice crystals. In addition, the increasing ice crystals were also partially condensed into snow crystals because of the coalescence effect. All the aforementioned processes resulted in an overall decline in the specific mass concentration of graupel (Figure 9(e1,e2)). On the one hand, the drop of cloud water weakened the adhesion process. On the other hand, the increase of ice and snow crystals consumes a lot of water vapors during the growth of freezing, which strongly suppressed the freezing of the graupel. Specific to the areas below the 0 °C layer, rain contents (Figure 9(b1,b2)) were more concentrated right below the areas rich in ice and snow crystals, which were mainly contributed by the melting and falling of the increasing crystals.
Temperature change is caused by the micro-physical phase transition in the cloud. Above the 0 °C layer, in the area where ice crystals and snow crystals are increasing, a large amount of latent heat is released due to freezing and deposition of ice crystals. Under the 0 °C layer, the ice and snow crystal melts and absorbs latent heat for cooling. In summary, the increase in rainwater is mainly attributed to the melting of the increased ice and snow crystals falling below the 0 °C layer.

3.2. Catalytic Tests at Different Heights and Rate

3.2.1. Catalytic Tests for Heights

As mentioned above, the seeding height of the numerical catalytic experiments was designed by referring to the operating height of artificial rockets (8−10 km), therefore, the fourth layer of the model outputs was selected for analysis. To explore the influences of catalytic effects at different heights, four experiments regarding the catalytic heights of 9 km, 12 km, 15 km, and 18 km were carried out at a uniform seeding rate of 1.0 g·s−1. The area that is considered to be possibly affected by seeding (36–39° N, 100–104° E, the same as below) was selected for rainfall statistics. Figure 10 shows the evolution of accumulated ground precipitation over time after catalysis in the four experiments. The 24 h accumulated precipitation after catalytic treatment at the third, fourth, fifth, and sixth layers were 13.1 mm, 13.8 mm, 14.2 mm, and 13.9 mm, with a respective increase of 1.5%, 7.0%, 10.1%, and 7.6% in the percentage of precipitation. It is hereby concluded that the effect of catalytic rain enhancement in the fifth layer was the most efficient, followed by that in the fourth and sixth layers. Nevertheless, the effectiveness of seeding at the third layer was very minimal in regard to the enhancement of artificial precipitation.
For the purpose of exploring the reasons for different behaviors of seeding heights, we made statistical averages of physical variables over catalytic areas at different heights. As shown in Table 2, given that the activating temperature threshold of AgI particles was around −5 °C, the precipitation enhancement in the comparatively warmer third layer was not as effective as those in the other three layers. Furthermore, the updraft airflow here was too weak to transport a large quantity of AgI particles sown in this area upward to a low-temperature area. Theoretically speaking, AgI particles can be fully activated in an environment cooler than −20 °C, indicating that a place with environmental temperature as close as possible to or below −20 °C shall be a better choice for sowing. In conclusion, catalyzes at the fifth and fourth layers were strongly recommended in order to achieve the best catalytic rain enhancement.
Although the cloud water content in the fifth layer is not more abundant than that in the fourth layer, it may be that the temperature is more appropriate and the ice crystal content is less. The catalyzed ice crystals can make full use of the cloud water in the lower layer due to gravity settlement, so the precipitation enhancement effect is very good. Considering the flight cost and catalytic efficiency, the fourth is the most recommended.

3.2.2. Catalytic Test for Rate

Due to the limitations of various meteorological conditions, the seeding dose on precipitation enhancement may not be the most effective. Aiming at achieving the best performance of period rate, we designed four sensitive tests of different seeding rates (Table 3) based on the above analysis to analyze the impact of seeding different rates of catalyzes on precipitation.
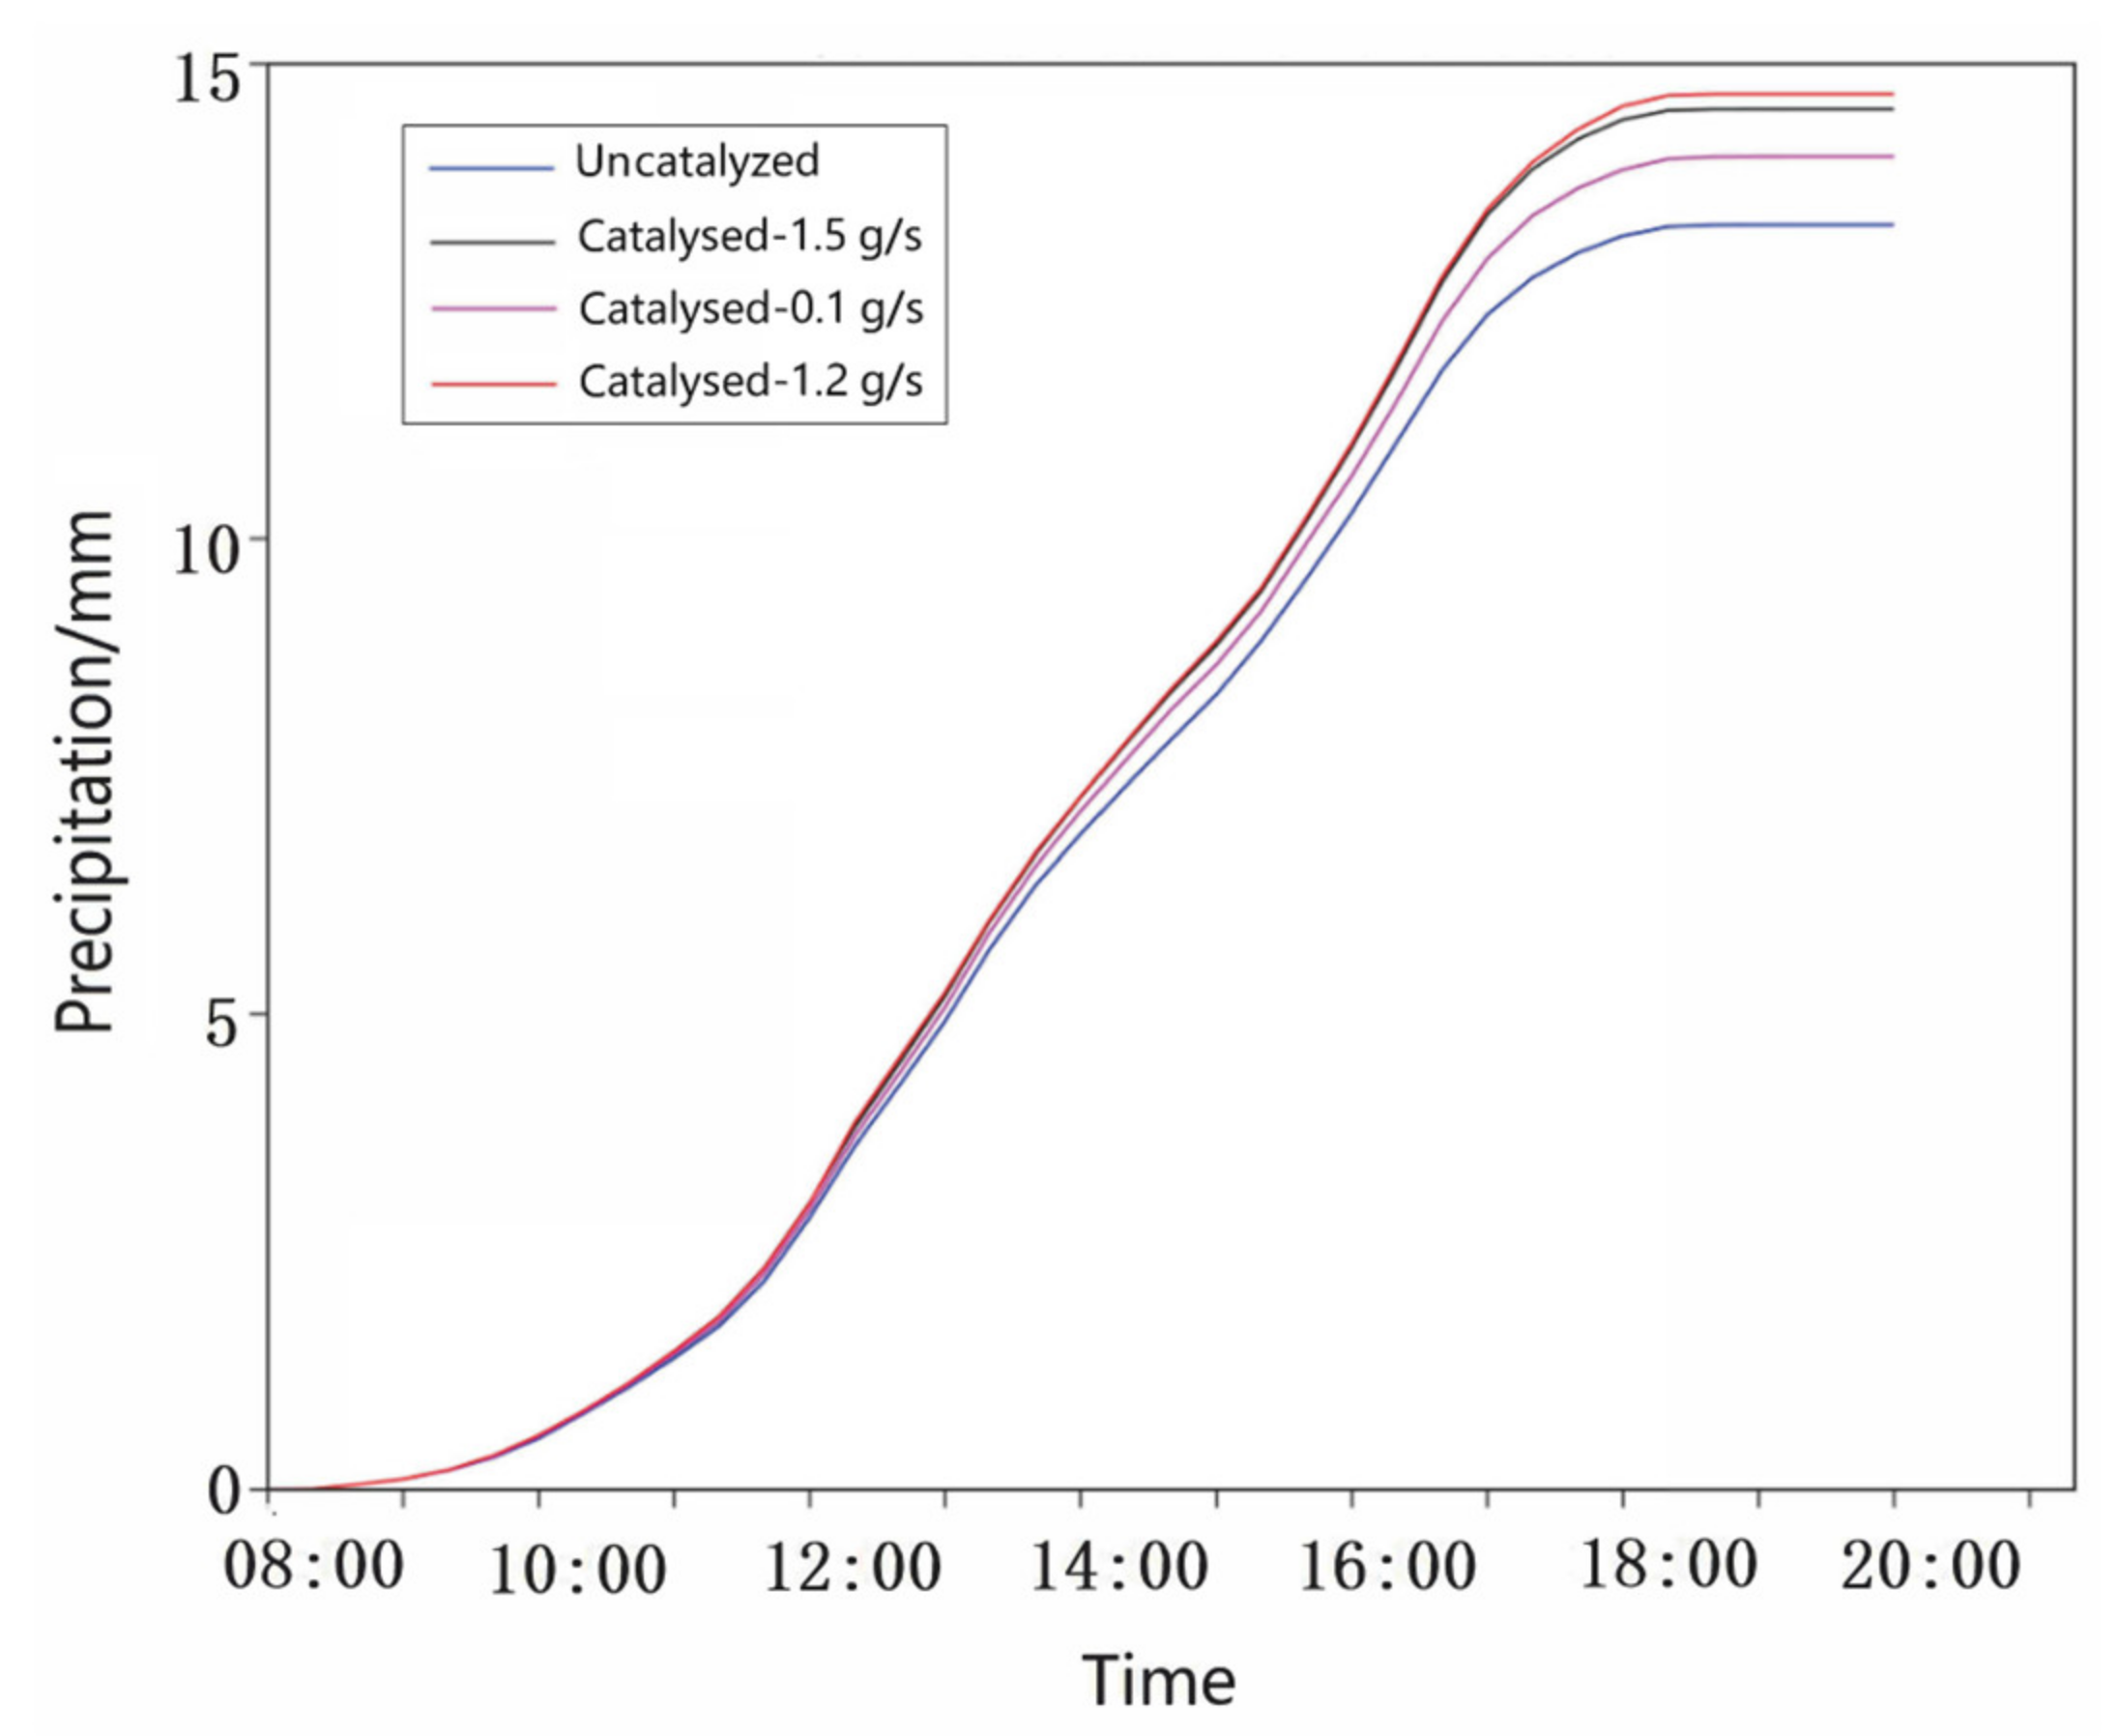
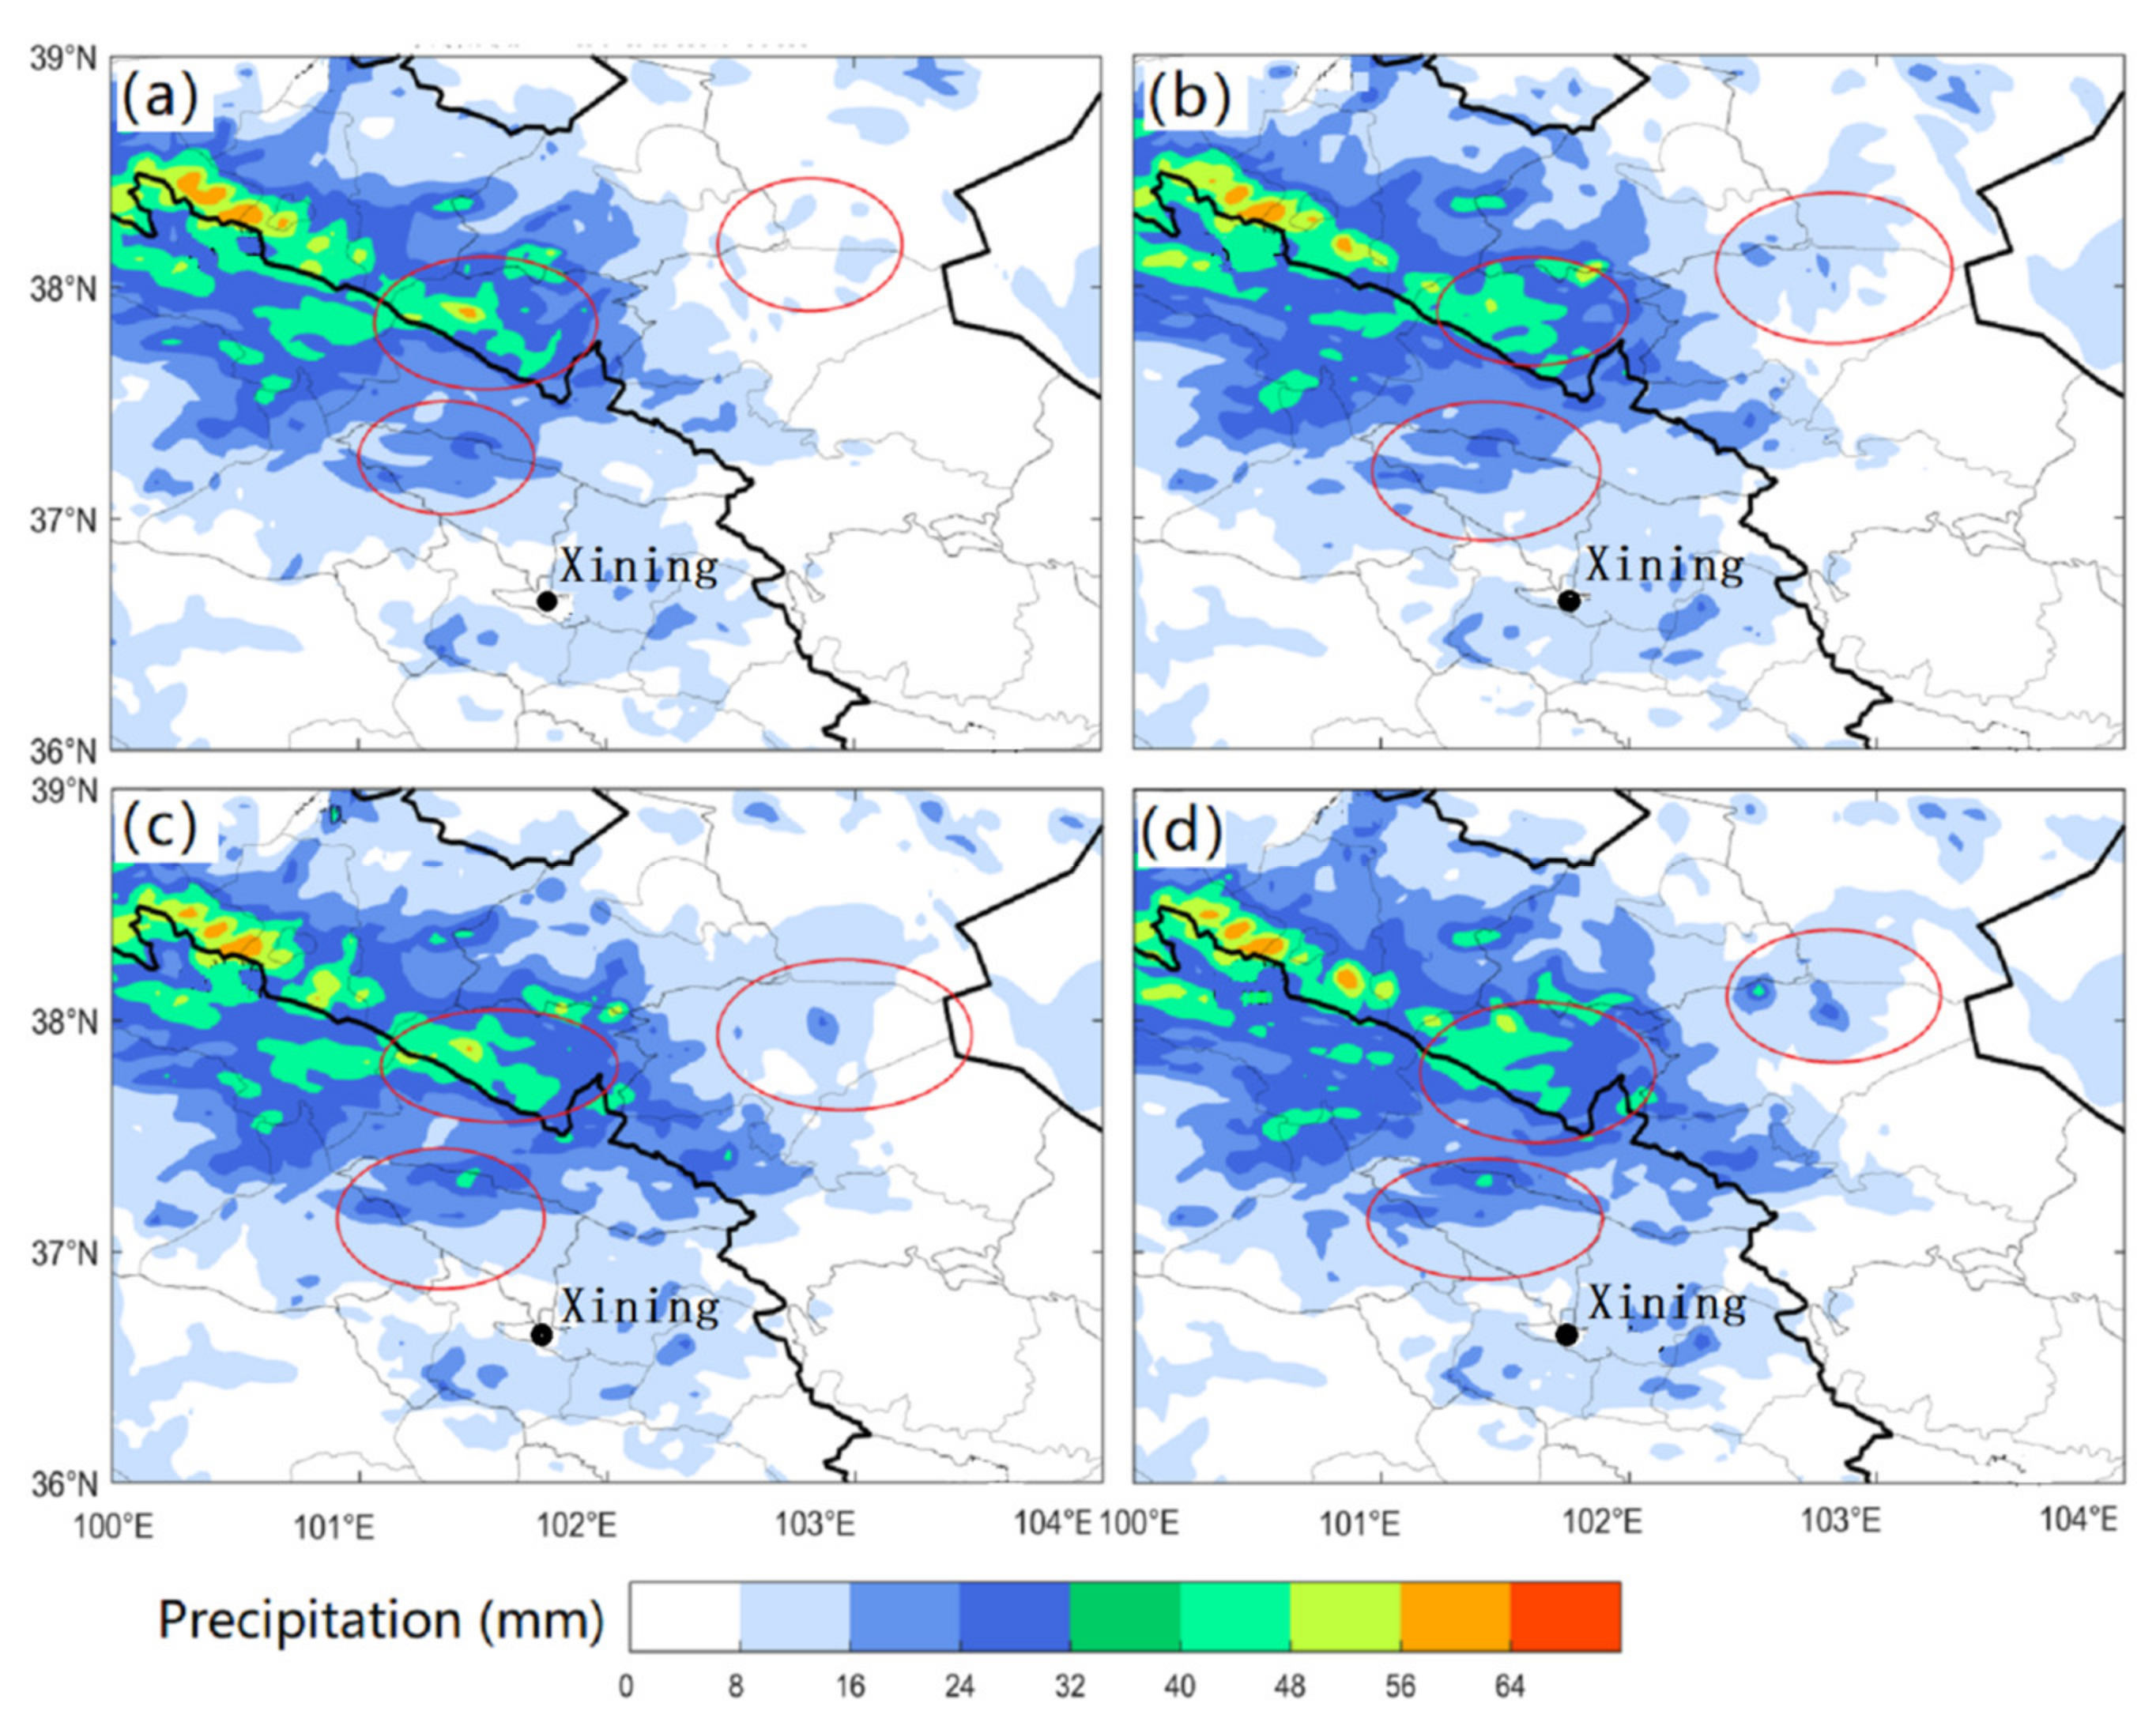
Similar tendencies of different sowing rates on ground rainfall were found and the ground cumulative net precipitation was increasing (Figure 11). The rain-producing area is mainly distributed in the area near the Huangchengshuiguan and Menyuan (Figure 12). Specifically, when the seeding rate exceeded 1.2 g·s−1, the precipitation enhancement effect tends to be stable, and the precipitation increase percentage reaches 10.4%. However, we found an inverse inhibition of precipitation down to 10% in the seeding criteria of 1.5 g·s−1. Results demonstrated that excessive seeding may induce a negative influence on precipitation enhancement.

4. Conclusions and Outlooks

The catalytic simulation of a precipitation process in the Qilian Mountains was carried out using the mesoscale WRF model coupled with the silver iodide catalytic module and referring to the artificial influence of the actual ground rocket precipitation enhancement operation information. The following conclusions can be drawn:
The WRF model coupling with a AgI cold cloud catalytic module applies to the Qilian Mountains, and the simulated precipitation, liquid water content (LWC), and water vapor content (PWV) are all in good agreement with the actual observed results. Considering the wind field observed during the catalysis, both the temporal and spatial distribution of AgI after simulated precipitation enhancement and the process of cloud water transforming into ice crystals after catalysis are reasonable. The 24 h cumulative increase in precipitation during this catalytic process reaches 9.5%. The disseminated AgI particles are in contact with the super-cooled cloud water, freezing so that the cloud water is transformed into ice crystals. The increased ice crystals grow into snow crystals and upon descending and melting to the ground precipitation.
The catalytic effect of AgI varies with heights over the Qilian Mountains. The precipitation enhancement effect is the most favorable in the fifth layer (15 km) of the model, followed by that in the fourth layer (12 km) and the sixth layer (18 km). Considering the flight cost and catalytic efficiency, the fourth is the most recommended. The temperature at the height of the fifth layer (15 km) of the model is about −3 °C, while the ice crystal content is only 0.21 g·kg−1. The catalyzed ice crystal can make full use of the cloud water in the lower layer under gravity settlement, and the precipitation enhancement effect is remarkable. At the same time, the amount of AgI catalyst also exercises a significant impact on the precipitation. In the case of a seeding rate of about 1.2 g·s−1, the precipitation enhancement effect tends to be stable and the precipitation increase percentage reaches 10.4%. However, in the case of a seeding rate of 1.5 g·s−1, the percentage of increased precipitation is 10%, which is lower than that when the seeding rate is 1.2 g·s−1.
The precipitation can be significantly increased by introducing the silver iodide catalyst with a seeding rate of 1.2 g·s−1 at the cold cloud position with a height of 12 km and a temperature of −3 °C. Given the unique landform of the Qilian Mountains, the catalytic effect is more favorable at the height of rich super-cooled cloud water, a low temperature, and relatively small ice and snow crystal content.
The catalytic model reasonably simulates the sedimentary characteristics of silver iodide on complex terrains. These results encourage the application of numerical models in weather modification experiments in the northwest region. Future laboratory and field experiments should adopt improved instruments and sampling strategies to compare with simulation results in order to improve model physics related to seeding.

Supplementary Materials

The following supporting information can be downloaded at: https://www.mdpi.com/article/10.3390/atmos14071086/s1.

Author Contributions

Conceptualization, J.R.; Methodology, W.Z.; Software, M.K.; Validation, J.R.; Formal analysis, Y.M.; Investigation, M.K. and Y.M.; Data curation, J.R.; Writing–original draft, J.R.; Writing–review & editing, W.Z.; Project administration, X.Z. All authors have read and agreed to the published version of the manuscript.

Funding

This research was funded by the Second Tibetan Plateau Scientific Expedition and Research (STEP) Program of the Chinese Academy of Sciences grant number 2019QZKK0104, and the Research fund for Weather modification ability construction project of Northwest China grant number ZQCR18208.

Institutional Review Board Statement

Not applicable.

Informed Consent Statement

Not applicable.

Data Availability Statement

The Reanalysis dataset created or used in this study is publicly accessible from the laboratory of computing and information systems of the National Center for Atmospheric Research at https://doi.org/10.5065/D6M043C6 (accessed on 29 May 2023).

Conflicts of Interest

The authors declare no conflict of interest.

References

  1. Elahi, E.; Khalid, Z.; Tauni, M.Z.; Zhang, H.; Lirong, X. Extreme weather events risk to crop-production and the adaptation of innovative management strategies to mitigate the risk: A retrospective survey of rural Punjab, Pakistan. Technovation 2023, 117, 102255. [Google Scholar] [CrossRef]
  2. Elahi, E.; Khalid, Z.; Zhang, Z. Understanding farmers’ intention and willingness to install renewable energy technology: A solution to reduce the environmental emissions of agriculture. Appl. Energy 2022, 309, 118459. [Google Scholar] [CrossRef]
  3. Zipori, A.; Rosenfeld, D.; Shpund, J.; Steinberg, D.M.; Erel, Y. Targeting and impacts of AgI cloud seeding based on rainchemical composition and cloud top phase characterization. Atmos. Res. 2012, 114, 119–130. [Google Scholar] [CrossRef]
  4. Abbas, A.; Waseem, M.; Ullah, W.; Zhao, C.; Zhu, J. Spatiotemporal Analysis of Meteorological and Hydrological Droughts and Their Propagations. Water 2021, 13, 2237. [Google Scholar] [CrossRef]
  5. Waseem, M.; Khursheed, T.; Abbas, A.; Ahmad, I.; Javed, Z. Impact of meteorological drought on agriculture production at different scales in Punjab, Pakistan. J. Water Clim. Change 2021, 13, 113–114. [Google Scholar] [CrossRef]
  6. Xue, L.; Chu, X.; Rasmussen, R.; Breed, D. Radar observations and WRF LES simulations of the impact of ground-based glaciogenic seeding effect on orographic clouds and precipitation: Part II: AgI dispersion and seeding signals simulated by WRF. J. Appl. Meteorol. Climatol. 2016, 55, 445–464. [Google Scholar] [CrossRef]
  7. Tang, J.; Guo, X.; Chang, Y. A Numerical Investigation on Microphysical Properties of Clouds and Precipitation over the Tibetan Plateau in Summer 2014. J. Meteorol. Res. 2019, 33, 463–477. (In Chinese) [Google Scholar] [CrossRef]
  8. Zhang, W.Y.; Huang, Y.; Yin, X.Z. Observations and Research Progress of Cloud-Seeding (Snow) Project in Qilian Mountains. Adv. Meteorol. Sci. Technol. 2021, 11, 102–116. (In Chinese) [Google Scholar]
  9. Xue, L.; Chu, X.; Rasmussen, R.; Breed, D.; Boe, B.; Geerts, B. The dispersion of silver iodide particles from ground-based generators over complex terrain. Part II: WRF large-eddy simulations versus Observations. J. Appl. Meteorol. Climatol. 2014, 53, 1342–1361. [Google Scholar] [CrossRef] [Green Version]
  10. Liu, Y.B. Coauthors The operational mesogammascale analysis and forecast system of the U.S. Army Test and Evaluation Command. Part I: Overview of the modeling system, the forecast products, and how the products are used. J. Appl. Meteorol. Climatol. 2008, 47, 1077–1092. [Google Scholar] [CrossRef] [Green Version]
  11. Boe, B.; Heimbach, J.A., Jr.; Krauss, T.W.; Xue, L.; Chu, X.; McPartland, J.T. The dispersion of silver iodide particles from ground-based generators over complex terrain. Part 1: Observations by acoustic ice nucleus counters. J. Appl. Meteorol. Climatol. 2014, 53, 1325–1341. [Google Scholar] [CrossRef] [Green Version]
  12. Liu, X.E.; Gao, Q.; He, H.; Ji, L. Numerical Simulation Research on Silver Iodide Cold Cloud Seeding. Meteorol. Mon. 2016, 42, 347–355. [Google Scholar]
  13. Warburton, J.A.; Chai, S.K.; Young, L.G. A new method of assessing snowfall enhancement with silver iodide seeding using physical and chemical techniques. J. Appl. Microbiol. 1996, 35, 1569–1573. [Google Scholar] [CrossRef]
  14. Hsie, E.Y.; Farley, R.D.; Orville, H.D. Numerical Simulation of Ice-Phase Convective Cloud Seeding. J. Appl. Meteorol. 1980, 19, 950–977. [Google Scholar] [CrossRef]
  15. Chen, X.M.; Liu, Q.J.; Zhang, J.C. A Numerical Simulation Study on Microphysical Structure and Cloud Seeding in Cloud System of Qilian Mountain Region. Meteorol. Mon. 2007, 7, 33–43. (In Chinese) [Google Scholar]
  16. Fang, C.G.; Guo, X.L.; Wang, P.X. The physical and precipitation response to AgI seeding from a mesoscale WRF-based seeding model. Chin. J. Atmos. Sci. 2009, 33, 621–633. (In Chinese) [Google Scholar]
  17. Qi, P.; Guo, X.; Chang, Y.; Tang, J.; Li, S. Cloud water path, precipitation amount, and precipitation efficiency derived from multiple datasets on the Qilian Mountains, Northeastern Tibetan Plateau. Atmos. Res. 2022, 274, 798–818. (In Chinese) [Google Scholar] [CrossRef]
  18. Xue, L.; Tessendorf, S.A.; Nelson, E.; Rasmussen, R.M.; Breed, D.; Parkinson, S.; Holbrook, P.; Blestrud, D. Implementation of a silver iodide cloud-seeding parameterization in WRF. Part II: 3D simulations of actual seeding events and sensitivity tests. J. Appl. Meteorol. Climatol. 2013, 52, 1458–1476. [Google Scholar] [CrossRef] [Green Version]
  19. Wang, J.; Chen, Y.W. The mesoscale numerical simulation of the effectiveness of an artificial precipitation enhancement operation. J. Meteorol. Sci. 2011, 31, 613–620. (In Chinese) [Google Scholar]
  20. Guo, X.; Fu, D.; Zheng, G. Modeling study on optimal convective cloud seeding in rain augmentation. J. Korean Meteorol. Soc. 2007, 43, 273–284. (In Chinese) [Google Scholar]
  21. Liu, X.E.; He, H.; Gao, Q. Research on application of the mesoscale silver iodide seeding numerical model. Acta Meteorol. Sin. 2021, 79, 359–368. [Google Scholar]
  22. Xin, J.; Bao, D.; Ma, Y.; Ma, Y.; Gong, C.; Qiao, S.; Jiang, Y.; Ren, X.; Pang, T.; Yan, P. Forecasting and Optimization of Wind Speed over the Gobi Grassland Wind Farm in Western Inner Mongolia. Atmosphere 2022, 13, 1943. [Google Scholar] [CrossRef]
  23. Zhang, L.; Xin, J.; Yin, Y.; Wang, Z.; Wang, D.; Ma, Y.; Jia, D.; Jiang, Y.; Wu, L.; Pan, X. Adaptability evaluation of boundary layer schemes for simulation of sea and land breeze circulation in the west coast of the Yellow Sea. Atmos. Res. 2022, 178, 106354. [Google Scholar] [CrossRef]
  24. Zhang, L.; Xin, J.; Yin, Y.; Chang, W.; Xue, M.; Jia, D.; Ma, Y. Understanding the Major Impact of Planetary Boundary Layer Schemes on Simulation of Vertical Wind Structure. Atmosphere 2021, 12, 777. [Google Scholar] [CrossRef]
  25. Cai, M.; Zhou, Y.; Liu, J.; Tan, C.; Tang, Y.; Ma, Q.; Li, Q.; Mao, J.; Hu, Z. Quantifying the cloud water resource: Methods based on observational diagnosis and cloud model simulation. J. Meteorol. Res. 2020, 34, 1256–1270. [Google Scholar] [CrossRef]
  26. Geerts, B.; Miao, Q.; Yang, Y.; Rasmussen, R.; Breed, D. An airborne profiling radar study of the impact of glaciogenic cloud seeding on snowfall from winter orographic clouds. J. Atmos. Sci. 2010, 67, 3286–3302. [Google Scholar] [CrossRef] [Green Version]
  27. Geresdi, I.; Xue, L.; Rasmussen, R. Evaluation of orographic cloud seeding using bin microphysics scheme. Part I: Two-dimensional approach. J. Appl. Meteorol. Climatol. 2016, 55, 1443–1462. [Google Scholar]
  28. Mirocha, J.; Kosović, B.; Kirkil, G. Resolved turbulence characteristics in large-eddy simulations nested within mesoscale simulations using the weather research and forecasting model. Mon. Weather Rev. 2014, 142, 806–831. [Google Scholar] [CrossRef]
  29. Shuangxi, F.; Hongfen, Z.; Lijie, Y. Comparative analysis of different types of precipitation characteristics in the northern foot of Qilian Mountain under the influence of topography. Arid. Zone Res. 2021, 38, 1226–1234. (In Chinese) [Google Scholar]
  30. Thompson, G.; Rasmussen, R.M.; Manning, K. Explicit forecasts of winter precipitation using an improved bulk microphysics scheme. Part I: Description and sensitivity analysis. Mon. Weather Rev. 2004, 132, 519–542. [Google Scholar] [CrossRef]
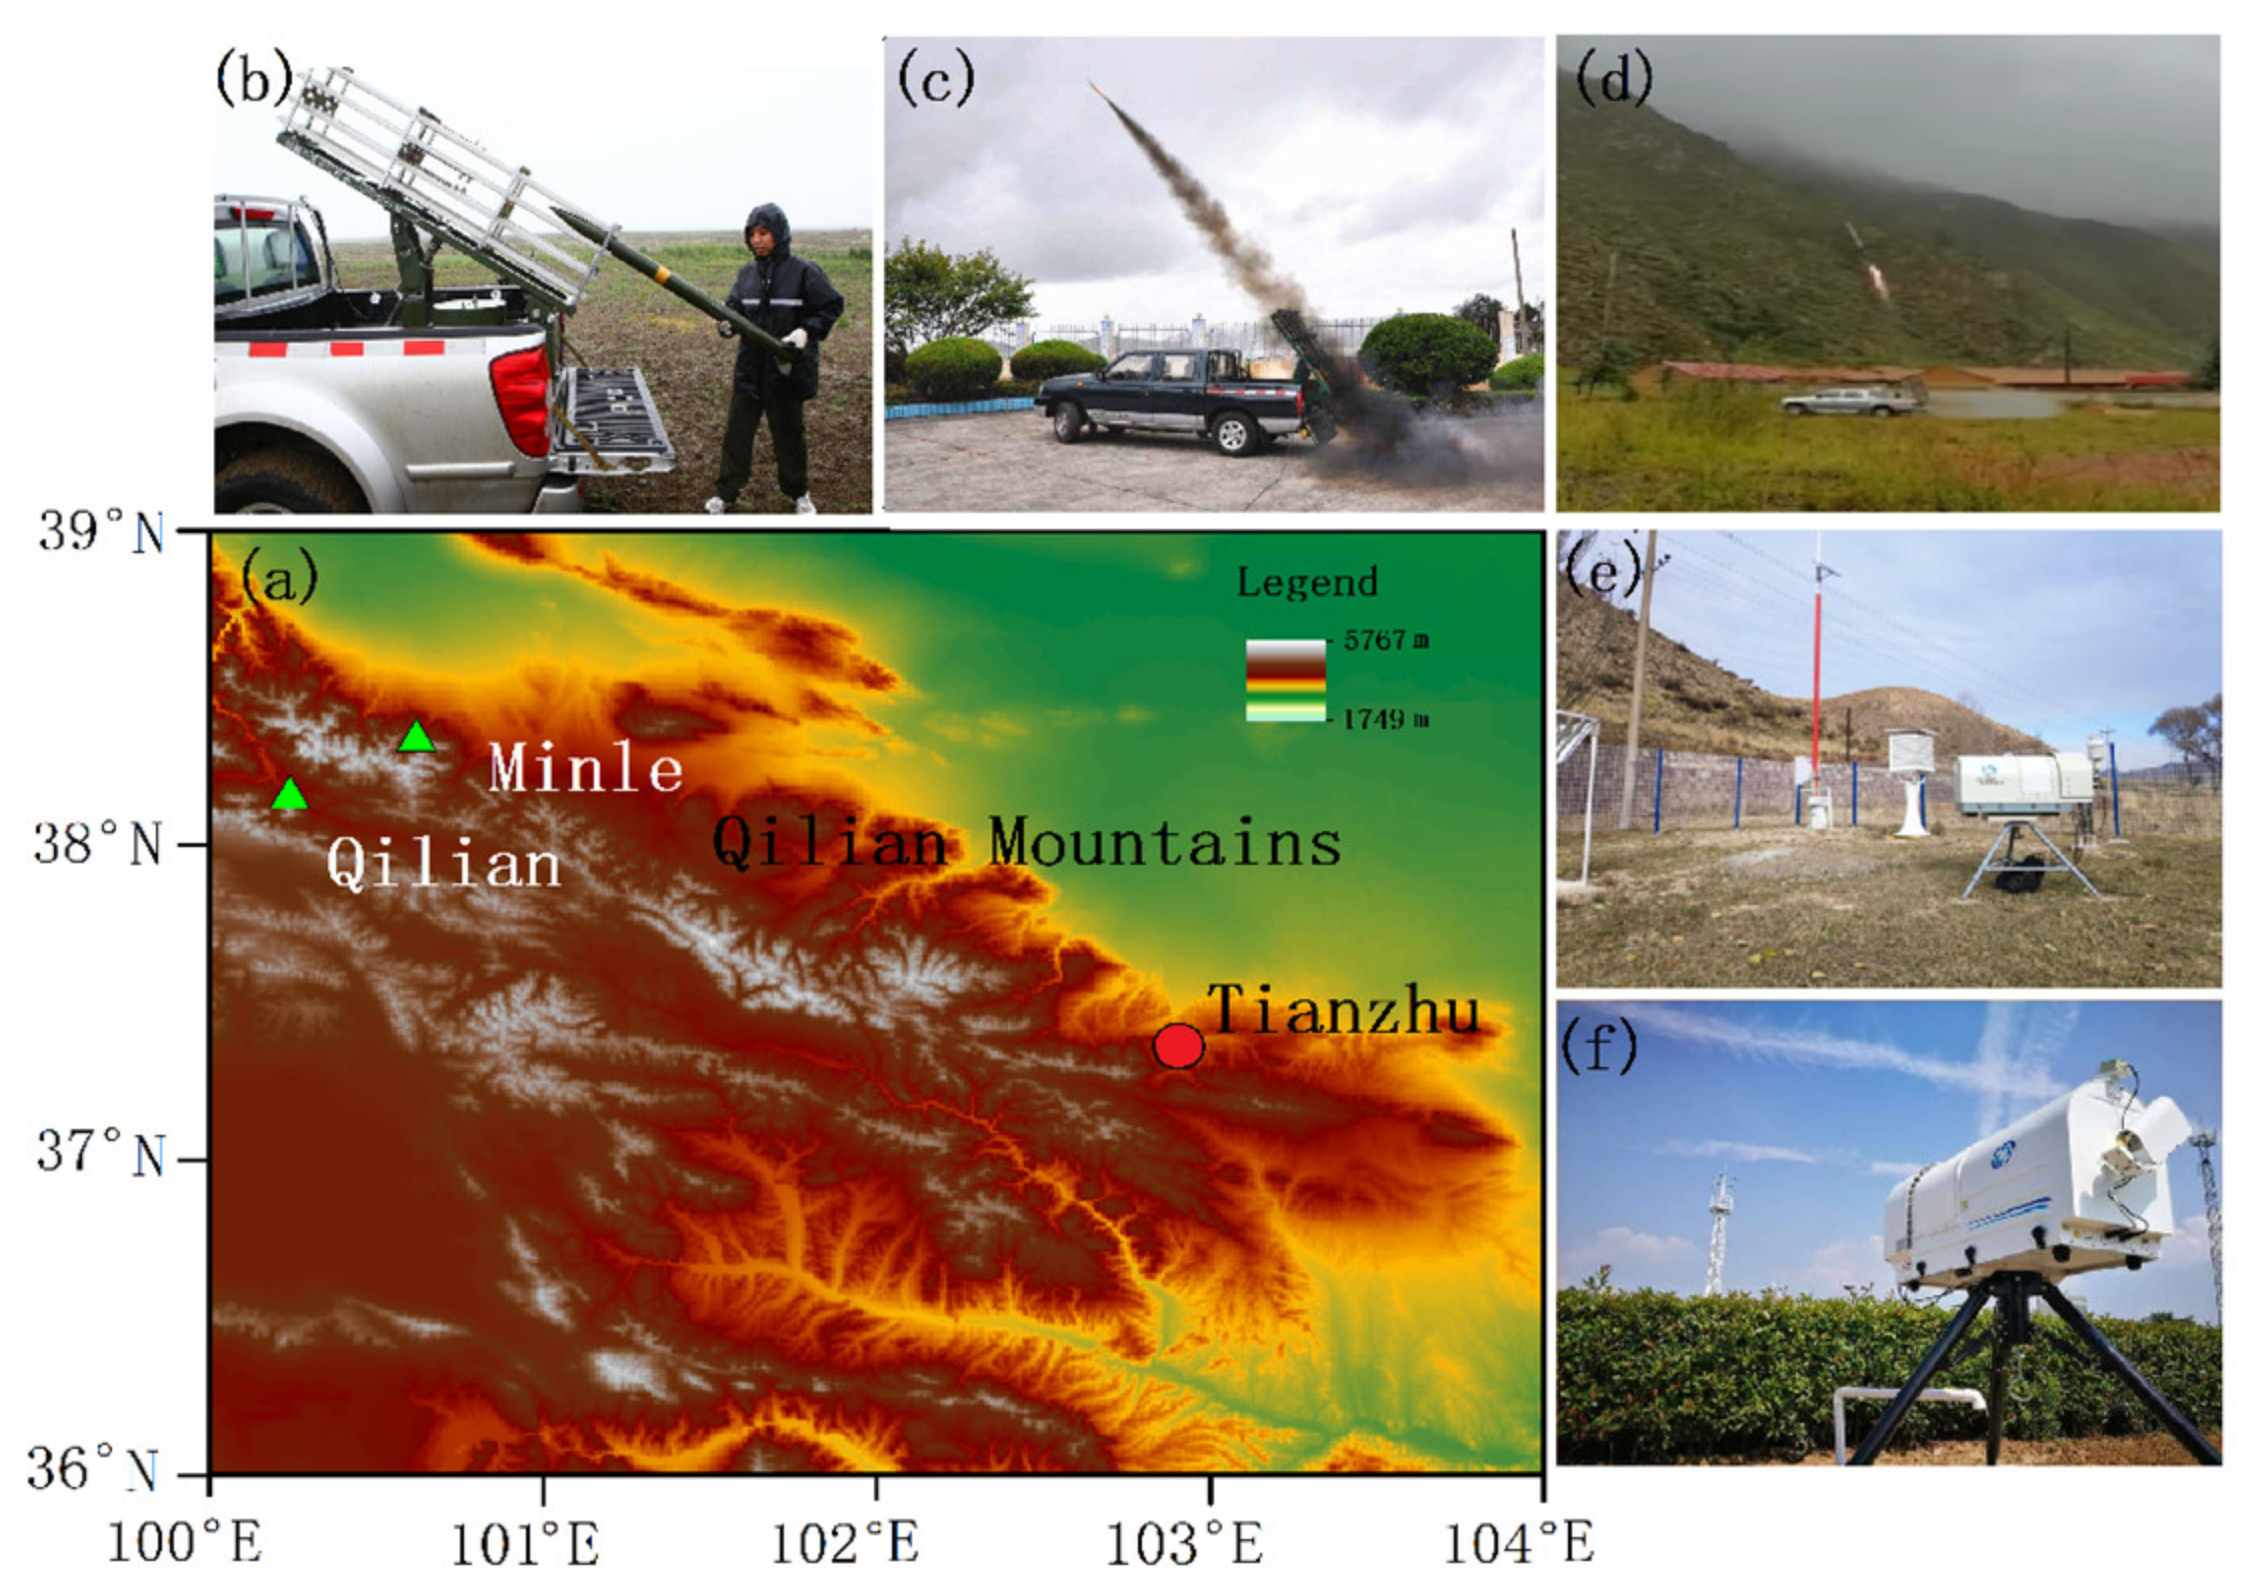
Figure 1. (a) Topography and distribution of main observation stations in the Qilian Mountains; (bd) show the launching of rockets; (e,f) are the photos of microwave radiometers mounted in the Qilian and Minle stations, marked as green triangles in (a).
Atmosphere 14 01086 g001
Figure 2. The triple nested domains of d01, d02, and d03 adopted in the WRF model (left panel). The right panel shows the location of the Qilian Site, Minle Site, and Tianzhu Site. False-color of the two panels denotes terrain height.
Atmosphere 14 01086 g002
Figure 3. Comparison between the simulated and observed precipitation. Colored dots denote the differences between simulations and measurements on 16 August 2020 in different stations.
Atmosphere 14 01086 g003
Figure 4. Comparison of WRF–simulated and radiometer–measured precipitable water vapor (PWV) and liquid water content (LWC) at Qilian and Minle stations on 16 August 2020. PWV for (a) Qilian and (b) Minle; LWC for (c) Qilian and (d) Minle.
Atmosphere 14 01086 g004
Figure 5. Horizontal distributions of AgI number concentration at 12 km at (a) 09:00, (b) 14:00, (c) 19:00, and (d) 22:00 on 16 August 2020.
Atmosphere 14 01086 g005
Figure 6. Spatial distribution of the difference between catalytic and uncatalyzed precipitation at 10:00 on 16 August 2020, and vertical structural profile of AgI number concentration along the black line on August 16, 2020. (a) Color shadings show the precipitation. The black line segment shows the section line along the area with the largest precipitation difference; (b) 09:00, (c) 14:00, (d) 19:00, and (e) 22:00. The color shadow shows the spatial distribution of AgI number concentration.
Atmosphere 14 01086 g006
Figure 7. Diurnal variation of hourly–cumulated precipitation in the study area with and without catalysis on 16 August 2020.
Atmosphere 14 01086 g007
Figure 8. Spatial distribution of catalyzed and uncatalyzed accumulated precipitation in the study area on 16 August 2020. Color shadings show the precipitation. Red circles indicate areas with obvious rainfall enhancement effect. Black circles indicate areas with obvious rainfall reduction effect.
Atmosphere 14 01086 g008
Figure 9. Diurnal variation of each hydrometeor in the natural cloud and catalytic cloud on 16 August 2020. (a1e2) Denote the contents of cloud water, rain, ice, snow and graupel. The points of (1) and (2) are to present the hydrometeor content of natural and catalytic clouds, respectively.
Atmosphere 14 01086 g009
Figure 10. Evolution of cumulative precipitation over time after catalysis at different sowing heights on 16 August 2020.
Atmosphere 14 01086 g010
Figure 11. Evolution of cumulative precipitation over time after catalysis with different seeding rates on 16 August 2020.
Atmosphere 14 01086 g011
Figure 12. Spatial distribution of catalyzed and uncatalyzed cumulative precipitation with different AgI Seeding Rates. Color shadings show the precipitation. (a) Uncatalyzed, (b) seeding rate 0.1 g s−1, (c) seeding rate 1.2 g s−1, and (d) seeding rate 1.5 g s−1. Red circles indicate areas with obvious rainfall enhancement effects.
Atmosphere 14 01086 g012
Table 1. WRF analog settings.
Domain 1Domain 2Domain 3
Grid spacing27 km9 km3 km
Lattice number115 × 91154 × 124154 × 124
Vertical layer343434
Model top height50 hPa50 hPa50 hPa
Cumulus parameterization schemeGrell-DevenyiGrell-Devenyi-
Boundary layer schemeBMJBMJBMJ
Land surface process schemeRUCRUCRUC
Long wave radiation schemeRRTMRRTMRRTM
Cloud microphysics solutionThompsonThompsonThompson
Surface layer schemeEtaEtaEta
Short wave radiation schemeGoddardGoddardGoddard
Table 2. Average value of the regional physical quantity at the catalytic time.
Vertical LayerCloud Water
(g·kg−1)
Ice Crystal
(g·kg−1)
Vertical Velocity
(m·s−1)
Temperature
(°C)
30.1100.2500.05015
40.0800.2100.065−3
50.0250.0900.061−21
60.0010.0030.027−39
Table 3. Sensitivity test scheme of different sowing doses.
Test NameSowing Range
(km)
Seeding Rate
(g·s−1)
Duration
(min)
Increase Precipitation Percentage
(%)
Increase Precipitation
(mm)
CTL-1nullnullnullnullnull
S1-154 × 54 × 150.1105.40.72
S1-254 × 54 × 151.21010.41.38
S1-354 × 54 × 151.51010.01.32
Disclaimer/Publisher’s Note: The statements, opinions and data contained in all publications are solely those of the individual author(s) and contributor(s) and not of MDPI and/or the editor(s). MDPI and/or the editor(s) disclaim responsibility for any injury to people or property resulting from any ideas, methods, instructions or products referred to in the content.