Abstract
Ice cloud optical thickness (IOT) is an important parameter to characterize ice cloud properties and in the determination of cloud–radiation parameterization schemes, and the variation trend of ice clouds is more concerned with the study of weather and climate. In this paper, we analyzed the spatial and temporal distributions of IOT over the region between ±60° latitude. Cloud product data from March 2000 to February 2021 acquired from the Moderate Resolution Imaging Spectroradiometer (MODIS) aboard NASA’s Aqua satellite were used in this study. Theil–Sen median trend analysis and EOF analysis methods were used to study the variation trend of IOT. The research results indicate that the monthly average IOT shows a “W” distribution from January to December, with a maximum reached in July (12.15) and a double bottom reached in March (10.7) and October (10.99), respectively. The average global IOT reaches the maximum in June–August, it tends to decrease with time, and its slope is −0.01 year−1. The statistical analysis results show that the area with an increase accounted for 49.4% of the total ice cloud coverage area; the area with a trend of significant increased and decreased is both 2.2%. The probability distribution of IOT reaches the maximum, around 3.25%, when the IOT is larger than 1.5 and less than or equal to 2.
1. Introduction
Clouds extensively overlay approximately 60–70% of the Earth’s surface and play a critical role in the Earth–atmosphere energy budget and the hydrological cycle [1,2,3]. They can efficiently capture long-wave radiation emitted from the Earth’s surface and atmosphere, typically causing surface warming. At the same time, they also absorb incident shortwave radiation at near-infrared wavelengths, often resulting in localized heating in the upper troposphere [4,5,6]. However, their overall effect is determined by the characteristics of clouds, for instance, cloud phase, cloud optical thickness, liquid/ice water content, etc. Clouds are produced by the condensation of water vapor in the air. Clouds can be divided into water clouds, ice clouds, or mixed clouds which comprise water droplets and ice crystals. Ice clouds are studied in this paper. For high and thin ice clouds, they have a net warming effect, because they are almost transparent to incident radiation from the sun while non-transparent to long-wave radiation. In other words, their greenhouse effect exceeds the reflection effect on the sun [3]. However, for thick ice clouds, the solar albedo effect would dominate. It is an interesting scientific question as to where the warming–cooling separation of ice clouds occurs in. To better understand how ice clouds affect radiation, ice cloud optical thickness (IOT) is crucial.
Over the past few decades, many studies have focused on the macro-physical and microphysical properties of ice clouds, including the distribution of the ice water path, the ice cloud occurrence frequency, the optical thickness, and the effective radius of the ice cloud. Ice clouds are extensively distributed in polar regions, midlatitudes, and tropical regions; moreover, their coverage is larger than 30% from 60° N to 60° S [7,8,9]. Research on the nature of ice clouds over the Tibetan Plateau shows that ice clouds are mainly distributed in the edge areas of the Tibetan Plateau, especially on the northern slopes, and ice clouds occur more frequently during the day [10]. Ice clouds occur more frequently on land in the tropics with a frequency of about 43%. The distribution of IOT and the ice water path is extremely biased towards small values [11]. Through the analysis of Cloudsat/Cloud-Aerosol Lidar and Infrared Pathfinder Satellite Observations (CALIPSO) data over a period of 2 years in 2008 and 2013, the relatively thick ice cloud occurrence frequency was found to show a strong seasonal correlation at high latitudes, and the frequency during the Arctic winter was not less than twice that of any other season [12,13]. Huang et al. use Moderate Resolution Imaging Spectroradiometer (MODIS) data in Aqua and the multi-layered cloud retrieval system to recapture the ice water path, finding that the average daytime IOT overlapping ice-over-water clouds on the surface of the ocean is 7.6 [14].
The radiation characteristics of ice clouds are critical to climate studies [15] and are mainly determined by the IOT and ice cloud effective radius (ICER) [16,17]. Considerable efforts have been made by many researchers to investigate IOT. Zhang et al. [18] use the Beijing Climate Center Radiative Transfer Model of BCC_RAD combined with MODIS datasets from 2000 to 2018 to study the ice cloud thickness in East Asia and found that the ice cloud thickness trends in northeastern and southern China are 6.2 × 10⁻²/year and −9.0 × 10⁻³/year, respectively. In a study, the characteristics of ice clouds were studied by using CloudSat radar and CALIPSO lidar datasets; the results show that the frequency of ice cloud occurrence is not only related to the regions and season but determined by the types of ice clouds which are defined by the optical depth value [19]. While, it’s rare to use more than twenty years of data to study the spatiotemporal distributions of IOT and the trend of its variation.
With the quick advancement of technology, it is now possible to employ ground-based and space-based lidar, airplanes, and satellites to explore the microphysical characteristics of ice clouds, such as cloud optical thickness and ice crystal effective radius, as well as their geographical and temporal distributions. For example, because of their lack of sensitivity, ground-based radars overlook a portion of the high ice cloud that is optically and geometrically thin but can pass through optically thick clouds [20,21]. The Advanced Very High-Resolution Radiometer (AVHRR) and Visible Infrared Imaging Radiometer Suite (VIIRS) [8,22,23], MODIS [24], and High-resolution Infrared Radiation Sounder (HIRS) [25] observations provide a long-term record of the properties of global ice clouds, which is helpful to study the radiative effect and climate responses. In addition, there are many spaceborne hyperspectral infrared (IR) sounders that have been used to observe ice clouds, e.g., the Atmospheric Infrared Sounder (AIRS) on the EOS Aqua platform [26], the Infrared Atmospheric Sounding Interferometer (IASI) [27], and the Cross-track Infrared Sounder (CrIS) [28]. They have been providing dependable products for ice cloud optical properties for decades [16,29].
In the present research on cloud characteristics and cloud–radiation parameterization systems, IOT is one crucial metric. In this paper, the spatiotemporal distributions of IOT are statistically analyzed by MODIS cloud products from 2000 to 2021; additionally, the tendency for IOT variation is investigated. The following is how the document is set up: the cloud datasets and methods used in this research are briefly described in Section 2. The spatial distributions, trends, and time sequence changes of IOT are presented in Section 3. Section 4 and Section 5 contain the discussions and succinct findings, respectively.
2. Data and Methodologies
2.1. MODIS Datasets
The MODIS instrument is carried by NASA’s Terra and Aqua satellites, and their corresponding transit periods are 10:30 and 13:30 local time. The MODIS is designed to monitor the atmosphere, oceans, and terrestrial ecosystems on a worldwide scale [30,31,32]. The MODIS measures spectrum ranges from the visible to the infrared, divided into 36 different spectral bands, with an observation swath of 2330 km. Three different levels of MODIS data are accessible. Cloud phase, cloud-top attributes, and cloud optical properties have been incorporated into MODIS level-2 and level-3 cloud products, and the level-3 dataset is generated from the level-2 data products. The global atmospheric parameters are averaged on a 1° × 1° grid; this means that the level-3 products correspond to a longitude of 360 pixels and a latitude of 180 pixels. In this research, the Terra satellite cloud products (MOD08_M3_v6) are employed to study the spatiotemporal distributions of IOT. You can find more information about the algorithm for obtaining cloud parameters at http://modis-atmos.gsfc.nasa.gov (accessed on 1 February 2023).
This research primarily concentrates on the spatiotemporal distributions and fluctuations of IOT in middle latitudes and tropical regions (60° S–60° N) because of the considerable inaccuracy of MODIS ice cloud inversion in high latitudes [33]. The global average values and trend of IOT are calculated from the grids at (60° S, 60° N). Here is a cautionary note that the result of high-latitude regions should be used with caution in scientific research.
2.2. Analysis Methods
2.2.1. Average IOT
In order to investigate the spatiotemporal distribution of IOT, we regard the period from 1 March 2000 to 28 February 2001 as 2000, 1 March 2001 to 28 February 2002 as 2001, etc., and 1 March 2021 to 28 February 2022 as 2021. In addition, there are 360 longitudes × 120 latitudes × 12 months/year × 22 year grid points. On the ground of mid-latitude regions, four seasons are defined to analyze the seasonal distribution of IOT, namely: for the Northern Hemisphere, March through May is Spring, June through August is Summer, September through November is Autumn, and December through February of the following year is Winter. For the Southern Hemisphere, on the other hand, Summer is from December to February of the coming year and Winter is from June to August.
The MODIS level-3 monthly products are used to generate the pixel count data. The ice-cloudy pixel counts are used to weight the average IOT value at each grid point, and the methodology is as follows:
where is the optical thickness; for the ith month at each grid point, the equals 1 in this paper. They are derived using the entire span of MODIS data in addition to specific months and seasons.
2.2.2. Theil–Sen Median Trend Analysis and the Mann–Kendall Test
The Sen slope estimation is also known as the Theil–Sen median trend analysis. Its foundation is non-parametric statistics proposed by Sen [34]. Additionally, it works especially well for the estimation of trends by calculating the median slopes in small series. In this paper, the slope is used to calculate the annual change rate of IOT in the global hemisphere from 2000 to 2021. The calculation formula is as follows:
where is the slope value of the long-time series of IOT by the Theil–Sen median, which represents the trend of IOT. and represent the IOT values of years of i and j, respectively. When , this indicates that there is an increasing trend in IOT with the year, and when this indicates that there is a decreasing trend in IOT with the year.
A nonparametric statistical test methodology called the Mann–Kendall test was originally put forth by Mann in 1945 and was further enhanced by Kendall [35]. It has the benefits that the measured values are not required to follow a normal distribution, the trend is not required to be linear, and missing values and abnormal values are not taken into account. It has been extensively employed in the trend significance test of long-time series data. For the IOT time series, , the statistic , and the statistics of are characterized as
where the statistic does indeed have a value between . If at a particular threshold of significance , then there is a substantial trend. The Mann–Kendall test and the Theil-Sen Median trend analysis method can always be quickly and effectively combined to better evaluate the trend of long and complex time series data [36]. They have been widely used in meteorology and hydrology.
2.2.3. Empirical Orthogonal Function (EOF)
EOF was proposed by the statistician Pearson and integrated into atmospheric science studies by Lorenz in the middle of the 1950s [37]. It is now the approach in climate statistical diagnostics that is most frequently utilized. EOF converts a field containing several spatial points across time into an orthogonal function variable field, and each typical mode contains as much original field information as possible and the linear combination of these typical modes can maximize the explanation of the original field. You can acquire more information about the precise decomposition method of EOF in the pertinent reference material [38], which is not specifically covered here. The distribution of the variable field’s variability is described by the eigenvectors in the EOF results. It is a sign that an eigenvector has two different sorts of distributions—increasing and decreasing—if its constituent parts have positive and negative distributions. If all of the components are positive, then the variation trend of the variables in this region is uniformly increasing or decreasing. An associated time coefficient sequence and characteristic value are assigned to each eigenvector. The eigenvector-representative distribution type’s features that change over time are represented by the time coefficient. The more typical the positive (or negative) distribution corresponding to the moment is, the greater the absolute value of the coefficient. The variance contribution of the eigenvector is represented by the eigenvalue.
2.2.4. Correlational Analysis
In statistical analysis, Pearson’s is employed to analyze the linear correlation between IOT and time. According to the Cauchy–Schwarz inequality, Pearson’s varies from −1 to +1, where +1/−1 means total positive/negative linear correlation. When (), the IOT is positively (or negatively) correlated to time. The larger indicates a stronger correlation [39]. The formula is:
3. Temporal and Spatial Variation of IOT
3.1. Time Sequence Variation of IOT
The temporal variation of IOT extracted from MODIS satellite data from 2000 to 2021 is depicted in Figure 1. The solid red line represents the median value of IOT, and the blue dashed line represents the average value. Figure 1a,b shows the seasonal and monthly average IOT (2000–2021) based on the MODIS satellite level-3 data. The months of June–August (JJA) and March–May (MAM) have the highest and lowest seasonal average IOT, respectively, which suggests that the IOT is significantly affected by seasonal changes. The monthly average IOT varies in a “W” shape from January to December and reaches a maximum of 12.15 in July. The IOT begins to decrease after December and reaches a minimum value of about 10.7 in March, then gradually increases before the end of July. The monthly average IOT is down to peaks in March and October, respectively. The interannual variation of IOT is not obvious (Figure 1c). The annual average value of IOT is about 11.4, the maximum, of about 11.75, is reached in 2011, and the minimum, of around 11.19, is reached in 2016. From 2004 to 2009, the median value of IOT is lower than the annual average value, indicating that more than half of the IOT values are less than the average value. However, from 2010 to 2020, the tendency is in the opposite direction, which implies that IOT may be pulled down by thin ice clouds. At the same time, the global IOT shows a slow increase trend before 2011 and a slow decrease in devices from 2011 to 2021.
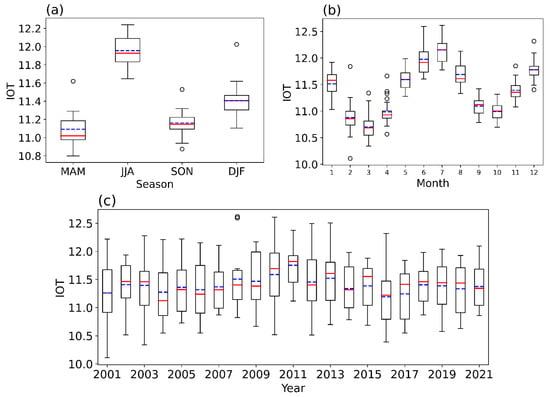
Figure 1.
Time series of ice cloud optical thickness from 2000–2021. (a) seasonal average, (b) monthly average, and (c) annual average. Note, the solid red line represents the median value, the blue dashed line represents the average value.
3.2. Seasonal Distribution of IOT
Figure 2 shows the variation trend of the seasonal average IOT with year. For global average IOT, it attains its highest level in June–August, and its lowest point in March–May (Figure 2a). In addition, there is a decreasing tendency in these seasons. The slopes of seasonal average IOT are −1.0 × 10⁻²/year in June–August and −3.0 × 10⁻³/year in March–May, respectively. The Pearson’s R of the average IOT is −0.368 in June–August; this indicates that the average IOT is negatively correlated with time. However, there is an increasing tendency in September–November and December–February in the next year; their slopes are 2.0 × 10⁻³/year and 5.0 × 10⁻³/year, respectively. In the Southern Hemisphere, the seasonal average IOT achieves its minimum in September-November and its maximum in June–August (Figure 2b). Moreover, the Southern Hemisphere’s seasonal average IOT has an upward trend from spring to winter. For the seasonal average IOT in the Northern Hemisphere, it approaches its minimum in March–May and its maximum in September–November (Figure 2c). The IOT in the Northern Hemisphere shows the “^” trend with the seasons. From 2001 to 2020, the seasonal average IOT in June–August shows an obviously decreasing tendency; the slope is −1.4 × 10⁻²/year in the Southern Hemisphere and −7.0 × 10⁻³/year in the Northern Hemisphere, respectively.

Figure 2.
The line chart of the ice cloud optical thickness in four seasons from 2000 to 2021: (a) global; (b) Southern Hemisphere; (c) Northern Hemisphere.
Figure 3 displays the distribution of the annual average IOT with latitude for each season from 2000 to 2021. The average IOT for the mid-latitude areas in the Northern Hemisphere reaches its maximum in December–February of next year, while in the Southern Hemisphere, it achieves its maximum in June–August. As a result, the average IOT for these regions always peaks in the winter. The minimum average IOT over the (42° N, 60° N) latitude zone appears in March–May, while it appears in September–November over the (45° S, 60° S) latitude zone; in other words, the annual average IOT reaches the smallest value in spring. The results indicate that the IOT varies obviously with the changing season. This might be related to the process by which ice clouds arise. The IOT is at its highest point throughout the year in the winter because of the higher amount of ice crystal formation brought on by the lower atmospheric temperature. However, the variation trend of annual average IOT in the tropical region is very different from that in other regions. The red curve representing June–August peaks around 10° N, but the light purple curve representing December–February in the next year exhibits less pronounced features with a local average peak of about 5° N. This indicates the presence of the intertropical convergence zone (ITCZ). The results are consistent with the findings in reference [11,12,13].
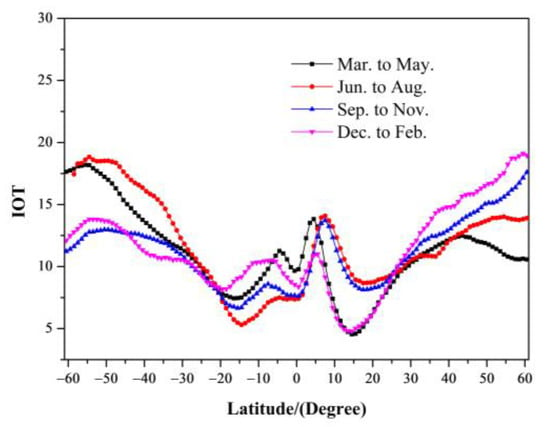
Figure 3.
The distribution of the 21-year average ice cloud optical thickness with latitude in different seasons.
3.3. Spatial Distribution of IOT
Figure 4 shows the spatial distribution of the annual average IOT from 2000 to 2021. There are significant geographical differences in the annual average IOT. The annual average IOT exhibits a tendency of first falling and then increasing from 6° N to 60° N in the Northern Hemisphere, and it reaches its minimum at around 15° N latitude. Although a similar trend is seen in the Southern Hemisphere, the trend of IOT is not entirely consistent between the Northern and Southern Hemispheres. In each hemisphere, the IOT variation with longitude varies differently at the same latitude zone. The variation of annual average IOT for the mid-latitude region with longitude is evident in the Northern Hemisphere, but less noticeable in the Southern Hemisphere. Areas with high annual average IOTs are mainly found in the west of South America, the southeast of South America, and the southern region of China, where the annual average IOT may reach >21.0. The amount of solar radiation, the amount of water vapor in the atmosphere, and the geography all have a significant impact on these regions’ IOT [40]. The areas with small IOT are primarily found in the 10° S–20° S and 10° N–20° N latitude zone, especially over the ocean near 11.5° S, and the minimum IOT is less than 5.0. The IOT in these areas is mainly influenced by the amount of solar radiation and the water vapor content in the atmosphere and is less affected by geography. The annual average IOT near 60° in both hemispheres is larger than at other latitudes.
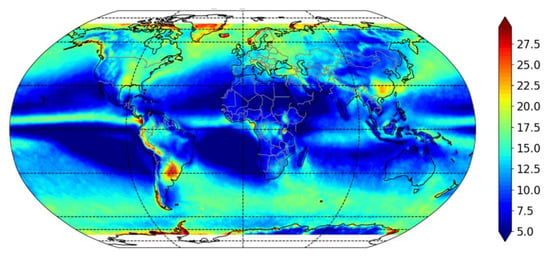
Figure 4.
Annual average ice cloud optical thickness (2000–2021) using MODIS data.
Figure 5 shows the spatial distribution of the monthly average IOT from 2000 to 2021. In tropical regions, IOT exhibits a banded distribution, and its peak shifts north-south with the month, consistent with the trend of ITCZ. For the mid-latitude region in the Northern Hemisphere, the monthly average IOT decreases first and then increases from January to December, reaching a minimum in July. For example, the IOT in the southern region of China (the middle and lower reaches of the Yangtze River) and the Pacific Northwest region with high values of IOT reaches its minimum in July and its maximum in January. The Yangtze River’s middle and lower portions in the summer are where cold air from the freezing zone and warm, humid air from the western Pacific meet, maintaining a continuous water vapor content [40]. For the southern hemisphere, the IOT in the mid-latitude zone, with the exception of the South American west coast at (0°, 18° S) latitude, shows a trend of increasing initially and then decreasing from January to December. The west coast of South America at (0°, 18° S) latitude and Uruguay exhibit a tendency that is first decreasing and then increasing from January to December; the highest value of IOT is about 25.4. The influence of large-scale circulation anomalies on the climate of the monsoon region is highlighted based on a novel dynamic index for the westward ridge point, which in turn affects the distribution of IOT [41].
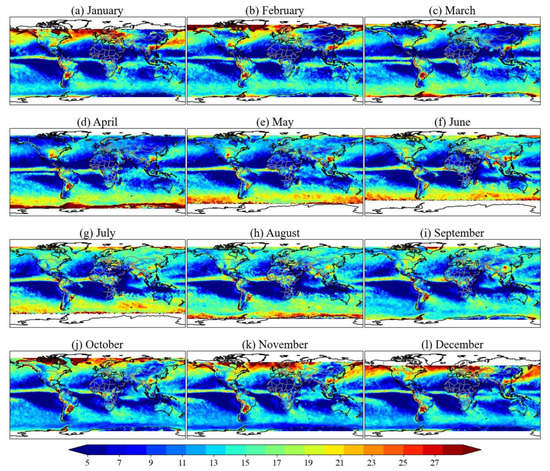
Figure 5.
Spatial distribution map of the monthly average cloud optical thickness from 2000–2021 using MODIS satellite data: (a) January; (b) February; (c) March; (d) April; (e) May; (f) June; (g) July; (h) August; (i) September; (j) October; (k) November; (l) December.
Figure 6 depicts the distribution of the seasonal average IOT during the period of 2000–2021. There is obvious seasonal variation, and the seasonal variations in IOT are different in different regions. For the tropics west of the prime meridian, the area with the largest IOT is located in the northern hemisphere. Figure 3 and Figure 6b,d indicate the existence of ITCZ, which is clearly moving south and is more evident over land. For most parts of the midlatitude region, the highest value in IOT occurs in winter in each hemisphere; however, the lowest value of IOT occurs in spring in the Northern Hemisphere and summer in the Southern Hemisphere. The intensity of solar radiation and the amount of water vapor present in the atmosphere fluctuates with the seasons and these are seen as the most plausible causes of seasonal change of IOT [40]. However, over northern China and the Tibetan Plateau, the IOT is at its highest in the summer (from June to August) and at its lowest (from December to February). Both the Amazon Plain and the Brazilian Plateau’s IOT displayed similar seasonal variations, with the IOT reaching its lowest point in winter (from June to August) and its highest point in summer (from December to February).
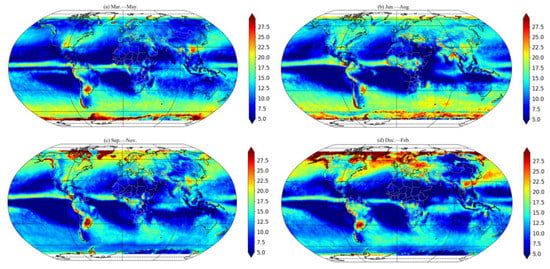
Figure 6.
Spatial distribution of the seasonal average ice cloud optical thickness from 2000 to 2021 using MODIS satellite data in: (a) Mar.–May; (b) Jun.–Aug.; (c) Sep.–Nov. and (d) winter Dec.–Feb.
3.4. Spatial Variation Trend of IOT
In order to better show the variation trend of global IOT, Theil–Sen median trend analysis and Mann–Kendall test methods are used to predict the variation trend of IOT in each latitude and longitude grid from 2000 to 2021. Figure 7 shows the geographical distribution and variance trend of annual average IOT from 2000 to 2021. Figure 7 demonstrates that the trend of global annual average IOT does not show a band trend with latitude and longitude, but some regions do show a clear trend of increasing or decreasing. The area with significantly increased IOT is mainly distributed in the lower reaches of the Amur River, the Pacific Ocean near the east and south of Hawaii Island. There are many areas with a slightly increased trend, which are distributed in the northeast areas of China, India, the Arabian Sea, Egypt, Sudan, and their adjacent regions, the Indian Ocean region of 20° S–30° S, the west coast of South America, the Gulf of Mexico, and other regions. Therein, the maximum Sen slope of IOT in the northeast areas of China is >0.06 year−1 (95% confidence level).
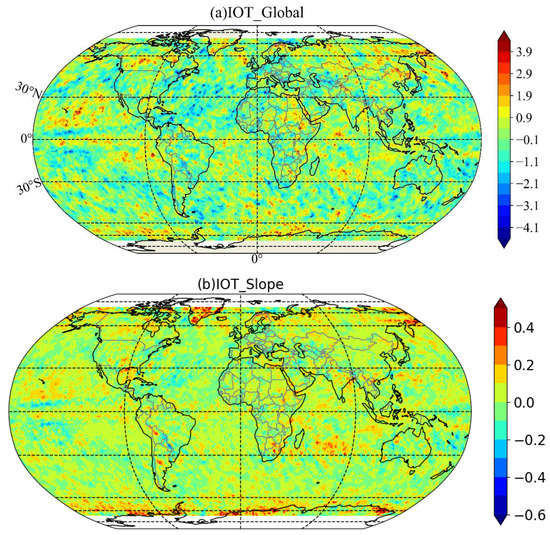
Figure 7.
Spatial distribution of the trends in the ice cloud optical thickness from 2000 to 2021. (a) Z value distribution; (b) spatial distribution of the Sen slope.
Combined with the second part of the Formula (3), it can be seen that for the Mann–Kendall test, when the 5% confidence level is met, the Z value can be divided into three intervals, which are >1.96, <−1.96, and −1.96~1.96; the first two intervals indicate significance, and the last interval indicates insignificance. By combining Sen slope trend analysis and the Mann–Kendall significance test method, the IOT trend can be divided into four categories, namely significantly increased, slightly increased, slightly decreased, and significantly decreased. The statistical results of the data between (−60°, 60°) latitudes are shown in Table 1. The area percentage of IOT with a significant increase is 2.2%, and the area percentage of IOT with a slight increase is 47.2%. The area percentage of IOT with a significant decrease is 2.2%, and the area percentage of IOT with a slight decrease is 48.4%. This indicates that the IOT in most parts of the (−60°, +60°) latitudes is slowly increasing or decreasing from 2000 to 2021, which provides data support for atmospheric radiation transmission research, numerical prediction, and other research.

Table 1.
The trend of global IOT and corresponding area percentage.
3.5. EOF Analysis Results of IOT
In this work, global IOT is subjected to EOF analysis to determine its spatial eigenvectors (also called EOF modes) and time coefficient sequences (called the principal components or PCs). The top six EOF modes are then used as representative fields to examine the changing trend of the IOT. The variance contribution rates of global IOT are shown in Table 2 along with its cumulative values. The first six eigenvectors’ variance contribution rates for the global IOT are 8.18%, 6.35%, 5.89%, 5.42%, 5.33%, and 5.25%, respectively, while the cumulative variance contribution rate is 36.42%.

Table 2.
The variance contribution rate and cumulative variance contribution rate for global IOT.
The first six EOF modes for the global IOT are spatially distributed in Figure 8. There are positive and negative distribution types, which denote two opposing trends, in the distribution of the space field of the first EOF mode (Figure 8a). It is negative in Indonesia, much of Australia, the southern Caribbean, and the Queen Charlotte Islands off the Pacific Ocean’s east coast, with the largest absolute value of negative values in the Maluku Islands. Positive values can be found in the western Pacific Ocean close to the equator, the Hawaiian Islands, the border between Russia and Kazakhstan, and the Pacific Ocean near the equator. Figure 9 displays the series of time coefficients corresponding to each EOF mode in Figure 8. Figure 9a illustrates that between the years 2002 and 2011, the PC1 changes from positive to negative and displays a trend of steadily declining values. The PC1 moves from being negative to positive between 2011 and 2015, displaying a trend of progressive increase and reaching the minimum and highest values in those years, respectively. This is the same result as in Figure 1c. For negative regions with high absolute values (such as Indonesia), the IOT increases between 2002 and 2011 and gradually declines between 2011 and 2015. For areas with high positive values (such as the Pacific Ocean close to the equator), the IOT exhibits a progressive decline from 2002 to 2011 and an increase from 2011 to 2015.
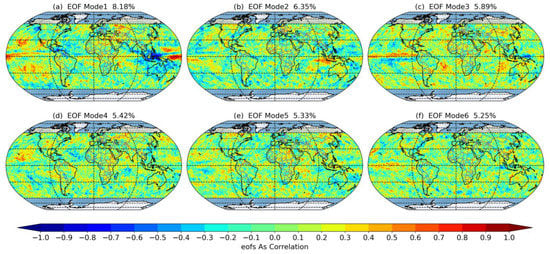
Figure 8.
The spatial distribution of mode (1–6) for the global IOT: (a) mode 1; (b) mode 2; (c) mode 3; (d) mode 4; (e) mode 5; (f) mode 6.
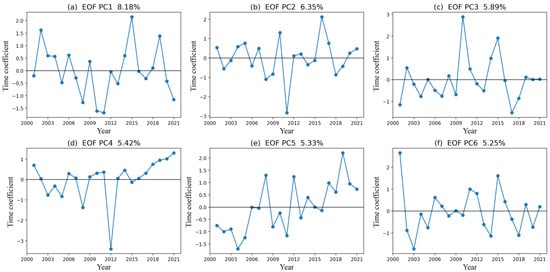
Figure 9.
The PCs of mode (1–6) for global IOT. (a) PC1; (b) PC 2; (c) PC 3; (d) PC4; (e) PC5; (f) PC 6.
4. Discussion
The IOT from 2001 to 2021 was counted and its probability distribution is presented in this study (Figure 10a). This study simply demonstrates that the range of IOT is less than 0.5 to 40, in which the IOT of more than 40 is included in the IOT of 40. This is because the probability of IOT occurring when it is greater than 40 is relatively small. The highest point of the IOT probability distribution, which corresponds to a probability of roughly 3.25%, is found at (1.5, 2), indicating the presence of a large number of thin ice clouds, such as cirrus. The outcomes are similar to those in reference [19], except, in this reference, the greatest probability occurs when the IOT is around 1.2. This difference is due to two factors. First of all, the data sources vary. The previous research is based on the CloudSat Data Processing Center and radar/lidar product, and this paper is based on MODIS satellite data. Both have distinct inversion methods and levels of accuracy. The statistical time period is also different. This literature covers ice cloud data just from 2007 to 2010, which is a far shorter time period than this article (2001–2021).
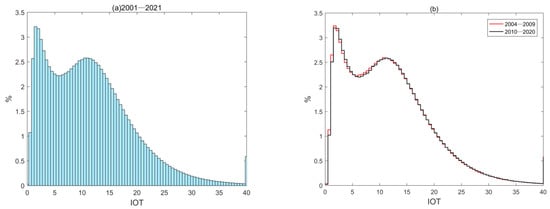
Figure 10.
The probability distribution of IOT: (a) 2001–2021, (b) 2004–2009, and 2010–2020.
In Figure 1c, the annual average value of IOT was greater than the median in 2004–2009 and less than the median in 2010–2020. To analyze the reasons, the IOT of the two periods was measured respectively (Figure 10b). The red line represents 2004–2009 and the black line represents 2010–2020. As shown in Figure 10b, when the IOT is at (0.5, 2), the probability of thin ice clouds occurring from 2004 to 2009 is significantly higher than that from 2010 to 2020. This suggests that thin ice clouds occurred more frequently between 2004 and 2009.
The findings in Part 3 demonstrate that IOT exhibits clear seasonal fluctuation and that the seasonal variation varies in different geographical locations. In the tropics, there is a definite peak that occurs in July–September and peaks at around 10° N, but in December–February, this peak shifts by 5° N. That indicates the presence of ITCZ, which is seasonally skewed to the warmer hemisphere as the sun’s direct sunlight moves to the north and south. It shows that IOT has a certain relationship with solar radiation. In mid-latitudes, the IOT also varies with the seasons. This is due to the correlation between ice cloud development and solar radiation as well as water vapor content and geographical distribution [40,42,43]. For example, IOT is mostly impacted by solar radiation and water vapor content in northern China. Summertime’s high levels of solar radiation and surface temperatures cause the convective intensity to rise, which in turn raises the occurrence frequency of ice clouds and IOT. However, the East Asian monsoon’s influence during the winter causes the water vapor content to be low and the region’s air to be dry and cold, which leads to a relatively small IOT. The IOT is larger in the summer for the Tibetan Plateau and the Brazilian Plateau, which may be because of the high altitude in these areas, which causes high clouds to penetrate the stratosphere and generate ice clouds. The same conclusion is found in several references [11,18].
The variation trend of the IOT in different regions is different; the annual average IOT increases over the northeast areas of China with a Sen slope of 0~0.2, which is consistent with other references [18,39]. It is worth noting that for global IOT, the trend is not obvious, as the formation of ice clouds is influenced by many factors and the dominant factors vary from region to region. Combined with the results of the references, it was found that there is a certain positive correlation between IOT and the occurrence frequency of ice clouds, but the specific relationship between the two requires further study. IOT is one of the favoured remote sensing data products, which is usually used to describe ice cloud optical properties. Because visible and near-infrared cloud radiative properties depend on IOT, IOT is used to research the effects of ice cloud on atmospheric radiation [19]. However, because of the complicated shape and internal structure of ice crystals, it is very difficult to retrieve ice clouds. Further studies on the characteristics of ice clouds are needed to comprehend the interplay between the ice cloud–radiation–climate system and radiation effects.
5. Conclusions
IOT is known as one of the important parameters to characterize ice cloud which can be used to calculate the reflected radiation from ice clouds. The spatiotemporal distribution of global IOT can be attributed to general global atmospheric radiation. In this paper, we analyzed the spatial and temporal distribution of IOT using the monthly dataset of MODIS level-3 from March 2000 to February 2021. From the above analysis, the following main conclusions can be drawn:
The monthly average IOT shows a “W” distribution from January to December, with a maximum reached in July and a double bottom in March and October. This illustrates that IOT has seasonal variation. The annual average IOT shows a slow increase before 2011 and a slow decrease after that but fluctuates less during this period.
The global IOT is at its peak in the summer and its lowest in the spring. The IOT shows the “^” trend with seasons in the Northern Hemisphere and shows an upward trend in the Southern Hemisphere. The variation trend of IOT with time is also different from season to season. The IOT in the Northern Hemisphere shows an obviously decreasing tendency in summer but shows an increasing tendency in winter.
For the middle and low latitude regions, the annual average IOT decreases first and then increases with the increase in latitude from ±6° to 60°. For mid-latitudes, the IOT varies more rapidly with latitudes in the northern hemisphere than in the southern hemisphere, and the variation of IOT with longitude is more obvious in the northern hemisphere than in the southern hemisphere.
The Sen slope estimation and Mann–Kendall test method were used to analyze the variation trend of global IOT. The results show that the variation trend of the IOT in different regions is different, and there is no obvious band distribution trend with the change in latitude and longitude. The statistical analysis results show that the area percentage of IOT with an increased trend is 49.4%, of which the area with a trend of significant increase is 2.2%. The area with a trend of significant decrease is also 2.2%.
In this paper, EOF was used to analyze the change in global IOT over time, and it was found that the IOT near Indonesia gradually increased during 2002–2011. Meanwhile, the probability distribution of IOT from 2001 to 2021 was calculated. When the IOT is greater than 1.5 but less than 2, the probability is the highest, about 3.25%. This indicates that the probability of thin ice clouds occurring is higher.
Author Contributions
Software and visualization, C.T.; investigation and resources, X.T. and X.W.; methodology and writing—original draft preparation, F.Z.; original idea investigation and review, C.D.; writing—review and editing, H.W.; funding acquisition, F.Z. All authors have read and agreed to the published version of the manuscript.
Funding
This study is supported by the Open Project of Advanced Laser Technology Laboratory of Anhui Province (No. AHL2021KF02) and the scientific research start-up fund for high-level introduced talents of Anhui University of Science and Technology (No. 13200398).
Institutional Review Board Statement
Not applicable.
Informed Consent Statement
Not applicable.
Data Availability Statement
Not applicable.
Acknowledgments
We are very grateful to the MODIS product dataset provided by NASA Goddard Earth Science Distributed Active Archive Center (GESDAAC). All monthly MOD08 datasets can be obtained from the website: https://ladsweb.modaps.eosdis.nasa.gov/ (accessed on 1 February 2023). The authors also sincerely thank the anonymous reviewers and editor for their constructive opinions and suggestions.
Conflicts of Interest
The authors declare no conflict of interest.
References
- Baker, M.B. Cloud Microphysics and climate. Science 1997, 276, 1072–1078. [Google Scholar] [CrossRef]
- Stubenrauch, C.J.; Cros, S.; Guignard, A.; Lamquin, N. A 6-year global cloud climatology from the Atmospheric InfraRed Sounder AIRS and a statistical analysis in synergy with CALIPSO and CloudSat. Atmos. Chem. Phys. 2010, 10, 7197–7214. [Google Scholar] [CrossRef]
- Yang, P.; Liou, K.N.; Bi, L.; Liu, C.; Yi, B.Q.; Baum, B.A. On the radiative properties of ice clouds: Light scattering, remote sensing, and radiation parameterization. Adv. Atmos. Sci. 2015, 32, 32–63. [Google Scholar] [CrossRef]
- Liou, K.N. Influence of cirrus clouds on weather and climate processes: A global perspective. Mon. Weather. Rev. 1986, 114, 1167–1199. [Google Scholar] [CrossRef]
- Baran, A.J. From the single-scattering properties of ice crystals to climate prediction: A way forward. Atmos. Res. 2012, 112, 45–69. [Google Scholar] [CrossRef]
- Hong, G.; Yang, P.; Baum, B.A.; Heymsfield, A.J.; Xu, K.M. Parameterization of shortwave and longwave radiative properties of ice clouds for use in climate models. J. Clim. 2009, 22, 6287–6312. [Google Scholar] [CrossRef]
- Clodman, J. Some statistical aspects of cirrus cloud. Mon. Weather. Rev. 1957, 85, 37–40. [Google Scholar] [CrossRef]
- Wylie, D.P.; Menzel, W.P. Eight years of high cloud statistics using HIRS. J. Clim. 1999, 12, 170–184. [Google Scholar] [CrossRef]
- Wylie, D.P.; Menzel, W.P.; Woolf, H.M.; Strabala, K.L. Four years of global cirrus cloud statistics using HIRS. J. Clim. 1994, 7, 1972–1986. [Google Scholar] [CrossRef]
- Liu, Y.; Hua, S.; Jia, R.; Huang, J. Effect of Aerosols on the Ice Cloud Properties Over the Tibetan Plateau. J. Geophys. Res. Atmos. 2019, 124, 9594–9608. [Google Scholar] [CrossRef]
- Meyer, K.; Yang, P.; Gao, B.C. Tropical ice cloud optical depth, ice water path, and frequency fields inferred from the MODIS level-3 data. Atmos. Res. 2007, 85, 171–182. [Google Scholar] [CrossRef]
- Mitchell, D.L.; Garnier, A.; Avery, M.; Erfani, E. CALIPSO observations of the dependence of homo- and heterogeneous ice nucleation in cirrus clouds on latitude, season and surface condition. Atmos. Chem. Phys. Discuss. 2016, 1062, 1–60. [Google Scholar]
- Mitchell, D.L.; Garnier, A.; Pelon, J.; Erfani, E. CALIPSO (IIR–CALIOP) retrievals of cirrus cloud ice particle concentrations. Atmos. Chem. Phys. 2018, 18, 17325–17354. [Google Scholar] [CrossRef] [PubMed]
- Huang, J.; Minnis, P.; Bing, L.; Yi, Y.; Fan, T.F.; Sun-Mack, S.; Ayers, J.K. Determination of ice water path in ice-over-water cloud systems using combined MODIS and AMSR-E measurements. Geophys. Res. Lett. 2006, 332, 1522–1534. [Google Scholar] [CrossRef]
- Stephens, G.L.; Tsay, S.-C.; Stackhouse, P.W.J.; Flatau, P.J. The relevance of the microphysical and radiative properties of cirrus clouds to climate and climatic feedback. J. Atmos. Sci. 1990, 47, 1742–1754. [Google Scholar] [CrossRef]
- Yang, P.; Hioki, S.; Saito, M.; Kuo, C.P.; Baum, B.A.; Liou, K.N. A review of ice cloud optical property models for passive satellite remote sensing. Atmosphere 2018, 9, 499–529. [Google Scholar] [CrossRef]
- Wang, Y.; Yang, P.; Hioki, S.H.; King, D.K.; Baum, B.A.; Girolamo, L.D.; Fu, D. Ice cloud optical thickness, effective radius, and ice water path inferred from fused MISR and MODIS measurements based on a pixel-level optimal ice particle roughness model. J. Geophys. Res. Atmos. 2019, 124, 126–140. [Google Scholar] [CrossRef]
- Zhang, H.; Zhao, M.; Chen, Q.; Wang, Q.; Zhao, S.; Zhou, S. Water and ice cloud optical thickness changes and radiative effects in East Asia. J. Quant. Spectrosc. Radiat Transf. 2020, 254, 107213. [Google Scholar] [CrossRef]
- Hong, Y.; Liu, G. The characteristics of ice cloud properties derived from CloudSat and CALIPSO measurements. J. Clim. 2015, 28, 3880–3901. [Google Scholar] [CrossRef]
- Protat, A.; Armstrong, A.; Haeffelin, M.; Morille, Y.; Pelon, J.; Delanoë, J.; Bouniol, D. Impact of conditional sampling and instrumental limitations on the statistics of cloud properties derived from cloud radar and lidar at SIRTA. Geophys. Res. Lett. 2006, 33, L11805. [Google Scholar] [CrossRef]
- Protat, A.; Delanoë, J.; O’Connor, E.; L’Ecuyer, T. The evaluation of CloudSat and CALIPSO ice microphysical products using ground-based cloud radar and lidar observations. J. Atmos. Ocean Technol. 2010, 27, 793–810. [Google Scholar] [CrossRef]
- Sherwood, S.C. Aerosols and ice particle size in tropical cumulonimbus. J. Clim. 2002, 15, 1051–1063. [Google Scholar] [CrossRef]
- Lee, T.E.; Miller, S.D.; Turk, F.J.; Schueler, C.; Julian, R.; Deyo, S.; Dills, P.; Wang, S. The NPOESS VIIRS day/night visible sensor. Bull. Am. Meteorol. Soc. 2006, 87, 191–199. [Google Scholar] [CrossRef]
- Dessler, A.E.; Yang, P. The distribution of tropical thin cirrus clouds inferred from Terra MODIS data. J. Clim. 2003, 16, 1241–1247. [Google Scholar] [CrossRef]
- Wylie, D.P.; Jackson, D.L.; Menzel, W.P.; Bates, J.J. Trends in global cover in 22 years of HIRS observations. J. Clim. 2005, 18, 3021–3031. [Google Scholar] [CrossRef]
- Kahn, B.H.; Irion, F.W.; Dang, V.T.; Manning, E.M.; Nasiri, S.L.; Naud, C.M.; Blaisdell, J.M.; SWchreier, M.M.; Yue, Q.; Bowman, K.W.; et al. The Atmospheric Infrared Sounder version 6 cloud products. Atmos. Chem. Phys. 2014, 14, 399–426. [Google Scholar] [CrossRef]
- Klaes, D.; Montagner, F.; Larigauderie, C. Metop-B, the second satellite of the EUMETSAT polar system, in orbit. Proc. SPIE 2013, 8866, 886613. [Google Scholar]
- Han, Y.; Revercomb, H.; Cromp, M.; Gu, D.; Johnson, D.; Mooney, D.; Scott, D.; Strow, L.; Bingham, G.; Borg, L.; et al. Suomi NPP CrIS measurements, sensor data record algorithm, calibration and validation activities, and record data quality. J. Geophys. Res. Atmos. 2013, 118, 12734–12748. [Google Scholar] [CrossRef]
- Saito, M.; Yang, P.; Heidinger, A.K.; Li, Y. An Improved Beta Method for Ice Cloud Property Retrievals: Theory. J. Geophys. Res. Atmos. 2020, 125, e2019JD031863. [Google Scholar] [CrossRef]
- King, M.D.; Kaufman, Y.J.; Menzel, W.P.; Tanre, D. Remote sensing of cloud, aerosol and water vapor properties from the Moderate Resolution Imaging Spectrometer (MODIS). IEEE Trans. Geosci. Remote Sens. 1992, 30, 2–27. [Google Scholar] [CrossRef]
- King, M.D.; Menzel, W.P.; Kaufman, Y.J.; Tanre, D.; Gao, B.-C.; Platnick, S.; Ackerman, S.A.; Remer, L.A.; Pincus, R.; Hubanks, P.A. Cloud and aerosol properties, precipitable water, and profiles of temperature and water vapor from MODIS. IEEE Trans. Geosci. Remote Sens. 2003, 41, 442–458. [Google Scholar] [CrossRef]
- Platnick, S.; King, M.D.; Ackerman, S.A.; Menzel, W.P.; Baum, B.A.; Riedi, J.C.; Frey, R.A. The MODIS cloud products: Algorithms and examples from Terra. IEEE Trans. Geosci. Remote Sens. 2003, 41, 459–473. [Google Scholar] [CrossRef]
- Yao, B.; Teng, S.; Lai, R.; Xu, X.; Yin, Y.; Shi, C.; Liu, C. Can atmospheric reanalyses (CRA and ERA5) represent cloud spatiotemporal characteristics. Atmos. Res. 2020, 244, 105091. [Google Scholar] [CrossRef]
- Sen, P.K. Estimates of the regression coefficient based on Kendall’s tau. J. Am. Stat. Assoc. 1968, 63, 1379–1389. [Google Scholar] [CrossRef]
- Kendall, M. Rank Correlation Methods; Charles Griffin: London, UK, 1975. [Google Scholar]
- Jiang, W.; Yuan, L.; Wang, W.; Cao, R.; Zhang, Y.; Shen, W. Spatiotemporal analysis of vegetation variation in the Yellow River Basin. Ecol. Indic. 2015, 51, 117–126. [Google Scholar] [CrossRef]
- Pearson, K. On lines and planes of closest fit to systems of points in space. Philos. Mag. 1901, 2, 559–572. [Google Scholar] [CrossRef]
- Hannachi, A.; Jolliffe, I.T.; Stephenson, D.B. Empirical orthogonal functions and related techniques in atmospheric science: A review. Int. J. Climatol. 2007, 27, 1119–1152. [Google Scholar] [CrossRef]
- Huang, J.Y. Meteorological Statistical Analysis and Forecasting Methods; China Meteorological Press: Beijing, China, 2004; pp. 28–30.
- Li, X.; Che, H.; Wang, H.; Xia, X.; Chen, Q.; Gui, K.; Zhao, H.; An, L.; Zheng, Y.; Sun, T.; et al. Spatial and temporal distribution of the cloud optical depth over China based on MODIS satellite data during 2003–2016. J. Environ. Sci. 2018, 80, 66–81. [Google Scholar] [CrossRef]
- Yang, R.W.; Tao, Y.; Cao, J. A mechanism for the interannual variation of the early summer East Asia-Pacific teleconnection wave train. Acta. Meteorol. Sin. 2010, 4, 452–458. [Google Scholar]
- Shikhovtsev, A.Y.; Bolbasova, L.A.; Kovadlo, P.G.; Kiselev, A.V. Atmospheric parameters at the 6-m Big Telescope Alt-azimuthal site. Mon. Not. R. Astron. Soc. 2020, 493, 723–729. [Google Scholar] [CrossRef]
- Cortes, F.; Cortes, K.; Reeves, R.; Bustos, R.; Radford, S. Twenty years of PWV measurements in the Chajnantor Area. Astron. Astrophys. 2020, 640, A126. [Google Scholar] [CrossRef]
Disclaimer/Publisher’s Note: The statements, opinions and data contained in all publications are solely those of the individual author(s) and contributor(s) and not of MDPI and/or the editor(s). MDPI and/or the editor(s) disclaim responsibility for any injury to people or property resulting from any ideas, methods, instructions or products referred to in the content. |
© 2023 by the authors. Licensee MDPI, Basel, Switzerland. This article is an open access article distributed under the terms and conditions of the Creative Commons Attribution (CC BY) license (https://creativecommons.org/licenses/by/4.0/).