Article

Climate Suitability for Tourism in Romania Based on HCI: Urban Climate Index in the Near-Future Climate

1
Department of Humanities, University Ca’Foscari Venice, 30123 Venice, Italy
2
National Meteorological Administration, 013686 Bucharest, Romania
3
Faculty of Economics and Business Administration, University of Craiova, 200585 Craiova, Romania
*
Author to whom correspondence should be addressed.
Atmosphere 2023, 14(6), 1020; https://doi.org/10.3390/atmos14061020
Submission received: 12 April 2023 / Revised: 9 June 2023 / Accepted: 12 June 2023 / Published: 13 June 2023
(This article belongs to the Special Issue Tourism and Extreme Weather)

Abstract

:
This study presents an assessment of climate suitability for outdoor leisure activities in Romania using the Holliday Climate Index (HCI) for the near future (2021–2040), focusing on unfavorable and good climate conditions. The analysis employs data from an ensemble of model simulations in the context of RCP4.5 and RCP8.5 climate change scenarios. The results indicate that the number of days with low weather suitability is decreasing in almost the entire country, especially during the warm season, while during the winter and spring, extended regions may be characterized by a higher number of days favorable for outdoor activities than during the current climate. An estimation of the impact of climate change on tourism flux in Romania is further carried out, suggesting that the increasing attractivity of climate conditions may lead to an increased number of tourist overnights in the near future, and this will be more pronounced in rural destinations.

1. Introduction

Climate change poses challenges to all economic sectors and aspects of human life and tourism is not an exception. As a ‘social, cultural and economic phenomenon’ [1], tourism has a transversal impact in society in terms of economic development from a local level (e.g., small villages) [2,3,4] to a national level (e.g., population health) [5,6], but also on interpersonal relationships [7,8,9] or country image [10,11].
In Romania, tourism contributed about 3% to the GDP in 2019, although in 2020, due to the pandemic, it dropped to only 1.6%—the lowest value since 2008 [12]. The hotels and restaurants sector covered about 2.6% of the total employed population in 2021 [13]. The positive impact of tourism is more visible in rural areas, where agrotourism has increased in the last years, offering new socio-economic opportunities in villages where other options are scarce [14,15].
The tourism intensity in Romania, just like in other countries, is not uniformly distributed over the territory. Brașov–Prahova Valley tourist corridor (combining Brașov and Prahova counties) is in second place as a tourist attraction area of Romania; the center of Transylvania (Cluj, Sibiu and Mureș counties) registers a similar value, followed by Constanța, at the seaside [16]. Furthermore, about 62% of the total accommodation capacity is concentrated in 12 counties, out of a total of 41 [17]. Nevertheless, the governmental support for tourism development, seen as an economic priority of the country, encourages the revival of this sector and supports it through several directions such as the development of ecological tourism [18], spa tourism [19], cultural programs, tourism education, etc.
While challenges in Romanian tourism are linked mainly to administrative or economic issues (e.g., transport infrastructure, marketing), favorable aspects are already in place and they reside, among others, in the natural resources abundant in any place within the country. Romania includes a large variety of relief units—from the seaside (along the Black Sea) to mountains up to 2544 m high (Moldoveanu Peak in Făgăraș Mountains). Five major rivers (Danube, Mureș, Prut, Olt, Siret) flow through the Romanian territory. Several lakes are spread across all major relief units—from glacial ones in the mountainous area (Mioarele Lake—Făgăraș Mountains, located at the highest altitude: 2282 m, Bucura—the largest glacial lake and Zănoaga Mare—the deepest lake in Romania, both located in the Retezat Mountains) to those in the Danube Delta and river-maritime banks (Techirghiol Lake, at 1.5 m altitude) and anthropic lakes such as the one from Porțile de Fier [20]. All these assure a large palette of opportunities for spending time in nature and thus provide the background for a variety of tourism forms. Spa resources represent further natural treasures, with a diversity of ‘flavors’ including thermal and oligo-mineral waters, salt mines or mofettas.
The climate is yet another major natural asset in Romanian tourism. Romania’s climate is temperate-continental with oceanic influences from the west, Mediterranean influences from the southwest and continental-excessive influences from the east. The multiannual average temperature is differentiated latitudinally, with annual averages of 8 °C in the north and over 11 °C in the south, and altitudinally, with annual average values of −2.5 °C in the mountain floor (Vârfu Omu–Bucegi massif) and 11.6 °C in the plains (Zimnicea, Teleorman county). The annual precipitation decreases in intensity from west to east, respectively, from over 600 mm to less than 500 mm in the Eastern Romanian Plain, less than 450 mm in Dobrogea and about 350 mm on the coast, while in the mountainous regions, it reaches 1000–1500 mm [21]. The four seasons provide different opportunities for various tourism types; pronounced tourism fluxes in mountainous resorts are seen during winter, while during summer almost all resorts receive many tourists, more markedly at the seaside.
Climate change is expected to have an impact on the tourism sector, through changes in the weather and climate features which modulate tourism demand, as well as through the effect on other resources (e.g., water availability) or economic sectors (e.g., energy) which are linked to tourism [22,23,24]. In Romania, the observed changes in the climate indicate that, during the period 1901–2020, the average temperature at the national level increased by more than 1 °C, with the largest increases during winter and summer [25]. Furthermore, the number of days with convective rain increased during 1991–2020 compared with the 1961–1991 period, and projections of the possible future climate show that the number of days with heavy rain (over 20 mm/day) will increase as well. The average snow layer depth, instead, presents a decreasing tendency, with an intraseasonal difference in the behavior of decreasing trends, which are more pronounced in February [25].
The impact of climate change on tourism in Europe due to the changes in weather and climate features has been comprehensively analyzed. The risks for winter tourism, for example, due to the decrease in snow layer depth and air temperature increase, are acknowledged by many studies [26,27,28,29,30,31,32,33,34]. For summer tourism, studies indicate that the changed climate may become less favorable for tourism in some areas (e.g., Greece, Cyprus) due to increasing temperatures, while the northern countries may benefit from this physical impact [35,36]. Coastal tourism in some areas of the Mediterranean region may be negatively influenced by increased temperature [37], while other risks associated with climate change are also relevant for coastal tourism, such as beach loss caused by shoreline recession [38] or coastal storms. Urban tourism is also likely to be affected mainly due to the increase in temperature associated with more intense thermal discomfort [39,40] amplified by the urban heat island effect.
As for Romanian tourism in particular, fewer studies have focused on these aspects of the impact of climate change on tourism. For seaside tourism, climate change may provide development opportunities [41,42]. Mountain resorts may also benefit from increasing temperatures, despite the negative effects induced by decreasing snow layer depth [43]. Increased temperatures and thus thermal discomfort in urban areas [44,45,46,47] suggest an implicitly negative effect on urban tourism; however, this has not been fully investigated.
The direct impact of climate change in tourism may be visible in the modifications of touristic flux (e.g., incoming number of tourists, overnights etc.), but it will be further modulated by the complex interaction between other socio-economic aspects that are also affected, to various degrees (e.g., personal income, health, availability of new investments etc.).
The estimation of the direct impact of climate change on tourism demand is a research topic well represented in the scientific literature. Several studies explore the link between weather parameters such as air temperature [48,49,50,51], sunshine duration [48,49] and the presence of rain [49,50] on the changes in touristic overnights. Their methods are generally based on regression, with varying degrees of model complexity. Climate indices are also used in studies focusing on this research topic. Hein et al. [52] used the Tourism Climate Index (TCI; [53]) to describe current conditions and future changes in climate suitability in seven regions in Spain. They built a model linking TCI and foreign visitors’ overnights at the regional level, but they also included a factor reflecting the ‘intrinsic attractiveness of a region’. Oğur and Baikan [54] followed a similar approach to study the future changes in international tourist arrivals in Turkey. Carillo et al. [55] employed both TCI and the Holiday Climate Index to study the potential change in climate suitability in the Canary Islands, although the estimation of the climate change impact is limited to the changes in specific suitability classes of the two indices.
In the present study, the impact of climate change on climate suitability for tourism in Romania is investigated, contributing to covering the gap in the scientific literature regarding this region. The analysis is based on the seasonal mean number of days with good and unfavorable weather conditions defined by the Holiday Climate Index (HCI) [56]. The data provided by the Copernicus Climate Data Store [57] on the HCI index in the form of daily values as well as in the form of monthly number of days with good and unfavorable conditions is used under two climate change scenarios for the near future period (2021–2040). Furthermore, the impact of changes in climate suitability on tourism intensity as expressed through the number of touristic overnights in 41 cities and 53 rural touristic destinations (Figure 1) is investigated. Finally, the implications and limitations of the results, highlighting potential directions for improvement and future research, are discussed. This study may provide support for the decision-making process for local authorities and tourism investors in Romania by highlighting the positive aspects and limitations associated with climate change effects for urban and rural touristic destinations.

2. Materials and Methods

HCI index has been developed by [56] with a focus on urban areas in order to characterize the weather conditions suitable for outdoor leisure activities. The index is defined by the use of measurable weather parameters through the formula [56]:
HCI: Urban = 4(TC) + 2(A) + (3P)
In Equation (1), (TC) is thermal comfort expressed through the Effective Temperature index (E) given by Missenard’s formula (e.g., [58]):
E = T − 0.4(T − 10)(1 − RH/100)
where T is the air temperature expressed in degrees Celsius and RH is the relative humidity expressed as a percentage. Also in (1), (A) represents the aesthetic factor related to cloud cover (%) and (P) represents the physical facet of the index, defined through a combination of precipitation (mm) and wind speed (km/h).
The several facets of the weather (e.g., temperature, humidity, cloudiness, wind speed, rain) incorporated in the HCI index provide synthetic information assembled in classes (Table 1).
Although the HCI index was initially derived for urban areas, Velea et al. [17] showed that the index is also appropriate for describing the climate attractivity for tourism in rural areas in Romania, while also assessing the performances of the index on Romanian urban destinations.

2.1. Data and Methods Used for Investigating the Climate Suitability for Tourism in the Context of Climate Change

The estimation of changes in climate suitability for tourism in the near future (2021–2040) is based on the ‘Climate Suitability for Tourism Indicators’ (CSTI) dataset available from the Copernicus Climate Data Store [59]. The dataset contains information on a daily and monthly scale on HCI and CTI (Climate Tourism Index) indicators. These are derived from an ensemble of climate projections obtained by downscaling large-scale information from six Global Climate Models (GCM) [60] with regional model RCA4 [61] in the context of up to three RCP (Representative Concentration Pathways) climate change scenarios, namely RCP2.6, RCP4.5 and RCP8.5. The RCP (Representative Concentration Pathways) scenarios establish four tendencies of the evolution of greenhouse gas emissions throughout the 21st century: a strict mitigation scenario (RCP2.6), two intermediate scenarios (RCP4.5 and RCP6.0) and a scenario with very high greenhouse gas emissions (RCP8.5) [62]. According to the IPCC [63], all four RCP suggest that the global mean surface temperature change for the period 2016–2035 relative to 1986–2005 will likely be in the range 0.3 °C to 0.7 °C. However, by the mid-21st century, the projected changes differ in each scenario, such that, by the end of the 21st century (2081–2100) relative to 1986–2005, the global mean surface temperature is likely to be 0.3 °C to 1.7 °C under RCP2.6, 1.1 °C to 2.6 °C under RCP4.5 and 2.6 °C to 4.8 °C under RCP8.5.
The data in CSTI have an horizontal resolution of 0.11 deg, i.e., around 12.5 km. In this dataset, the HCI index has been computed using (1) and employing the Effective Temperature index (2) for the thermal aspect. In the computation of the index, the maximum value of near-surface air temperature and the minimum value of relative humidity at a daily scale were used [64]. The daily data have been further assembled in monthly indicators regarding the number of days with ‘good’ weather conditions (HCI > 70) and ‘unfavorable’ weather conditions (HCI < 50), respectively.
The information on HCI used in this study for the estimation of changes in climate suitability in the near future (2021–2040) is in the form of the number of days with ‘good’ and ‘unfavorable‘ weather conditions. These indicators are available at a monthly scale and they are derived from the ensemble mean of all the simulations available for each of the HISTORICAL period (1986–2005) and RCP2.6, RCP4.5 and RCP8.5 scenarios for the period 2021–2040. Nevertheless, to assure consistency throughout the study, only climate projections in the context of two scenarios—RCP4.5 and RCP8.5—are employed, as for the RCP2.6 scenario, not all the driving models employed have provided simulations at a daily scale, which are needed for the second part of the study.
For this part of the analysis, the monthly information on HCI is further aggregated at the seasonal scale, which is sufficiently appropriate for the extent of the period analyzed (20 years) and it is in line with other studies addressing the potential changes in climate attractivity in the context of climate change (e.g., [37,55,65,66]). The spatial pattern and amplitude of the difference in the number of days with ‘good’ and ‘unfavorable’ conditions between RCP4.5 and HISTORICAL and between RCP8.5 and HISTORICAL simulations, respectively, is investigated. Furthermore, HISTORICAL data are compared with HCI information derived from the observation-based dataset ROCADA (Romanian ClimAtic Dataset; [67]) in order to assess the limitations of the modelled data in describing the current climate suitability conditions for tourism. ROCADA provides a daily gridded climatology at the spatial resolution of 0.1 × 0.1 degrees for 9 meteorological parameters, based on observational records from 150 Romanian meteorological stations for the period 1961–2013. The data are freely available on request on the PANGAEA data portal [68]. The dataset has been used to compute the number of days with ‘good’ and ‘unfavorable’ conditions at the seasonal level for the period 1986–2005. In computing HCI from ROCADA data, expressions (1) and (2) have been used, employing daily maximum temperature, daily mean values of relative humidity, cloud cover, wind speed and daily cumulated precipitation.

2.2. Data and Methods Used for Investigating the Impact of Climate Change on Tourism Flux

The assessment of the impact of changes in climate suitability on the tourism flux focuses on 41 urban areas and 53 rural touristic destinations in Romania. The urban destinations included in this analysis represent the main administrative urban units in their counties; therefore, it is expected to be associated with touristic attractivity. Some of them are in mountainous areas (e.g., Brașov) or near the seaside (e.g., Constanța) and it is possible that specific touristic activities linked to the geographical location may have an impact on tourism type. The rural destinations included in this study were selected from the official list of national touristic localities provided by the Ministry of Entrepreneurship and Tourism in Romania, following [17] so as to fulfil the conditions: ‘(1) to be included in the official list above; (2) to have an independent administrative status (e.g., village, city); (3) to have a population of fewer than 10,000 inhabitants if their administrative status was ‘city’; (4) not be associated with mountain sports facilities (i.e., ski slopes); (5) to have sectoral data available (e.g., overnights) for at least half of the months in the period considered’ [17].
The investigation of the impact of changes in climate suitability on tourism flux is based on a simple linear regression approach linking monthly mean HCI and sectoral data in the form of touristic overnights.
For this part of the analysis, HCI is computed at a daily scale by employing (1) and (2) and using data provided by two reanalysis datasets: (a) the regional reanalysis dataset UERRA [69] for 2 m air temperature, 2 m relative humidity, total cloud cover, and 10 m wind speed; (b) the global reanalysis dataset ERA5-Land [70] for total precipitation. Both datasets are available through CDS. In the framework of this study, the 2 m air temperature and relative humidity from the UERRA analysis at 12 UTC were used as proxies for daytime conditions [17]. The daily values of HCI were further aggregated at the monthly scale by computing the monthly mean value of HCI in each grid point.
The sectoral data are provided by the National Institute for Statistics (NIS) in Romania [13] in the form of the monthly number of touristic overnights in each locality, starting from 2010; the data refer to accommodation units having more than 10 beds, regardless of the type of accommodation unit (e.g., hotel, agrotouristic boarding houses etc.).
The linear regression approach used for the analysis includes two main steps: (i) A linear regression model using HCI monthly mean values and the monthly number of touristic overnights is fitted for each locality, at a 0.05 confidence level. It should be noted that the regression model reproduces the seasonal variations in the number of overnights, but not the extreme values or the year-to-year variations (e.g., Figure 2). This is an expected limitation of the regression model, given that the number of touristic overnights is influenced by many factors other than the weather (e.g., [71]), which are not considered in this analysis. However, the trend in observed data is captured by the simulations.
(ii) The regression model for each locality is applied to the monthly series of HCI derived in the context of HISTORICAL, RCP4.5 and RCP8.5 ensemble simulations. For this step, the daily HCI values from 5 numerical experiments available in CSTI dataset are used. The numerical experiments represent the outputs of RCA4 model driven by one of the following GCMs: ICHEC-EC-EARTH, MPI-M-MPI-ESM-LR, MOHC-HadGEM2-ES, CNRM-CERFACS-CNRM-CM5, IPSL-IPSL-CM5A-MR. These simulations cover both RCP4.5 and RCP8.5 climate change scenarios and they provide the same number of ensemble members for the same scenario. The time series for each locality are computed as the monthly mean of daily data provided by the five models.
The results of the regression approach are analyzed in terms of relative difference (in percent) between RCP4.5 or RCP8.5 and HISTORICAL outputs of the regression model expressed as the mean number of overnights over the selected 20 year period.

3. Results

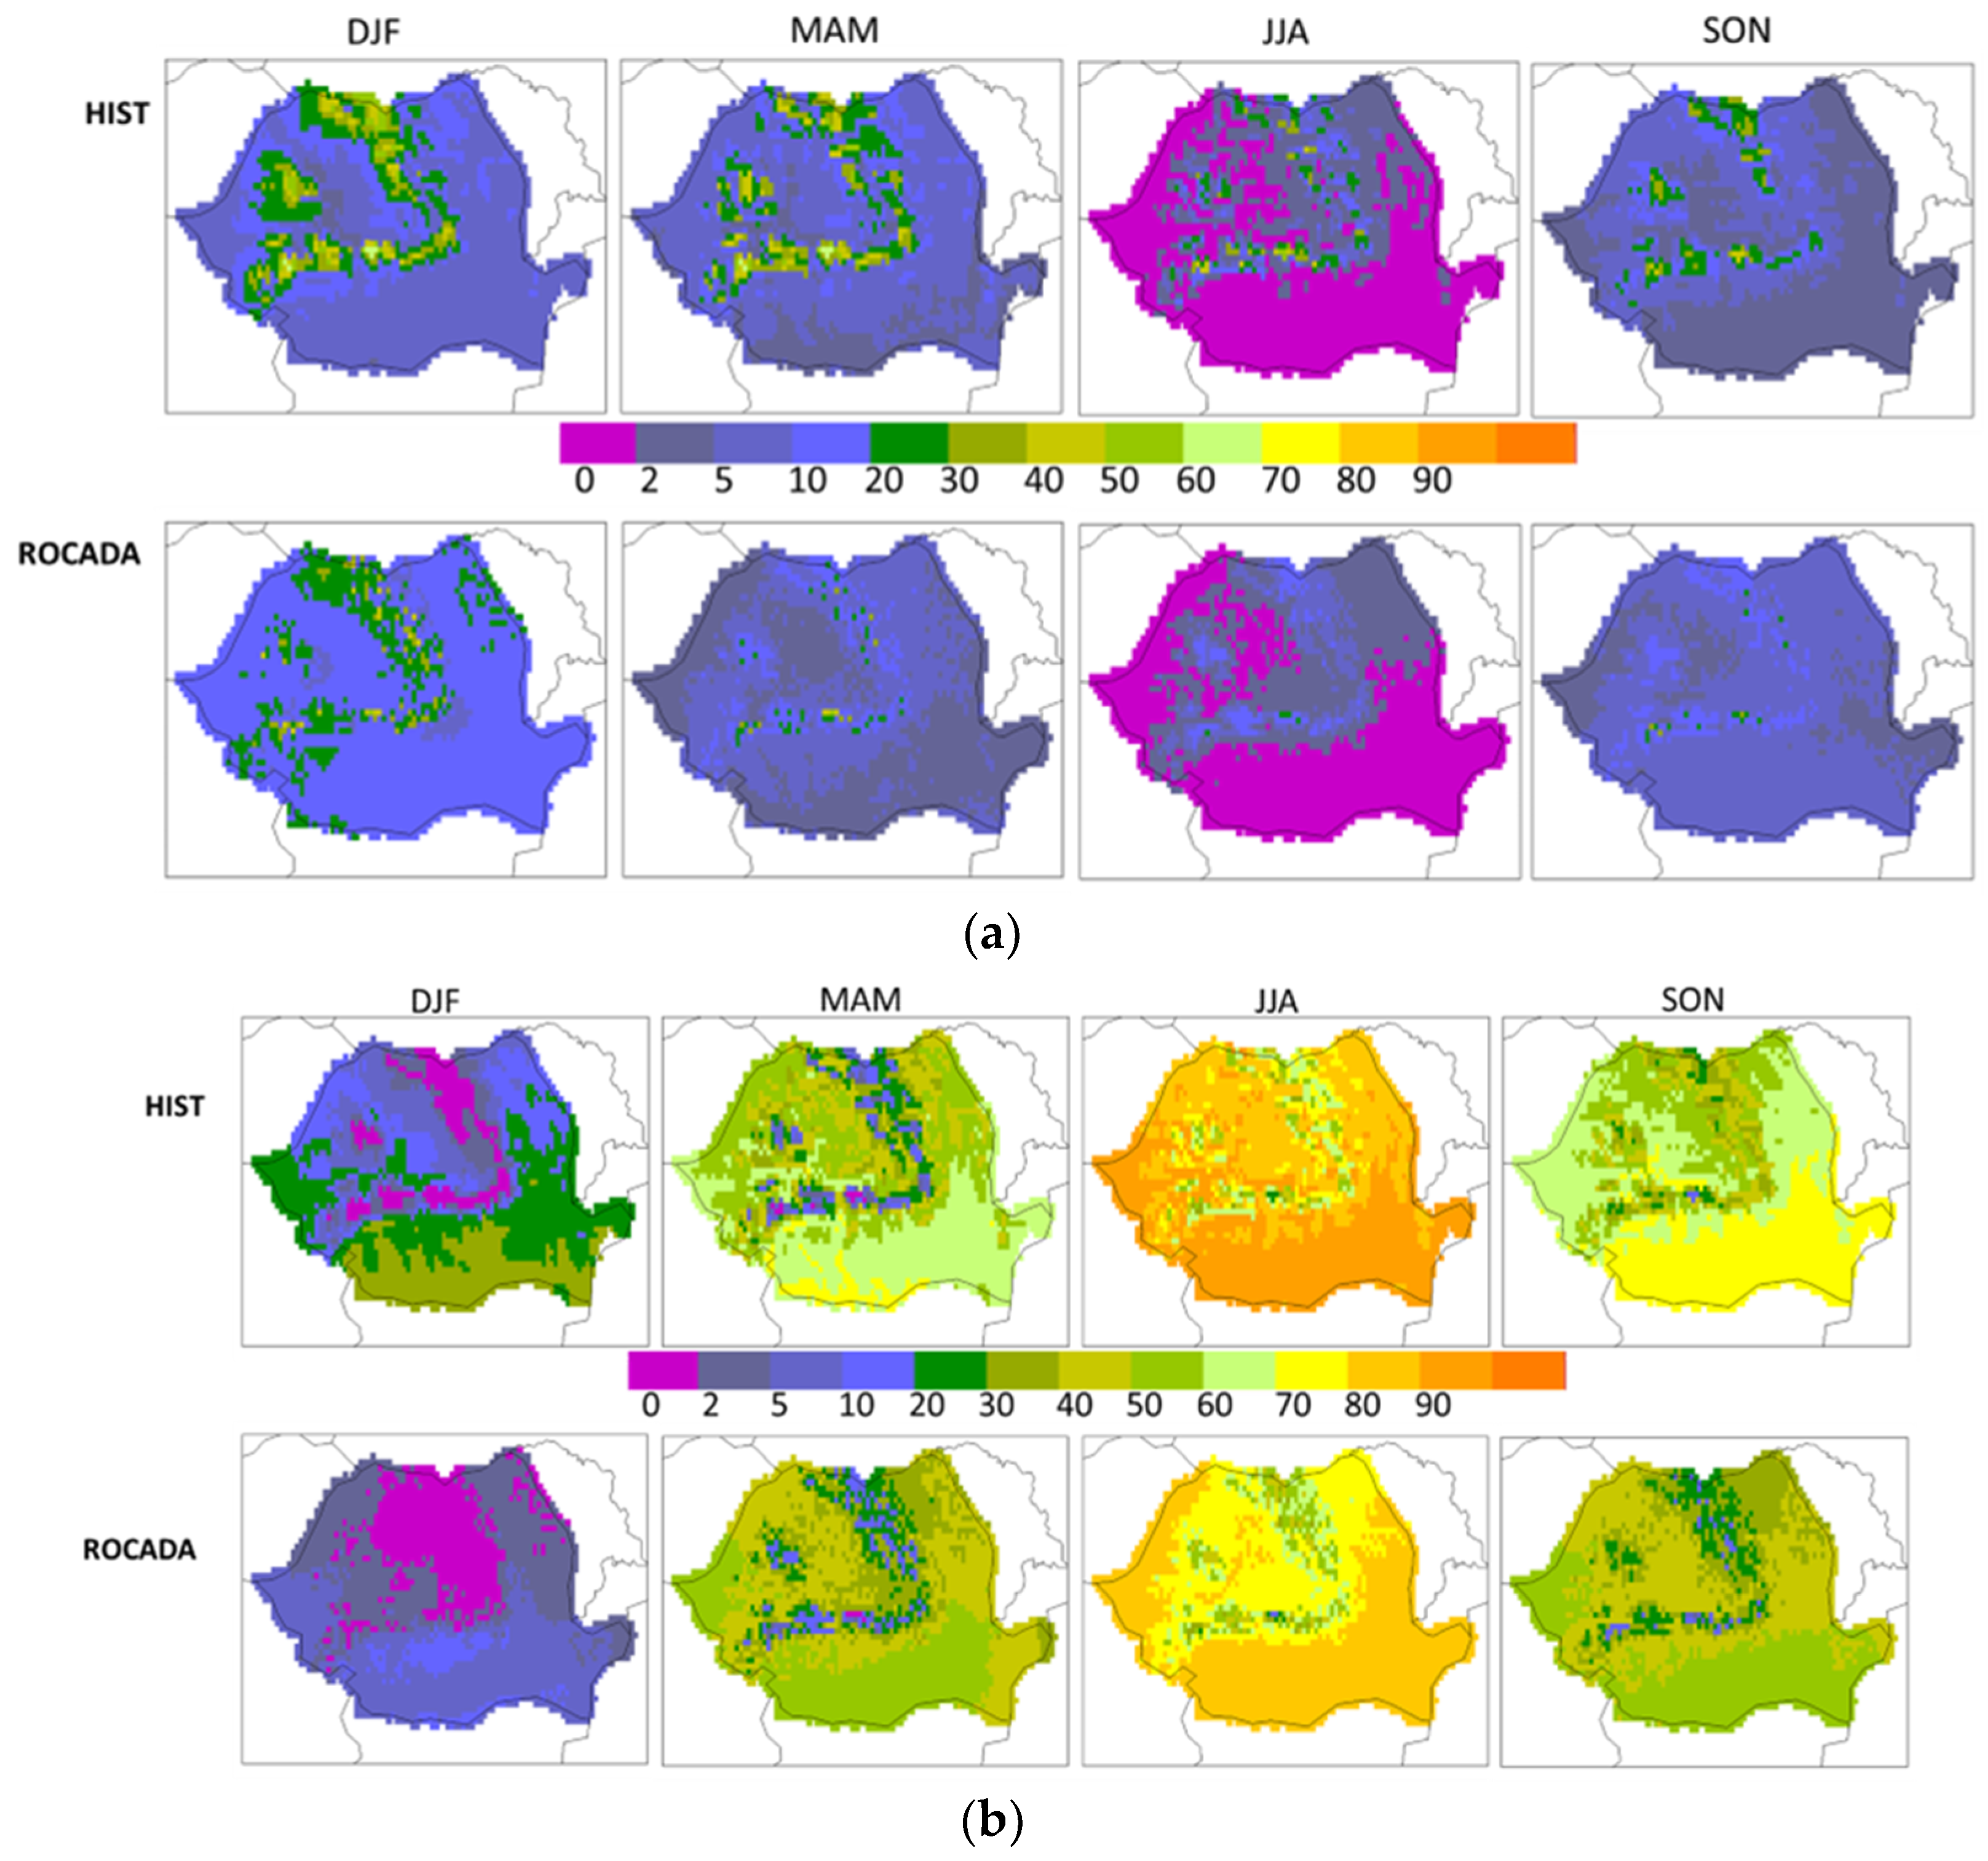
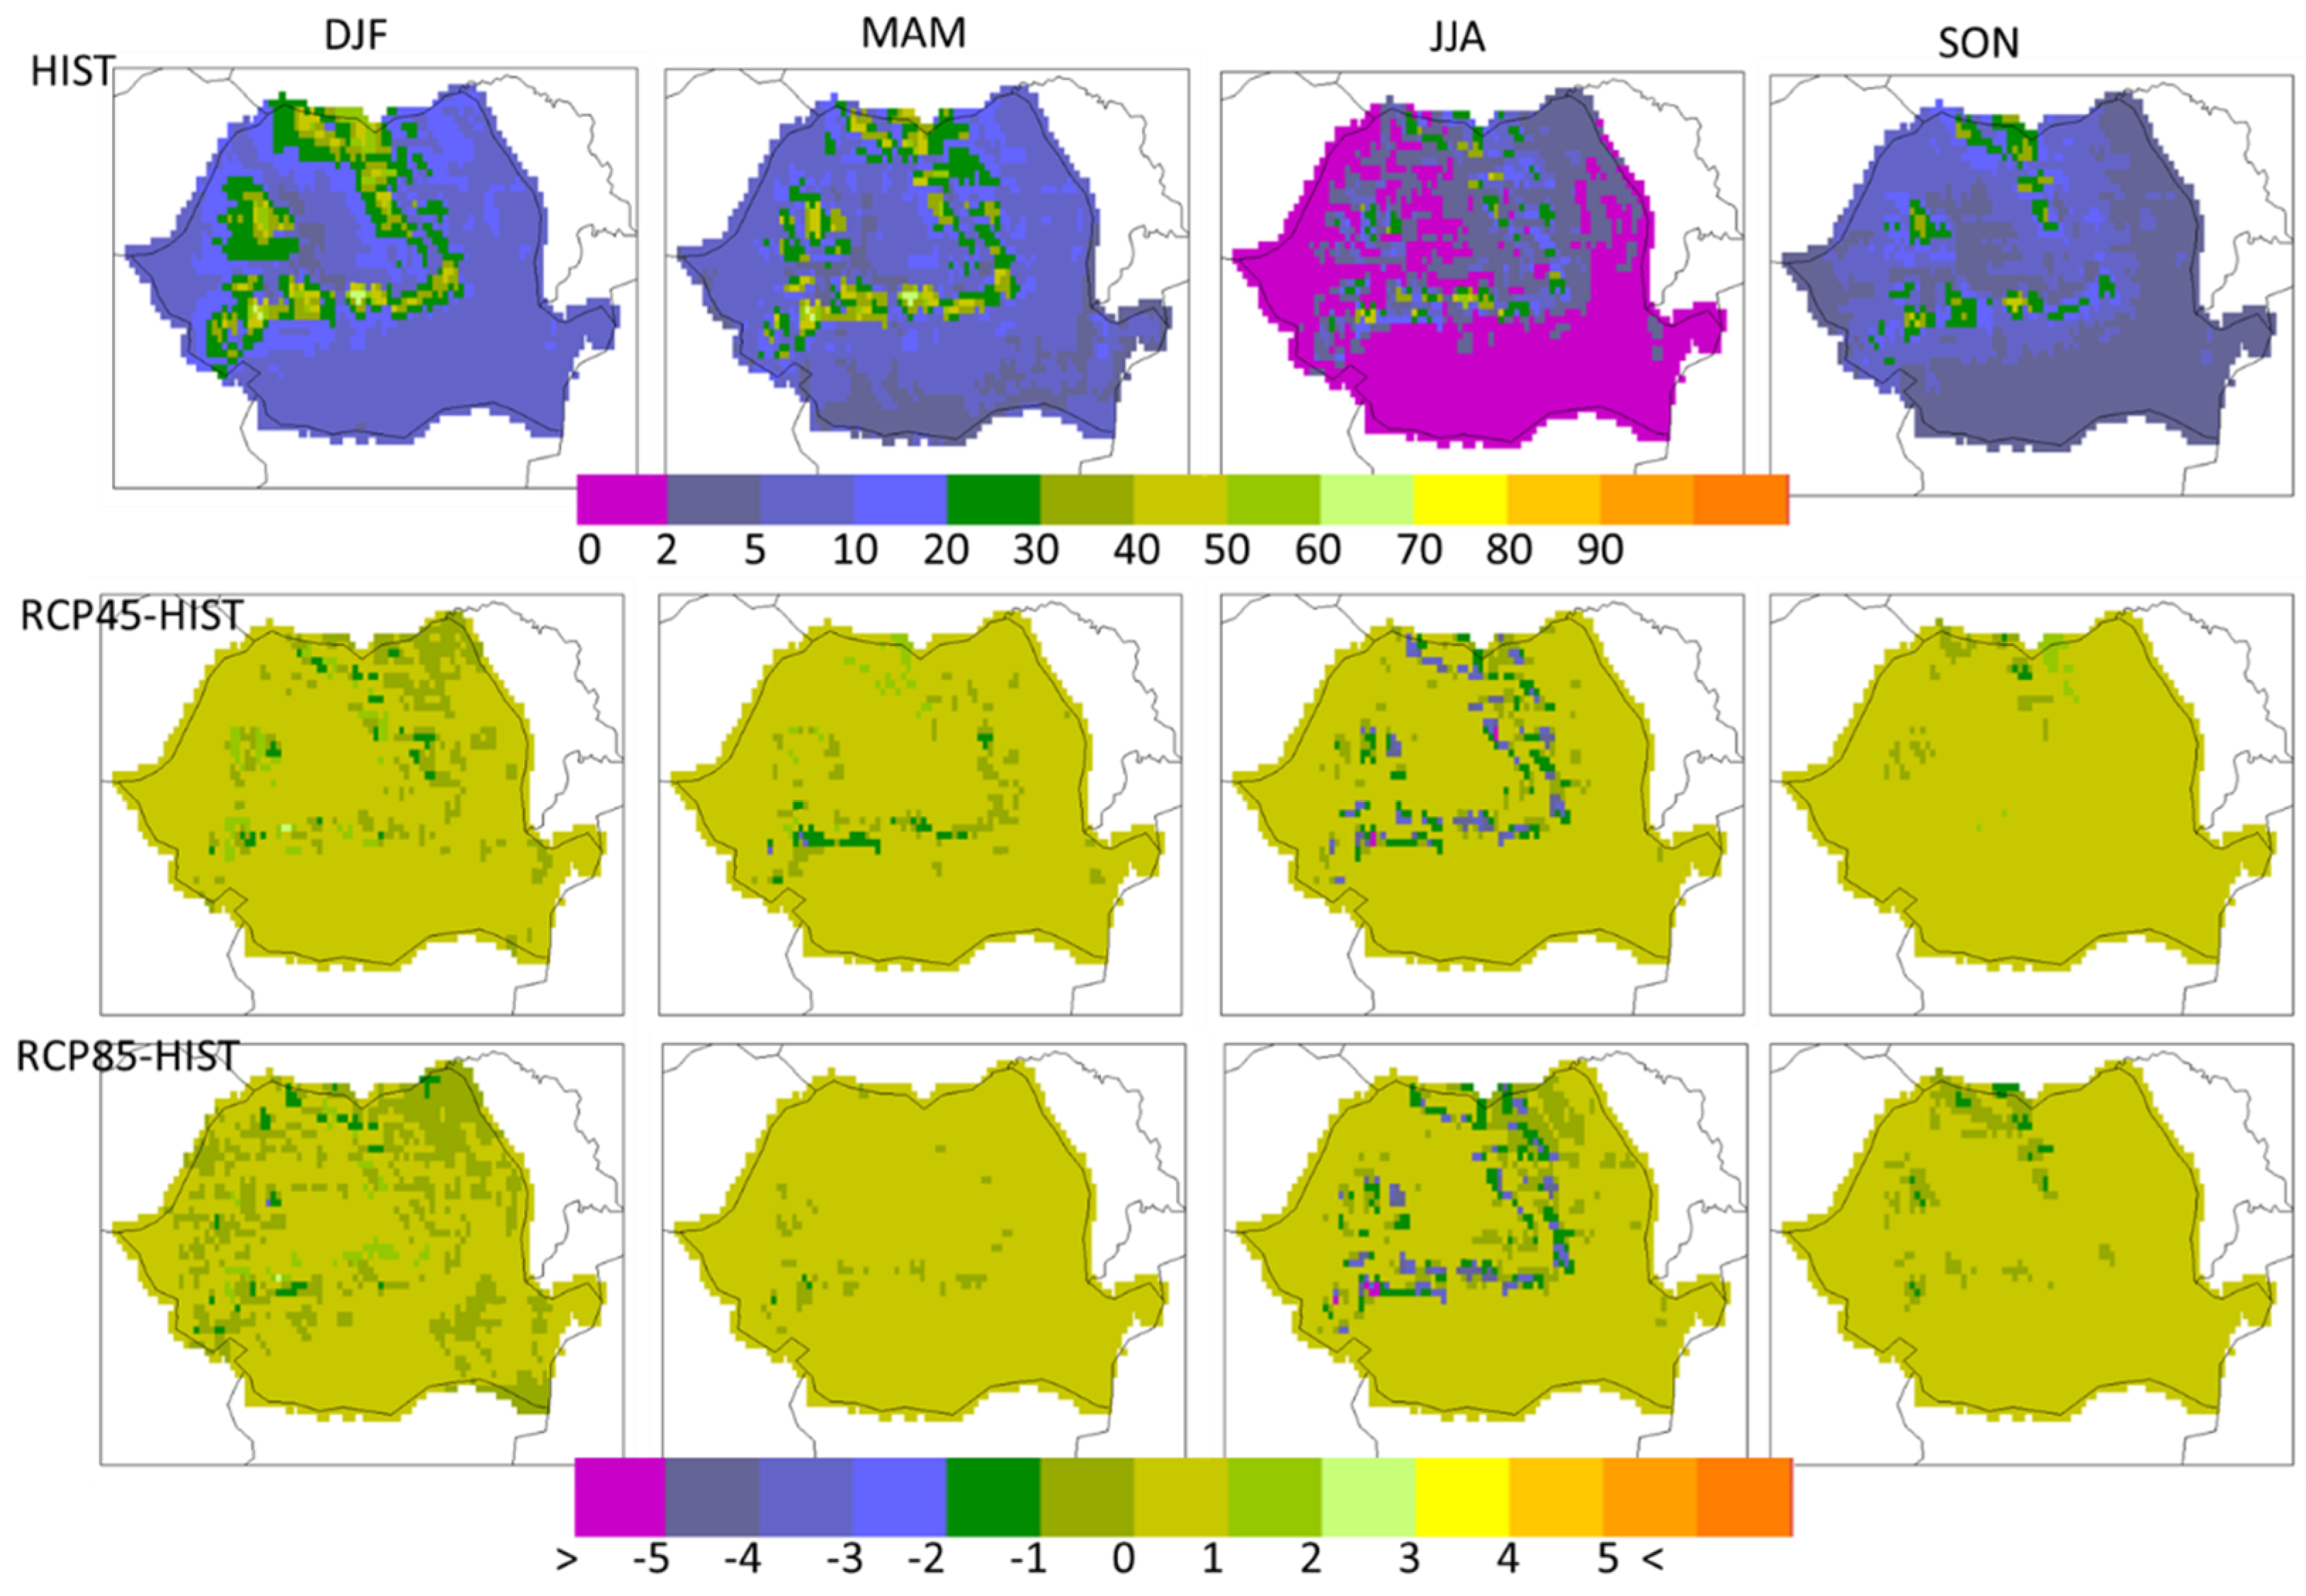
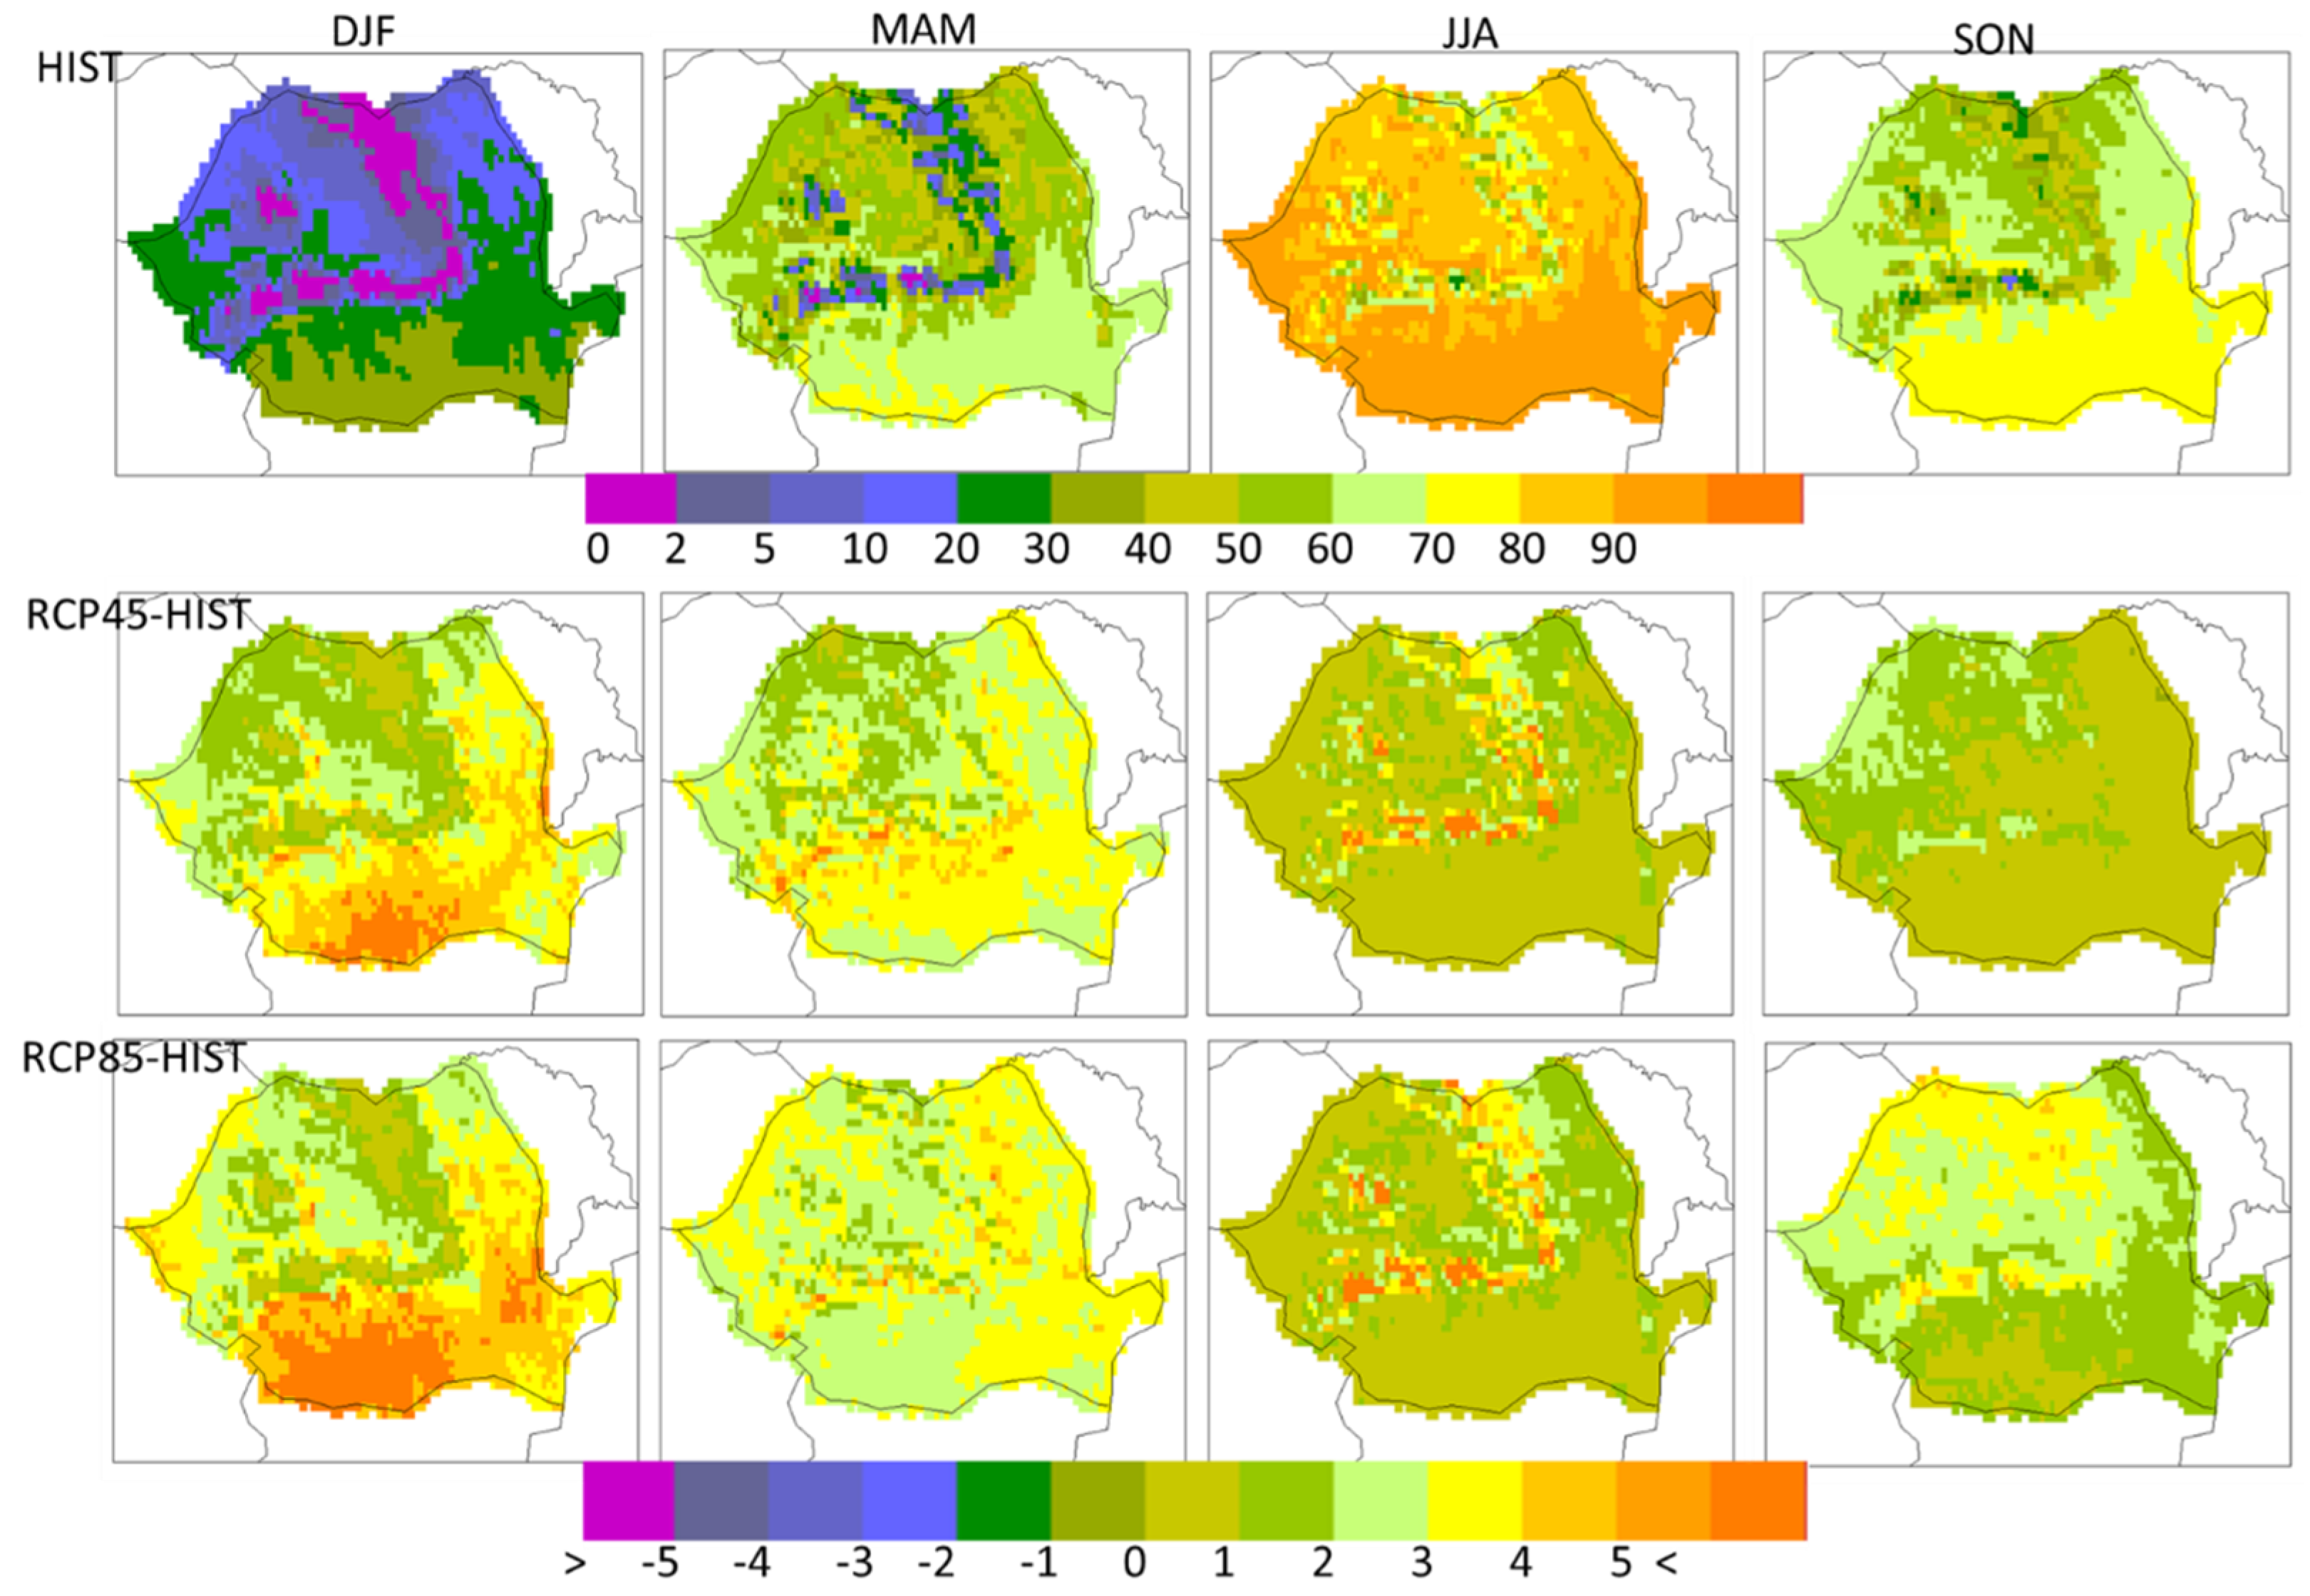
3.1. Changes in Climate Attractivity for Tourism in the near Future (2021–2040) in Romania

This analysis focuses on two classes of climate suitability, namely days with ‘unfavorable’ climate conditions (HCI < 50) and days with ‘good’ climate conditions (HCI > 70), as available from the ‘Climate Suitability for Tourism Indicators’ dataset [59] and aggregated at a seasonal scale. This selection simplifies the rating system defined in Table 1 and it favors a practical approach (e.g., fast, synthetic overview), although the analysis may lose some local details.
The spatial distribution of the seasonal number of days with ‘unfavorable’ climate conditions for outdoor leisure activities is presented in Figure 1 (upper row) for the reference simulation (HIST) for the period 1986–2005. It indicates that the distribution of the number of ‘unfavorable’ days is closely related to the terrain orography, as expected, with a larger number of days associated with higher relief heights. Seasonality is also pronounced. During winter, all over the country may experience at least 10 such days (in the south), with the number increasing in the sub-Carpathian areas to 20 days and in higher mountainous areas up to 50 days. The situation partially improves during spring, especially in limited areas in the southern regions. The summer season is characterized by less than 2 days of ‘unfavorable’ climate conditions in most parts of the country, except for the sub-mountainous and mountainous areas. Even for those, the climate conditions are better during summer, as only the higher mountainous areas are characterized by up to 20 days of ‘unfavorable’ conditions; in isolated regions (e.g., high mountain peaks), there persist up to 50 days of ‘unfavorable’ climate conditions for outdoor activities.
The comparison with the ROCADA dataset (Figure 3, lower row) indicates, in general, a good agreement, with similar larger-scale spatial patterns such as the less favorable conditions in the mountains and better conditions in the southern, western and eastern areas. However, smaller-scale patterns are different in the two datasets; for example, during the spring, the small area in the southernmost of the country, in which about 70–80 days have ‘good’ conditions, is present only in the HIST data. The results derived from the two datasets indicate more pronounced differences in the amplitude of the indicators. For the southern part of the country, the number of days with ‘unfavorable’ conditions is higher in ROCADA than in the HIST data, while in the mountainous areas, it is lower in ROCADA, in all seasons. The seasonal number of days with ‘good’ conditions is systematically lower in ROCADA compared with the HIST simulations, for all seasons, especially in the southern part of the country, with up to 10–20 days per season. Assuming ROCADA, an observation-derived product, is the reference, then the reasons for these differences may come from the simulation chain. One source for the differences is the input data for the HIST period. The Euro-CORDEX simulations for this period are driven by ERA-INTERIM reanalysis [72] which was found to have lower performances compared with its successors such as ERA5 and ERA5Land (e.g., [73,74]). Another source is the climate model limitations. For instance, in a report on the CORDEX simulations at 50 km spatial resolution performed at SMHI (Swedish Meteorological and Hydrological Institute) [61], it is shown that the RCA4 model is associated with some biases in precipitation (e.g., higher amounts than in observations during winter in eastern Europe) and temperature (e.g., overestimated values in southeastern Europe in winter). Nevertheless, the comparison between ROCADA and HIST data suggests that the latter describes the climate suitability for tourism reasonably well for the reference period if the overall analysis takes into account the simulation-related biases mentioned above.
In the near future (2021–2040) (Figure 4, middle and lower rows), the changes are generally of small amplitude (1 day) in most of the country under the RCP4.5 scenario. The number of days with ‘unfavorable’ climate conditions for outdoor leisure activity is increasing compared with the reference period in all the country except for the NE area and sub-mountainous and mountainous regions. In these zones, the difference between the RCP4.5 and HIST simulations indicates, mostly during winter and spring, a decrease in the ‘unfavorable’ number of days with an average of 1–2 days in most mountainous areas and up to 3 days on isolated high peaks regions. This change has a larger amplitude during summer, where higher mountainous regions may experience up to 5 ‘unfavorable’ days less and even more in limited, isolated areas in the southern and eastern Carpathians.
A similar situation is found in the RCP8.5 scenario. However, in this case, during winter, more regions in western, northern and the south-eastern regions may have fewer days with ‘unfavorable’ conditions (up to 1 day less). In summer, the impact of climate change is more visible in the mountainous regions; slightly larger areas may experience fewer ‘unfavorable’ days than in the context of the RCP4.5 scenario, but the amplitude of the change is in the same range (2–5 days less).
As for the favorable climate conditions for outdoor leisure activities, the spatial distribution of the seasonal mean number of days with ‘good’ conditions (HCI > 70) is presented in Figure 5. During the reference period 1986–2005, the southern, south-eastern and western regions have the largest number of days with ‘good’ conditions, varying from 30 to 40 days during winter to almost the entire season during summer. In these regions, spring and fall are also characterized by good climate conditions, with up to 70–80 days with ‘good’ conditions. The mountainous regions are marked by the lowest number of ‘good’ days, which in winter is as low as 2 and this increases to 60–70 days during summer or a maximum of 30 in limited, high areas. The spring season resembles the winter, with the number of ‘good’ days in the Carpathians still being low (5–10 days on average), while the warmth of summer is partially seen during fall too, when 30–50 days with ‘good’ conditions are found in the mountainous areas.
The simulations for the near future (2021–2040) indicate a positive change in the number of days with ‘good’ climate conditions, differentiated spatially and seasonally. For the southern regions, an increase of more than 5 days with ‘good’ conditions may be seen during winter, the area affected being larger in the RCP8.5 scenario. This amplitude diminishes during the other seasons, such that in summer and fall the improvement is in the order of 1–2 days of additional days with ‘good’ conditions. The western and eastern regions of the country may also benefit from an additional 3–5 days with ‘good’ conditions during winter and even spring, while the improvement is in the range of 2–3 additional ‘good’ days during summer and fall. The improvement of climate conditions in the mountainous regions is also visible, varying from 1–2 supplementary days with ‘good’ conditions in winter to up to 5 additional ‘good’ days in summer. The distinct features of changes in the RCP8.5 scenario compared with the RCP4.5 scenario are more pronounced with respect to the spatial distribution of these changes—in the RCP8.5 scenario, larger areas located mainly in the south and north of the territory may experience an increased number of ‘good’ days, especially during winter, fall and spring. The amplitude of the changes is similar for the two scenarios with regard to the number of ‘good’ days.

3.2. Estimating the Impact of Climate Change on Tourism in the near Future (2021–2040) in Romania

The aim of this part of the analysis is to investigate if the changes in climate suitability for tourism (i.e., HCI) in Romania may lead to a quantifiable impact in terms of sector-specific indices (i.e., number of touristic overnights) and, if this is the case, to estimate the amplitude of this impact at the level of urban and rural touristic destinations. In this exercise, any socio-economic factors or other ones (for example, those related to security issues) that may influence the tourism demand are not considered.
A regression model was built, describing the relationship between HCI and the overnights for the 2010–2018 period, based on monthly data, for each of the 94 destinations considered initially. For the analysis, only localities for which the climate conditions explain at least 30% of the variability in the touristic overnights (R2 > 30) for the period 2010–2018 have been retained. There are 13 urban areas and 20 rural touristic destinations fulfilling this condition (Table 2 and Table 3). The regression model was then applied to the ensemble monthly mean values of the HCI for the historical period (1986–2005) as well as for the near future (2021–2040) in the context of RCP4.5 and RCP8.5 scenarios, for each destination. The results have been interpreted in terms of the mean relative difference between the number of overnights corresponding to the climate change scenarios and those corresponding to the historical period. This approach accounts for the uncertainty associated with the models employed (e.g., the models and the ensemble mean are ‘warmer’/’colder’ than the reanalysis) as well as for the limitations associated with the regression model (e.g., it is derived for a 9 year period and applied for a 20 year period).
The expected improvement in the climate conditions may lead to an increase in the touristic overnights in all the selected destinations. For the urban destinations (Table 2), the change is generally in the order of 2–3.5% compared with the reference period in the context of both scenarios, while for three destinations (Constanța, Piatra Neamț and Tulcea), the potential increase is slightly higher (5.21% in the context of RCP4.5 scenario for Piatra Neamț). It is worth noting that, except for Constanta, all the other urban destinations in Table 2 are small–medium cities, where tourism less dependent on the weather and climate (e.g., business, conferences, medical tourism etc.) is not very well developed. The relatively high increase for Constanța may be explained by its location on the seaside, as well as by the fact that the number of touristic overnights for this city also incorporates those for the well-known seaside resort, Mamaia.
For the rural destinations (Table 3), the impact of improving climate conditions may lead to a more pronounced increase in the touristic flux. In the context of the RCP4.5 scenario, eight destinations may benefit from an improvement of 2.8–4.67% in the mean number of touristic overnights, while for five destinations, the increase may vary between 5.5 and 8.8% compared with the reference period. The highest increases are in the range of 9.89–14.79% and they are found for Băltățești, Praid, Sângeorz Băi and Slănic Moldova. A similar amplitude of the results is found for the RCP8.5 scenario, the difference compared with the RCP4.5 scenario being generally in the range of −1% and 1%, with a minimum of −1.2% (Băile Olănesti) and a maximum of 2.92% (Sângeorgiu de Mureș). It is interesting to note that for half of the selected rural destinations, the potential increase in the mean number of touristic overnights is slightly larger in the context of the RCP4.5 scenario; however, for at least one rural destination (Sângeorgiu de Mureș), the climate conditions associated with the RCP8.5 scenario may lead to a significantly larger increase than in the context of the RCP4.5 scenario (14.01% compared with 11.08%). The higher impact of better climate conditions for outdoor leisure activities in rural destinations compared with the urban ones confirms once more the strong dependency of the tourism flux on climate conditions in rural areas. Considering that, except for one locality (Gura Humorului), in all the other 19 rural destinations where balneary tourism is dominant, these results agree with other studies (e.g., [75]) showing that, for this type of tourism, the main activities, apart from the balneary treatment itself, are walking and other light relaxation activities outdoors.

4. Discussion and Conclusions

The changes in climate suitability for tourism in Romania in the near future (2021–2040) in the context of the RCP4.5 and RCP8.5 climate change scenarios are investigated. Furthermore, an attempt to estimate the direct impact of these changes on the tourism flux in urban and rural destinations in Romania is presented.
In the context of both RCP4.5 and RCP8.5 climate change scenarios, the climate suitability for tourism in Romania is expected to improve. The seasonal mean number of days with ‘unfavorable’ conditions is expected to decrease, especially during summer and in the mountainous regions (up to 5 ‘unfavorable’ days less). The improvement is more pronounced for the seasonal mean number of days with ‘good’ conditions, which increases by up to 5 days during winter in almost the entire country. In the other seasons, this change is less marked, except for the mountainous areas where, during summer, up to 5 additional ‘good’ days may be experienced.
The estimate of the direct impact of changes in climate conditions on tourism flux is based on a simple regression model and it initially considers 41 urban and 53 rural destinations. By requiring that climate conditions explain at least 30% of the variability in the touristic overnights during the period 2010–2018, only 13 urban and 20 rural destinations are further used for analysis. The results suggest that the improvement in the climate conditions for outdoor leisure activities may be associated with an increase in the mean number of touristic overnights. The magnitude of the impact, however, is differentiated both between the urban and rural destinations, as well as inside the same ‘category’ of destinations, even at a similar degree of explained variability.
For the urban destinations, the impact is, in general, below 3%. Only three destinations may experience a larger increase—around 5%—in the mean number of touristic overnights. The results suggest that, despite the quite robust influence of climate conditions on the tourism flux, for these urban areas the sole improvement of climate conditions may not be sufficient for a relevant increase in the mean number of touristic overnights. Products and forms of tourism more independent of weather and climate, based on resources other than the natural ones, should be developed in order to make tourism a bigger contributor to local incomes. The same is valid for seaside urban destinations (Constanta, Tulcea, Braila) where the geographical location and the greater tourism demand should not be the only assets exploited.
Instead, the rural destinations may have a more pronounced increase in tourism flux due to the conditions of improvement in climate suitability, with values as high as 14% in the RCP8.5 scenario. These are mainly balneary destinations, for which light outdoor recreational activities are the specific types of touristic activities. Just as in the case for urban destinations, the increase in tourism intensity due to the improvement in climate suitability is not sufficient to guarantee the revitalization of tourism in these destinations. Further improvements in the quality of touristic infrastructure and services are needed, as has also been confirmed by the governmental policies (e.g., [19,76]).
In interpreting the results of this study, one should consider the limitations in the definition of ‘touristic overnight’ used by NIS, namely the fact that this terminology refers to the number of nights spent by a tourist in an accommodation with at least ten beds. Thus, in some destinations, the tourism flow could be more intense than shown by NIS data, due to tourists’ overnights in smaller accommodation units which are not accounted for in the official data. Furthermore, touristic overnights may be less relevant as an indicator of tourism flow in destinations where the touristic products are diversified [33], as these may match the interest of ‘same-day’ travelers (who do not need accommodation). Despite its limitations, the indicator based on tourism overnights remains a core indicator for tourism analysis [77] as it reflects ‘better the impact of tourism on the economy than other indicators such as visitors’ arrivals’ [77]; it is also used by EUROSTAT in building tourism statistics as well as in differentiating between the ‘tourist’ (who spends at least one night at a destination different from the place of residence) from the ‘excursionist’(same-day visitor) [78].
The investigation of the direct impact of climate change on tourism flow allows for the comparison with other studies addressing the changes in tourism demand in the context of climate change. The comparison is, however, limited by the different approaches (e.g., choice of climate indices or parameters, modelling of tourism demand, the inclusion of other factors than climate, region and spatial extent considered). For example, Köberl et al. [50] found that in Sardinia and Cap Bon the net annual impacts in tourism demand are positive, while the summer season may be negatively affected in terms of tourism demand due to increased temperatures. Oğur and Baycan [54] found a decrease in the annual tourism demand in Turkey as well as a seasonal shift in climate suitability conditions. In more general terms, the COACCH (CO-designing the Assessment of Climate Change Costs) project [79], based on a literature review, notes that ‘While the overall demand for tourism will continue to increase over the next few decades, the distribution, timing, and type is expected to shift as a result of climate change’. The analysis presented here aligns with this view, emphasizing the local component of the response in tourism flow to changes in climate conditions, translated in different amplitudes of the change in tourism flow for destinations characterized by similar tourism types (e.g., rural). Furthermore, it provides an order of magnitude for the contribution of climate on tourism flow when considered as the only factor affecting it.
This study presents inherent limitations, for example related to the uncertainty of climate change scenarios (e.g., [80,81,82,83,84,85]) or the uncertainty associated with climate models employed in the simulations of the climate change projections [86,87,88]. In the case of the CSTI datasets used here, the associated documentation [60] show that ‘over Eastern Europe the HCI projections are affected by less uncertainty than the projections over Western Europe’. Furthermore, the differences between the reference simulations and the observation-based results suggest that the magnitude of the changes may be different from the one found here.
More specific limitations are also associated with the regression model used to estimate the direct impact of changes in climate suitability on tourism flux. The model is ‘trained’ with 9 years of data, but it is then applied to 20 years period; this may affect the quality of the regression for the reference and near-future periods in terms of capturing the extreme-value range. On the other hand, the type of linear regression we used in this study is a simplistic way to model the analyzed link. However, for now it suggests a very robust signal and by expressing the results of the analysis in terms of the mean relative difference between the two periods, it is expected that the model-related uncertainties be diminished. For a more comprehensive analysis, it should be considered that climate change may imply other impacts as well (e.g., on water availability) affecting the tourism flux. Studies accounting for both the direct and indirect impact of climate change on tourism (e.g., [89,90]) highlight that the response of the tourism sector to climate change is complex and pertains to economic and social levels as well. By considering the additional impacts of climate change on tourism in Romania, the estimation provided here would change. Furthermore, by using observational data in computing the HCI index in the regression model, the relationship between climate conditions and tourism inflow may be more accurately reproduced. Future approaches using more sophisticated models and observation-based climate data must be further used to better capture the details of the analyzed link between climate change and tourism-related indicators.
Nevertheless, this study brings novel elements and it contributes to the research on this topic targeting south-eastern Europe. By documenting the expected changes in climate suitability for tourism in Romania, this study provides a first view on these aspects for the considered region. The use of the Holiday Climate Index represents another element of novelty in the tourism research focusing on Romania, both through the derivation of the index from reanalysis data as well as through its use in the context of climate change and aligns the study with the most recent approaches (e.g., [65,91,92,93]). Furthermore, the estimation of the direct impact of changes in climate suitability on tourism flux at the destination level, with a particular focus on urban and rural tourism, points toward the limitations of climate as a favoring factor for local tourism, providing useful insights to local authorities and tourism investors. Climate change may positively impact the tourism sector in Romania. However, the amplitude of this impact is not high, especially in medium-sized urban areas. This advantage may be amplified by strengthening other forms of tourism appropriate for each region or destination, capitalizing on resources such as geological characteristics [94,95], opportunities for adventure tourism [96], wine production [97], senior needs and interest [98] and cultural heritage [99,100]. The exploitation of natural resources, including climate, should be accompanied by effective marketing strategies (e.g., [101,102,103]) as well as by investments in infrastructure (e.g., [104,105,106]). Non-material resources should also be promoted in a more efficient way and used as basis for developing local tourism [107,108].
Further directions of research must consider in more depth the impact on various tourism types under the specific conditions of the Romanian context, as well as the indirect impacts of climate change (e.g., through thermal comfort), which also have a significant influence on tourism.

Author Contributions

Conceptualization, L.V.; data curation, A.I. and V.C.; formal analysis, R.B.; methodology, L.V. and R.B.; project administration, A.G.; resources, V.C. and S.P.; visualization, A.I.; writing—original draft, L.V.; writing—review and editing, A.G. and S.P. All authors have read and agreed to the published version of the manuscript.

Funding

This project received funding from the European Union’s Horizon 2020 research and innovation program under the Marie Sklodowska-Curie Grant agreement no. 887544.

Institutional Review Board Statement

Not applicable.

Informed Consent Statement

Not applicable.

Data Availability Statement

Publicly available datasets were analyzed in this study. These data can be found here: https://cds.climate.copernicus.eu, http://statistici.insse.ro:8077/tempo-online/#/pages/tables/insse-table (accessed on 4 April 2023).

Conflicts of Interest

The authors declare no conflict of interest. The funders had no role in the design of the study; in the collection, analyses or interpretation of data; in the writing of the manuscript or in the decision to publish the results.

References

  1. UNWTO. Available online: https://www.unwto.org/glossary-tourism-terms (accessed on 6 April 2023).
  2. Ibănescu, B.-C.; Stoleriu, O.M.; Munteanu, A.; Iațu, C. The Impact of Tourism on Sustainable Development of Rural Areas: Evidence from Romania. Sustainability 2018, 10, 3529. [Google Scholar] [CrossRef] [Green Version]
  3. Cuadrado-Ciuraneta, S.; Durà-Guimerà, A.; Salvati, L. Not only tourism: Unravelling suburbanization, second-home expansion and “rural” sprawl in Catalonia, Spain. Urban Geogr. 2017, 38, 66–89. [Google Scholar] [CrossRef]
  4. Strzelecka, M.; Bynum Bole, B.; Strzelecka, C. Empowerment and resident support for tourism in rural Central and Eastern Europe (CEE): The case of Pomerania, Poland. J. Sustain. Tour. 2017, 25, 554–572. [Google Scholar] [CrossRef]
  5. Pyke, S.; Hartwell, H.; Blake, A.; Hemingway, A. Exploring well-being as a tourism product resource. Tour. Manag. 2016, 55, 94–105. [Google Scholar] [CrossRef] [Green Version]
  6. Hall, C.M.; Scott, D.; Gössling, S. Pandemics, transformations and tourism: Be careful what you wish for. Tour. Geogr. 2020, 22, 577–598. [Google Scholar] [CrossRef]
  7. Lin, H.; Zhang, M.; Gursoy, D.; Fu, X. Impact of tourist-to-tourist interaction on tourism experience: The mediating role of cohesion and intimacy. Ann. Tour. Res. 2019, 76, 153–167. [Google Scholar] [CrossRef]
  8. Testa, R.; Galati, A.; Schifani, G.; Di Trapani, A.M.; Migliore, G. Culinary Tourism Experiences in Agri-Tourism Destinations and Sustainable Consumption—Understanding Italian Tourists’ Motivations. Sustainability 2019, 11, 4588. [Google Scholar] [CrossRef] [Green Version]
  9. Huber, D.; Milne, S.; Hyde, K.F. Constraints and facilitators for senior tourism. Tour. Manag. Perspect. 2018, 27, 55–67. [Google Scholar] [CrossRef]
  10. Chaulagain, S.; Wiitala, J.; Fu, X. The impact of country image and destination image on US tourists’ travel intention. J. Destin. Mark. Manag. 2019, 12, 1–11. [Google Scholar] [CrossRef]
  11. Dedeoğlu, B.B. Shaping tourists’ destination quality perception and loyalty through destination country image: The importance of involvement and perceived value. Tour. Manag. Perspect. 2019, 29, 105–117. [Google Scholar] [CrossRef]
  12. NIS (National Institute for Statistics). 2021. Available online: https://insse.ro/cms/sites/default/files/field/publicatii/contul_satelit_de_turism_2020.pdf (accessed on 6 April 2023).
  13. NIS (National Institute of Statistics)—TEMPO Database. Available online: http://statistici.insse.ro:8077/tempo-online/#/pages/tables/insse-table (accessed on 6 April 2023).
  14. Galluzzo, N. A quantitative analysis on Romanian rural areas, agritourism and the impacts of European Union’s financial subsidies. J. Rural Stud. 2021, 82, 458–467. [Google Scholar] [CrossRef]
  15. Scutariu, A.L.; Scutariu, P. Perceptions of the local government and the residents regarding rural tourism development effects. Survey in the Suceava County—Romania. Cienc. Rural 2023, 53, e20210911. [Google Scholar] [CrossRef]
  16. NSTD (National Strategy for Touristic Development). 2020. Available online: http://sgg.gov.ro/1/wp-content/uploads/2020/09/Strategia-de-Dezvoltare-Turistic%C4%83-a-Rom%C3%A2niei-volum-2-Strategia-%C8%99i-Planul-de-Ac%C8%9Biune.pdf (accessed on 6 April 2023).
  17. Velea, L.; Gallo, A.; Bojariu, R.; Irimescu, A.; Craciunescu, V.; Puiu, S. Holiday Climate Index:Urban—Application for Urban and Rural Areas in Romania. Atmosphere 2022, 13, 1519. [Google Scholar] [CrossRef]
  18. RoGv (Romanian Government), 2019a: The National Ecotourism Development Strategy—Context, Vision and Objectives—2019–2029. Available online: http://www.monitoruljuridic.ro/monitorul-oficial/520-bis/2019-06-26/ (accessed on 22 May 2023).
  19. RoGv (Romanian Government), 2019b: Strategy for the Development of Spa Tourism. Available online: http://www.monitoruljuridic.ro/monitorul-oficial/703-bis/2019-08-27/ (accessed on 22 May 2023).
  20. Romania’s Geography, I, Physical Geography; Editura Academiei Române: Bucharest, Romania, 1983; p. 662. (In Romanian)
  21. Romania’s Climate; Editura Academiei Române: Bucharest, Romania, 2008; p. 363. (In Romanian)
  22. Dogru, T.; Marchio, E.A.; Bulut, U.; Suess, C. Climate change: Vulnerability and resilience of tourism and the entire economy. Tour. Manag. 2019, 72, 292–305. [Google Scholar] [CrossRef]
  23. Atay, I.; Saladié, Ò. Water Scarcity and Climate Change in Mykonos (Greece): The Perceptions of the Hospitality Stakeholders. Tour. Hosp. 2022, 3, 765–787. [Google Scholar] [CrossRef]
  24. Michailidou, A.V.; Vlachokostas, C.; Moussiopoulos, N. Interactions between climate change and the tourism sector: Multiple-criteria decision analysis to assess mitigation and adaptation options in tourism areas. Tour. Manag. 2016, 55, 1–12. [Google Scholar] [CrossRef]
  25. Bojariu, R.; Chițu, Z.; Dascălu, S.I.; Gothard, M.; Velea, L.V.; Burcea, R.; Dumitrescu, A.; Burcea, S.; Apostol, L.; Amihaesei, V.; et al. Climate Change—From Physical Basis to Risks and Adaptation, 2nd ed.; Editura PRINTECH: Bucharest, Romania, 2021; pp. 46–54. Available online: https://www.meteoromania.ro/clima/adaptarea-la-schimbarile-climatice/ (accessed on 6 April 2023). (In Romanian)
  26. Hamilton, L.C.; Brown, C.; Keim, B.D. Ski areas, weather and climate: Time series models for New England case studies. Int. J. Clim. 2007, 27, 2113–2124. [Google Scholar] [CrossRef] [Green Version]
  27. Amelung, B.; Moreno, A. Impacts of Climate Change in Tourism in Europe—PESETA-Tourism Study; Publications Office of the European Union: Luxembourg, 2012; Available online: https://data.europa.eu/doi/10.2791/3418 (accessed on 6 April 2013).
  28. Pons-Pons, M.; Johnson, P.A.; Rosas-Casals, M.; Sureda, B.; Jover, È. Modeling climate change effects on winter ski tourism in Andorra. Clim. Res. 2012, 54, 197–207. [Google Scholar] [CrossRef] [Green Version]
  29. Tranos, E.; Davoudi, S. The Regional Impact of Climate Change on Winter Tourism in Europe. Tour. Plan. Dev. 2014, 11, 163–178. [Google Scholar] [CrossRef]
  30. Damm, A.; Greuell, W.; Landgren, O.; Prettenthaler, F. Impacts of +2 °C global warming on winter tourism demand in Europe. Clim. Serv. 2017, 7, 31–46. [Google Scholar] [CrossRef] [Green Version]
  31. Steiger, R.; Scott, D. Ski tourism in a warmer world: Increased adaptation and regional economic impacts in Austria. Tour. Manag. 2020, 77, 104032. [Google Scholar] [CrossRef]
  32. Scott, D.; Steiger, R.; Knowles, N.; Fang, Y. Regional ski tourism risk to climate change: An inter-comparison of Eastern Canada and US Northeast markets. J. Sustain. Tour. 2020, 28, 568–586. [Google Scholar] [CrossRef]
  33. Steiger, R.; Daniel Scott, D.; Abegg, B.; Pons, M.; Aall, C. A critical review of climate change risk for ski tourism. Curr. Issues Tour. 2019, 22, 1343–1379. [Google Scholar] [CrossRef] [Green Version]
  34. Rech, Y.; Paget, E.; Dimanche, F. Uncertain tourism: Evolution of a French winter sports resort and network dynamics. J. Destin. Mark. Manag. 2019, 12, 95–104. [Google Scholar] [CrossRef]
  35. Grillakis, M.G.; Outaouais, A.G.; Seiradakis, K.D.; Tsanis, I.K. Implications of 2 °C global warming in European summer tourism. Clim. Serv. 2016, 1, 30–38. [Google Scholar] [CrossRef] [Green Version]
  36. Jacob, D.; Kotova, L.; Teichmann, C.; Sobolowski, S.P.; Vautard, R.; Donnelly, C.; Koutroulis, A.G.; Grillakis, M.G.; Tsanis, I.K.; Damm, A.; et al. Climate Impacts in Europe under +1.5 °C Global Warming. Earths Future 2018, 6, 264–285. [Google Scholar] [CrossRef] [Green Version]
  37. Demiroglu, O.C.; Saygili-Araci, F.S.; Pacal, A.; Hall, C.M.; Kurnaz, M.L. Future Holiday Climate Index (HCI) performance of urban and beach destinations in the Mediterranean. Atmosphere 2020, 11, 911. [Google Scholar] [CrossRef]
  38. Toimil, A.; Díaz-Simal, P.; Losada, I.J.; Camus, P. Estimating the risk of loss of beach recreation value under climate change. Tour. Manag. 2018, 68, 387–400. [Google Scholar] [CrossRef]
  39. Matzarakis, A.; Endler, C.; Nastos, P.T. Quantification of climate-tourism potential for Athens, Greece—Recent and future climate simulations. Glob. Nest J. 2014, 16, 43–51. [Google Scholar]
  40. Caldeira, A.M.; Kastenholz, E. It’s so hot: Predicting climate change effects on urban tourists’ time-space experience. J. Sustain. Tour. 2018, 26, 1516–1542. [Google Scholar] [CrossRef]
  41. Surugiu, C.; Surugiu, M.R. The Assessment of Climate Change Impact on the Romanian Seaside Tourism. Econ. Res. Ekon. Istraž. 2012, 25, 959–972. [Google Scholar] [CrossRef]
  42. Dumitrescu, G.-C.; Poladian, S.M.; Aluculesei, A.-C. Repositioning of Romanian Seaside Tourism as an Effect of Climate Change. Information 2021, 12, 108. [Google Scholar] [CrossRef]
  43. Surugiu, C.; Surugiu, M.R.; Frent, C.; Breda, Z. Effects of climate change on Romanian mountain tourism: Are they positive or mostly negative? Eur. J. Tour. Hosp. Recreat. 2011, 2, 42–71. [Google Scholar]
  44. Velea, L.; Bojariu, R. Summer thermal discomfort conditions in Romania under climate change scenarios. Carpathian J. Earth Environ. Sci. 2018, 13, 595–603. [Google Scholar] [CrossRef]
  45. Banc, Ș.; Croitoru, A.-E.; David, N.A.; Scripcă, A.-S. Changes Detected in Five Bioclimatic Indices in Large Romanian Cities over the Period 1961–2016. Atmosphere 2020, 11, 819. [Google Scholar] [CrossRef]
  46. Cheval, S.; Dumitrescu, A.; Irașoc, A.; Paraschiv, M.G.; Perry, M.; Ghent, D. MODIS-based climatology of the Surface Urban Heat Island at country scale (Romania). Urban Clim. 2022, 41, 101056. [Google Scholar] [CrossRef]
  47. Sfîcă, L.; Crețu, C.S.; Ichim, P.; Hrițac, R.; Breabăn, I.G. Surface urban heat island of Iași city (Romania) and its differences from in situ screen-level air temperature measurements. Sustain. Cities Soc. 2023, 94, 104568. [Google Scholar] [CrossRef]
  48. Serquet, G.; Rebetez, M. Relationship between tourism demand in the Swiss Alps and hot summer air temperatures associated with climate change. Clim. Change 2011, 108, 291–300. [Google Scholar] [CrossRef] [Green Version]
  49. Falk, M. Impact of weather conditions on tourism demand in the peak summer season over the last 50years. Tour. Manag. Perspect. 2014, 9, 24–35. [Google Scholar] [CrossRef]
  50. Köberl, J.; Prettenthaler, F.; Bird, D.N. Modelling climate change impacts on tourism demand: A comparative study from Sardinia (Italy) and Cap Bon (Tunisia). Sci. Total Environ. 2006, 543-B, 1039–1053. [Google Scholar] [CrossRef]
  51. Yañez, C.C.; Hopkins, F.M.; Porter, W.C. Projected impacts of climate change on tourism in the Coachella Valley, California. Clim. Change 2020, 162, 707–721. [Google Scholar] [CrossRef]
  52. Hein, L.; Metzger, M.J.; Moreno, A. Potential impacts of climate change on tourism; a case study for Spain. Curr. Opin. Environ. Sustain. 2009, 1, 170–178. [Google Scholar] [CrossRef]
  53. Mieczkowski, Z. The tourism climatic index: A method of evaluating world climates for tourism. Can. Geogr. Géogr. Can. 1985, 29, 220–233. [Google Scholar] [CrossRef]
  54. Oğur, A.A.; Baycan, T. Assessing climate change impacts on tourism demand in Turkey. Environ. Dev. Sustain. 2022, 25, 2905–2935. [Google Scholar] [CrossRef]
  55. Carrillo, J.; González, A.; Pérez, J.C.; Expósito, F.J.; Díaz, J.P. Projected impacts of climate change on tourism in the Canary Islands. Reg. Environ. Change 2022, 22, 61. [Google Scholar] [CrossRef]
  56. Scott, D.; Rutty, M.; Amelung, B.; Tang, M. An Inter-Comparison of the Holiday Climate Index (HCI) and the Tourism Climate Index (TCI) in Europe. Atmosphere 2016, 7, 80. [Google Scholar] [CrossRef] [Green Version]
  57. Available online: https://cds.climate.copernicus.eu/ (accessed on 7 June 2023).
  58. Gregorczuk, M.; Cena, K. Distribution of effective temperature over the surface of the earth. Int. J. Biometeorol. 1967, 11, 145–149. [Google Scholar] [CrossRef]
  59. Available online: https://cds.climate.copernicus.eu/cdsapp#!/dataset/sis-tourism-climate-suitability-indicators?tab=overview (accessed on 7 June 2023).
  60. Available online: https://confluence.ecmwf.int/display/CKB/Climate+Suitability+for+Tourism+Indicators+%28CST%29%3A+Dataset+description (accessed on 7 June 2023).
  61. Strandberg, G.; Bärring, L.; Hansson, U.; Jansson, C.; Jones, C.; Kjellström, E.; Kolax, M.; Kupiainen, M.; Nikulin, G.; Samuelsson, P.; et al. CORDEX Scenarios for Europe from the Rossby Centre Regional Climate Model RCA4. Report Meteorology and Climatology No. 116, 2014. Swedish Meteorological and Hydrological Institute (SMHI). Available online: https://www.smhi.se/polopoly_fs/1.90273!/Menu/general/extGroup/attachmentColHold/mainCol1/file/RMK_116.pdf (accessed on 7 June 2023).
  62. Bienvenido-Huertas, D.; Rubio-Bellido, C.; Marín-García, D.; Canivell, J. Influence of the Representative Concentration Pathways (RCP) scenarios on the bioclimatic design strategies of the built environment. Sustain. Cities Soc. 2021, 72, 103042. [Google Scholar] [CrossRef]
  63. IPCC. Climate Change 2014: Synthesis Report—Contribution of Working Groups I, II and III to the Fifth Assessment Report of the Intergovernmental Panel on Climate Change; Pachauri, R.K., Meyer, L.A., Eds.; IPCC: Geneva, Switzerland, 2014; p. 151.
  64. Benassi, M. Climate Suitability for Tourism Indicators (CST)—Dataset Description. 2019. Available online: https://datastore.copernicus-climate.eu/documents/sis-european-tourism/C3S_D422_Lot2_TEC_CST_dataset_description_v1.1_Projections.pdf (accessed on 6 April 2023).
  65. Hewer, M.J.; Gough, W.A. Thirty years of assessing the impacts of climate change on outdoor recreation and tourism in Canada. Tour. Manag. Perspect. 2018, 26, 179–192. [Google Scholar] [CrossRef]
  66. Amengual, A.; Homar, V.; Romero, R.; Alonso, S.; Ramis, C. Projections of the climate potential for tourism at local scales: Application to Platja de Palma, Spain. Int. J. Climatol. 2012, 32, 2095–2107. [Google Scholar] [CrossRef] [Green Version]
  67. Dumitrescu, A.; Birsan, M.V. ROCADA: A gridded daily climatic dataset over Romania (1961–2013) for nine meteorological variables. Nat. Hazards 2015, 78, 1045–1063. [Google Scholar] [CrossRef]
  68. PANGAEA Data Portal. Available online: https://doi.pangaea.de/10.1594/PANGAEA.833627 (accessed on 7 June 2023).
  69. UERRA. Available online: https://datastore.copernicus-climate.eu/documents/uerra/D322_Lot1.4.1.2_User_guides_v3.3.pdf (accessed on 6 April 2023).
  70. ERA5-Land. Available online: https://cds.climate.copernicus.eu/cdsapp#!/dataset/reanalysis-era5-land?tab=overview (accessed on 6 April 2023).
  71. Li, C.; Ge, P.; Liu, Z.; Zheng, W. Forecasting tourist arrivals using denoising and potential factors. Ann. Tour. Res. 2020, 83, 102943. [Google Scholar] [CrossRef]
  72. EURO-CORDEX. Available online: https://www.euro-cordex.net/060374/index.php.en (accessed on 7 June 2023).
  73. Sheridan, S.C.; Lee, C.C.; Smith, E.T. A comparison between station observations and reanalysis data in the identification of extreme temperature events. Geophys. Res. Lett. 2020, 47, e2020GL088120. [Google Scholar] [CrossRef]
  74. Hassler, B.; Lauer, A. Comparison of Reanalysis and Observational Precipitation Datasets Including ERA5 and WFDE5. Atmosphere 2021, 12, 1462. [Google Scholar] [CrossRef]
  75. Stancioiu, A.F.; Teodorescu, N.; Pârgaru, I.; Botos, A.; Radu, A.C. Aspects on the perception of young people regarding balneotherapy tourism in Romania. Theor. Appl. Econ. 2013, 12, 25–42. [Google Scholar]
  76. MET (Ministry of Entrepreneurship and Tourism). Romania’s National Strategy for Development Tourism 2023–2035. 2022. Available online: https://turism.gov.ro/web/wp-content/uploads/2022/11/SNRDT-actualizat-var-pt-HG-2023-2035.pdf (accessed on 6 April 2023). (In Romanian)
  77. Dupeyras, A.; MacCallum, N. Indicators for Measuring Competitiveness in Tourism: A Guidance Document. In OECD Tourism Papers; OECD Publishing: Paris, France, 2013; Volume 2. [Google Scholar] [CrossRef]
  78. EUROSTAT. Methodological Manual for Tourism Statistics, Version 3.1. 2014. Available online: https://ec.europa.eu/eurostat/documents/3859598/6454997/KS-GQ-14-013-EN-N.pdf/166605aa-c990-40c4-b9f7-59c297154277?t=1420557603000 (accessed on 7 June 2023).
  79. COACCH. The Economic Cost of Climate Change in Europe: Synthesis Report on State of Knowledge and Key Research Gaps—Policy Brief by the COACCH Project; Watkiss, P., Troeltzsch, J., McGlade, K., Eds.; European Union: Luxembourg, 2018; Available online: https://www.coacch.eu/wp-content/uploads/2018/03/COACCH_Policy-Brief-1_Synthesis-Report-State-of-KnowledgeWEB.pdf (accessed on 21 May 2023).
  80. Zhang, H.; Huang, G.H.; Wang, D.; Zhang, X. Uncertainty assessment of climate change impacts on the hydrology of small prairie wetlands. J. Hydrol. 2011, 396, 94–103. [Google Scholar] [CrossRef] [Green Version]
  81. Samadi, S.; Wilson, C.A.M.E.; Moradkhani, H. Uncertainty analysis of statistical downscaling models using Hadley Centre Coupled Model. Appl. Clim. 2013, 114, 673–690. [Google Scholar] [CrossRef]
  82. Bukovsky, M.S.; Gao, J.; Mearns, L.O.; O’Neill, B.C. SSP-based land-use change scenarios: A critical uncertainty in future regional climate change projections. Earths Future 2021, 9, e2020EF001782. [Google Scholar] [CrossRef]
  83. Lhotka, O.; Kyselý, J.; Farda, A. Climate change scenarios of heat waves in Central Europe and their uncertainties. Appl. Clim. 2018, 131, 1043–1054. [Google Scholar] [CrossRef]
  84. Fatichi, S.; Ivanov, V.Y.; Paschalis, A.; Peleg, N.; Molnar, P.; Rimkus, S.; Kim, J.; Burlando, P.; Caporali, E. Uncertainty partition challenges the predictability of vital details of climate change. Earths Future 2016, 4, 240–251. [Google Scholar] [CrossRef]
  85. Thuiller, W.; Guéguen, M.; Renaud, J.; Karger, D.N.; Zimmermann, N.E. Uncertainty in ensembles of global biodiversity scenarios. Nat. Commun. 2019, 10, 1446. [Google Scholar] [CrossRef] [PubMed] [Green Version]
  86. Lavin-Gullon, A.; Fernandez, J.; Bastin, S.; Cardoso, R.M.; Fita, L.; Giannaros, T.M.; Goergen, K.; Gutierrez, J.M.; Kartsios, S.; Katragkou, E.; et al. Internal variability versus multi-physics uncertainty in a regional climate model. Int. J. Climatol. 2021, 41 (Suppl. S1), E656–E671. [Google Scholar] [CrossRef]
  87. Evin, G.; Somot, S.; Hingray, B. Balanced estimate and uncertainty assessment of European climate change using the large EURO-CORDEX regional climate model ensemble. Earth Syst. Dyn. 2021, 12, 1543–1569. [Google Scholar] [CrossRef]
  88. Her, Y.; Yoo, S.H.; Cho, J.; Hwang, S.; Jeong, J.; Seong, C. Uncertainty in hydrological analysis of climate change: Multi-parameter vs. multi-GCM ensemble predictions. Sci. Rep. 2019, 9, 4974. [Google Scholar] [CrossRef] [Green Version]
  89. Day, J.; Chin, N.; Sydnor, S.; Widhalm, M.; Shah, K.U.; Dorworth, L. Implications of climate change for tourism and outdoor recreation: An Indiana, USA, case study. Clim. Change 2021, 169, 29. [Google Scholar] [CrossRef] [PubMed]
  90. Arabadzhyan, A.; Figini, P.; García, C.; González, M.M.; Lam-González, Y.E.; León, C.J. Climate change, coastal tourism, and impact chains—A literature review. Curr. Issues Tour. 2021, 24, 2233–2268. [Google Scholar] [CrossRef]
  91. Yu, D.D.; Rutty, M.; Scott, D.; Li, S. A comparison of the holiday climate index:beach and the tourism climate index across coastal destinations in China. Int. J. Biometeorol. 2021, 65, 741–748. [Google Scholar] [CrossRef]
  92. Ma, S.; Craig, A.C.; Feng, S.; Liu, C. Climate resources at United States National Parks: A tourism climate index approach. Tour. Recreat. Res. 2021. [Google Scholar] [CrossRef]
  93. Yu, D.D.; Matthews, L.; Scott, D.; Li, S.; Guo, Z.Y. Climate suitability for tourism in China in an era of climate change: A multiscale analysis using holiday climate index. Curr. Issues Tour. 2022, 25, 2269–2284. [Google Scholar] [CrossRef]
  94. Telbisz, T.; Imecs, Z.; Máthé, A.; Mari, L. Empirical Investigation of the Motivation and Perception of Tourists Visiting the Apuseni Nature Park (Romania) and the Relationship of Tourism and Natural Resources. Sustainability 2023, 15, 4181. [Google Scholar] [CrossRef]
  95. Codrea, P.M.; Bilașco, Ș.; Roșca, S.; Irimuș, I.-A.; Iuliu, V.; Rusu, R.; Fodorean, I.; Sestras, P. The Integrated Assessment of Degraded Tourist Geomorphosites to Develop Sustainable Tourism: A Case Study of Grădina Zmeilor Geomorphosite, North-West Region, Romania. Appl. Sci. 2022, 12, 9816. [Google Scholar] [CrossRef]
  96. Dumitras, D.E.; Mihai, V.C.; Jitea, I.M.; Donici, D.; Muresan, I.C. Adventure Tourism: Insight from Experienced Visitors of Romanian National and Natural Parks. Societies 2021, 11, 41. [Google Scholar] [CrossRef]
  97. Tănase, M.O.; Dina, R.; Isac, F.-L.; Rusu, S.; Nistoreanu, P.; Mirea, C.N. Romanian Wine Tourism—A Paved Road or a Footpath in Rural Tourism? Sustainability 2022, 14, 4026. [Google Scholar] [CrossRef]
  98. Taloş, A.-M.; Lequeux-Dincă, A.I.; Preda, M.; Surugiu, C.; Mareci, A.; Vijulie, I. Silver Tourism and Recreational Activities as Possible Factors to Support Active Ageing and the Resilience of the Tourism Sector. J. Settl. Spat. Plan. 2021, 8, 29–48. [Google Scholar] [CrossRef]
  99. Boc, E.; Filimon, A.L.; Mancia, M.-S.; Mancia, C.A.; Josan, I.; Herman, M.L.; Filimon, A.C.; Herman, G.V. Tourism and Cultural Heritage in Beiuș Land, Romania. Heritage 2022, 5, 1734–1751. [Google Scholar] [CrossRef]
  100. Lupu, C.; Brochado, A.; Stoleriu, O. Visitor experiences at UNESCO monasteries in Northeast Romania. J. Herit. Tour. 2019, 14, 150–165. [Google Scholar] [CrossRef]
  101. Nistoreanu, P.; Aluculesei, A.-C. Can Spa Tourism Enhance Water Resources and Turn Them into a National Brand? A Theoretical Review about the Romanian Case. Information 2021, 12, 270. [Google Scholar] [CrossRef]
  102. Lupu, C.; Rodrigues, A.I.; Stoleriu, O.M.; Gallarza, M.G. A Textual and Visual Analysis of the Intrinsic Value Dimensions of Romania: Towards a Sustainable Destination Brand. Sustainability 2021, 13, 67. [Google Scholar] [CrossRef]
  103. Nistoreanu, P.; Aluculesei, A.-C.; Avram, D. Is Green Marketing a Label for Ecotourism? The Romanian Experience. Information 2020, 11, 389. [Google Scholar] [CrossRef]
  104. Dumitrașcu, A.V.; Teodorescu, C.; Cioclu, A. Accessibility and Tourist Satisfaction—Influencing Factors for Tourism in Dobrogea, Romania. Sustainability 2023, 15, 7525. [Google Scholar] [CrossRef]
  105. Wendt, J.A.; Grama, V.; Ilieş, G.; Mikhaylov, A.S.; Borza, S.G.; Herman, G.V.; Bógdał-Brzezińska, A. Transport Infrastructure and Political Factors as Determinants of Tourism Development in the Cross-Border Region of Bihor and Maramureş. A Comparative Analysis. Sustainability 2021, 13, 5385. [Google Scholar] [CrossRef]
  106. Kimic, K.; Smaniotto Costa, C.; Negulescu, M. Creating Tourism Destinations of Underground Built Heritage—The Cases of Salt Mines in Poland, Portugal, and Romania. Sustainability 2021, 13, 9676. [Google Scholar] [CrossRef]
  107. Mateoc-Sîrb, N.; Albu, S.; Rujescu, C.; Ciolac, R.; Țigan, E.; Brînzan, O.; Mănescu, C.; Mateoc, T.; Milin, I.A. Sustainable Tourism Development in the Protected Areas of Maramureș, Romania: Destinations with High Authenticity. Sustainability 2022, 14, 1763. [Google Scholar] [CrossRef]
  108. Caciora, T.; Herman, G.V.; Ilieș, A.; Baias, Ș.; Ilieș, D.C.; Josan, I.; Hodor, N. The Use of Virtual Reality to Promote Sustainable Tourism: A Case Study of Wooden Churches Historical Monuments from Romania. Remote Sens. 2021, 13, 1758. [Google Scholar] [CrossRef]
Figure 1. Map of selected touristic destinations.
Atmosphere 14 01020 g001
Figure 2. Temporal evolution of monthly touristic overnights between 2010 and 2018 at Baile Herculane from sectoral data (blue line) and simulated by the linear regression model (orange line).
Atmosphere 14 01020 g002
Figure 3. Comparison between HISTORICAL data (upper row) and ROCADA data (lower row) for the period 1986–2010 for the following: (a) seasonal mean number of days with ‘unfavorable’ conditions (HCI < 50); (b) seasonal mean number of days with ‘good’ conditions (HCI > 70).
Atmosphere 14 01020 g003
Figure 4. (Upper row) Seasonal mean number of days with ‘unfavorable’ climate conditions (HCI < 50) for outdoor leisure activities for HIST period (1986–2005); the difference between the seasonal mean number of days with ‘unfavorable’ climate conditions for the period 2021–2040 between RCP4.5 and HIST (middle row) and between RCP8.5 and HIST (lower row) simulations.
Atmosphere 14 01020 g004
Figure 5. (Upper row) The seasonal mean number of days with ‘good’ climate conditions (HCI > 70) for outdoor leisure activities for the HIST period (1986–2005); the difference between the seasonal mean number of days with ‘good’ climate conditions for the period 2021–2040 between RCP4.5 and HIST (middle row) and between RCP8.5 and HIST (lower row) simulations.
Atmosphere 14 01020 g005
Table 1. HCI rating system (after [56]).
HCI ValuesClimate Suitability Classes (HCI Rating)Acronyms Used in the Graphics
90 ÷ 100IdealI
80 ÷ 89ExcellentE
70 ÷ 79Very goodVG
60 ÷ 69GoodG
50 ÷ 59AcceptableA
40 ÷ 49MarginalM
30 ÷ 39
20 ÷ 29
UnacceptableUA
10 ÷ 19
9 ÷ 0
DangerousD
Table 2. Linear regression model-based estimation of the impact of climate change in the number of touristic overnights for the period 2021–2040, in RCP4.5 and RCP8.5 climate change scenarios, for urban localities for which climate conditions explain at least 30% of the variability in touristic overnights during the period 2010–2018.
No.LocalityR2 for Regression Model for 2010–2018 PeriodMean Overnights (Sectoral Data) 2010–2018Mean Relative Overnights Difference RCP4.5-HIST [%]Mean Relative Overnights Difference RCP8.5-HIST [%]
1Alba Iulia40.2273692.772.63
2Arad53.0218,4602.012.08
3Bistrita37.0576022.873.16
4Braila35.2314,9463.163.00
5Constanta57.14129,5074.804.95
6Targu Jiu30.4872162.412.09
7Miercurea Ciuc36.8358693.123.47
8Deva31.5143422.352.35
9Slobozia45.4215192.472.44
10Piatra Neamt60.4663105.215.11
11Zalau33.3632952.843.25
12Tulcea49.0682363.923.68
13Ramnicu Valcea44.8376352.622.23
Table 3. Linear regression model-based estimation of the impact of climate change in the number of touristic overnights for period 2021–2040, in RCP4.5 and RCP8.5 climate change scenarios, for rural destinations for which climate conditions explain at least 30% of the variability in touristic overnights during the period 2010–2018.
No.LocalityR2 for Regression Model for 2010–2018 PeriodMean Overnights (Sectoral Data) 2010–2018Mean Relative Overnights Difference RCP4.5-HIST [%]Mean Relative Overnights Difference RCP8.5-HIST [%]
1Amara59.2913,2293.773.64
2Băile Govora61.0793034.183.43
3Băile Herculane55.0536,7138.317.21
4Băile Olanești65.8626,8106.675.47
5Băile Tușnad47.0710,2498.888.86
6Bala43.0732494.493.55
7Băltățești61.49511514.7914.35
8Boghiș33.849074.334.94
9Buziaș51.9585762.793.10
10Covasna64.7831,6116.777.38
11Geoagiu61.6511,7553.103.31
12Gura Humorului30.5767025.775.87
13Moneasa67.5474577.868.77
14Ocna Sibiului32.9513474.674.09
15Praid35.5121229.8910.56
16Sângeorz_Băi57.53357911.0814.01
17Slănic Moldova51.96708612.4511.45
18Sovata63.6228,6566.156.62
19Tășnad44.314412.943.65
20Slănic (Prahova)49.3356825.654.87
Disclaimer/Publisher’s Note: The statements, opinions and data contained in all publications are solely those of the individual author(s) and contributor(s) and not of MDPI and/or the editor(s). MDPI and/or the editor(s) disclaim responsibility for any injury to people or property resulting from any ideas, methods, instructions or products referred to in the content.

