Article

Bioaerosol Identification by Wide Particle Size Range Single Particle Mass Spectrometry

1
Institute of Mass Spectrometry and Atmospheric Environment, Jinan University, Guangzhou 510632, China
2
Guangdong Provincial Engineering Research Center for On-Line Source Apportionment System of Air Pollution, Guangzhou 510632, China
3
Guangzhou Institute of Geochemistry, Chinese Academy of Sciences, Guangzhou 510640, China
4
Systems Engineering Institute, AMS, PLA, Tianjin 300161, China
*
Author to whom correspondence should be addressed.
Atmosphere 2023, 14(6), 1017; https://doi.org/10.3390/atmos14061017
Submission received: 27 April 2023 / Revised: 1 June 2023 / Accepted: 8 June 2023 / Published: 13 June 2023
(This article belongs to the Special Issue Atmospheric Bioaerosols: Detection, Characterization and Modelling)

Abstract

:
The properties of bioaerosols are complex and diverse, and have a direct impact on the environment, climate, and human health. The effective identification of bioaerosols in the atmosphere is very significant with regard to accurately obtaining the atmospheric chemical characteristics of bioaerosols. To improve the detection of large particle bioaerosol and non-bioaerosol interference in the process of bioaerosol recognition, this study detected a variety of bioaerosols and abiotic aerosols based on a single particle aerosol mass spectrometer (SPAMS). Furthermore, the bioaerosol particle identification and classification algorithm based on Zawadowicz the ratio of phosphate to organic nitrogen is optimized to distinguish bioaerosols from abiotic aerosols. The influence of ionized laser energy on classification methods is thoroughly explored here. The results show that 15 kinds of pure fungal aerosols were detected by SPAMS based on a wide size range sampling system, and that fungal aerosols with a particle size of up to 10 μm can be detected. Through the mass spectra peak ratio method of PO3/PO2 and CNO/CN, when discriminating abiotic aerosols such as disruptive biomass combustion particles, automobile exhaust, and dust from pure bacterial aerosols, the discrimination degree is up to 97.7%. The optimized ratio detection method of phosphate to organic nitrogen has strong specificity, which can serve as the discriminant basis for identifying bioaerosols in SPAMS analytical processes.

1. Introduction

As a crucial component of atmospheric organic aerosols, bioaerosols participate in the weather and climate process as cloud condensation nuclei and ice nuclei [1]. Moreover, some aerosols are human allergens which pose a great threat to human health. At present, the importance of bioaerosols [2] has been fully recognized, so the detection of bioaerosols is particularly important [3]. Many offline techniques have been utilized to identify bioparticles, including cultures, immunological assays, and microscopy. These techniques require lengthy sampling periods and specialized handling and preservation techniques which can add measurement uncertainty and bias, limiting the in situ detection of bioaerosols [4].
Laser-excited fluorescence spectroscopy is widely employed to detect bioaerosols [5]. It has the advantage of a strong fluorescence signal, relative ease of operation, long-distance identification of bioaerosols and abiotic aerosols, and identification of single-molecule particle spectra. The fluorescent groups contained in bioaerosol particles are used for their detection in the fluorescence spectrometry method. However, since some inorganic minerals also fluoresce under ultraviolet light excitation, it is difficult to exclude the interference of abiotic fluorescent particles in the identification process [6]. For instance, polycyclic aromatic compounds or humic acids can have similar fluorescence properties [7] and cigarette smoke has similar fluorescence properties to bacteria [8]. In recent years, single-particle mass spectrometry detection technology of bioaerosols has been developing rapidly, which can obtain the particle size information and chemical composition of single particles in real-time online. Rapid single-cell chemical analysis can describe the mass spectral characteristics of individual Bacillus spores, based on mass spectrometry technique of bioaerosol mass spectrometry (BAMS), and has demonstrated the ability to distinguish between B. thuringiensis and B. atrophaeus [9]. A number of single particle mass spectrometry (SPMS) cell studies have noted signals at m/z +74, often accompanied by signals at m/z +59. However, single particle aerosol mass spectrometry (SPAMS) also has its shortcomings in identifying environmental bioaerosols [10]. As phosphorus and nitrogen are components of nucleic acids and cell membranes, there is a large number of phosphate ions (PO2, PO3, and PO4) and organic nitrogen ions (CN and CNO). Therefore, particles containing phosphate and organic nitrogen in the ambient air (such as biomass combustion products [11], fly ash, road dust [12], vehicle exhaust [13], and soil dust [14] often interfere with bioaerosols in the detection process. To improve the identification of bioaerosols, Zawadowicz et al. [15] used particle analysis by laser mass spectrometry (PALMS) to report a classification algorithm of spectral peak ratio based on PO3/PO2 and CN/CNO. When using particle analysis by laser mass spectrometry to identify the dust and combustion by-products from pollen and bacterial aerosols, the degree of confidence is up to 98%.
However, the particle size distribution of bioaerosols is generally 0.3–100 μm, while that of viruses is less than 0.3 μm [16]. The majority of (Gram-negative) bacteria stick to particles of >10 µm, while that of fungi is 1–30 μm, among which the particle size that can cause harm to the human body is generally between 0.4–10 μm [17]. For most of the existing SPAMS, the particle size analysis ability is about 0.1–3 μm; thus, the ability of SPAMS to detect fungi, spores, and other large particles is limited. Williams et al. [18] designed a 7-stage aerodynamic lens (A-lens) to improve the ability of an Aerodyne aerosol mass spectrometer (AMS) to detect biological particles. By optimizing the buffer cavity and increasing the sampling pressure of the lens, the transport efficiency of aerosol particles in the size range of 200–5000 nm can reach 100%, but that of 10 μm particles is only 22%. At the same time, Cahill et al. [19,20] tried to extend the application of the aerosol time-of-flight mass spectrometer (ATOFMS) to the study of single-cell metabolomics and constructed a 7-stage A-lens for the transmission of a single particle in the range of 4–10 μm and found that the transmission efficiency of 10 μm particles was less than 20%. To improve the ability of SPAMS to detect bioaerosols, a new sampling system (wide particle size range is 0.1–10 μm) is verified in the preliminary design. The particle theoretical transport efficiency can reach 100% in the particle size range of 0.15–10 μm [21].
In addition, direct identification of bioaerosols is challenging due to factors such as semi-quantitative analysis of SPMS and the details of instrument construction. At present, Raman spectra have also been shown to be effective in identifying biological particles. They are well suited to detecting and identifying closely related individual Bacillus cells with a probability of over 96% of correct identification at the species level [22]. However, the number of spectra measurable in a short time period by real-time Raman instruments is also limited because some particles can be charred or physically modified by higher laser intensities [23]. The mass spectral signatures from individual bacterial spores are affected by laser power, and the spore-to-spore variability may make it difficult to consistently distinguish closely related Bacillus species with an automated routine [24]. Cornwell et al. [25] proposed that the ion signals of dust and biological particles were very sensitive to ionization conditions and that total positive ion intensity was used to characterize the mass spectral relationship between different dust and biological particles. Through this method, environmental particles with both dust and characteristic biological spectra fingerprints were successfully excluded from the classification of biological particles.
In this work, we combined a wide-range sampling system, time-delay extraction technology and a four-channel signal acquisition system with single particle aerosol mass spectrometer, based on a high-performance single particle aerosol mass spectrometer (HP-SPAMS, hereinafter referred to as “SPAMS”), to detect bioaerosols. Furthermore, according to the Zawadowicz identification method based on the ion ratio of bioaerosol, characteristic peaks with machine learning are further optimized and verified, along with the distinction between SPAMS bioaerosols and “distractors”. Based on the widely used fluorescence technology to identify the presence of interference in the bioaerosol process, and biological characteristics of the mass spectral peak of the abiotic particles discussed in this study, the occurrence frequency above is 50% (Section 3.3). Thus, particles containing 26CN, 42CNO, 63PO2, and 79PO3 simultaneously in automobile exhaust, biomass combustion products, and road dust are defined as “distractors”. The effect of the hard ionization process of single particle mass spectrometry on the discrimination of the classification method is explored in detail. An attempt has been made to determine whether this method can be used as a discriminant basis for identifying bioaerosols in SPAMS source analysis or in other analyses.

2. Experiment

2.1. SPAMS

The constitution and working principles of SPAMS have been described in detail by Li et al. [26]. In short, a wide-particle-size-range, high-performance SPAMS mainly consists of four parts: a sampling system, diameter measuring system, ionization system, and mass spectrometry analysis system. Firstly, the aerosol particles enter the vacuum system through the injection critical pore (pore size is expanded from 0.11 μm to 0.22 μm). The separation cone is located 1.6 mm downstream of the critical hole, and the excess gas is extracted from the critical hole and the separation cone by the front pump. Under the accelerated action of the supersonic airflow after the hole, the particles are separated from the excess gas into the separation cone, and then into the buffer cavity. The speed of particles moving at high speed gradually decreases inside the buffer cavity and enters the downstream 7-stage aerodynamic lenses with the contraction of the air flow. The lens system composed of 7 groups of lens holes can effectively focus particles in a wide particle size range to the lens axis, and the final particles are accelerated again through the accelerating nozzle when they leave the lens outlet [21]. The collimating particle beam particles are successively passed through two parallel continuous caliper laser beams (Bioray 405 nm, Nd: YAG laser) with a distance of 6 cm. The speed and duration of each particle are then obtained. The flight speed of individual particles is used as the signal with which to excite a pulsed ionization laser (CenturionPlus 266 nm, Nd: YAG laser, ~8 ns pulse width, max 5 mJ pulse−1). The particles are ablated and ionized by pulsed laser in the ionization system, and the corresponding positive and negative ion fragments are generated. Under the action of electric field force, their signals are recorded by the bipolar time-of-flight mass spectrometer (Z-TOF), and the resolution of the time-of-flight mass spectrometer (2400 m/Δm for negative ions calculated by the half-peak width method) is improved by the double-exponential pulse delayed extraction technology [27]. A four-channel superimposed signal acquisition system [28] improves the sensitivity and dynamic range of the instrument detection (4 mV–20 V).
In order to ensure the accuracy of particle size and spectral detection, particle size and mass spectrum are calibrated, respectively. Standard Polystyrene latex microspheres (PSLs) of different sizes were used for particle size calibration. The calibration curves of 0.12 μm, 0.20 μm, 0.51 μm, 0.74 μm, 1.31 μm, 2.50 μm, 3.00 μm, 5.40 μm, 8.00 μm, and 10.00 μm were measured successively, and the calibration coefficient R2 > 0.99 were obtained. Mass spectrum calibration uses reference material aerosol (PbNO3, NaI) containing known metal ions to calibrate the mass spectrum drift of the instrument. The particle size range of HP-SPAMS is 0.15–10.0 μm, and the maximum measurement range of mass spectrometry is 600 Da (±300).
The performance of the new wide-particle-size-range, high-performance SPAMS configuration is presented for the first time in the context of bioaerosol detection. As the core part of the SPAMS, the sampling system consists of five modules: pre-focusing lenses, virtual impact concentrator, buffer cavity, 7-stage aerodynamic lenses and acceleration nozzle. Figure 1 shows the detailed dimensional parameters of each module. The complete design principle and simulation process has been described by other core personnel in the form of an article [29]. At these high-vacuum aerodynamic diameters, the laser hit rate is related to the shape of the bacteria itself and the injection concentration, as shown in the following Table 1.

2.2. Sample Standards

The 10 strains of bacteria and 5 strains of fungi determined in this study are standard strains provided by Guangdong Provincial microbial culture Preservation Center. In order to ensure the representativeness and universality of the samples, the 15 strains included bacteria, mold, and yeast. The bacteria included both Gram-positive and Gram-negative bacteria, and included common shapes such as balls and rods. The results of this study can be directly compared with the 15 strains studied in most single-particle aerosol mass spectrometry. The specific names are shown in Table 1. Biological aerosol distractors often found in the real environment, such as road dust, vehicle exhaust, and biomass combustion products (wheat stalk, corn stalk, and oblate leaf stalk), were selected as the research objects. The specific names are shown in Table 2.
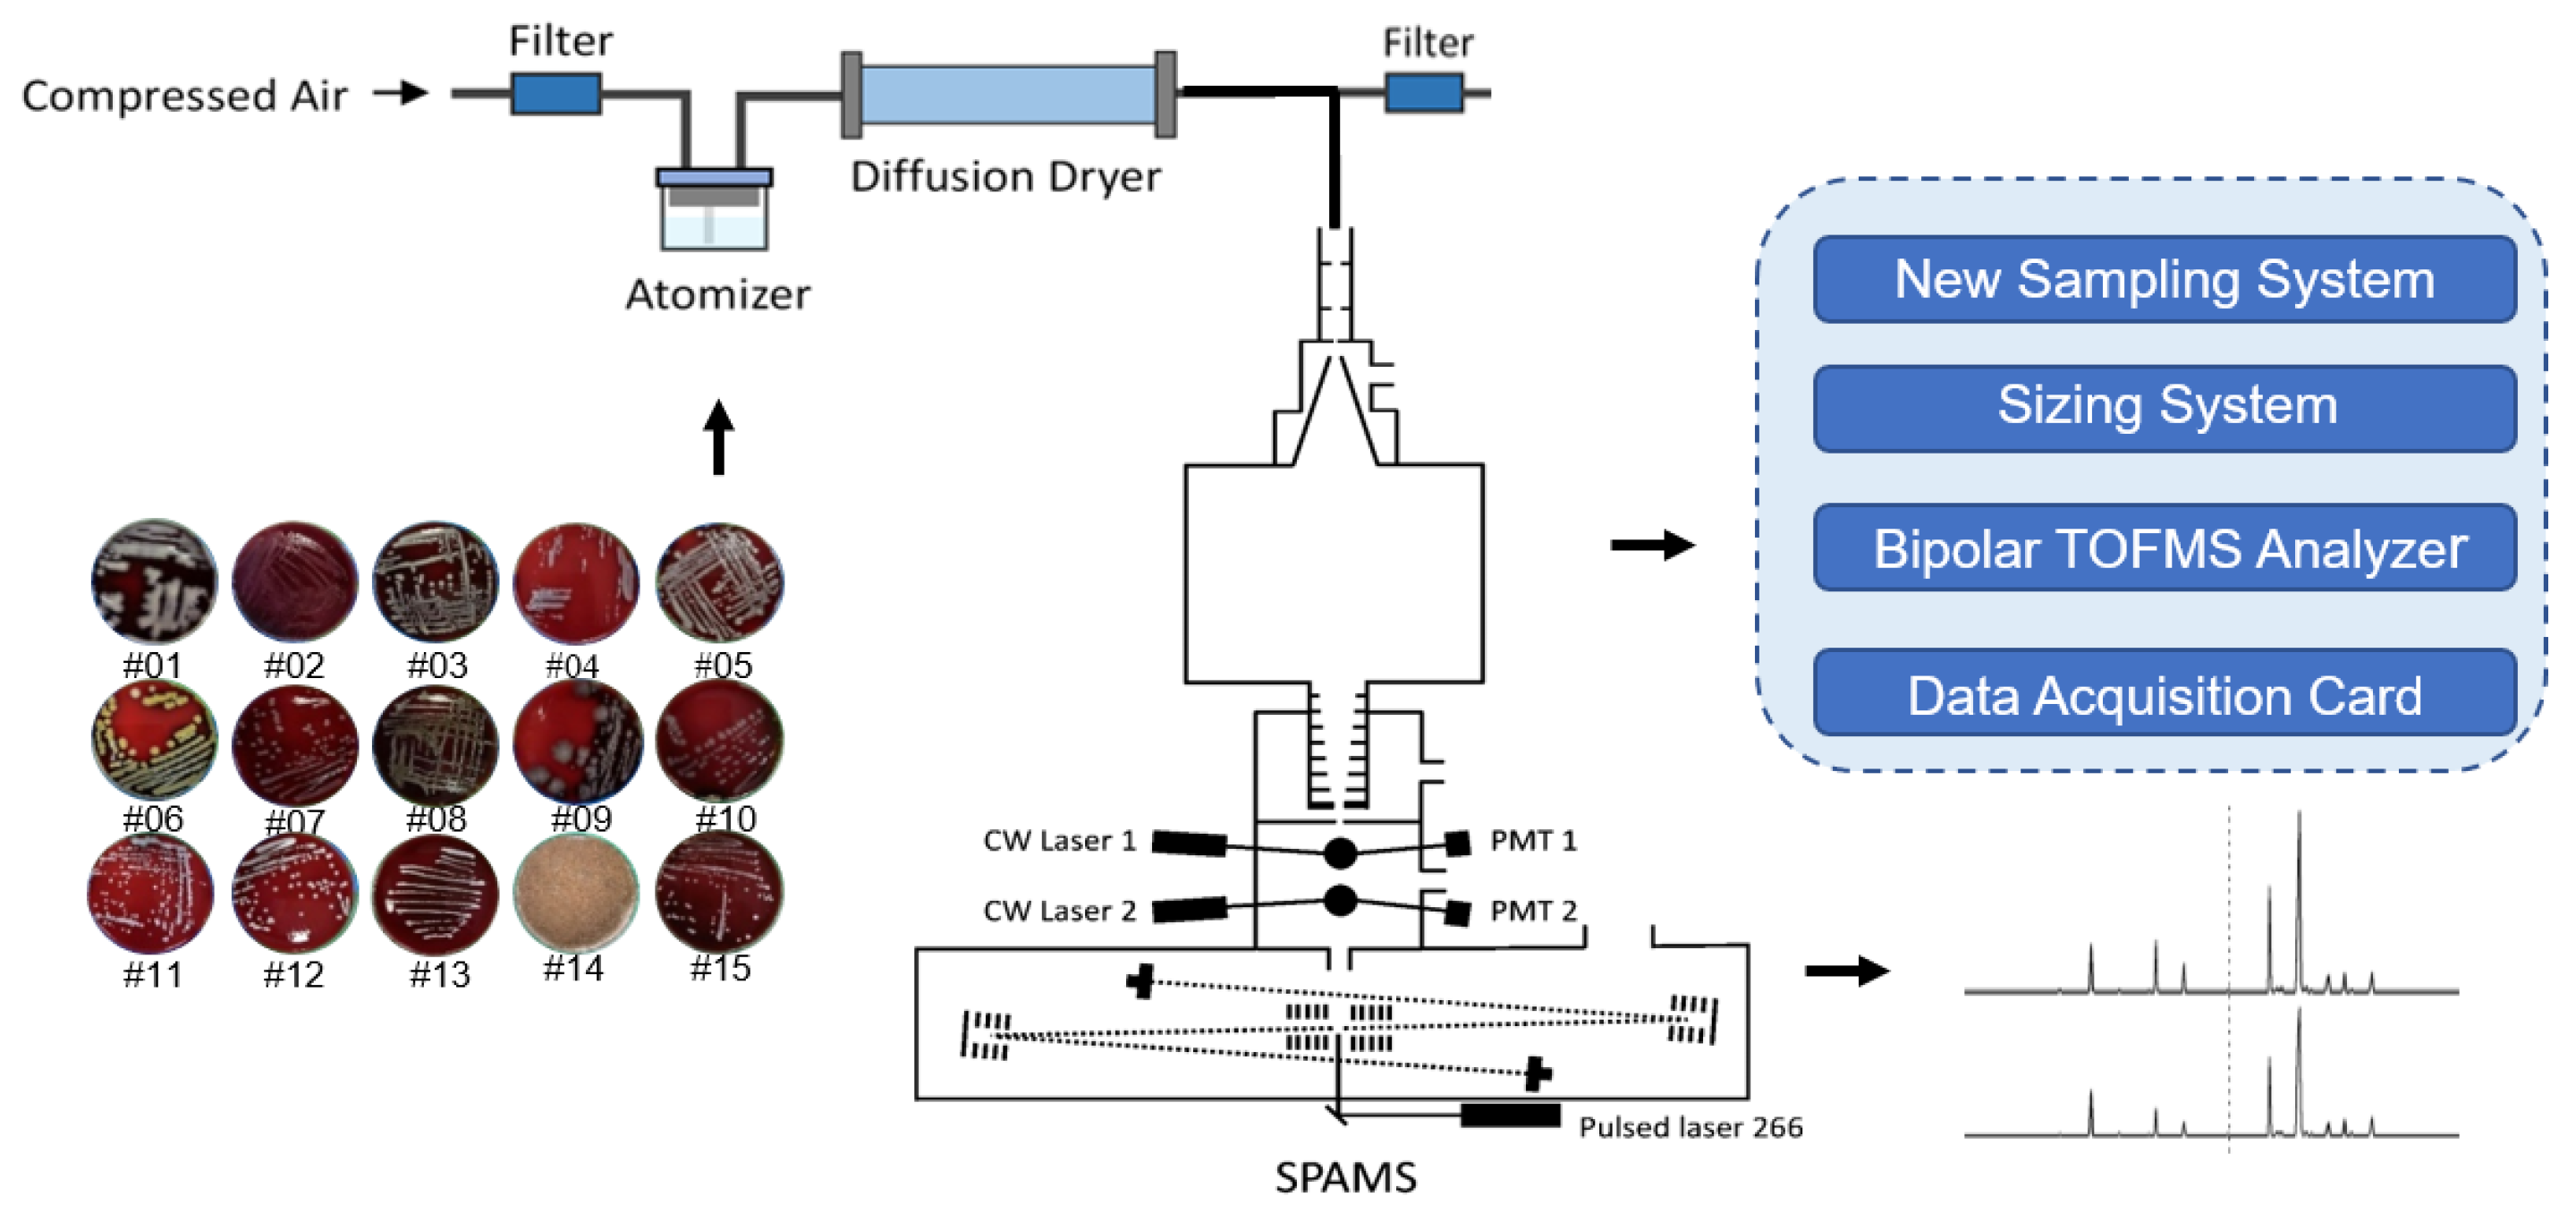
The preparation steps of the strain sample solution are as follows. (1) Thawing: first, the strains refrigerated at −80℃ are taken out, thawed at room temperature for 1–2 h, and vortexed using an oscillator to shake the centrifugation tube of the strain sample evenly. (2) Inoculation: on a clean laboratory table, the strain solution adhered to the disposable sterilized inoculating loop, and streak inoculation on the blood agar plate medium is performed. (3) Cultivation: the streaking bacterial medium is placed horizontally in a 37 °C constant temperature incubator for 18–24 h, and the fungal medium is placed horizontally in a 25 °C constant temperature incubator for 36–48 h. (4) Sampling: the growth of the samples of 15 strains after the culture is shown in Figure 2. The colonies on the surface of the blood agar are slightly scraped with a disposable sterilized inoculating loop, dissolved with 1 mL deionized water in the centrifuge tube, and shaken well. (5) Dilution with water-soluble salt: the bacterial sample aqueous solution is centrifuged for 3 min at the rotation speed of 3000–5000 rpm. After centrifugation, the sample is precipitated at the bottom of the centrifuge tube and the aqueous solution is removed. Then, 1 mL of deionized water is added to dissolve the precipitate, followed by thorough shaking. Step 5 was repeated 3 times.
The main components of blood agar plate medium used in this experiment are peptone, beef powder, sodium chloride, defiber sheep’s blood, agar and deionized water. Blood plate medium is rich in nutrients, which can satisfy the growth requirements of strains and facilitate the separation of samples. All media are autoclaved prior to use. Scrape only the upper layer of the culture medium surface to avoid small contaminants of the culture medium itself. Repeated rinsing with deionized water removes excess salt. It should be stressed that no additional fixatives or epoxies are added to the cells before analysis, reducing complications in the interpretation of the mass spectra.

2.3. TEST Methods

The prepared pure bacterial sample solution is mixed with 20 mL of deionized water and atomized using a single nozzle aerosol generator (TSI Inc., Model 9302, pressure is 80 kPa) to obtain the aerosol particles of the samples. The atomized sample aerosol is connected to a silica gel drying tube, whose outlet is connected to the SPAMS inlet and an exhaust port with a high-efficiency particulate air filter. When sampling, 1000 effectively ionized particle size, and spectrum data are stored in each sample. The experimental design of SPAMS is shown in Figure 2.
There is no guarantee that all the particles tested will be single cells. We only performed further data analysis on single particle cells. Single particle aerosol mass spectrometry is a technique in which the particle size is obtained by converting the velocity of particles measured by double-beam diameters to the calibration curve measured by standard monodisperse PSLs pellets. In the course of the experiment, by strictly controlling the injection concentration of bioaerosol to 80 ± 10 per second, the phenomenon of “particle catch-up” caused by excessive aerosol concentration was excluded. Additionally, the best way to ensure the existence of single-cell particles is to generate bioaerosol through nebulizer, but we cannot guarantee that all single-cell particles are detected. We compared the size distributions of the bioaerosols detected by SPAMS with those obtained by electron microscopy. SPAMS, like all single particle mass spectrometers have size-dependent counting biases in the range of 10% compared with electron microscopic measurements (for example E. coli). The detection of a very small number of clumps will not affect the analysis of mass spectrometric characteristics. We show that the particle size is only the measurement result of the single-particle aerosol mass spectrometer (Section 3.1).

3. Results and Conclusions

3.1. Distribution of Bioaerosol Particle Size

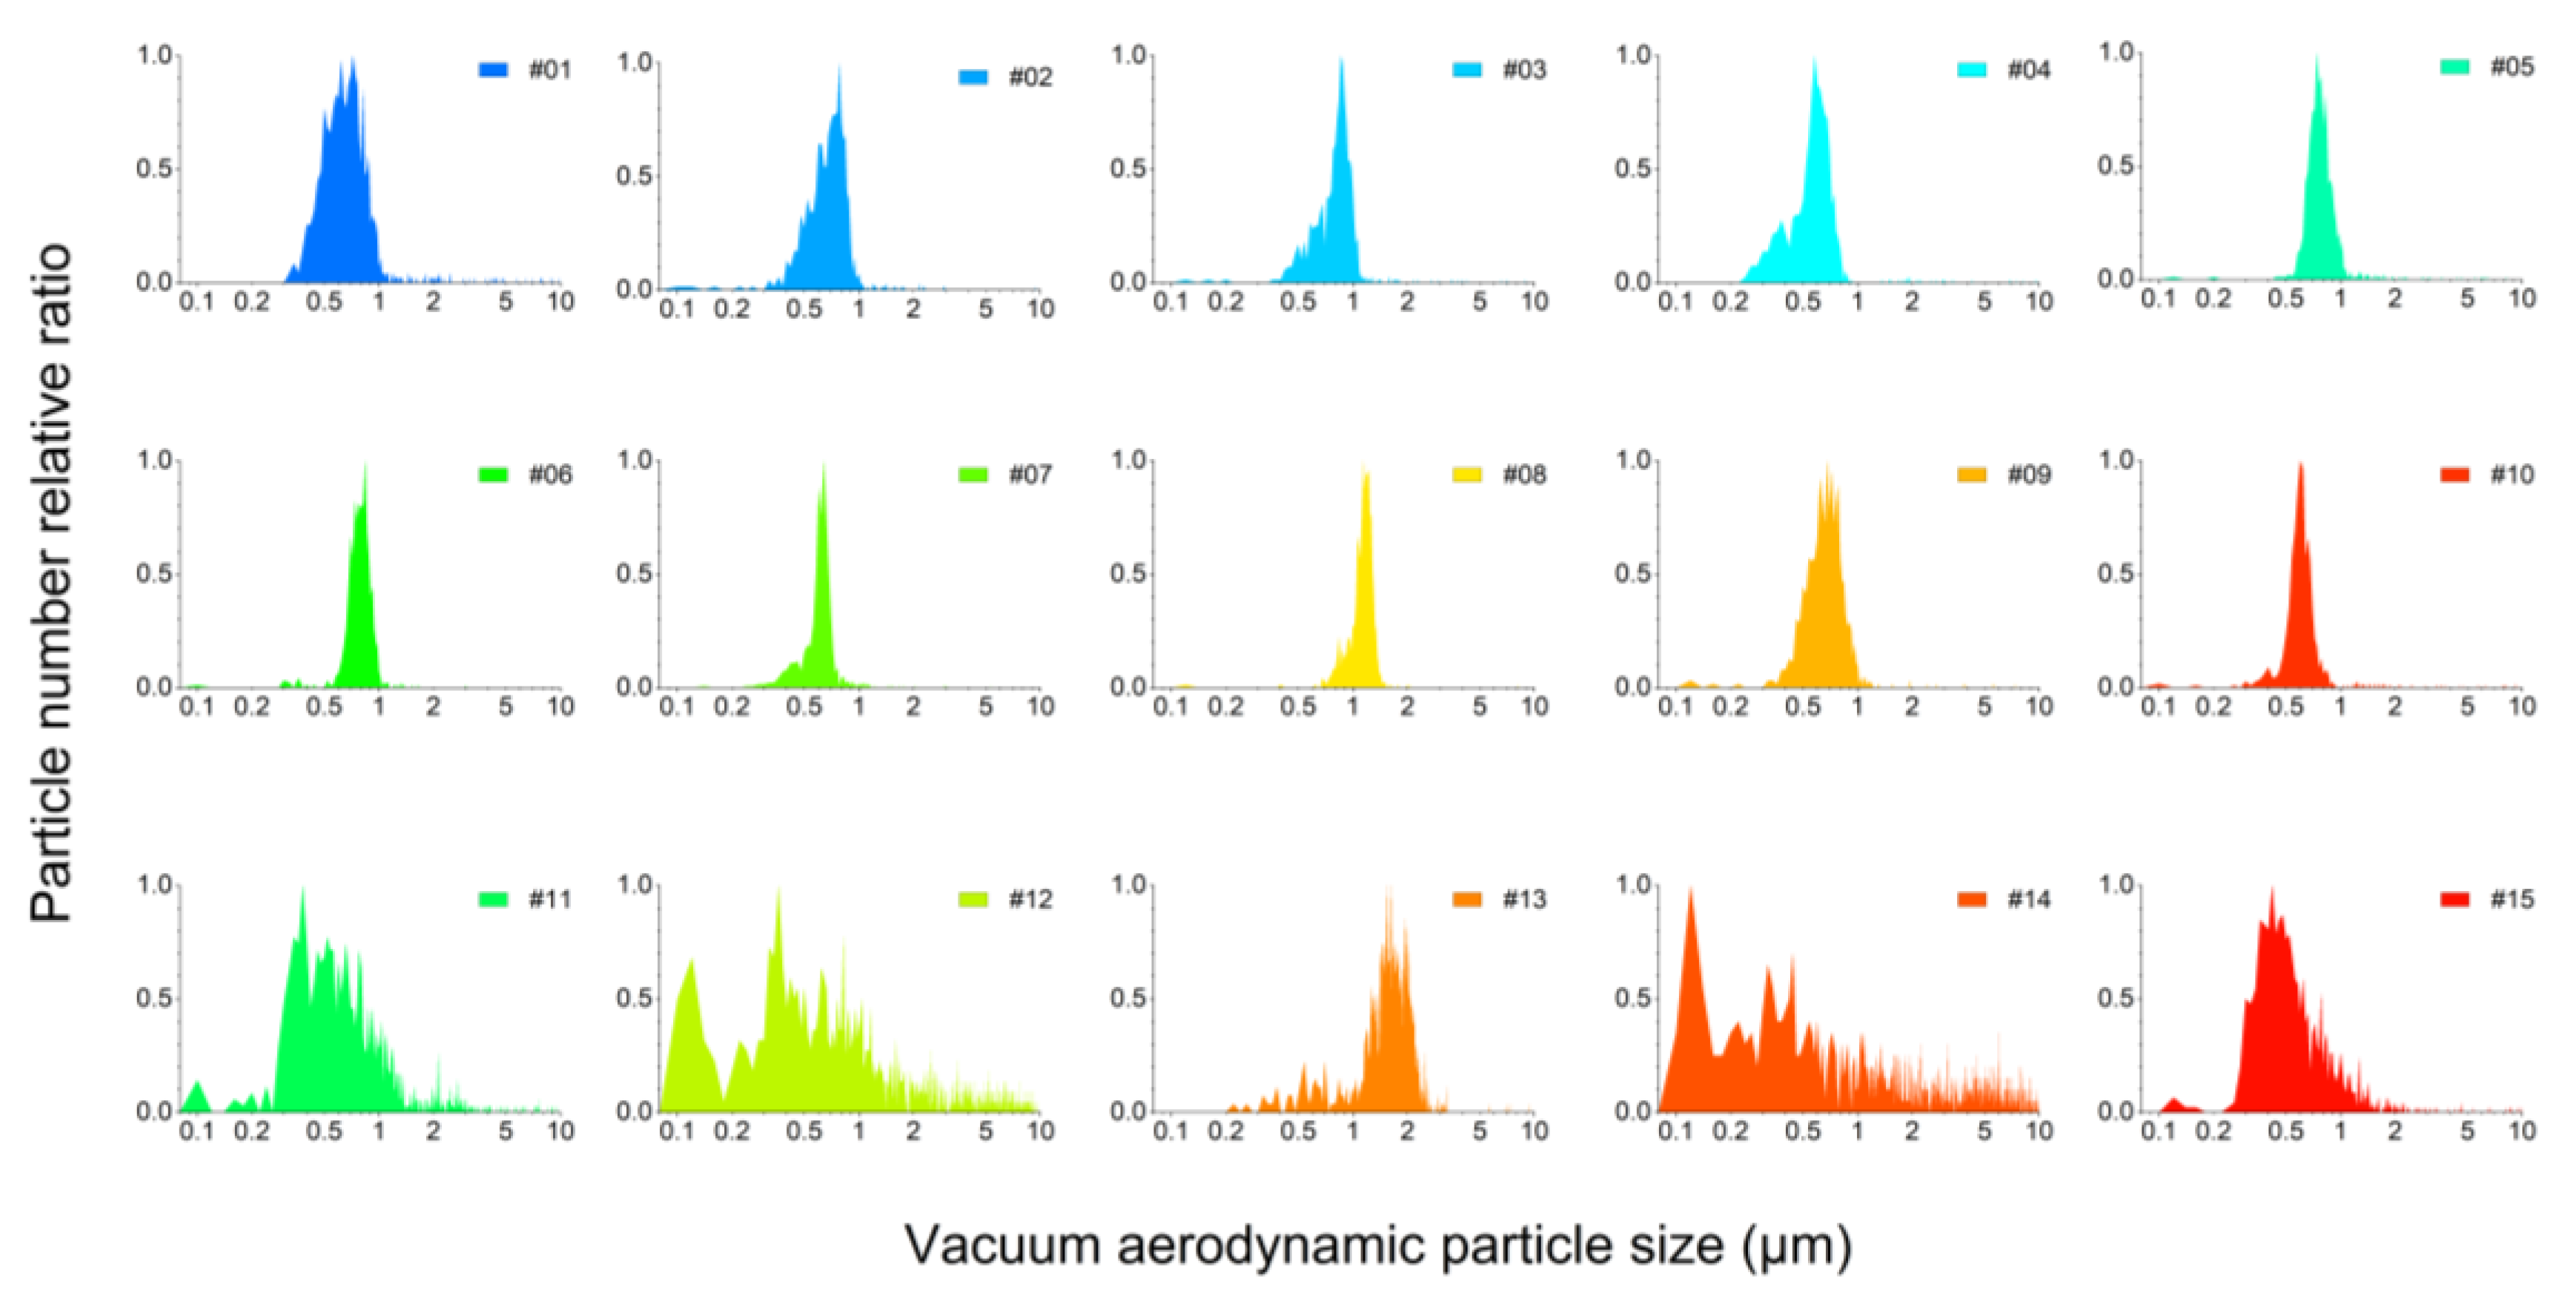
The vacuum aerodynamic particle size distribution of the bacterial and fungal particles is shown in Figure 3. The numbers in Figure 3 correspond to those in Table 1. Items #1 to #10 are bacteria samples and #11 to #15 are fungi samples. Preliminary experimental results show that the overall particle size of bacteria, as detected by SPAMS, was relatively small, except for #08, Enterococcus faecium. The overall particle size distribution of bacteria is mainly within the range of 0.3–1 μm, thus showing an approximately normal distribution. Jung and Lee [31] used scanning electron microscopy to observe Escherichia coli and Bacillus subtilis cells at room temperature, both bacteria with a diameter in the range of 0.5–0.7 μm and a length in the range of 1.1–1.6 μm. Fungi samples (#11–#15) obtained from pure strain cultures had a much larger proportion of particle size distribution above 1 μm than bacteria, and the particle size distribution of three fungi, Candida albicans, Candida glabrata, and Saccharomyces cerevisiae was around 0.5–2 μm. Sample #13, C. glabrata, is concentrated in the range of 1–2.5 μm. Compared with other samples, the samples, #11 C. albicans and #12 Candida tropicalis, are similar to samples #14, Aspergillus brasiliensis, and #15, S. cerevisiae, in terms of particle size distributions, while the particle size distribution of samples #11 and #15 was mainly in the range of 0.25–1.5 μm and the peak was around 0.4 μm. It is worth noting that the particle size of C. tropicalis and A. brasiliensis were evenly distributed between 0.1 μm and 10 μm. Li et al. [32] used transmission electron microscopy and scanning electron microscopy to investigate primary biological aerosol particles (PBAPs) collected from boreal coniferous forests in the Xiao Hinggan Mountains of China in summer, and speculated that the size of rod PBAPs is distributed at 1.4 μm and 3.5 μm and that the two typical peaks are bacterial and fungal particles, respectively.
Due to the low transmission efficiency of the aerodynamic lens for large particles and the tendency of large particles to produce inertial impinging wall loss in the process of air transport, especially large particles above 1 μm, the detected particle size distribution is smaller than the real one. Therefore, for the first time, a high-performance SPAMS has been used to measure 10 μm coarse particulate matter under the improvement of the sampling system. However, the particle size distribution of the biological particles mentioned above was detected by SPAMS, rather than an absolute size distribution of the aerosol samples.

3.2. Characteristic Spectrum of Bioaerosols

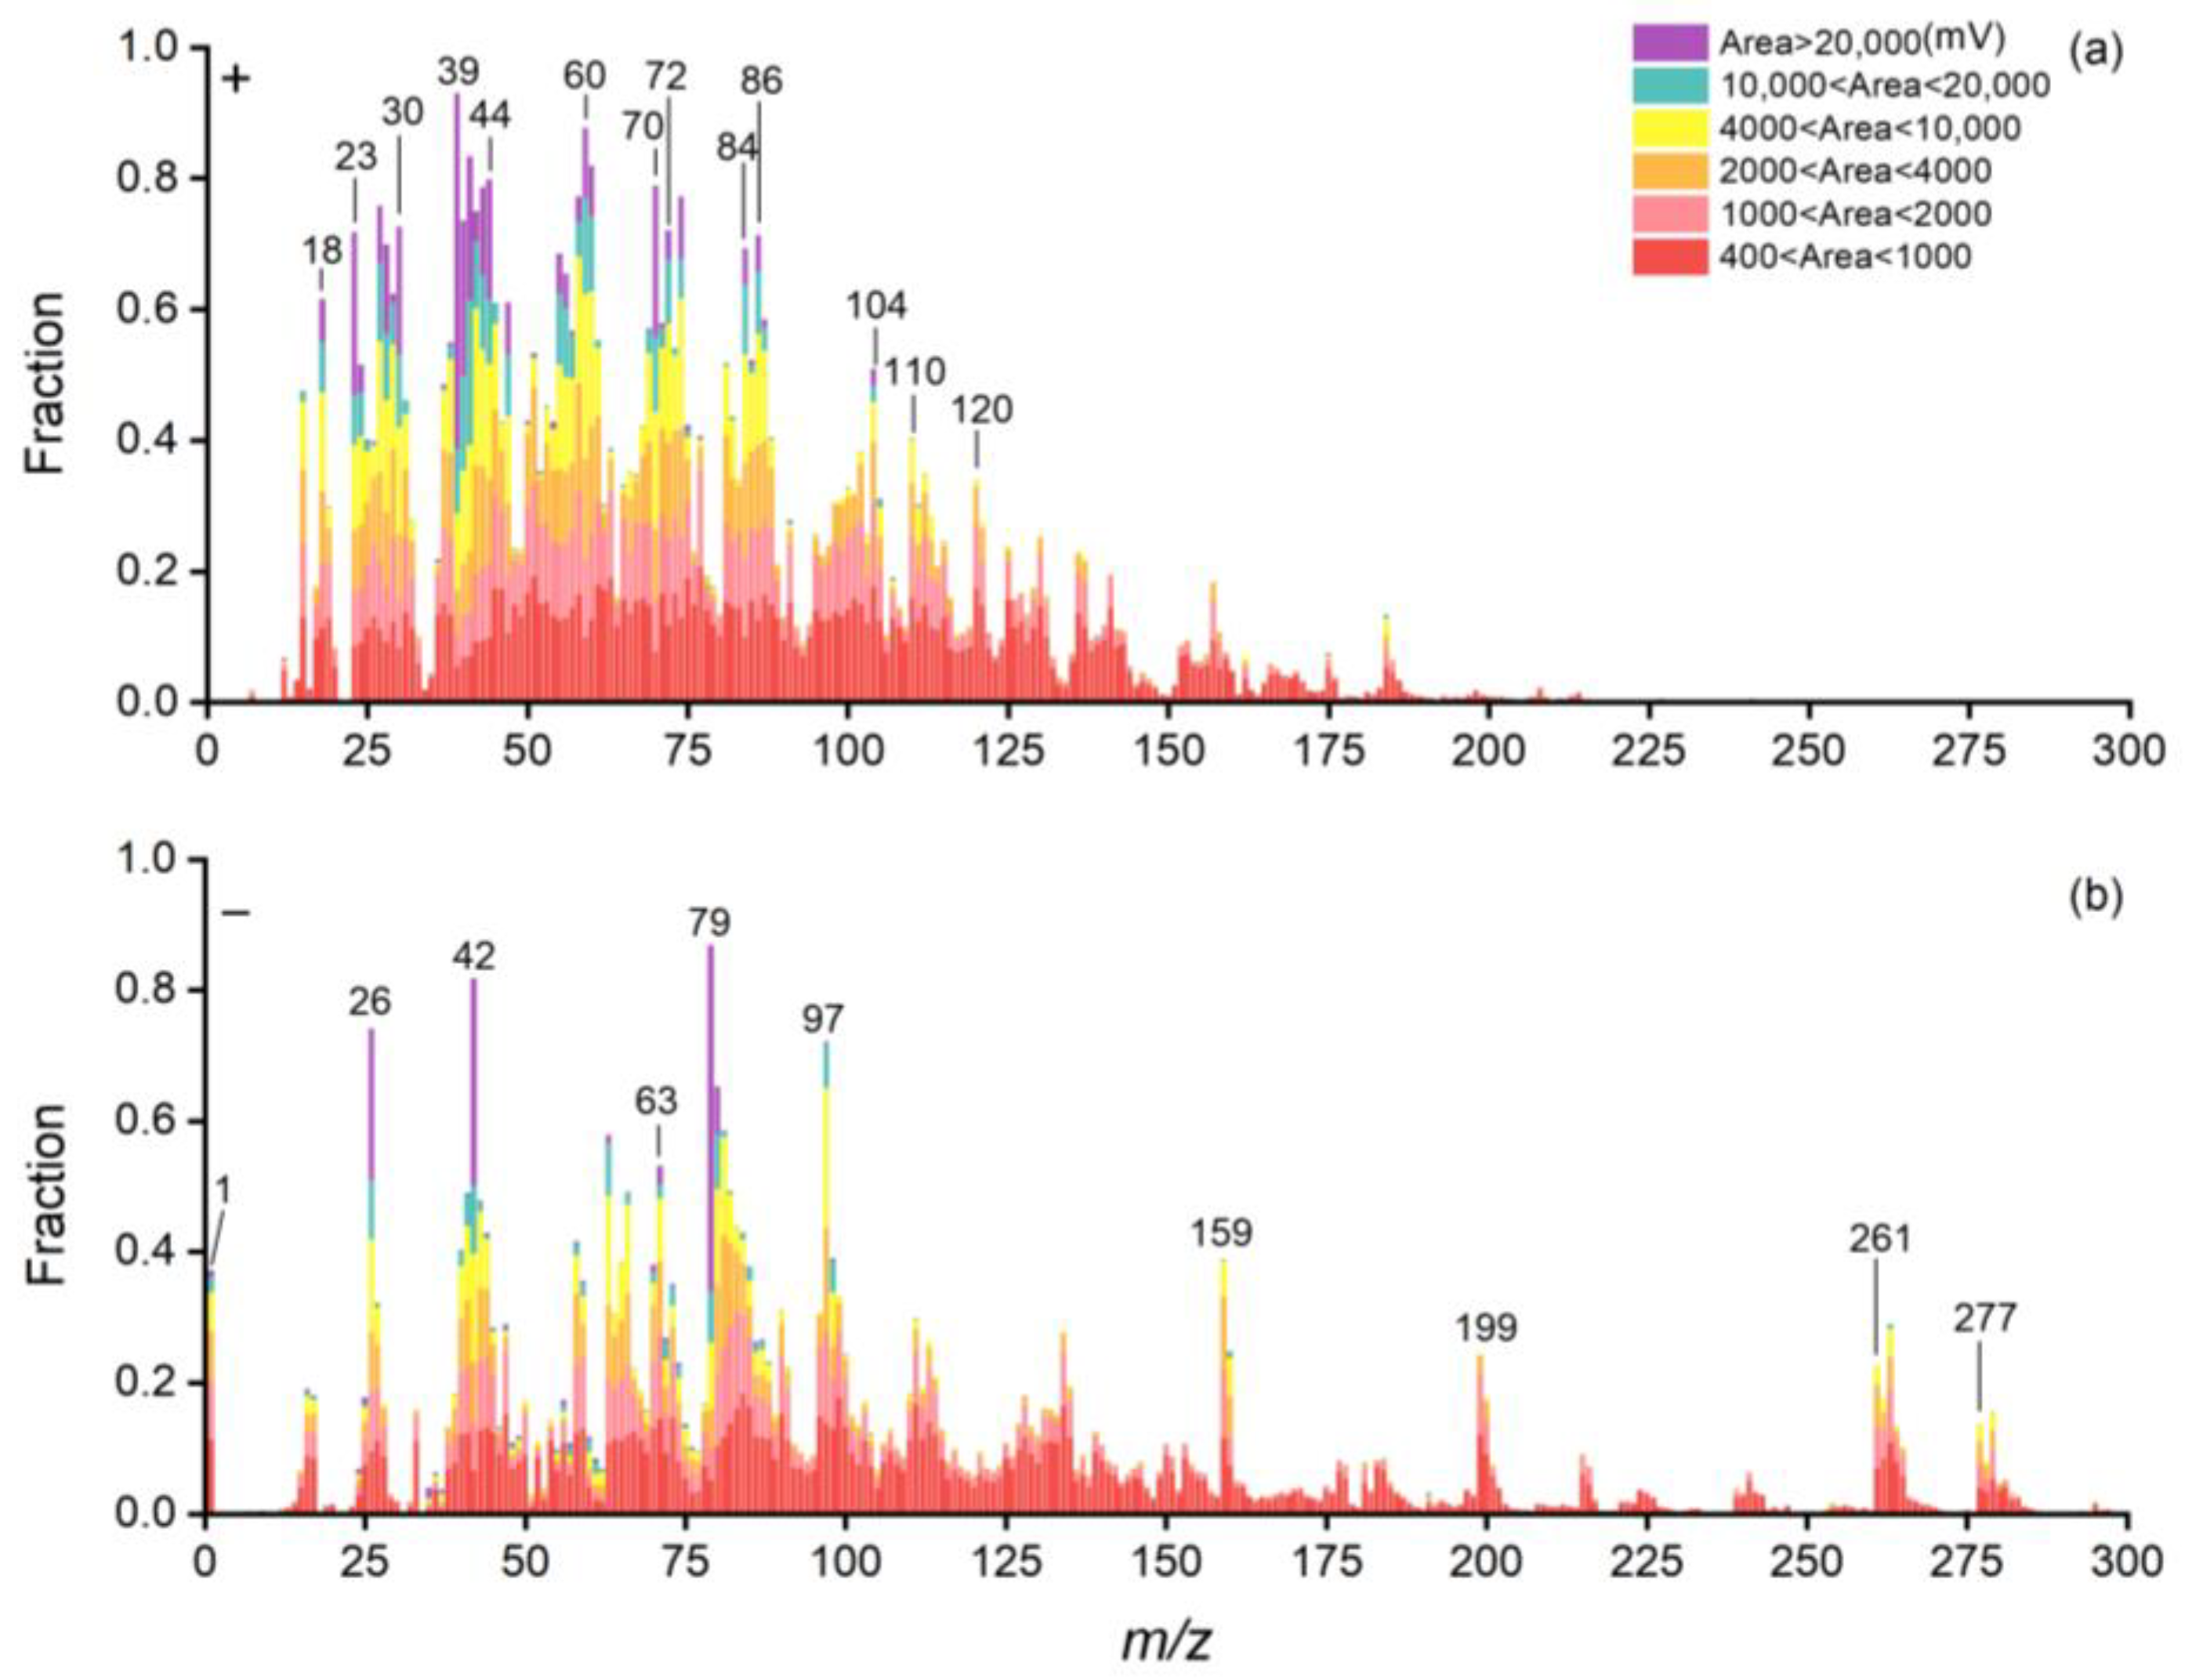
The high-performance SPAMS detected the mass spectra of 15 pure strains as shown in Figure 4. Figure 4 shows the stacked mass spectrograms of 14,119 biological single particles with a mass number of −300~300 Da ion peaks. Each color represents the ratio of the peak area signal strength of each ion to the peak area signal strength of each ion generated by the total biological particle. It can be more intuitively shown that the peak area signals of ions with a mass spectrum peak intensity greater than 104 Da are all less than 10 V, and the peak area signals of ions with −26, −42 and −79 Da at 20 V account for nearly half of the total signal intensity. In addition to 23Na+ and 39K+ metal ion peaks, there are also a large number of amino acid decarboxylic ion peaks in the positive spectrum. The positive ion peaks were mainly 30[Glycine-COOH]+, 59[C3NH9]+, 70[Proline-COOH]+, 72[Valine-COOH]+, 74[Threonine-COOH]+, 84[C5NH10]+, 86[Leucine-COOH]+, 110[Histidine-COOH]+, and 120[Phenylalanine-COOH]+. The negative ionic peaks are mainly organic nitrogen 26CN, 42CNO, phosphate 63PO2,79PO3, 97H2PO4, 159H(PO3)2, 199NaH2P2O7, and other common biological ionic peaks. Czerwieniec et al. [33] found similar peaks when detecting vegetative cells of Bacillus atrophaeus with BAMS, and speculated that +30, +70, +72, +74, +86, +110, and +120 are decarboxylic ionic peaks of amino acids. Srivastava et al. [34] speculated that +59, +81, +84, and +88 ionic peaks are organic fragments containing nitrogen. Zeng et al. [35] used SPAMS to detect 13 strains of bacteria, to obtain similar bioaerosol characteristic ions; however, there are fewer characteristic peaks in the negative mass spectrum, and no negative ions with a mass charge ratio greater than 200 are detected, and the overall ionic peak signal was weak.
Compared with the detection results of SPAMS [35], more abundant ion characteristics are obtained by high-performance SPAMS. On the original basis, the decarboxylic ionic peaks of serine and alanine 44 alanine-COOH+, and 60 serine-COOH+ with strong signal strength are supplemented. Czerwieniec et al. (2005) believed that m/z −277 was Na2H(PO3)2(PO4), −261 and −277 are first obtained by high-performance SPAMS detection of bioaerosols. The negative ion peaks, 261NaH(PO3)3 and 277NaH(PO3)2(PO4) with a mass charge ratio greater than 250 are speculated and added. Exponential pulse delayed extraction technology [36] not only solves the hit rate and resolution problems of SPMS but also improves the ion signal intensity by multiple times, thereby providing conditions for obtaining the complete mass spectrum characteristics of bioaerosols. More characteristic peaks can make it easier to distinguish whether or not a single particle is a bioaerosol.

3.3. Bioaerosol Identification Based on Characteristic Peak Ratio

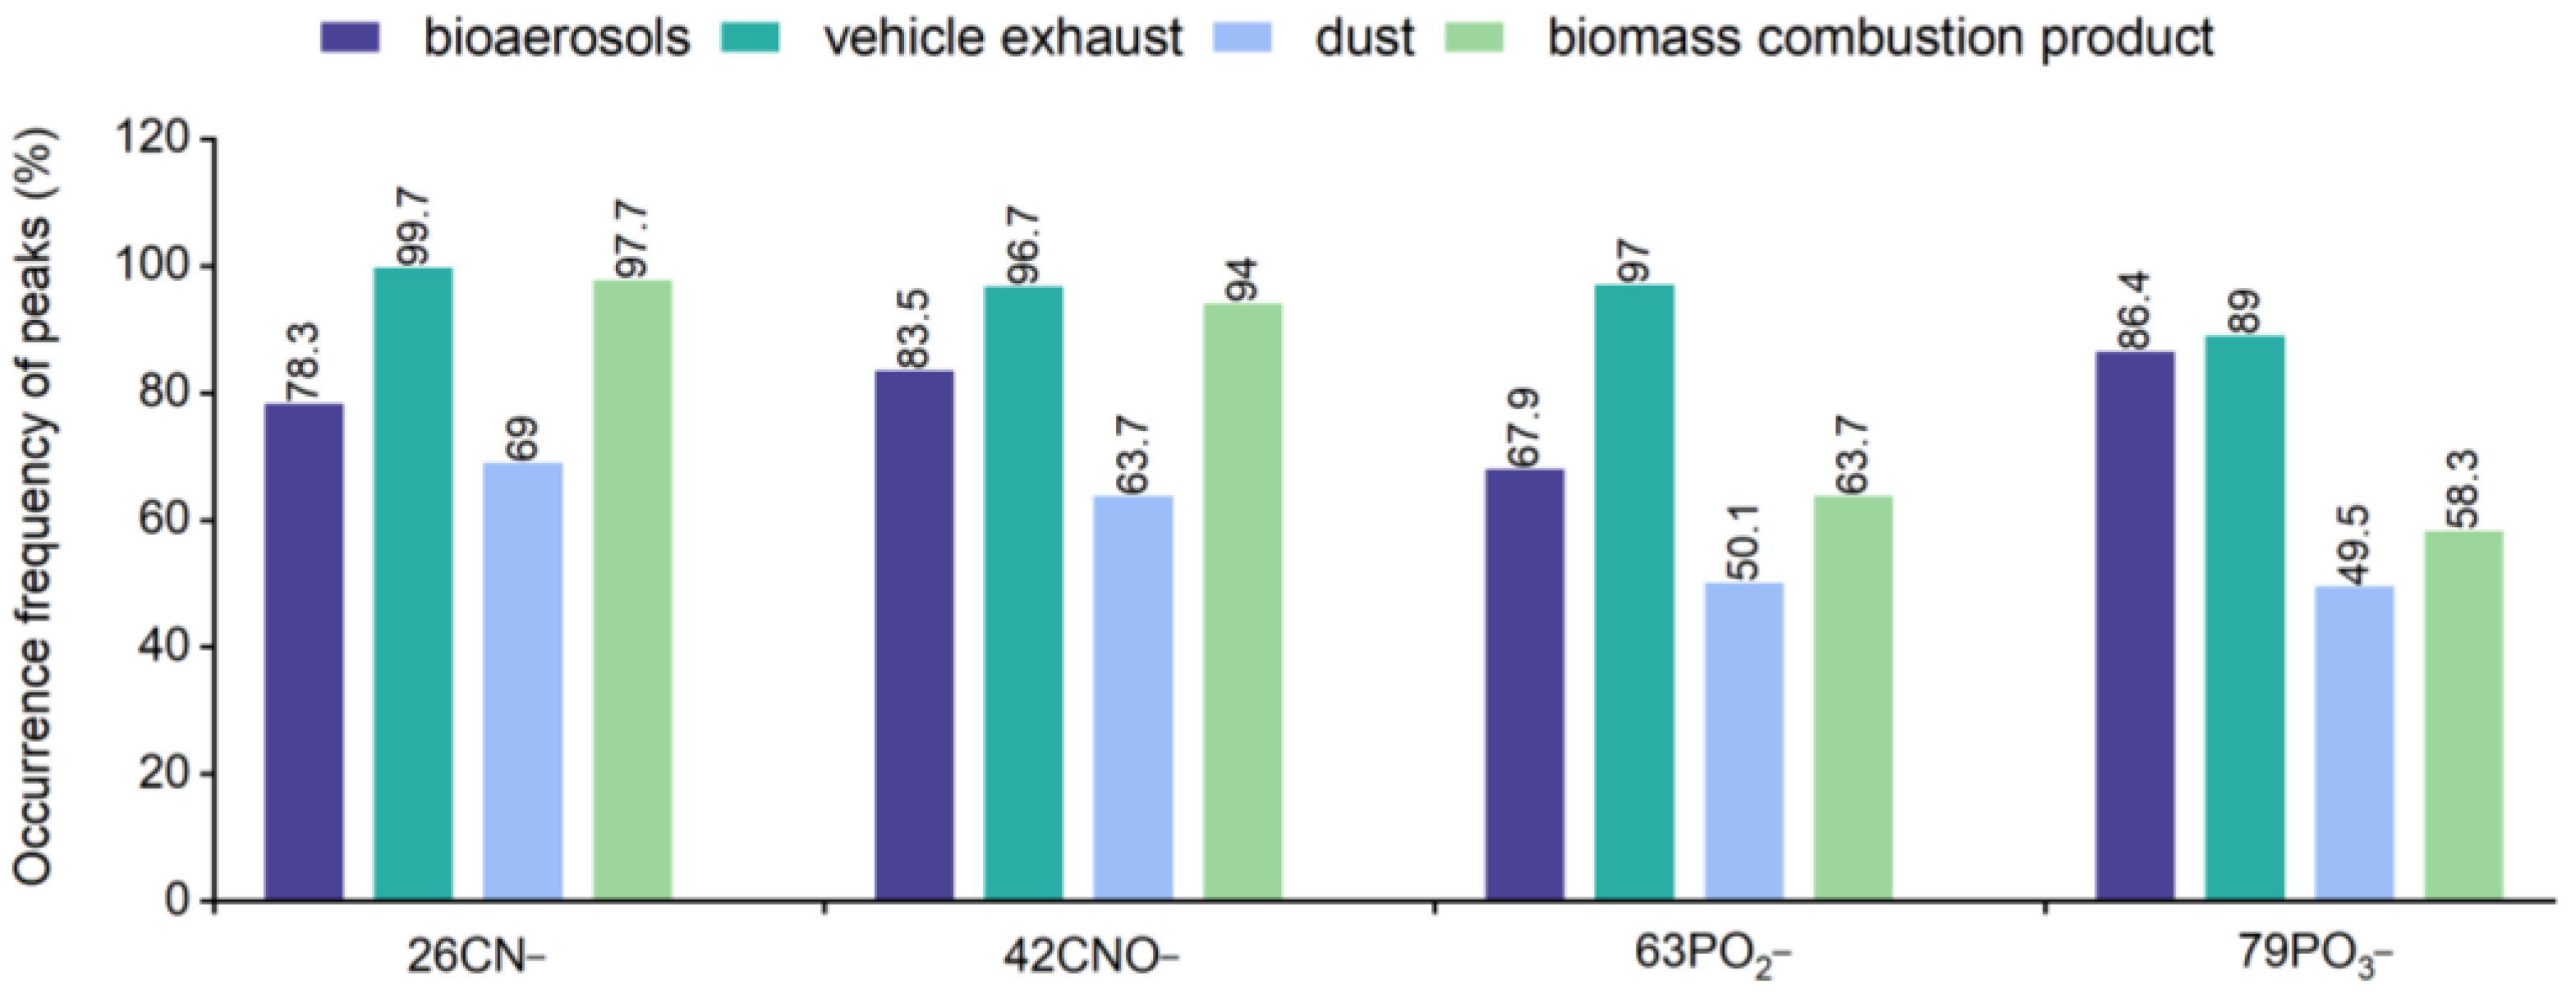
In the actual environment, many inorganic particles contain bioaerosol characteristic ion phosphate and organic nitrogen peaks. Organic nitrogen and phosphate ionic peaks with strong signals also appear in biomass combustion products, vehicle exhaust, and road dust measured by SPAMS, as shown in Figure 5. Therefore, when using phosphate and organic nitrogen ionic peaks to identify bioaerosols in the environment, at least 89% of vehicle exhaust, 49.5% of dust, and 58.3% of biomass combustion products have interference, which cannot be directly used as a sufficient condition to distinguish bioaerosols. Zawadowicz proposed that 26CN, 42CNO, 63PO2, and 79PO3 could be used as characteristic peaks of bioaerosol discrimination to distinguish bioaerosols from abiotic aerosols in a larger proportion.
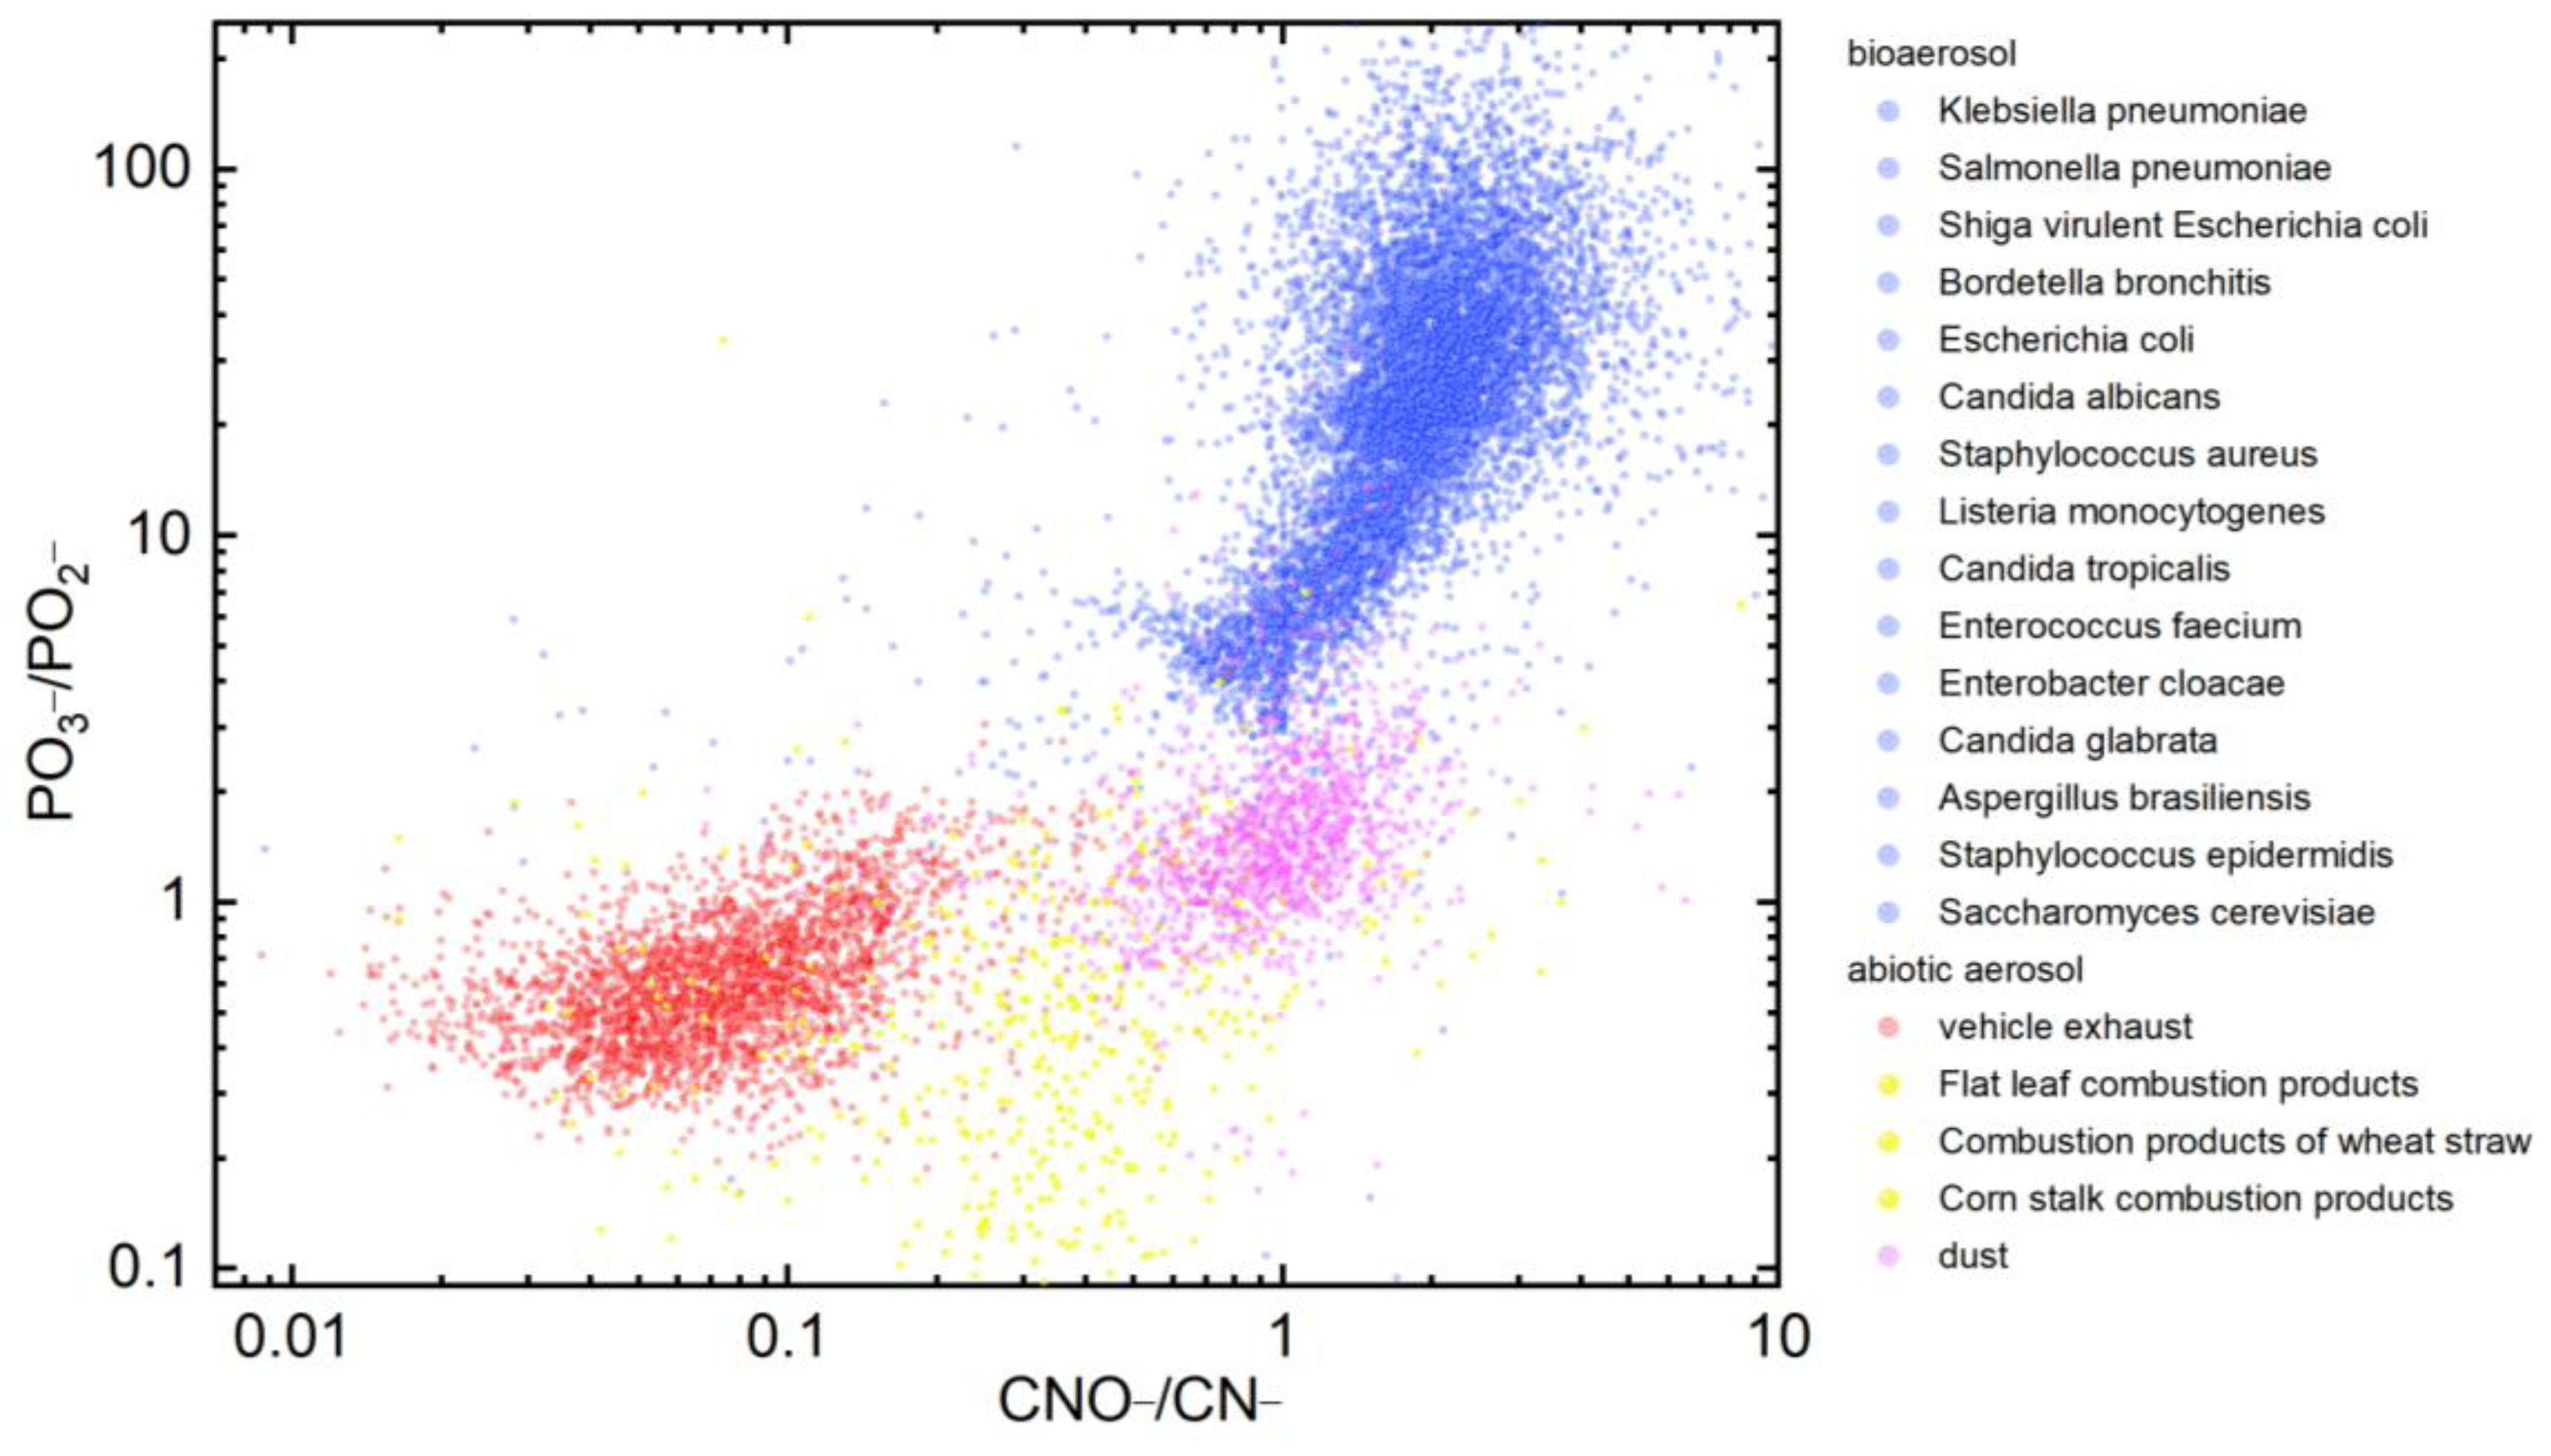
Data classification based on SPAMS, which is the peak height ratio of the mass spectra peak of PO3/PO2 and CNO/CN, is used to distinguish bioaerosols from their disruptors. The scatter distribution of PO3/PO2 and CNO/CN is obtained by capturing the corresponding ionic peak height. As shown in Figure 6, the distribution of bioaerosols is significantly different to that of biomass combustion products, vehicle exhaust, and dust. Moreover, it is concentrated in a certain range of values. Bioaerosols were classified as one class, while aerosols produced by vehicle exhaust, dust, and biomass combustion products are classified as another class. The bioaerosols, PO3/PO2 and CNO/CN, measured by SPAMS are concentrated at (~3–200) and (~0.7–7), respectively, while abiotic aerosols are concentrated at (~0.2–3) and (~0.02–2). Furthermore, using the support vector machine (SVM), a supervised machine learning algorithm, the discrimination degree between bioaerosols and abiotic aerosols is up to 97.7%.
The data analysis in this case is based on the Computational Continuation Core (COCO, V1.3), cubic SVM algorithm is implemented based on the Statistics and Machine Learning Toolbox (Statistics and Machine Learning Toolbox 11.2) in MATLAB 2017b (Classification Learner), where PCA is 95% confidence interval. This trains models to classify data using supervised machine learning. A random 30% dataset was used as the training set, and the empirically determined nonlinear kernel functions can provide the best performance in this case. All particles with four characteristic ion peaks were analyzed.
The discrimination degree of 97.7% indicates that SPAMS has a strong detective capability to identify the phosphate and organic nitrogen ratio between bioaerosols and abiotic aerosols. It is possible to use it as the discriminant basis for identifying bioaerosols in the SPAMS source analysis or other analyses. Compared with the traditional characteristic ion markers method via life characteristic elements, such as nitrogen and phosphorus, this method has a higher discrimination degree.
The premise of this classification method is that there are four characteristic peaks. However, the actual research has shown that when the threshold of the effective peak is set high, part of the weak signal peaks would be filtered out; however, when the threshold is set low, there is noise interference in the collected signals. Through a series of equivalent gradient threshold settings, the effective peak threshold of 10 mV is determined. The average frequency of the characteristic peaks in the bacterial aerosols is generally higher than that of the fungal aerosols, as shown in Table 3. At least 82.9% of bacterial aerosols and 52.8% of fungal aerosols could be effectively discriminated against. The discrimination method based on the characteristic peak ratio has higher identification rate for bacterial aerosols than fungal aerosols. Bacteria are mainly coccus, bacillus, and spiral, while fungi are mainly subcellular and multicellular. In addition, fungi have nuclei. Due to the difference in morphology and structure between fungi and bacteria, bacterial aerosols are more easily ionized to produce effective mass spectra peaks in the detection process.

3.4. Influence Analysis of Laser Energy

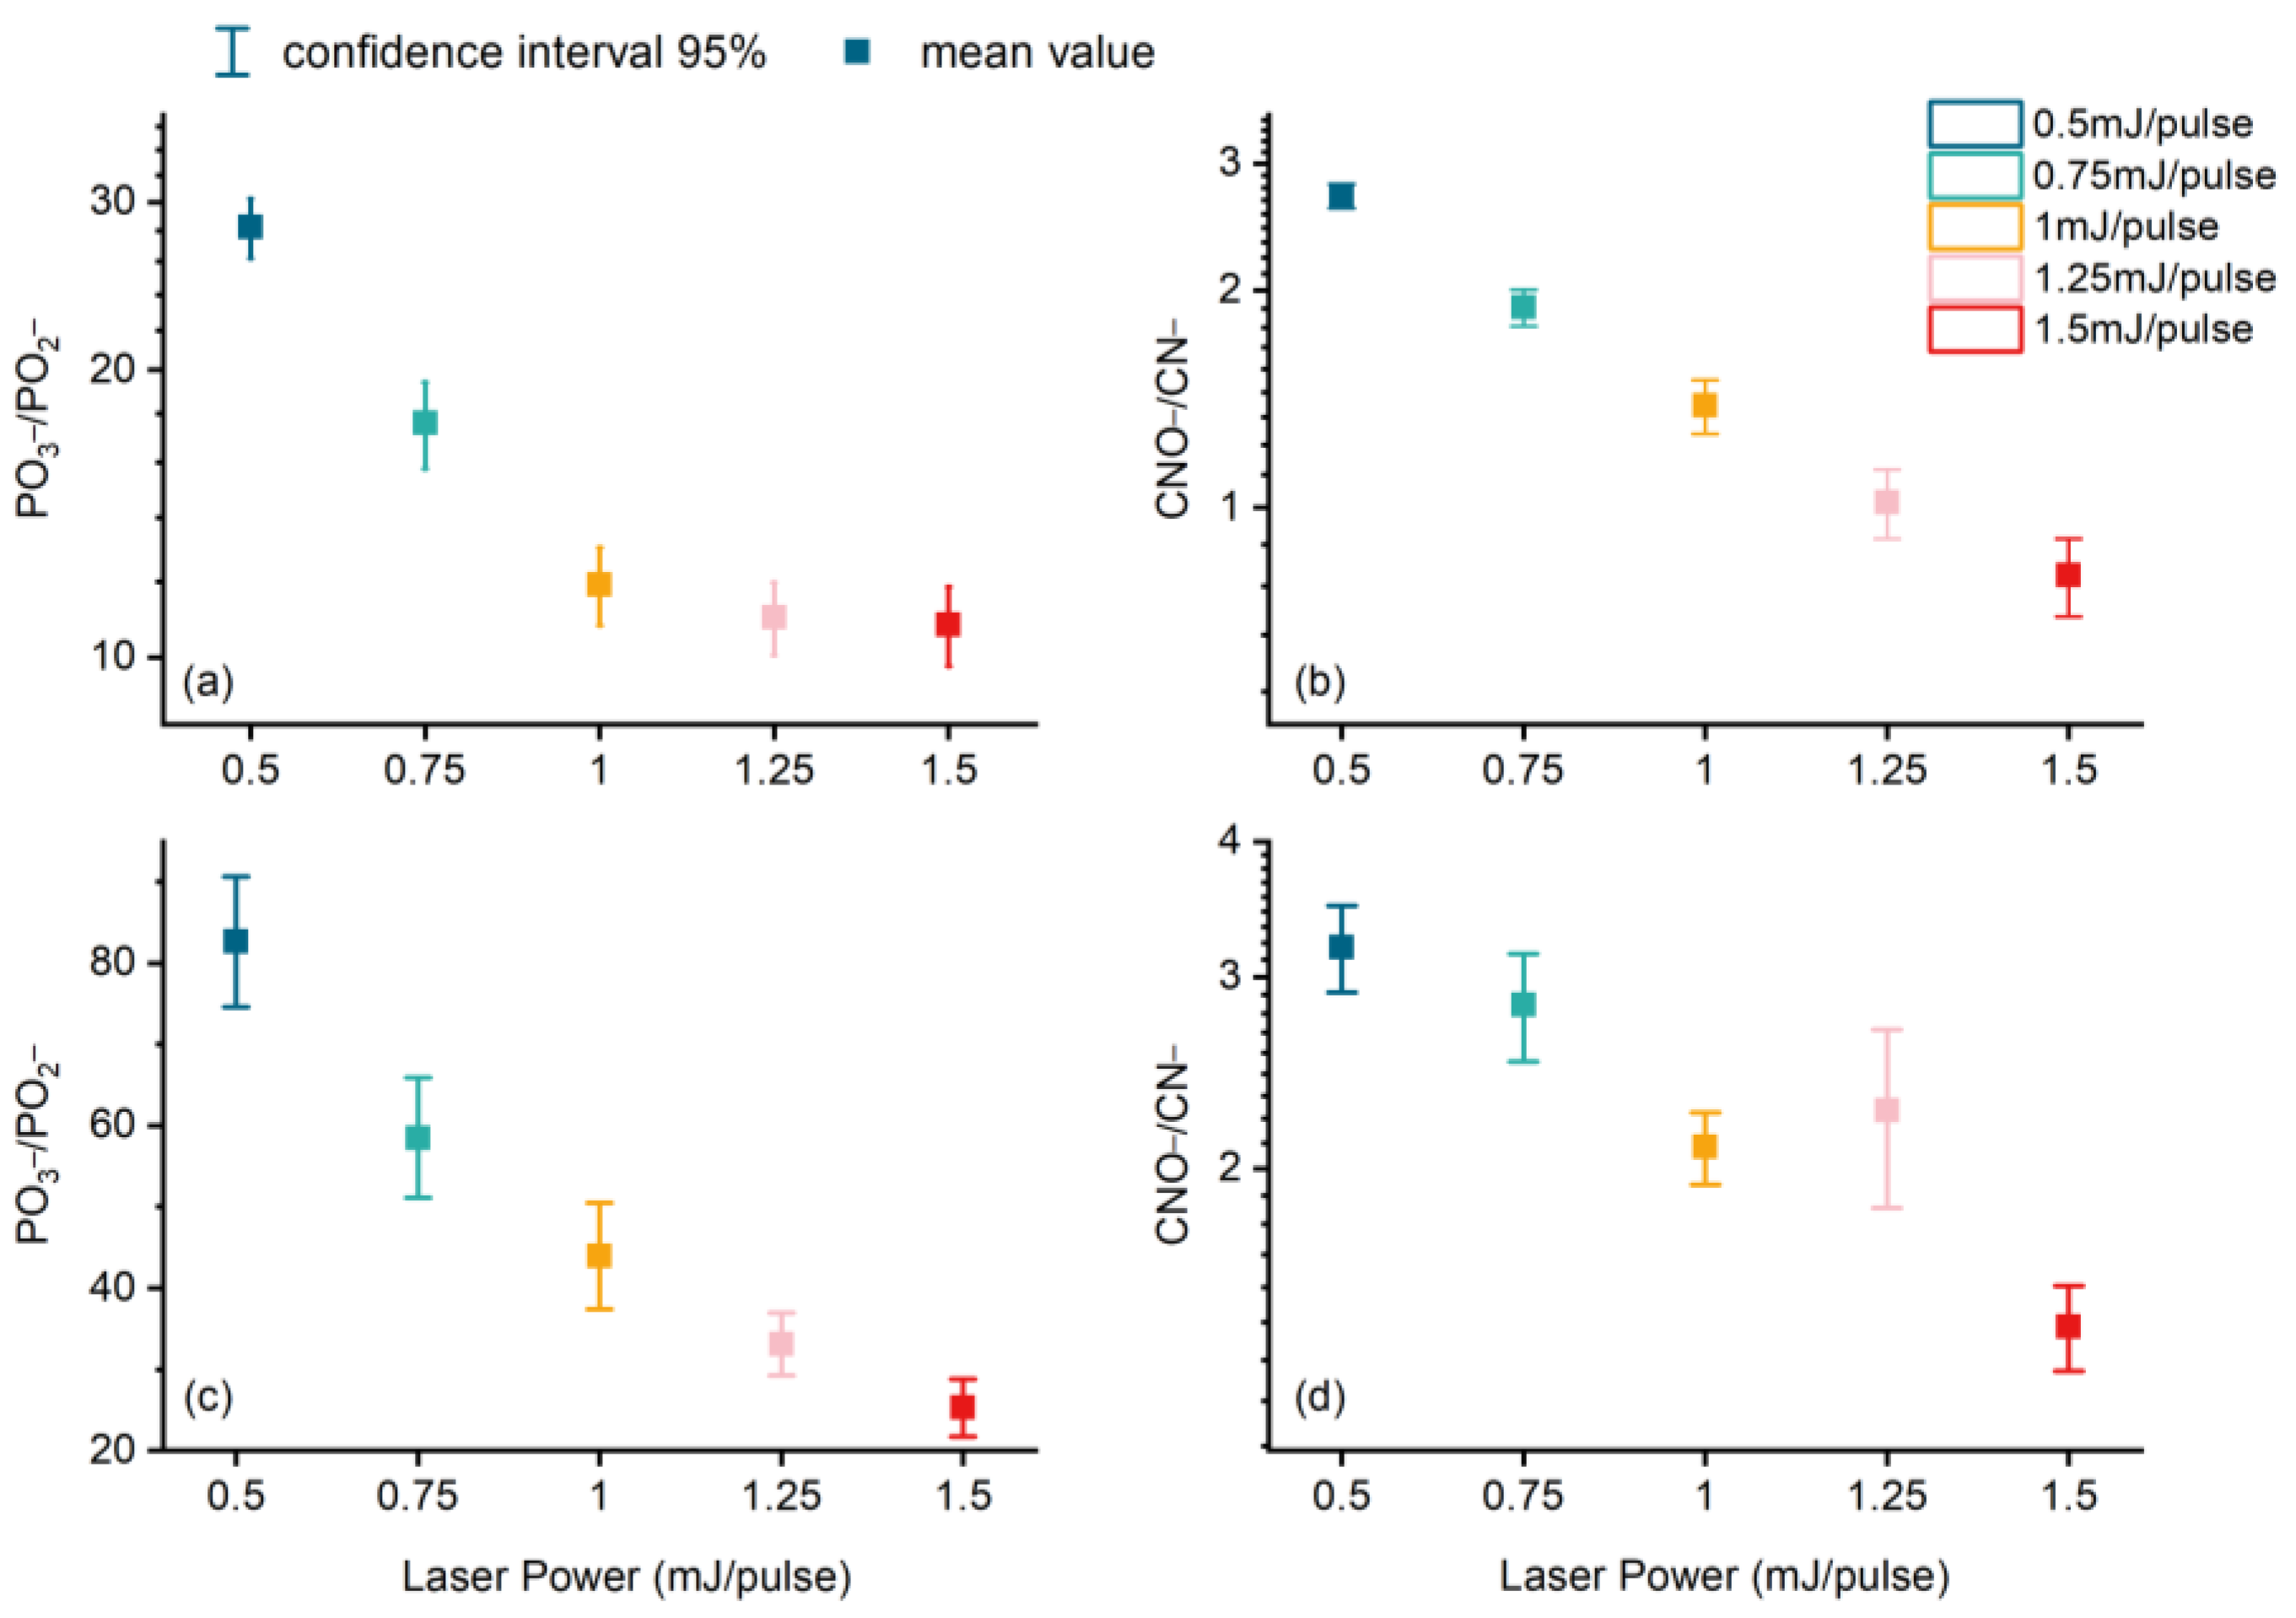
To verify the influence of ionized laser energy on this analysis method, different laser energies of 0.5, 0.75, 1.0, 1.25, and 1.5 mJ·pulse−1 were selected and Staphylococcus aureus and Escherichia coli are taken as an example to explore the influence of ionized laser energy on the ionic peak ratio. As shown in Figure 7, as the energy increases, the ionization degree increased with more fragmented ions, the ratio of PO3/PO2 and CNO/CN decreased, and more PO3and CNO were ionized as PO2 and CN, respectively. The distribution range of PO3/PO2 of E. coli aerosol under five different laser energies was wider and the ratio was larger, indicating that the signal of PO3 was stronger. As shown in Table 3, the peak frequency of the four characteristic ion peaks of fungal aerosol was about 52.46%. In order to make the data more statistically significant, only the influence of laser ionization energy on bacterial aerosol is discussed in this study. SPMS single-step laser desorption is a difficult ionization process in which organic compounds produce ion fragments of different degrees. Liu et al. [37] used Bacillus thuringiensis to explore the influence of different laser pulse energies on SPAMS and found that particles do not ionize when the laser energy is lower than 0.2 mJ·pulse−1 and that the ionic peak increases significantly when the laser energy is higher than 1.5 mJ·pulse−1; they also found that particle integrity is the best when the laser energy is about 0.5 mJ·pulse−1. Too-high or too-low energy is not conducive to the discovery of the characteristic mass spectrum.
Furthermore, the discrimination degree of ionized laser energy on bioaerosols under different ratios was compared. The biological aerosol (S. aureus and E. coli) and abiotic aerosol (dust) were selected under the laser energy of 0.5 mJ·pulse−1. Using SPAMS, it was found that the ratio interval of PO3/PO2 and CNO/CN was concentrated in (~4–170) and (~0.9–4), while that of dust aerosol was (~0.7–3) and (~0.5–2), respectively. When the laser energy is 1.5 mJ·pulse−1, the ratio interval of bioaerosols was (~2–80) and (~0.08–3), while that of dust aerosols was (~0.7–2) and (~0.6–2). As shown in Figure 8, the interval of biological aerosols gradually changed and the trends in horizontal and vertical coordinates both decreased, while the scatter interval of abiotic aerosols is almost unchanged. According to the SVM algorithm, the discrimination degree of bacterial aerosols and dust under 0.5, 0.75, 1.0, 1.25, and 1.5 mJ·pulse−1 energies are 98.0%, 96.0%, 95.5%, 93.2%, and 96.6%, respectively, indicating that the distinction of bioaerosol and dust distractors is not affected by ionizing laser energy.
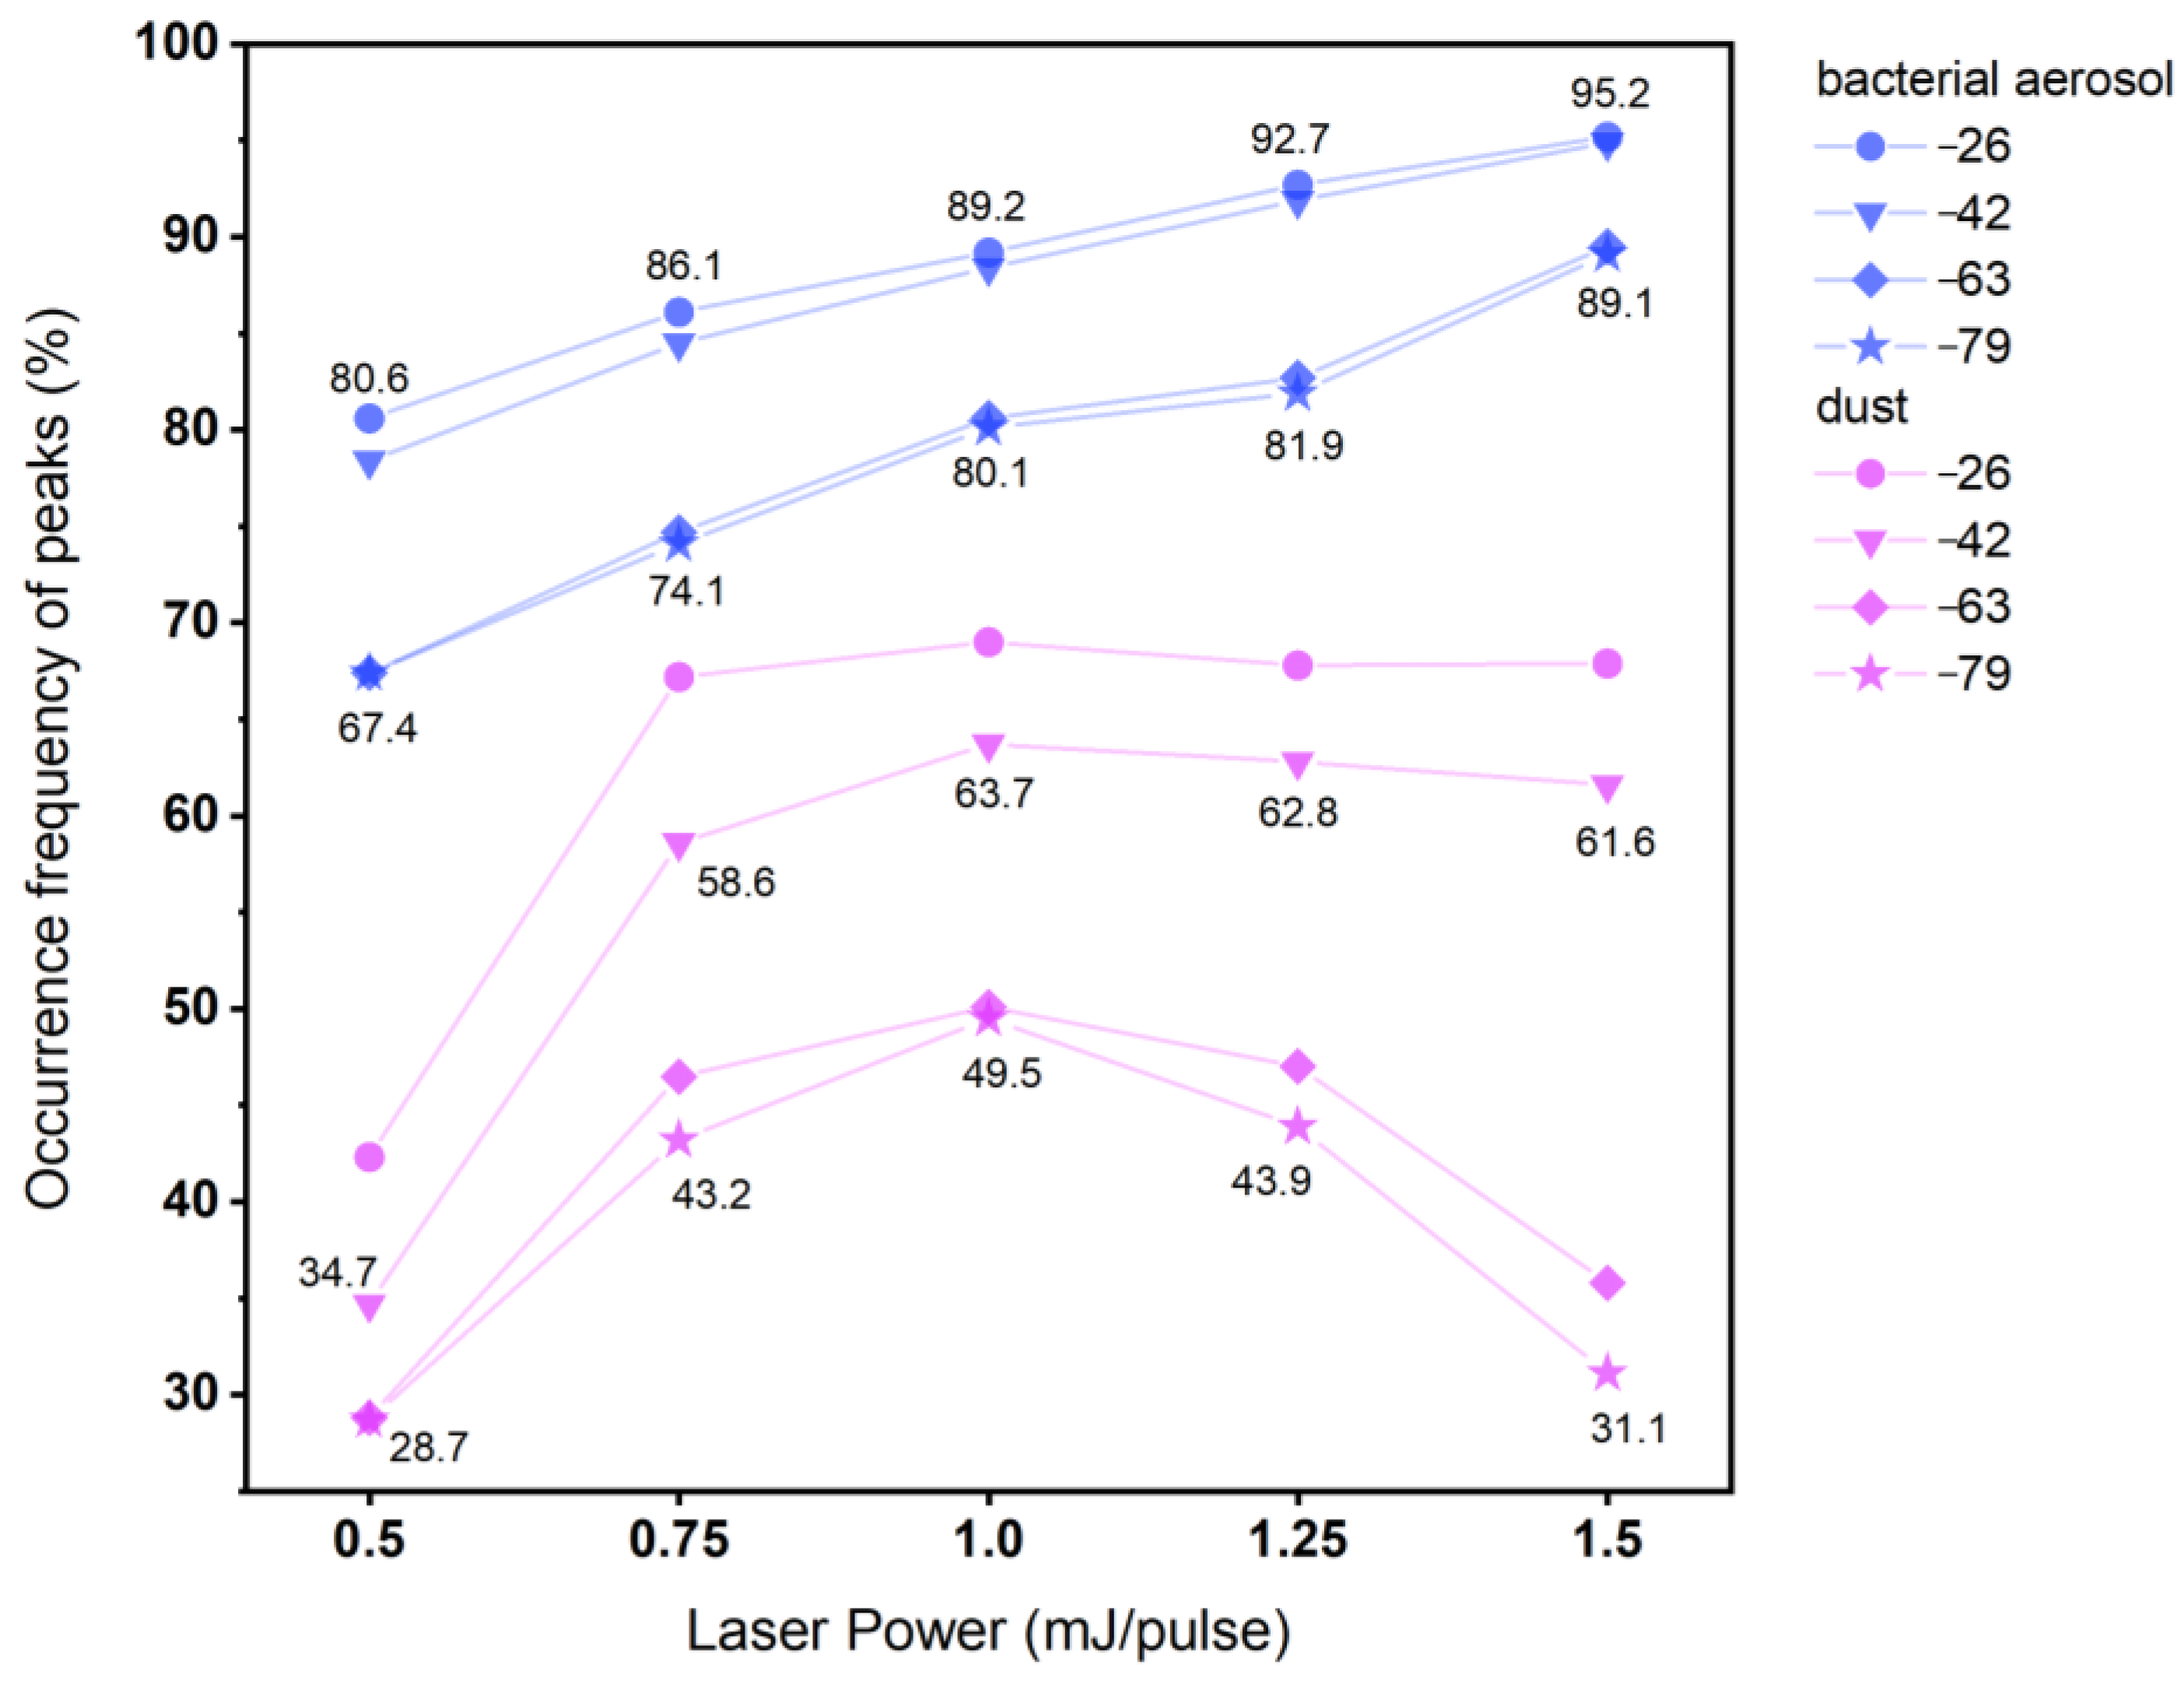
Under the condition of a constant effective peak threshold, the frequency of phosphate and organic nitrogen ionic peaks of bacterial aerosol (S. aureus and E. coli) and dust changed with the change of the ionized laser energy, as shown in Figure 9. When the laser energy is 0.5 mJ·pulse−1, the occurrence frequency of peaks of both bioaerosol and dust was the lowest and the influence on abiotic aerosols is larger, with a peak occurrence frequency of 34%. When using this classification method for discrimination, it is only necessary to discriminate against 28.7% of dust particles. When the laser energy was 1.5 mJ·pulse−1, the occurrence frequency of peaks of four bacterial aerosol ionic peaks was the highest, while that of the dust was the lowest. At this time, the highest proportion of bacterial aerosols (89.1%) and the lowest proportion of dust particles (31.1%) could be statistically discriminated against. Under the same laser energy, the overall occurrence frequency of peaks of abiotic aerosols was about 40% lower than that of biological aerosols. Different types of particles have different laser energy requirements. In addition, the variation trend of CNO and PO3 was the same as that of CN and PO2, respectively; however, the phosphate ionic peaks (PO3 and PO2) were more affected by the laser energy. In conclusion, when the ionized laser energy was 1.5 mJ·pulse−1, the classification method of the ionic peak ratio was more effective in discriminating bioaerosols.
The classification method based on the ratio of ion peaks based on high performance-SPAMS can effectively distinguish bioaerosols from abiotic aerosols. However, due to the difference in the signal intensity of the four characteristic ion peaks, not all particles contained four ion peaks at the same time, and it was impossible to distinguish 100% biological particles. Methods developed to discriminate between the two types utilizing a few select ion markers with specific ratios or thresholds may be useful for a specific instrument and operating parameters, however such methods cannot easily be extended to all single particle datasets. In addition, the classification method using only the data measured in the laboratory cannot be directly applied to the classification of environmental particles. Bioaerosols undergo aging reactions in the atmospheric environment, and their chemical composition and morphology characteristics have different changes under the influence of a variety of natural factors [38]. Moreover, it is necessary to consider all the mass spectrometric characteristics to identify environmental particles.

4. Conclusions

The performance of SPAMS and the improvement of the sampling system have enhanced the potential to detect bioaerosols. Wide-particle-size-range, high-performance SPAMS has been used for the first time to detect fungal particles with a particle size of 10 μm, which provides a good technical basis for the detection of biological aerosols with large particle sizes in the environment. With the improvement of the instrument performance, the single-particle spectrum of bioaerosol shows decarboxylic ionic peaks of serine and alanine, 44[alanine-COOH]+ and 60[serine-COOH]+, and phosphate ionic peaks, 261NaH(PO3)3 and 277NaH(PO3)2(PO4). A more unique fingerprint spectrum than the original study has been obtained. The bioaerosol identification method based on the characteristic peak ratios, PO3/PO2 and CNO/CN can effectively discriminate bioaerosol from three kinds of commonly seen abiotic disruptors, with the discrimination degree up to 97.7%. In addition, due to the influence of laser ionization efficiency, the effective mass spectra peak produced by bacterial aerosol is higher than 80%, which is more suitable for this method. The changes of PO3/PO2 and CNO/CN values at different laser energies show that the ionized laser energy affects the integrity of particles, but does not affect the identification accuracy based on the characteristic peaks of bioaerosols. This study shows that SPAMS detection technology of bioaerosols can become a new method to improve the accuracy of online bioaerosol discrimination.

Author Contributions

L.L. and Z.C. designed the study; X.L. (Xuan Li) and Z.Z. (Zeming Zhuo) performed the experiments; G.Z., X.D., X.L. (Xue Li), Z.H. and Z.Z. (Zhen Zhou) participated in data analysis and result discussion; X.L. (Xuan Li) and L.L. wrote the paper with the input from all authors. All authors have read and agreed to the published version of the manuscript.

Funding

This research was funded by the National key research and development program for young scientists (2022YFF0705400).

Institutional Review Board Statement

Not applicable.

Informed Consent Statement

Not applicable.

Data Availability Statement

Not applicable.

Conflicts of Interest

The authors declare no conflict of interest.

References

  1. Fröhlich-Nowoisky, J.; Kampf, C.-J.; Weber, B.; Huffman, J.-A.; Pöhlker, C.; Andreae, M.-O.; Lang-Yona, N.; Burrows, S.-M.; Gunthe, S.-S.; Elbert, W.; et al. Bioaerosols in the Earth system: Climate, health, and ecosystem interactions. Atmos. Res. 2016, 182, 346–376. [Google Scholar] [CrossRef] [Green Version]
  2. Burrows, S.-M.; Elbert, W.; Lawrence, M.-G.; PoSchl, U. Bacteria in the global atmosphere -Part 1: Review and synthesis of literature data for different ecosystems. Atmos. Chem. Phys. 2009, 9, 10777–10827. [Google Scholar] [CrossRef] [Green Version]
  3. Huffman, J.; Santarpia, J.-A. Online Techniques for Quantification and Characterization of Biological Aerosols. Microbiol. Aerosols 2017, 2017, 83–114. [Google Scholar] [CrossRef]
  4. Després, V.; Huffman, J.-A.; Burrows, S.-M.; Hoose, C.; Safatov, A.; Buryak, G.; Fröhlich-Nowoisky, J.; Elbert, W.; Andreae, M.; Pöschl, U.; et al. Primary biological aerosol particles in the atmosphere: A review. Tellus B Chem. Phys. Meteorol. 2012, 64, 15598. [Google Scholar] [CrossRef] [Green Version]
  5. Li, X.; Ran, B.; Wu, W.; Wang, Q.; Tong, Z.; Zhang, X.; Li, Y. Progress in the application of fluorescence spectroscopy in biological aerosol monitoring. Mil. Med. 2018, 42, 464–470. [Google Scholar]
  6. Bozlee, B.-J.; Misra, A.-K.; Sharma, S.K.; Ingram, M. Remote Raman and fluorescence studies of mineral samples. Spectrochim. Acta Part A Mol. Biomol. Spectrosc. 2005, 61, 2342–2348. [Google Scholar] [CrossRef]
  7. Gabey, A.-M.; Gallagher, M.-W.; Whitehead, J.; Dorsey, J.-R.; Kaye, P.-H.; Stanley, W.-R. Measurements and comparison of primary biological aerosol above and below a tropical forest canopy using a dual channel fluorescence spectrometer. Atmos. Chem. Phys. 2010, 10, 4453–4466. [Google Scholar] [CrossRef] [Green Version]
  8. Hill, S.-C.; Pinnick, R.-G.; Niles, S.; Pan, Y.; Holler, S.; Chang, R.; Bottiger, J.; Chen, B.; Orr, C.-S.; Feather, G. Real-time measurement of fluorescence spectra from single airborne biological particles. Field Anal. Chem. Technol. 1999, 3, 221–239. [Google Scholar] [CrossRef]
  9. David, P.-F.; Maurice, E.-P.; Herbert, J.-T.; Paul, T.-S.; Gregg, A.-C.; Scott, C.-R.; Carlito, B.-L.; Joanne, M.-H.; Keith, R.-C.; Srivastava, A.; et al. Reagentless Detection and Classification of Individual Bioaerosol Particles in Seconds. Anal. Chem. 2004, 76, 373–378. [Google Scholar]
  10. Kleefsman, I.; Stowers, M.-A.; Verheijen, P.J.; Van Wuijckhuijse, A.L.; Kientz, C.E.; Marijnissen, J.C.M. Marijnissen Bioaerosol analysis by single particle mass spectrometry. Part. Part. Syst. Charact. 2007, 24, 85–90. [Google Scholar] [CrossRef]
  11. Wei, M.; Xu, C.; Xu, X.; Zhu, C.; Li, J.; Lv, G. Size distribution of bioaerosols from biomass burning emissions: Characteristics of bacterial and fungal communities in submicron (PM1.0) and fine (PM2.5) particles. Ecotoxicol. Environ. Saf. 2019, 171, 37–46. [Google Scholar] [CrossRef]
  12. Yu, N.; Huang, B.; Li, M.; Cheng, P.; Li, L.; Huang, Z.; Gao, W.; Zhou, Z. Single particle mass spectrometry characteristics of atmospheric fine particulate dust sources. China Environ. Sci. 2017, 37, 1262–1268. [Google Scholar]
  13. Sodeman, D.-A.; Toner, S.-M.; Prather, K.-A. Determination of single particle mass spectral signatures from light-duty vehicle emissions. Environ. Sci. Technol. 2005, 39, 4569–4580. [Google Scholar] [CrossRef]
  14. Silva, J.P.; Carlin, R.A.; Prather, K.A. Single particle analysis of suspended soil dust from Southern California. Atmos. Environ. 2000, 34, 1811–1820. [Google Scholar] [CrossRef]
  15. Zawadowicz, M.-A.; Froyd, K.-D.; Murphy, D.-M.; Cziczo, D.-J. Improved identification of primary biological aerosol particles using single-particle mass spectrometry. Atmos. Chem. Phys. 2017, 17, 7193–7212. [Google Scholar] [CrossRef] [Green Version]
  16. Smets, W.; Moretti, S.; Denys, S.; Lebeer, S. Airborne bacteria in the atmosphere: Presence, purpose, and potential. Atmos. Environ. 2016, 139, 214–221. [Google Scholar] [CrossRef]
  17. Leone, N.; Descroix, D.; Mohammed, S. Bioaerosol Detection with Atomic Emission Spectroscopy. Bioaerosol Detect. Technol. 2014, 2014, 143–167. [Google Scholar] [CrossRef]
  18. Williams, L.-R.; Gonzalez, L.-A.; Peck, J.; Trimborn, D.; McInnis, J.; Farrar, M.-R.; Moore, K.-D.; Jayne, J.-T.; Robinson, W.-A.; Lewis, D.-K.; et al. Characterization of an aerodynamic lens for transmitting particles greater than 1 micrometer in diameter into the Aerodyne aerosol mass spectrometer. Atmos. Meas. Tech. 2013, 6, 3271–3280. [Google Scholar] [CrossRef] [Green Version]
  19. Cahill, J.-F.; Darlington, T.-K.; Wang, X.; Mayer, J.; Spencer, M.-T.; Holecek, J.-C.; Reed, B.-E.; Prather, K.-A. Development of a High-Pressure Aerodynamic Lens for Focusing Large Particles (4–10 μm) into the Aerosol Time-of-Flight Mass Spectrometer. Aerosol Sci. Technol. 2014, 48, 948–956. [Google Scholar] [CrossRef]
  20. Cahill, J.-F.; Darlington, T.-K.; Fitzgerald, C.; Schoepp, N.-G.; Beld, J.; Burkart, M.-D.; Prather, K.-A. Online analysis of single cyanobacteria and algae cells under nitrogen-limited conditions using aerosol time-of-flight mass spectrometry. Anal. Chem. 2015, 87, 8039–8046. [Google Scholar] [CrossRef]
  21. Zhuo, Z.; Su, B.; Xie, Q.; Li, L.; Huang, Z.; Zhou, Z.; Mai, Z.; Tan, G. Simulation design and experimental study of aerodynamics particle concentrator for single particle mass spectrometry. Vac. Sci. Technol. 2021, 41, 441–447. [Google Scholar]
  22. Ronningen, T.-J.; Schuetter, J.-M.; Wightman, J.-L.; Murdock, A.; Bartko, A.-P. Raman spectroscopy for biological identification. Biol. Identif. 2014, 2014, 313–333. [Google Scholar] [CrossRef]
  23. Lai, C.W.; Schwab, M.; Hill, S.; Santarpia, J.; Pan, Y.-L. Raman scattering and red fluorescence in the photochemical transformation of dry tryptophan particles. Opt. Express 2016, 24, 11654–11667. [Google Scholar] [CrossRef]
  24. Steele, P.T.; Tobias, H.J.; Fergenson, D.P. Laser Power Dependence of Mass Spectral Signatures from Individual Bacterial Spores in Bioaerosol Mass Spectrometry. Anal. Chem. 2003, 75, 5480–5487. [Google Scholar] [CrossRef]
  25. Cornwell, G.-C.; Sultana, C.-M.; Petters, M.-D.; Al-Mashat, H.; Rothfuss, N.-E.; Mhler, O.; Demott, P.-J.; Martin, A.-C.; Prather, K.-A. Discrimination between individual dust and bioparticles using aerosol time-of-flight mass spectrometry. Aerosol Sci. Technol. 2022, 56, 592–608. [Google Scholar] [CrossRef]
  26. Li, L.; Huang, Z.; Dong, J.; Li, M.; Gao, W.; Nian, H.; Fu, Z.; Zhang, G.; Bi, X.; Cheng, P.; et al. Real time bipolar time-of-flight mass spectrometer for analyzing single aerosol particles. Int. J. Mass Spectrom. 2011, 303, 118–124. [Google Scholar] [CrossRef]
  27. Li, L.; Liu, L.; Li, X.; Li, M.; Li, X.; Gao, W.; Huang, Z.; Cheng, P. Improvement in the Mass Resolution of Single Particle Mass Spectrometry Using Delayed Ion Extraction. J. Am. Soc. Mass Spectrom. 2018, 29, 2105–2109. [Google Scholar] [CrossRef] [PubMed]
  28. Shen, W.; Dai, X.; Huang, Z.; Hou, Z.; Cai, W.; Du, X.; Zhou, Z.; Li, M.; Li, L. Improvement of the dynamic range of data acquisition system in single particle mass spectrometry. Chin. Cine 2018, 39, 331–336. [Google Scholar]
  29. Du, X.; Zhuo, Z.; Li, X.; Li, X.; Li, M.; Yang, J.; Zhou, Z.; Gao, W.; Huang, Z.; Li, L. Design and Simulation of Aerosol Inlet System for Particulate Matter with a Wide Size Range. Atmosphere 2023, 14, 664. [Google Scholar] [CrossRef]
  30. Su, B.; Zhang, G.; Zhuo, Z. Different characteristics of individual particles from light-duty diesel vehicle at the launching and idling state by AAC-SPAMS. J. Hazard. Mater. 2021, 418, 126304. [Google Scholar] [CrossRef]
  31. Jung, J.-H.; Lee, J.-E. In situ real-time measurement of physical characteristics of airborne bacterial particles. Atmos. Environ. 2013, 81, 609–615. [Google Scholar] [CrossRef]
  32. Li, W.; Liu, L.; Xu, L.; Zhang, J.; Yuan, Q.; Ding, X.; Hu, W.; Fu, P.; Zhang, D. Overview of primary biological aerosol particles from a Chinese boreal forest: Insight into morphology, size, and mixing state at microscopic scale. Sci. Total Environ. 2020, 719, 137520. [Google Scholar] [CrossRef]
  33. Czerwieniec, G.-A.; Russell, S.-C.; Tobias, H.-J.; Pitesky, M.-E.; David, P.-S.; Fergenson, P.; Srivastava, A.; Horn, J.-M.; Frank, M.; Gard, E.-E. Stable Isotope Labeling of Entire Bacillus atrophaeus Spores and Vegetative Cells Using Bioaerosol Mass Spectrometry. Anal. Chem. 2005, 77, 1081–1087. [Google Scholar] [CrossRef] [PubMed]
  34. Abneesh, S.; Pitesky, M.-E.; Steele, P.-T.; Tobias, H.-J.; Fergenson, D.-P.; Horn, J.-M.; Russell, S.-C.; Czerwieniec, G.-A.; Lebrilla, C.-B.; Gard, E.-E.; et al. Comprehensive Assignment of Mass Spectral Signatures from Individual Bacillus atrophaeus Spores in Matrix-Free Laser Desorption/Ionization Bioaerosol Mass Spectrometry. Anal. Chem. 2005, 77, 3315–3323. [Google Scholar]
  35. Zeng, Z.; Yu, J.; Liu, P.; Huang, F.; Chen, Y.; Huang, Z.; Gao, W.; Li, M.; Zhou, Z.; Li, L. Analysis of bacterial aerosol particle aerosol mass spectrometer. Anal. Chem. 2019, 47, 1344–1351. [Google Scholar]
  36. Chen, Y.; Kozlovskiy, V.; Du, X.; Lv, J.; Nikiforov, S.; Yu, J.; Kolosov, A.; Gao, W.; Zhou, Z.; Huang, Z.; et al. Increase of the particle hit rate in a laser single-particle mass spectrometer by pulse delayed extraction technology. Atmos. Meas. Tech. 2020, 13, 941–949. [Google Scholar] [CrossRef] [Green Version]
  37. Liu, C.; Li, B.; Liu, C.; Li, M.; Zhou, Z. Analysis of single-cell microbial mass spectra profiles from single-particle aerosol mass spectrometry. Rapid Commun. Mass Spectrom. 2021, 35, 9069–9078. [Google Scholar] [CrossRef]
  38. Pan, Y.-L.; Kalume, A.; Wang, C.; Santarpia, J. Atmospheric aging processes of bioaerosols under laboratory-controlled conditions: A review—ScienceDirect. J. Aerosol Sci. 2021, 155, 105767. [Google Scholar] [CrossRef]
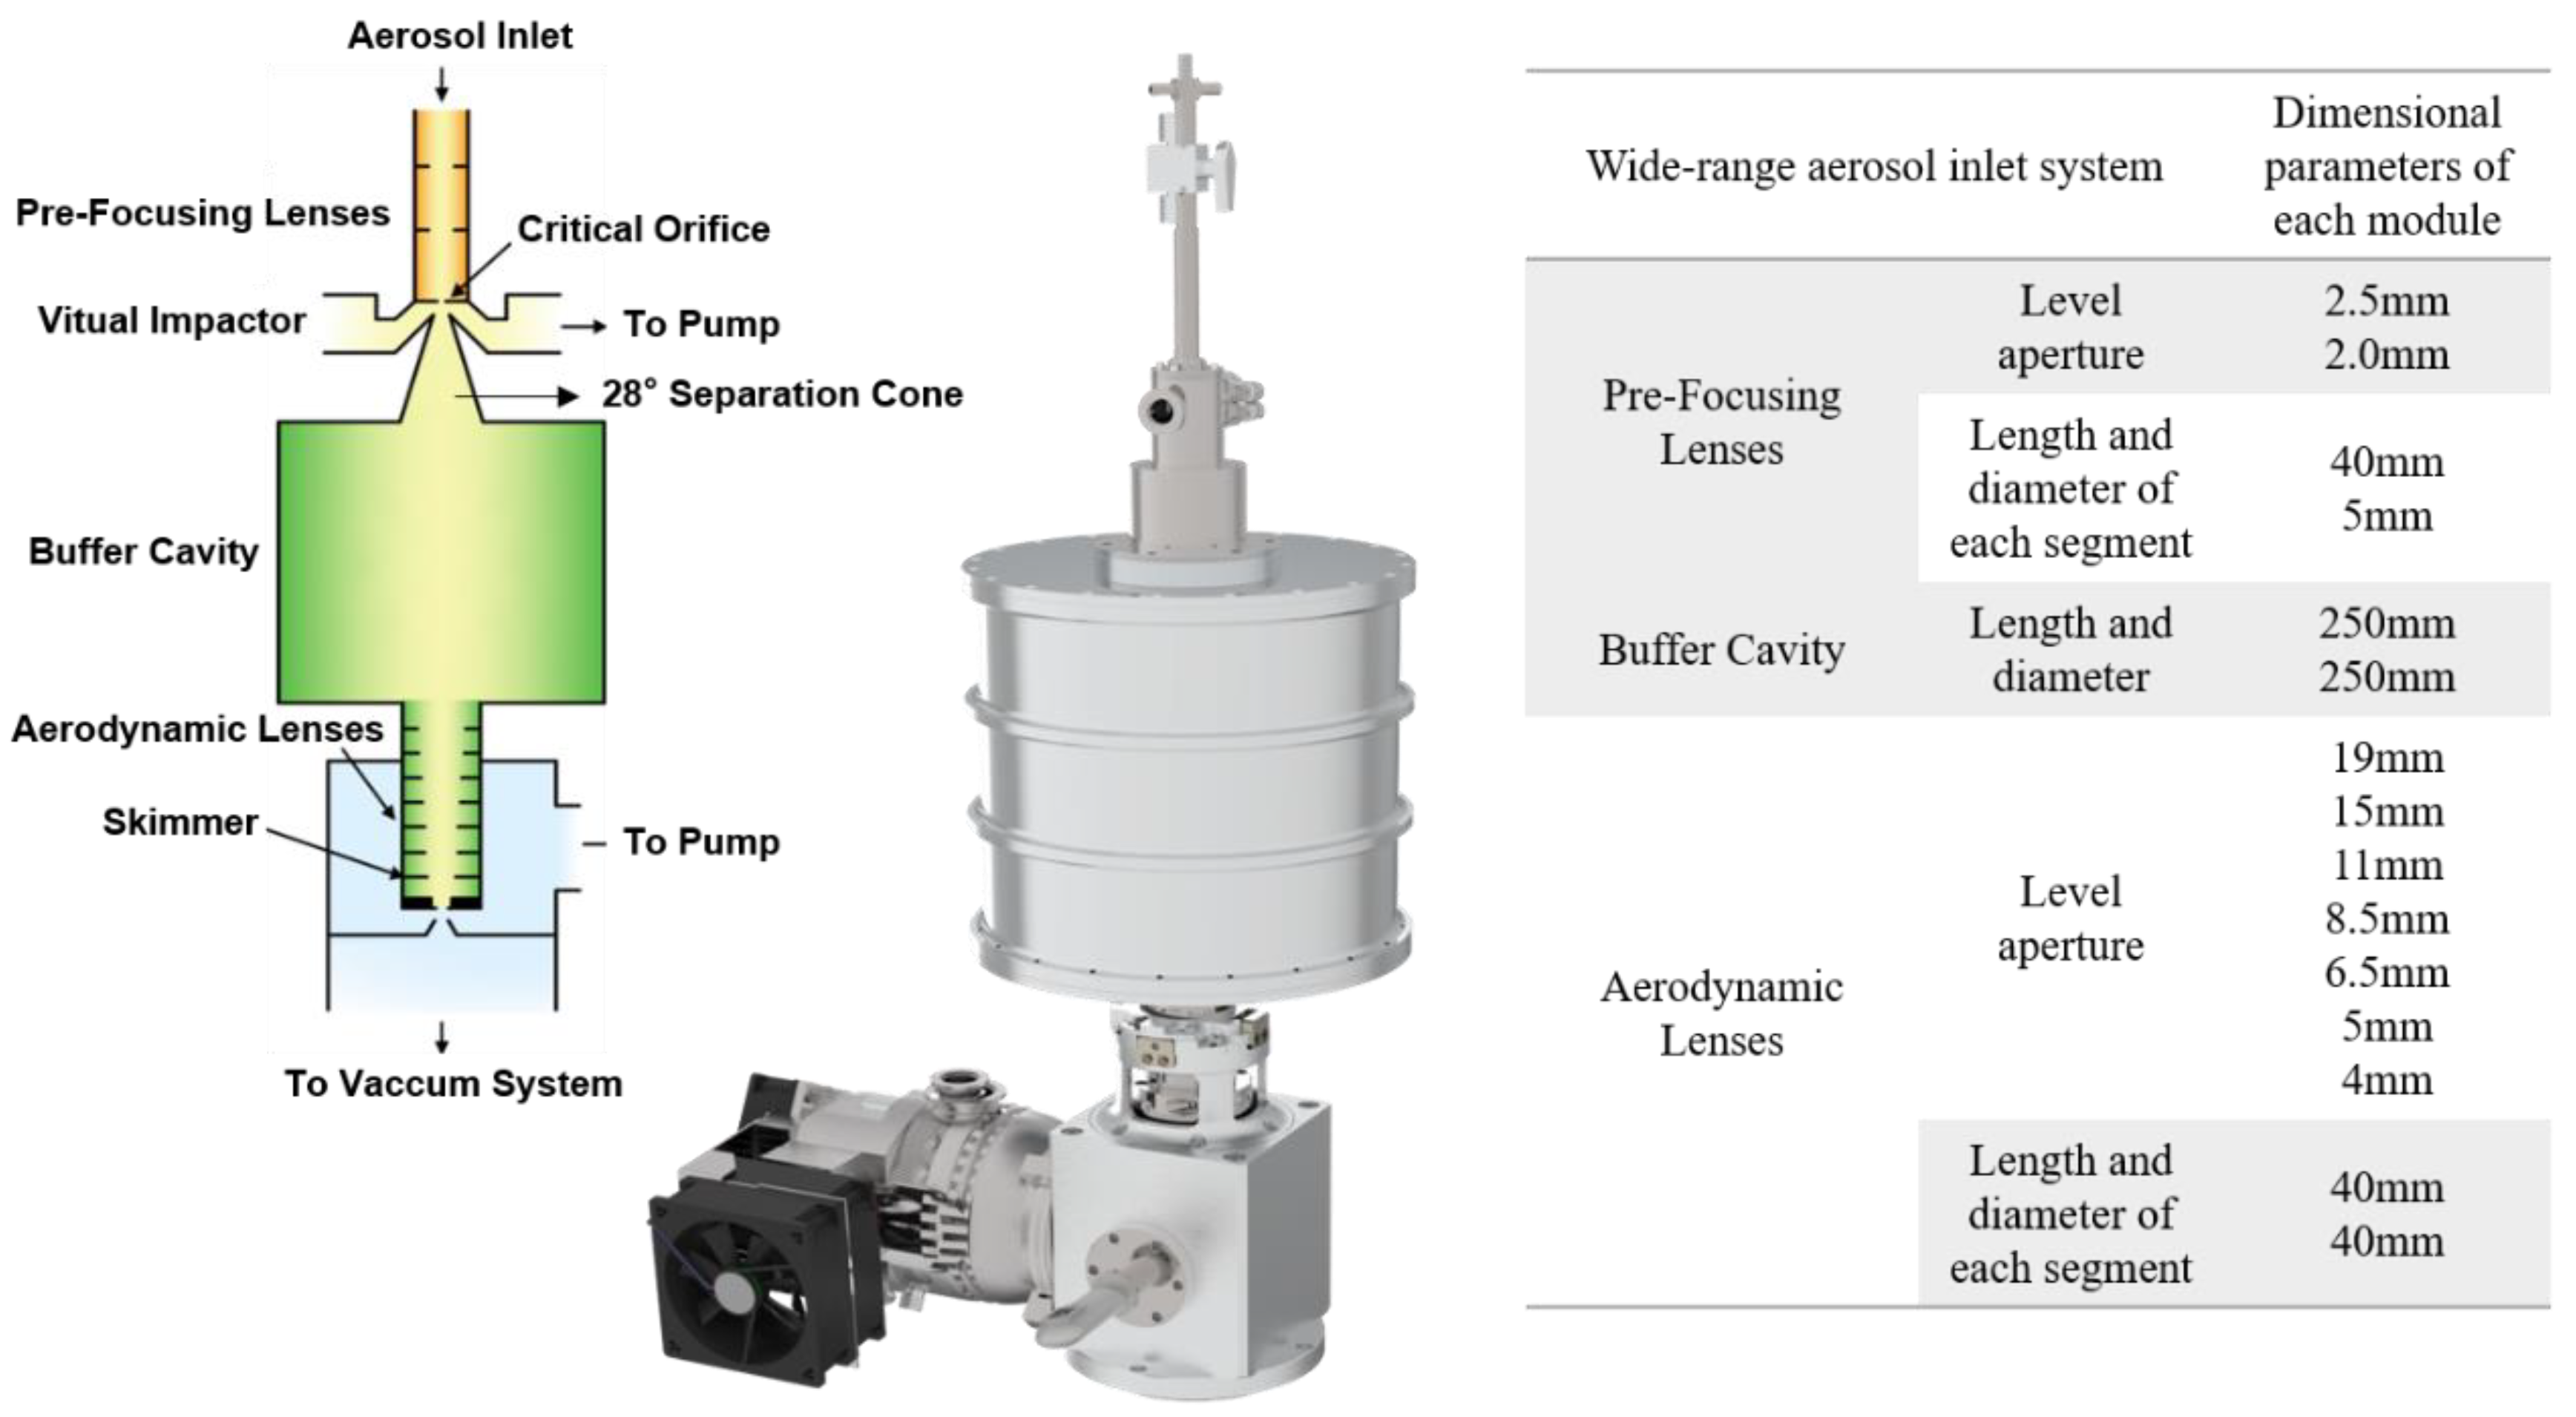
Figure 1. Schematic diagram of the wide-range aerosol inlet system.
Atmosphere 14 01017 g001
Figure 2. Experimental design of SPAMS. The arrow shows the process for detecting bioaerosols.
Atmosphere 14 01017 g002
Figure 3. Vacuum aerodynamic size distribution of 15 biological samples detected by SPAMS.
Atmosphere 14 01017 g003
Figure 4. Stacking diagram of the area of all bioaerosol ion peaks; (a) positive mass spectrum; (b) negative mass spectrum.
Atmosphere 14 01017 g004
Figure 5. Comparison of the frequency of four ion peaks in biological and in abiotic aerosols.
Atmosphere 14 01017 g005
Figure 6. Scatterplot of the bioaerosol and abiotic aerosol CNO/CN and PO3/PO2.
Atmosphere 14 01017 g006
Figure 7. PO3/PO2 and CNO/CN distribution of S. aureus (a,b) and E. coli (c,d).
Atmosphere 14 01017 g007
Figure 8. Scatter distribution of the bioaerosol and dust aerosol CNO/CN and PO3/PO2, (ae) represents energy 0.5, 0.75, 1.0, 1.25, and 1.5 mJ/pulse.
Atmosphere 14 01017 g008
Figure 9. Occurrence frequency of the characteristic peak under different laser energies.
Atmosphere 14 01017 g009
Table 1. Sample numbers and names of the 15 strains.
Number.NameTypeHit Rate
#01Klebsiella pneumoniaeGram-negative bacillus25.17%
#02Salmonella pneumoniaeGram-negative bacteria33.77%
#03Shiga virulent Escherichia coliGram-negative bacillus45.77%
#04Bordetella bronchitisGram-negative bacillus21.62%
#05Escherichia coliGram-negative bacillus24.71%
#06Staphylococcus aureusGram-positive cocci62.85%
#07Listeria monocytogenesGram-positive bacteria32.38%
#08Enterococcus faeciumGram-positive cocci54.11%
#09Enterobacter cloacaeGram-negative bacillus40.83%
#10Staphylococcus epidermidisGram-positive cocci17.73%
#11Candida albicansEukaryotic fungi54.26%
#12Candida tropicalisEukaryotic fungi13.25%
#13Candida glabrataEukaryotic fungi32.37%
#14Aspergillus brasiliensisMulticellular fungi15.87%
#15Saccharomyces cerevisiaeEukaryotic fungi40.57%
Table 2. Types and descriptions of abiotic particles.
SampleDescriptionStudy
Road dustGuangzhou Accelerator Industrial Park road dustReported for the first time
Vehicle exhaustFresh exhaust collected from a light-duty diesel vehicle with the engine started and at steady stateSu et al., 2021, Journal of Hazardous Materials [30].
Wheat stalk combustion productsStems and leaves of mature wheat in East ChinaReported for the first time
Corn stalk combustion productsStems and leaves of mature corn in East ChinaReported for the first time
Oblate leaf combustion productsDried oblate leaves of eastern ChinaReported for the first time
Table 3. The average frequency of the characteristic ionic peak of bioaerosol.
SpeciesCNCNOPO2PO3
Bacteria92.9 ± 1.8%96.5 ± 1.1%82.9 ± 5.0%97.6 ± 2.5%
Fungi63.8 ± 21.1%70.4 ± 21.3%52.8 ± 18.5%75.3 ± 26.6%
Disclaimer/Publisher’s Note: The statements, opinions and data contained in all publications are solely those of the individual author(s) and contributor(s) and not of MDPI and/or the editor(s). MDPI and/or the editor(s) disclaim responsibility for any injury to people or property resulting from any ideas, methods, instructions or products referred to in the content.