1. Introduction
According to statistics, medium- and heavy-duty trucks (MHDTs) in China account for approximately 3% of the total number of road vehicles, but their greenhouse gas emissions account for about 46.9% of the total emissions from on-road vehicles [
1]. MHDTs account for approximately 78.1% and 52.2% of China’s road vehicle NOx and PM emissions, respectively [
2]. Controlling pollutant and carbon dioxide emissions from MHDTs is crucial for reducing pollution and carbon emissions in the transportation sector. The most effective measure is to promote the use of zero-emission vehicles as alternatives to fuel vehicles [
3,
4,
5,
6,
7]. However, the current zero-emission transformation of MHDTs is still slow; major obstacles include high total cost of ownership (TCO) [
4,
8,
9,
10], the need to improve high-energy-density batteries and fast-charging technology [
11,
12,
13,
14], and the imperfect charging and hydrogen refueling infrastructure [
15,
16,
17].
Numerous studies have been conducted on the electrification pathway or roadmap for automotives [
18,
19,
20,
21], but most of them focus on passenger vehicles, with few related to freight transport. In the field of zero-emission road freight transport, Breed et al. studied the impact of European heavy-duty vehicle carbon dioxide emission regulations on the zero emissions of heavy-duty vehicles and predicted the market penetration rate (sales share) of zero-emission trucks by 2030 [
22]. Talebian et al. researched and forecasted the trends in zero-emission freight transport in British Columbia (B.C.) by 2040, its impact on greenhouse gas emissions, and the corresponding supporting resources required [
23]. Zhang et al. forecasted the truck population of different segments based on a regression analysis and analyzed the total greenhouse gas (GHG) emissions of China’s road freight under four scenarios [
24]. Li et al. proposed a cost optimization superstructure model and derived the optimized oil-saving pathways for road freight transportation in China until 2030 [
25]. Lane et al. developed a new planning tool called TRACE (transportation rollout affecting cost and emissions) and predicted the development pathway for zero-emission heavy-duty vehicles and fuel infrastructure deployment in California [
26]. However, most existing studies focus on predicting the medium- and long-term number of trucks by model simulations and establishing pollutant or carbon dioxide emission inventories. There are fewer studies on the specific implementation routes of zero-emission pathways for MHDTs in relevant regions, such as identifying key promotion areas or routes within the regions and formulating spatial distribution promotion plans. Only Bie et al. predicted the pollutant emission trends of vehicles in the Chishui River Valley area of Renhuai, China, by setting roads with a larger traffic flow as key control areas on the basis of limited regional traffic flow data [
27]. However, this approach failed to consider the transportation characteristics of MHDTs in the region (transported goods, average transport distance, etc.), and thus could only offer limited policy support.
Located in the northwest of Hainan Province (
Figure S1), China, Hainan Island covers a land area of about 34,000 m
2, with a 612.8 km long G98 ring highway. The region is in the early stage of a massive rise in automotive consumption. By the end of 2019, the car parc (which here means all vehicles registered within a defined geographic region) of Hainan Island reached 1,374,858 units, with 33,505 new energy vehicles. Therefore, the proportion of new energy vehicles in Hainan Island was about 2.44%, which was higher than China’s average level of 1.46% and higher than in Europe (which was 0.6% in 2019 according to the IEA). The annual average temperature (23–26 °C) and minimum temperature (above 5 °C) of the region is relatively higher than other places in China, providing the best conditions for the application of new energy vehicles. As a relatively independent geographical unit, Hainan Island boasts natural geographic advantages, with a size highly aligned with the range of new energy vehicles and the construction of efficient infrastructure networks. China’s government decided to support the construction of a free trade pilot zone throughout Hainan Island in 2018. Promoting the utilization of new energy automobiles was regarded as an important part of the construction. Therefore, this region is more likely to conduct a long-term plan to promote new energy vehicles and play a leading and demonstrative role in China. In recent years, the region has introduced several policies to vigorously promote the development of new energy vehicles, and set the goal of achieving clean energy vehicle levels comparable to international benchmarks by 2030. However, due to the difficulty of promoting new energy MHDTs, there is an urgent need to develop a zero-emission roadmap.
Drawing upon extensive surveys, this study analyzes the geographic data of the points of interest (POIs) of over 1100 major industrial enterprises and the traffic flow of 510,000 vehicles within Hainan Island in order to clarify the main freight corridors and calculate the average transport distance of MHDTs from the perspectives of industrial layout and traffic flow. The number of MHDTs in 2030 is forecasted based on the freight turnover trend. Considering the characteristics of freight transport and fleet structures, this study analyzes future zero-emission pathways for MHDTs on Hainan Island, assesses the emission reduction potential, and suggests relevant plans and supporting policies. The method of identifying transportation channels and analyzing freight turnover in this study can be used for research in similar regions, as well as for reference when analyzing internal transportation characteristics in other cities and even countries, and the method of ‘analysis-to-trend prediction-to-policy recommendations’ in this study can be useful for the design of the roadmap of promoting zero-emission MHDTs in other regions.
2. Data and Method
2.1. Analysis of Bulk Commodity Supply and Demand and Freight Channels
At first, we collected network data related to the transportation of major bulk commodities and main transportation nodes (ports, industrial parks, and other logistics distribution centers) based on publicly available road data (
https://www.webmap.cn/commres.do?method=result100W (accessed on 1 May 2023)) and data from large-scale enterprises and key pollutant-emitting enterprises from the National Pollutant Discharge Permit Management Information Platform.
Then, we used geographic information system (GIS) software to display the locations of major POIs. By analyzing the production and sales information of bulk commodities based on the China Statistical Yearbook, the Hainan Statistical Yearbook, and public statistical data from various departments of Hainan Province, we combined the information on major bulk commodity production and user enterprises to outline the transportation volume, distance, and freight turnover of bulk commodities within the island. This allowed us to preliminarily identify the main freight channels.
After that, we analyzed traffic flow statistics on Hainan Island to verify the identified transportation channels. After installing bidirectional cameras to capture traffic flow videos, we adopted a visual deep learning solution to identify vehicle types and quantities in the videos, thus outputting the bidirectional vehicle quantities for each vehicle type (cars, buses, and trucks). Based on the production and consumption enterprise distribution, we selected 17 representative points for installing the cameras, which include the main road intersections of the highways, national roads, and provincial roads near the enterprises and the road sections leading to the main industrial parks. We selected 17 representative points across the island’s highway sections (including Haikou, Danzhou, Chengmai, Dongfang, Sanya, and Changjiang, which have a higher concentration of industrial enterprises; major ports such as Haikou, Yangpu, Basuo, and Sanya; and highway and national road sections passing through the Yangpu and Dongfang Industrial Zones) for data collection and statistics (
Figure S2). The collection period was from 5 June 2020 (a working day) to 6 June 2020 (on the weekend). We obtained traffic flow data for 510,000 vehicles (including cars, large buses, and trucks).
The errors in road traffic volume statistics mainly came from two aspects: (1) The camera and AI technology for identifying the number of different vehicle types. With the development of camera technology and AI technology for vehicle quantity recognition and classification, the overall error of the technology could be controlled to below 5%. (2) The data sampling method. For data sampling, the method of sampling 1 min every 10 min was used to calculate traffic volume. A statistical analysis was conducted on the flow data per minute, and the 95% confidence interval was 5.87 ± 0.05 vehicles.
2.2. Forecast of the Number of MHDTs
Using Hainan Island’s GDP and freight turnover data from 1999 to 2018, we constructed a log-linear model to predict the future freight turnover by forecasting the GDP. The log-linear model equation is as follows:
where CT
i is the historical or predicted freight turnover value of Hainan Island in the ith year in 10,000 ton km and GDP
i is the historical or predicted GDP value of Hainan Island in the ith year in CNY 100 million.
For the prediction of MHDT population in the future, researchers usually establish the quantitative relationship between MHDT population and the freight transportation volume or turnover volume based on the data from several past years [
24,
28]. However, historical data on MHDT population in Hainan Island are not publicly available, except for the MHDT population in 2019. Thus, we used a simple prediction method according to the definition of the freight turnover:
where CV
i is the number of MHDTs on Hainan Island in the ith year; CT
i is the predicted freight turnover of MHDTs in the ith year in ton km; VKT
i is the average annual mileage of MHDTs in the ith year in km, which is predicted to grow by 25% in 2025 and 2030 compared to 2019 according to the development need for the construction of a free trade pilot zone; and LF
i is the average load of MHDTs in the ith year in tons, which is predicted to remain constant throughout the study.
2.3. Analysis Methods of Emission Reduction Potential
2.3.1. Calculation of Atmospheric Pollutant Emissions
In this study, ‘emissions’ only refers to exhaust emissions, while non-exhaust (e.g., brake and tire wear) emissions and life cycle emissions of the vehicles or from electricity and hydrogen production are not considered. The main pollutants emitted by diesel trucks are nitrogen oxides and particulate matter, which serve as the main evaluation indicators for assessing the pollutant emission reduction after the zero-emission transformation of MHDTs on Hainan Island.
We used a mileage-based method to calculate the NOx and PM emissions from MHDTs.
where E
i j is the emissions of the jth pollutant (nitrogen oxides and particulate matter) from MHDTs on Hainan Island in the ith year in tons; CV
i is the number of MHDTs on Hainan Island in the ith year; and EF
j is the emission factor of the jth pollutant from MHDTs in tons/km. The service life of MHDTs in China is relatively short (10–15 years), and after 10 years of age, the survival rate of trucks decreases to a low level. According to the accessibility of data, in this study, the emissions of MHDTs sold after 2015 were calculated based on the vehicle sales data from 2015 to 2019 and the emission factors at different stages (which are sourced from Technical Guidelines for Compiling Atmospheric Pollutant Emission Inventory of Road Motor Vehicles (Trial) published by the Ministry of Ecology and Environment [
29]), as the benchmark for calculating emission reductions in 2025 and 2030. The emission factors for electric vehicles and hydrogen fuel cell vehicles were set to 0 and VKT
i is the mileage of MHDTs in the ith year in km, where the VKT used in this study is 75,000 km per year according to Technical Guidelines for Compiling Atmospheric Pollutant Emission Inventory of Road Motor Vehicles (Trial) [
29].
2.3.2. Calculation of Carbon Dioxide Emissions
The greenhouse gas emission model for automotives was derived from the 2006 Guidelines for National Greenhouse Gas Inventories published by the Intergovernmental Panel on Climate Change (IPCC). These guidelines classify greenhouse gas emissions from automotives due to fuel combustion as energy combustion emissions. The calculation method for carbon dioxide (only considering the emissions caused by fuel combustion during vehicle operation, not considering the life cycle emissions of the vehicles or from electricity and hydrogen production) includes:
Step 1: Estimating the fuel consumption (in mass or volume units);
Step 2: Converting the fuel consumption to energy units (based on the net calorific value, NCV);
Step 3: Converting the energy units into carbon content (carbon content per unit calorific value) based on the emission factor;
Step 4: Calculating the carbon dioxide emissions (carbon content 44/12).
The data for diesel greenhouse gas emissions were taken from the 2006 IPCC Guidelines for National Greenhouse Gas Inventories. The NCV value is 43.0 tJ/Gg, the emission factor value is 20.2 kgC/GJ, and the combustion efficiency value is 100%.
3. Results and Discussion
3.1. Freight Transportation Status and Channel Analysis
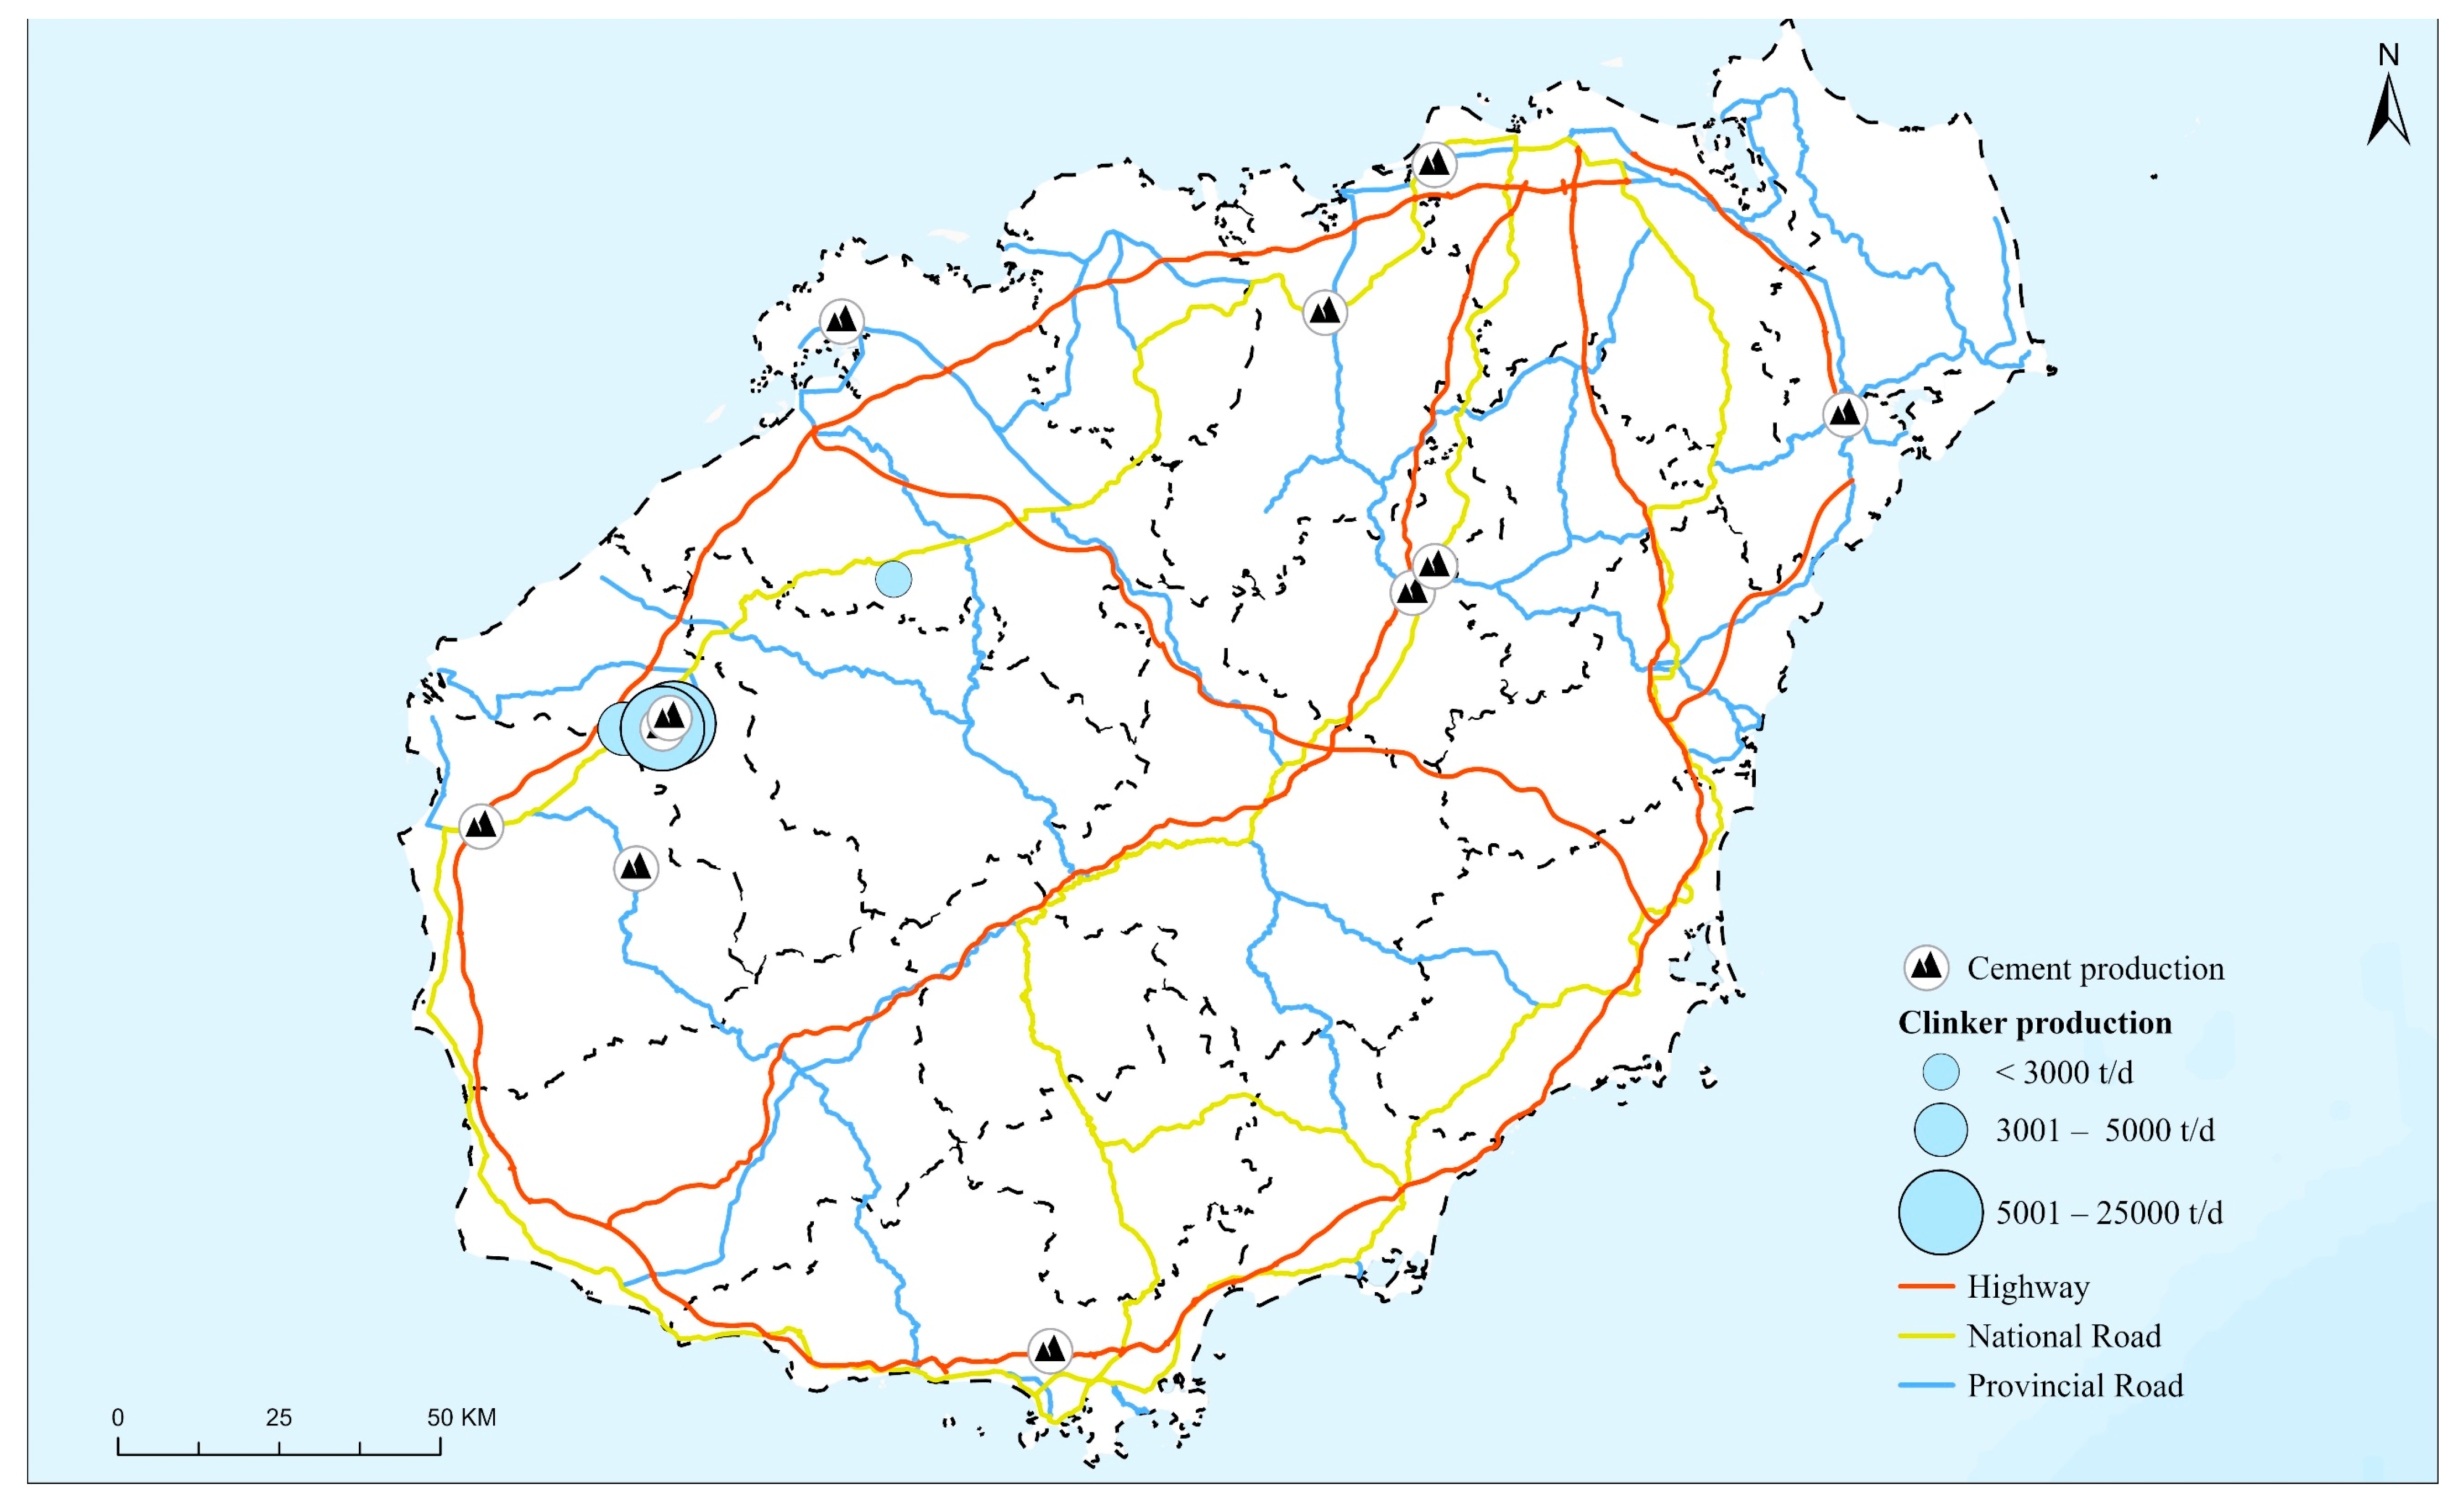
This study analyzed the geographical locations of major industrial enterprises involved in freight transport on Hainan Island by industry and sorted them on a GIS map. Some of the results are shown in
Figure 1 (with the cement industry as an example; the results of other industries can be found in
the Supplementary Information, Figure S3). Except for iron ore mining and selection, the vast majority of enterprises are located within a 40 km range of expressways. Beverage and fertilizer production enterprises are mostly located in the northeastern part of Hainan Island, near the expressways in Haikou, Wenchang, and Qionghai.
Based on the distribution of upstream and downstream industry enterprises on the GIS map, we analyzed the transportation distance of the main goods, estimated their transportation volume based on product output and port throughput, and calculated the transportation turnover of related goods in Hainan Province (also based on the average transportation distance and transportation volume data). The results (
Table S1) show that the total transportation turnover of major industrial products and raw materials in Hainan Island is about 6.8 billion ton km, accounting for about 80% of the total annual road turnover on the island. The proportion of road transportation turnover for the top five categories of goods, namely cement, agricultural and sideline products, coal, mineral construction materials, and chemical raw materials, reached 62%, highlighting the concentration of freight types. The average transportation distance of each type does not exceed 100 km. Combining the GIS analysis and the transportation volume analysis, we concluded that the main channels for freight transportation on Hainan Island are concentrated in the northern region, namely in the surrounding areas of Haikou, along a line of important ports including Haikou, Yangpu, and Baso, as well as in Chengmai and Tunchang counties.
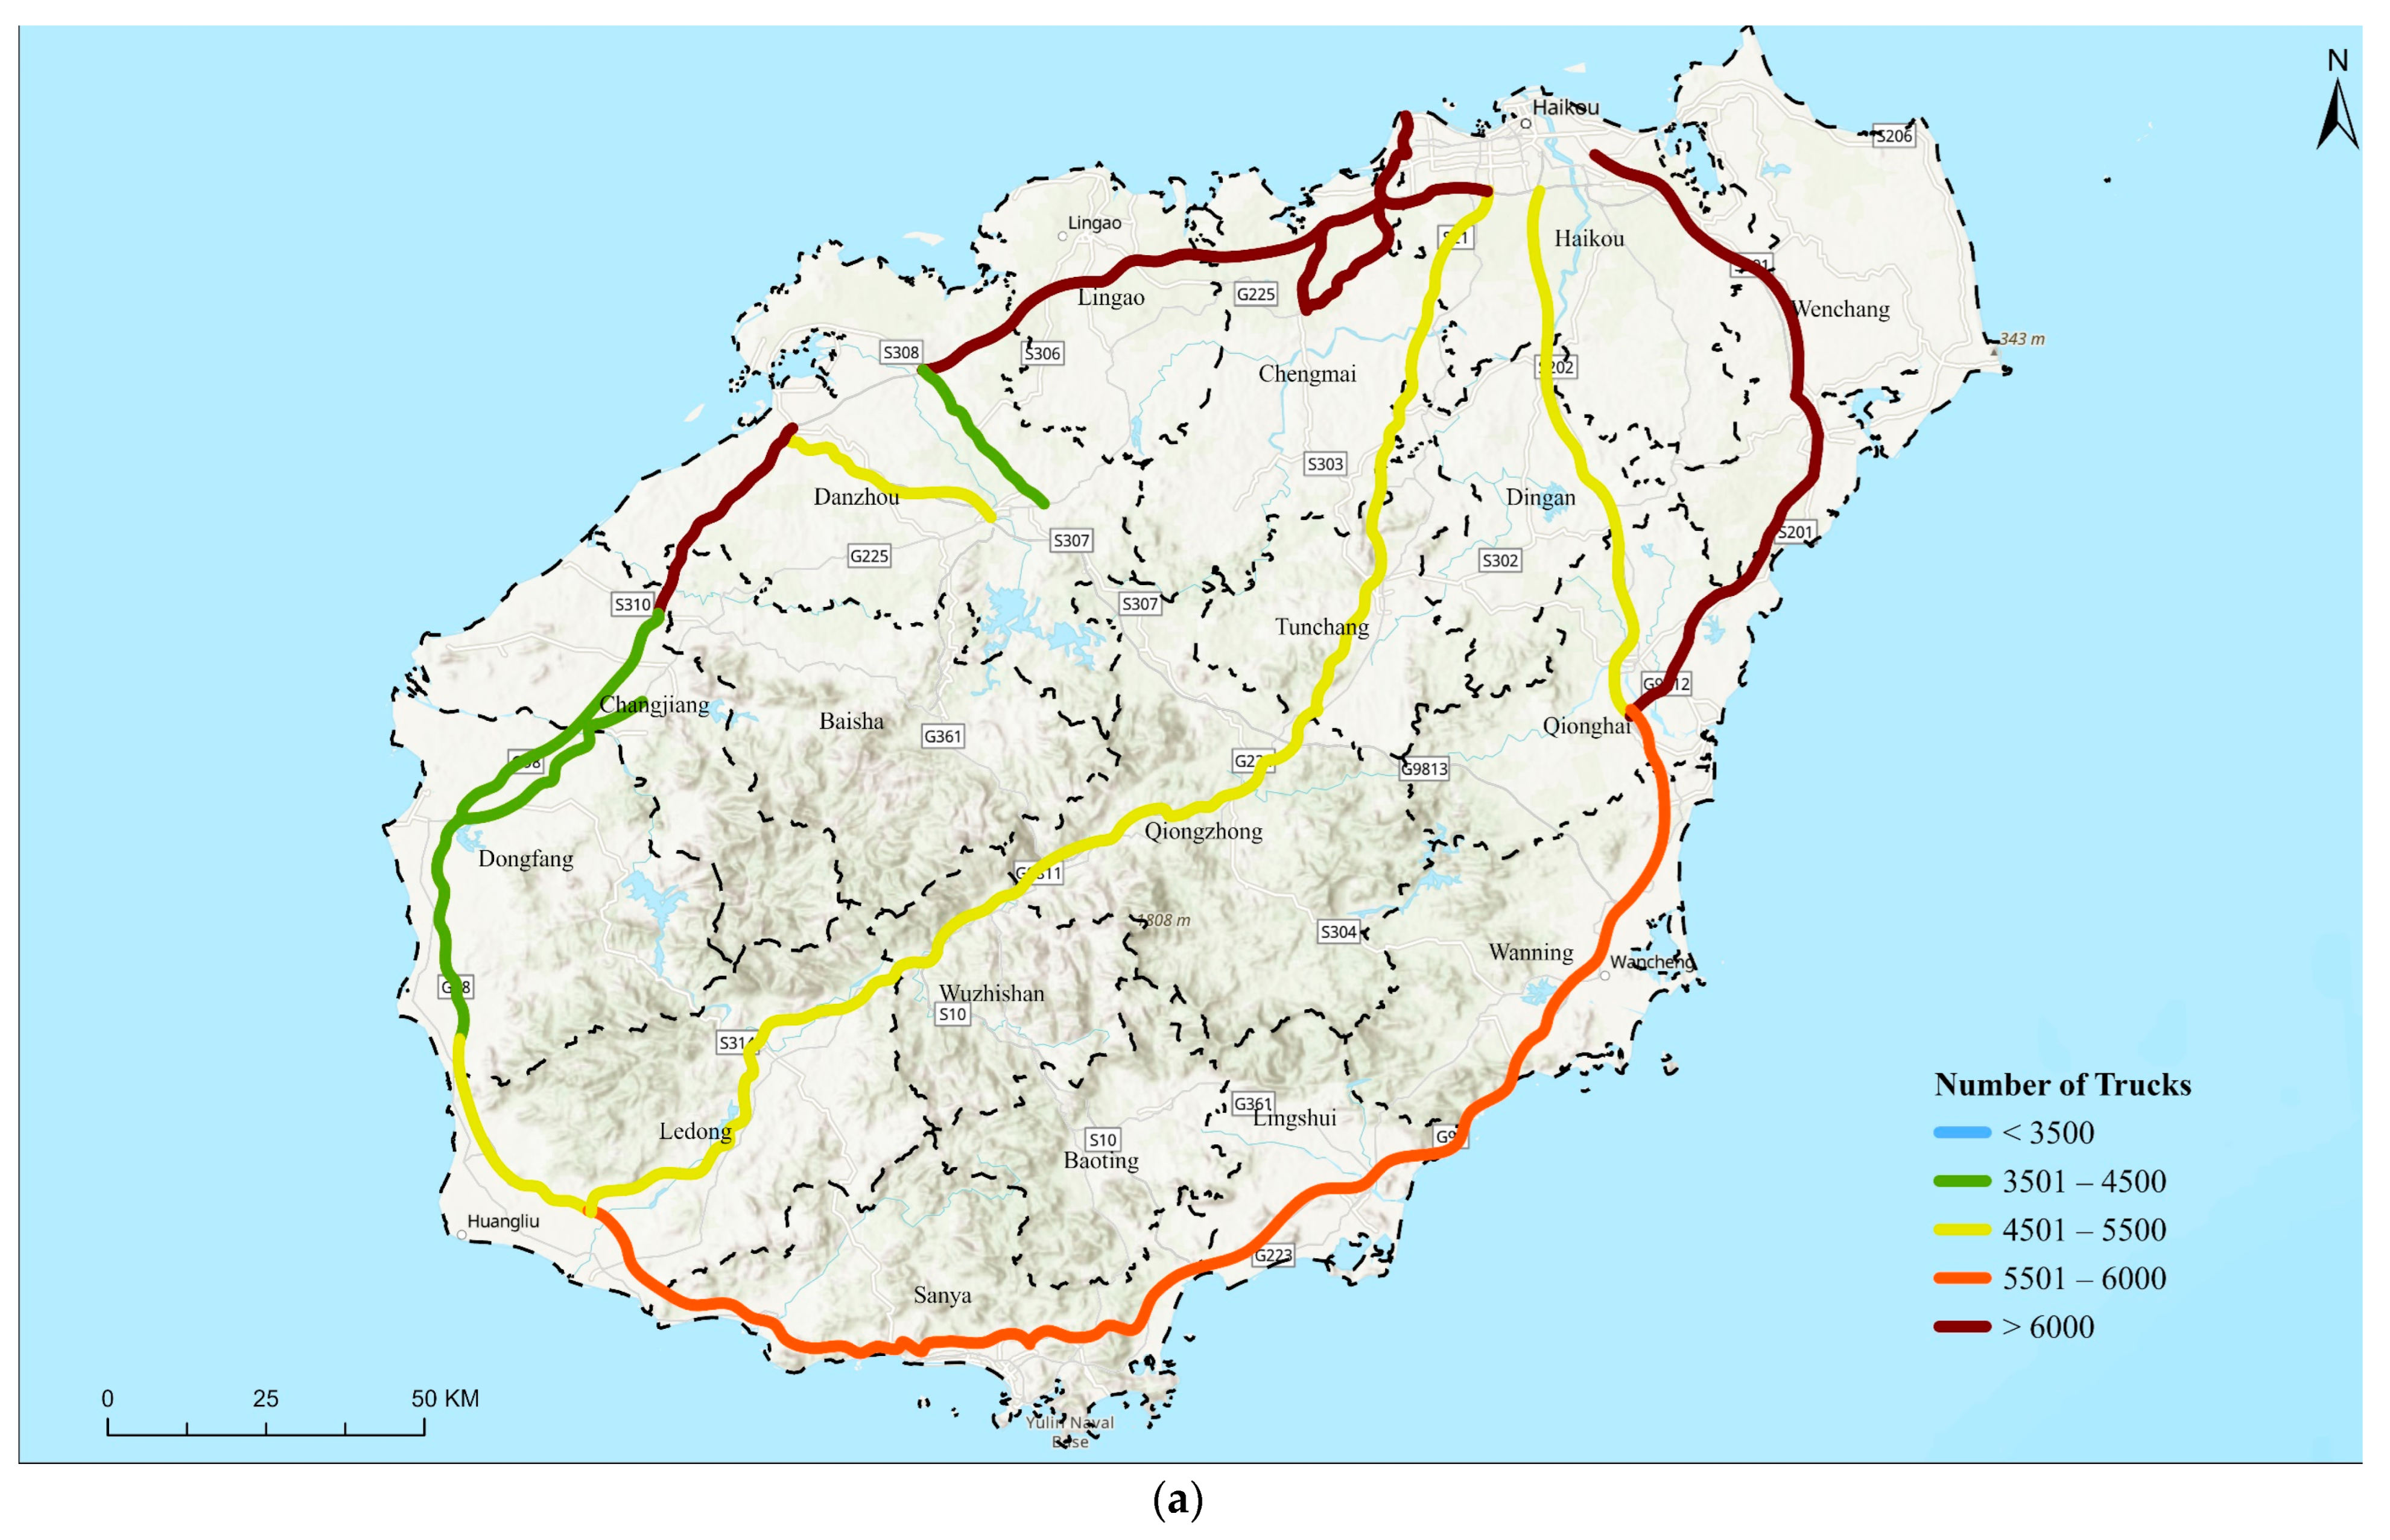
In addition, the traffic volumes at the 17 survey points were calculated and used to represent the average traffic volume of that section. The spatial data of traffic volumes were displayed using geographic information software, as shown in
Figure 2. It can be seen that trucks are mainly distributed in the Haikou–Boao, the Haikou–Yangpu–Danzhou, and the Yangpu–Dongfang sections of the Hainan Island Ring Expressway. This is consistent with the conclusions of the GIS analysis and transportation volume analysis in this study, with Haikou, Yangpu Industrial Zone, and Chengmai county being the main origins or destination points for trucks.
3.2. Forecast of the Number of MHDTs
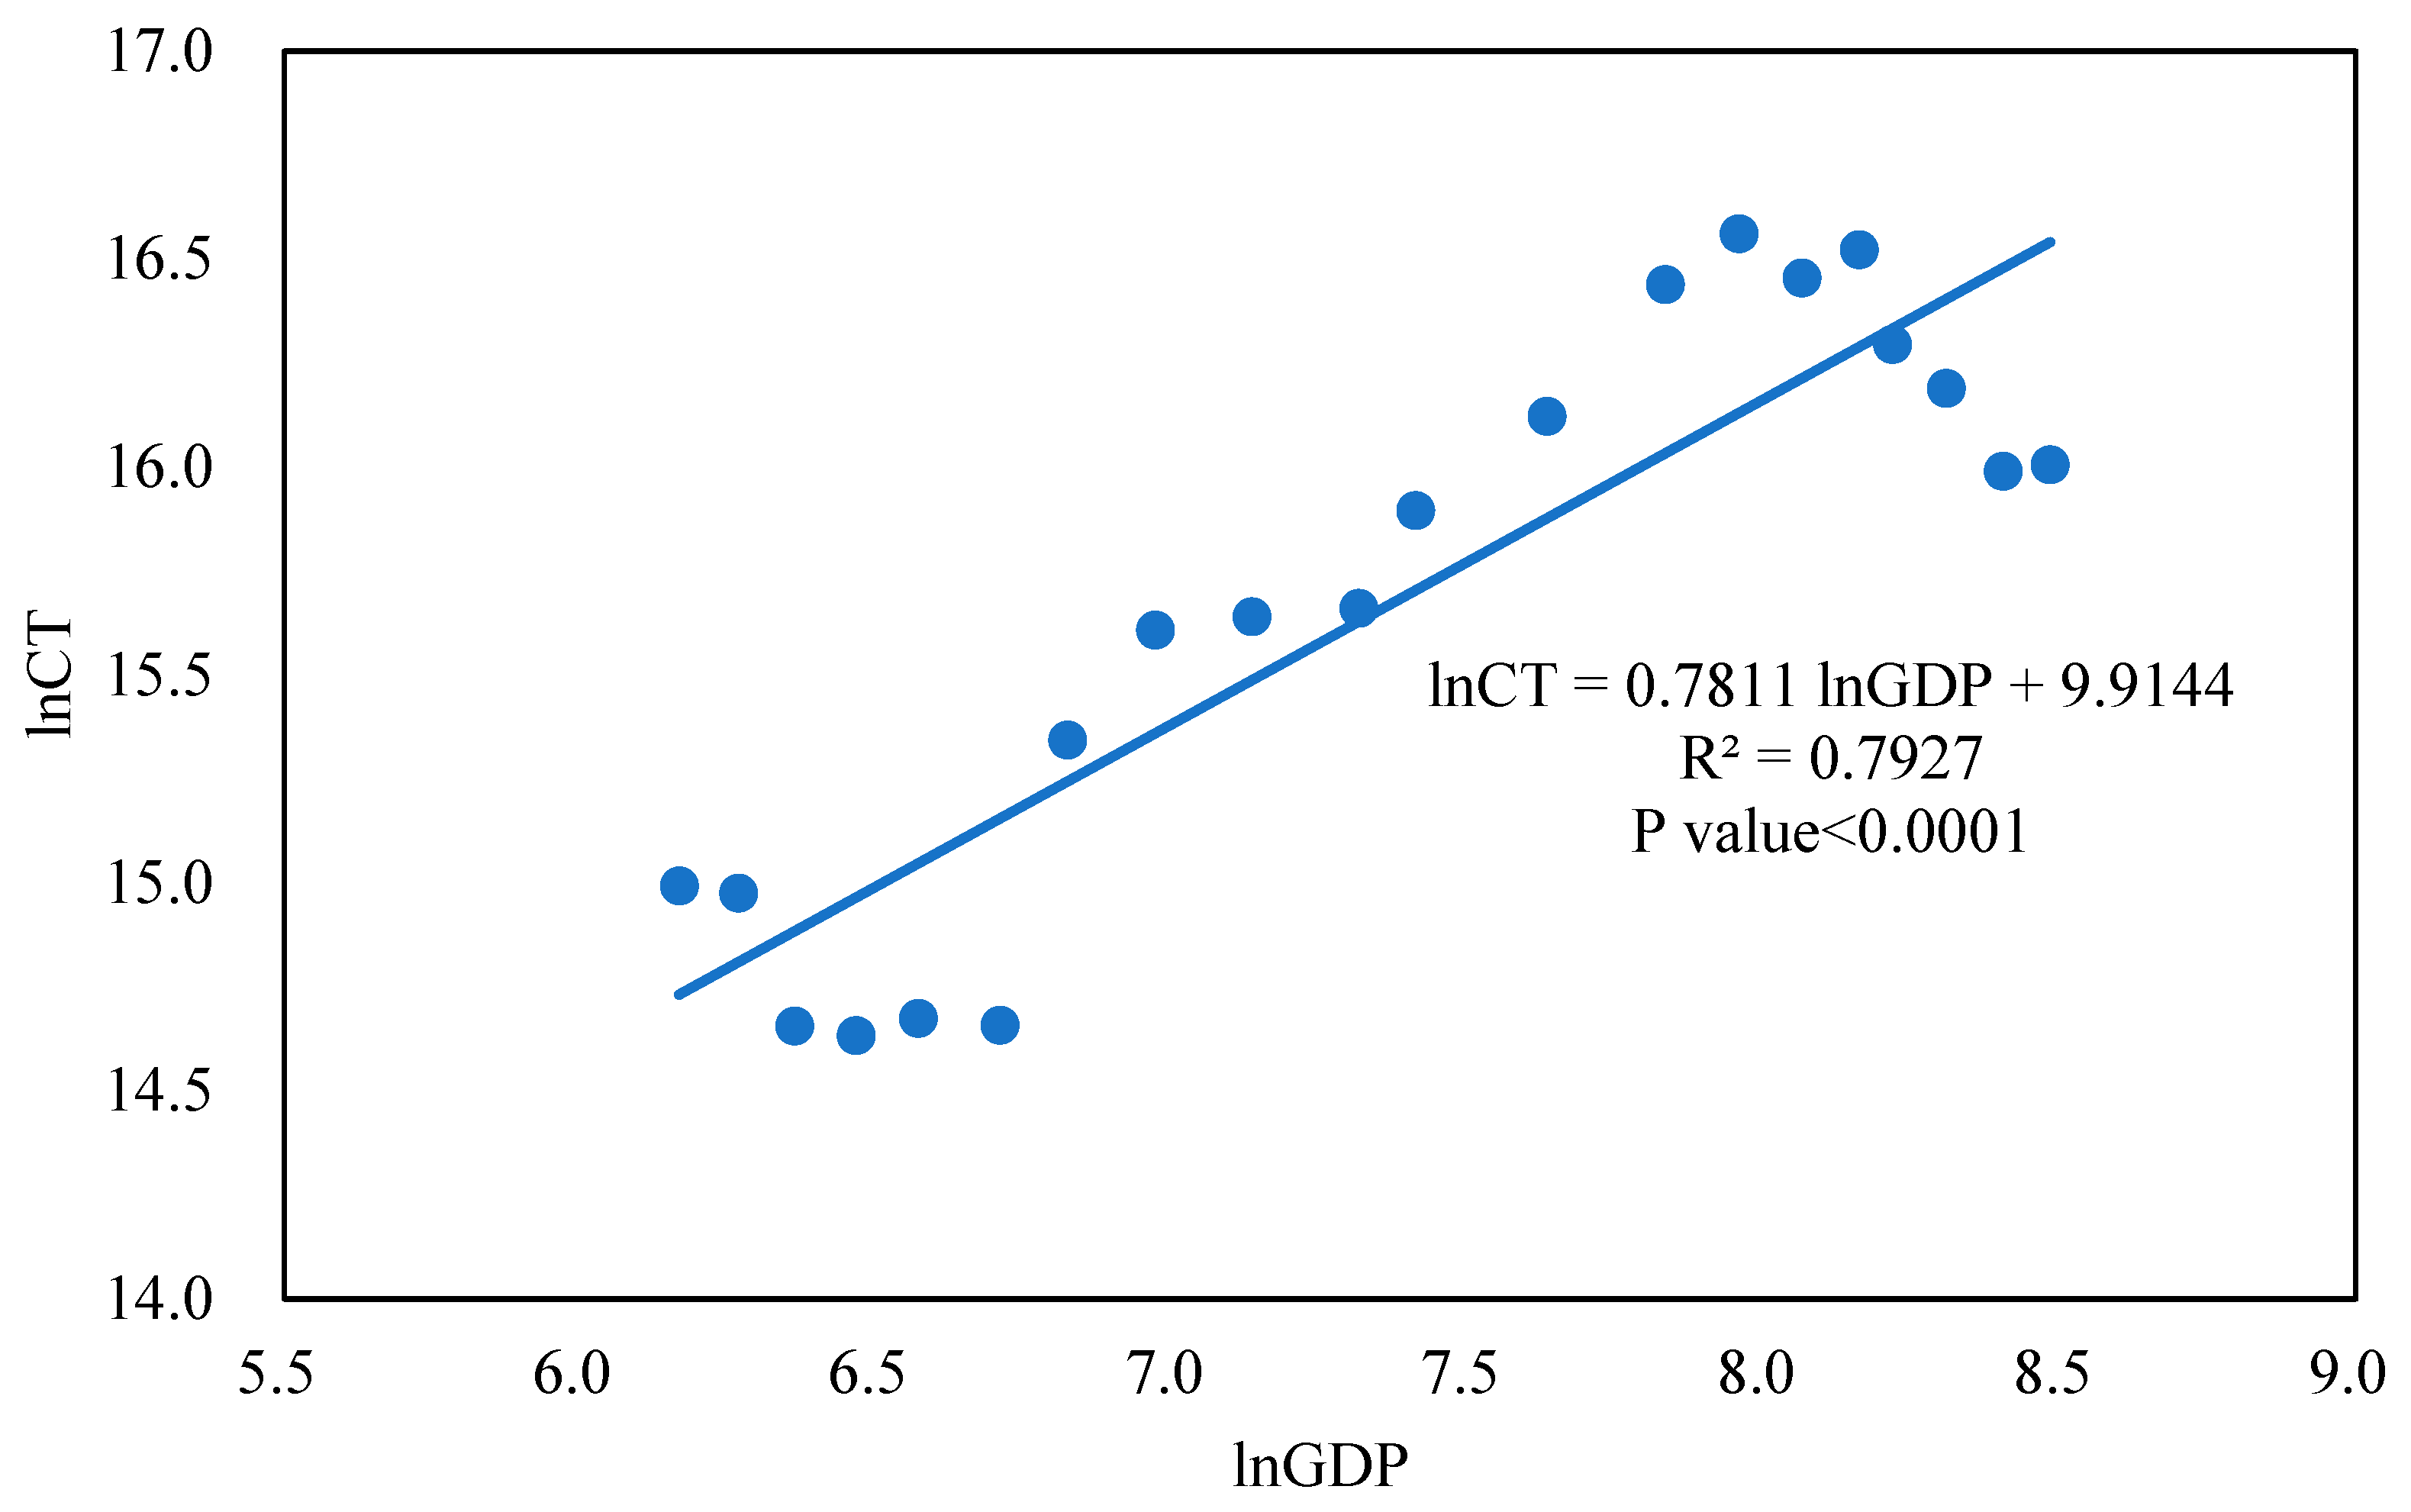
Using Hainan Province’s GDP and freight turnover data from 1999 to 2018, we fitted the logarithmic-linear model and obtained the regression results of ln(CT) for ln(GDP) as shown in
Figure 3, with an R
2 of 0.7927 and a P-test result under 0.0001.
According to the 14th Five-Year Plan of the National Economic and Social Development of Hainan Province and the Long-Range Objectives Through the Year 2035, the annual growth rate of GDP in Hainan Island is expected to be 10% from 2020 to 2030. Based on the logarithmic-linear model fitting results, we predicted the freight turnover on Hainan Island in 2025 and 2030. The results show that in 2025 and 2030, Hainan Island’s road freight turnover will be about 2.5 times and about 3.0 times that of 2018, respectively. The overall VKT (average annual mileage of MHDTs) is estimated to grow by 25% in 2025 and 2030 according to the development need for the construction of free trade pilot zone, while the overall LF (average load of MHDTs) is estimated to remain constant. Based on the prediction above and the vehicle population of Hainan Island in 2019, we used Equation (2) to predict the number of MHDTs on Hainan Island in 2025 and 2030. The results show that the number of MHDTs on Hainan Island will reach about 54,000 in 2025 and 66,000 in 2030, as shown in
Table 1.
3.3. Zero-Emission Layout Plan for MHDTs
Based on the findings in
Section 3.1 and
Section 3.2, we designed a future (medium- and long-term) zero-emissions (electrification or hydrogen fuel cell) plan for MHDTs on Hainan Island, including a spatial layout plan design and a vehicle type categorization plan design. The differences between the two plans are as follows: the spatial layout plan was developed by classification according to the situation of various cities and counties on Hainan Island, prioritizing major logistics distribution centers (OD points) for a zero-emissions plan. The vehicle type categorization plan constructs a zero-emission layout by classification according to the degree of difficulty in electrifying various vehicle types.
Both plans set the number of MHDTs according to the prediction results in
Section 3.2, i.e., at 54,000 in the medium term and 66,000 in the long term. The sales ratio of various vehicle types from 2015 to 2019 was used to represent the ratio of each vehicle type in the predicted years. Currently, the service life of MHDTs is set to ten years, so this plan does not consider the issue of the scrapping and renewal of zero-emission trucks. The medium-term plan was set for 2025 and the long-term plan for 2030.
3.3.1. Spatial Layout Plan
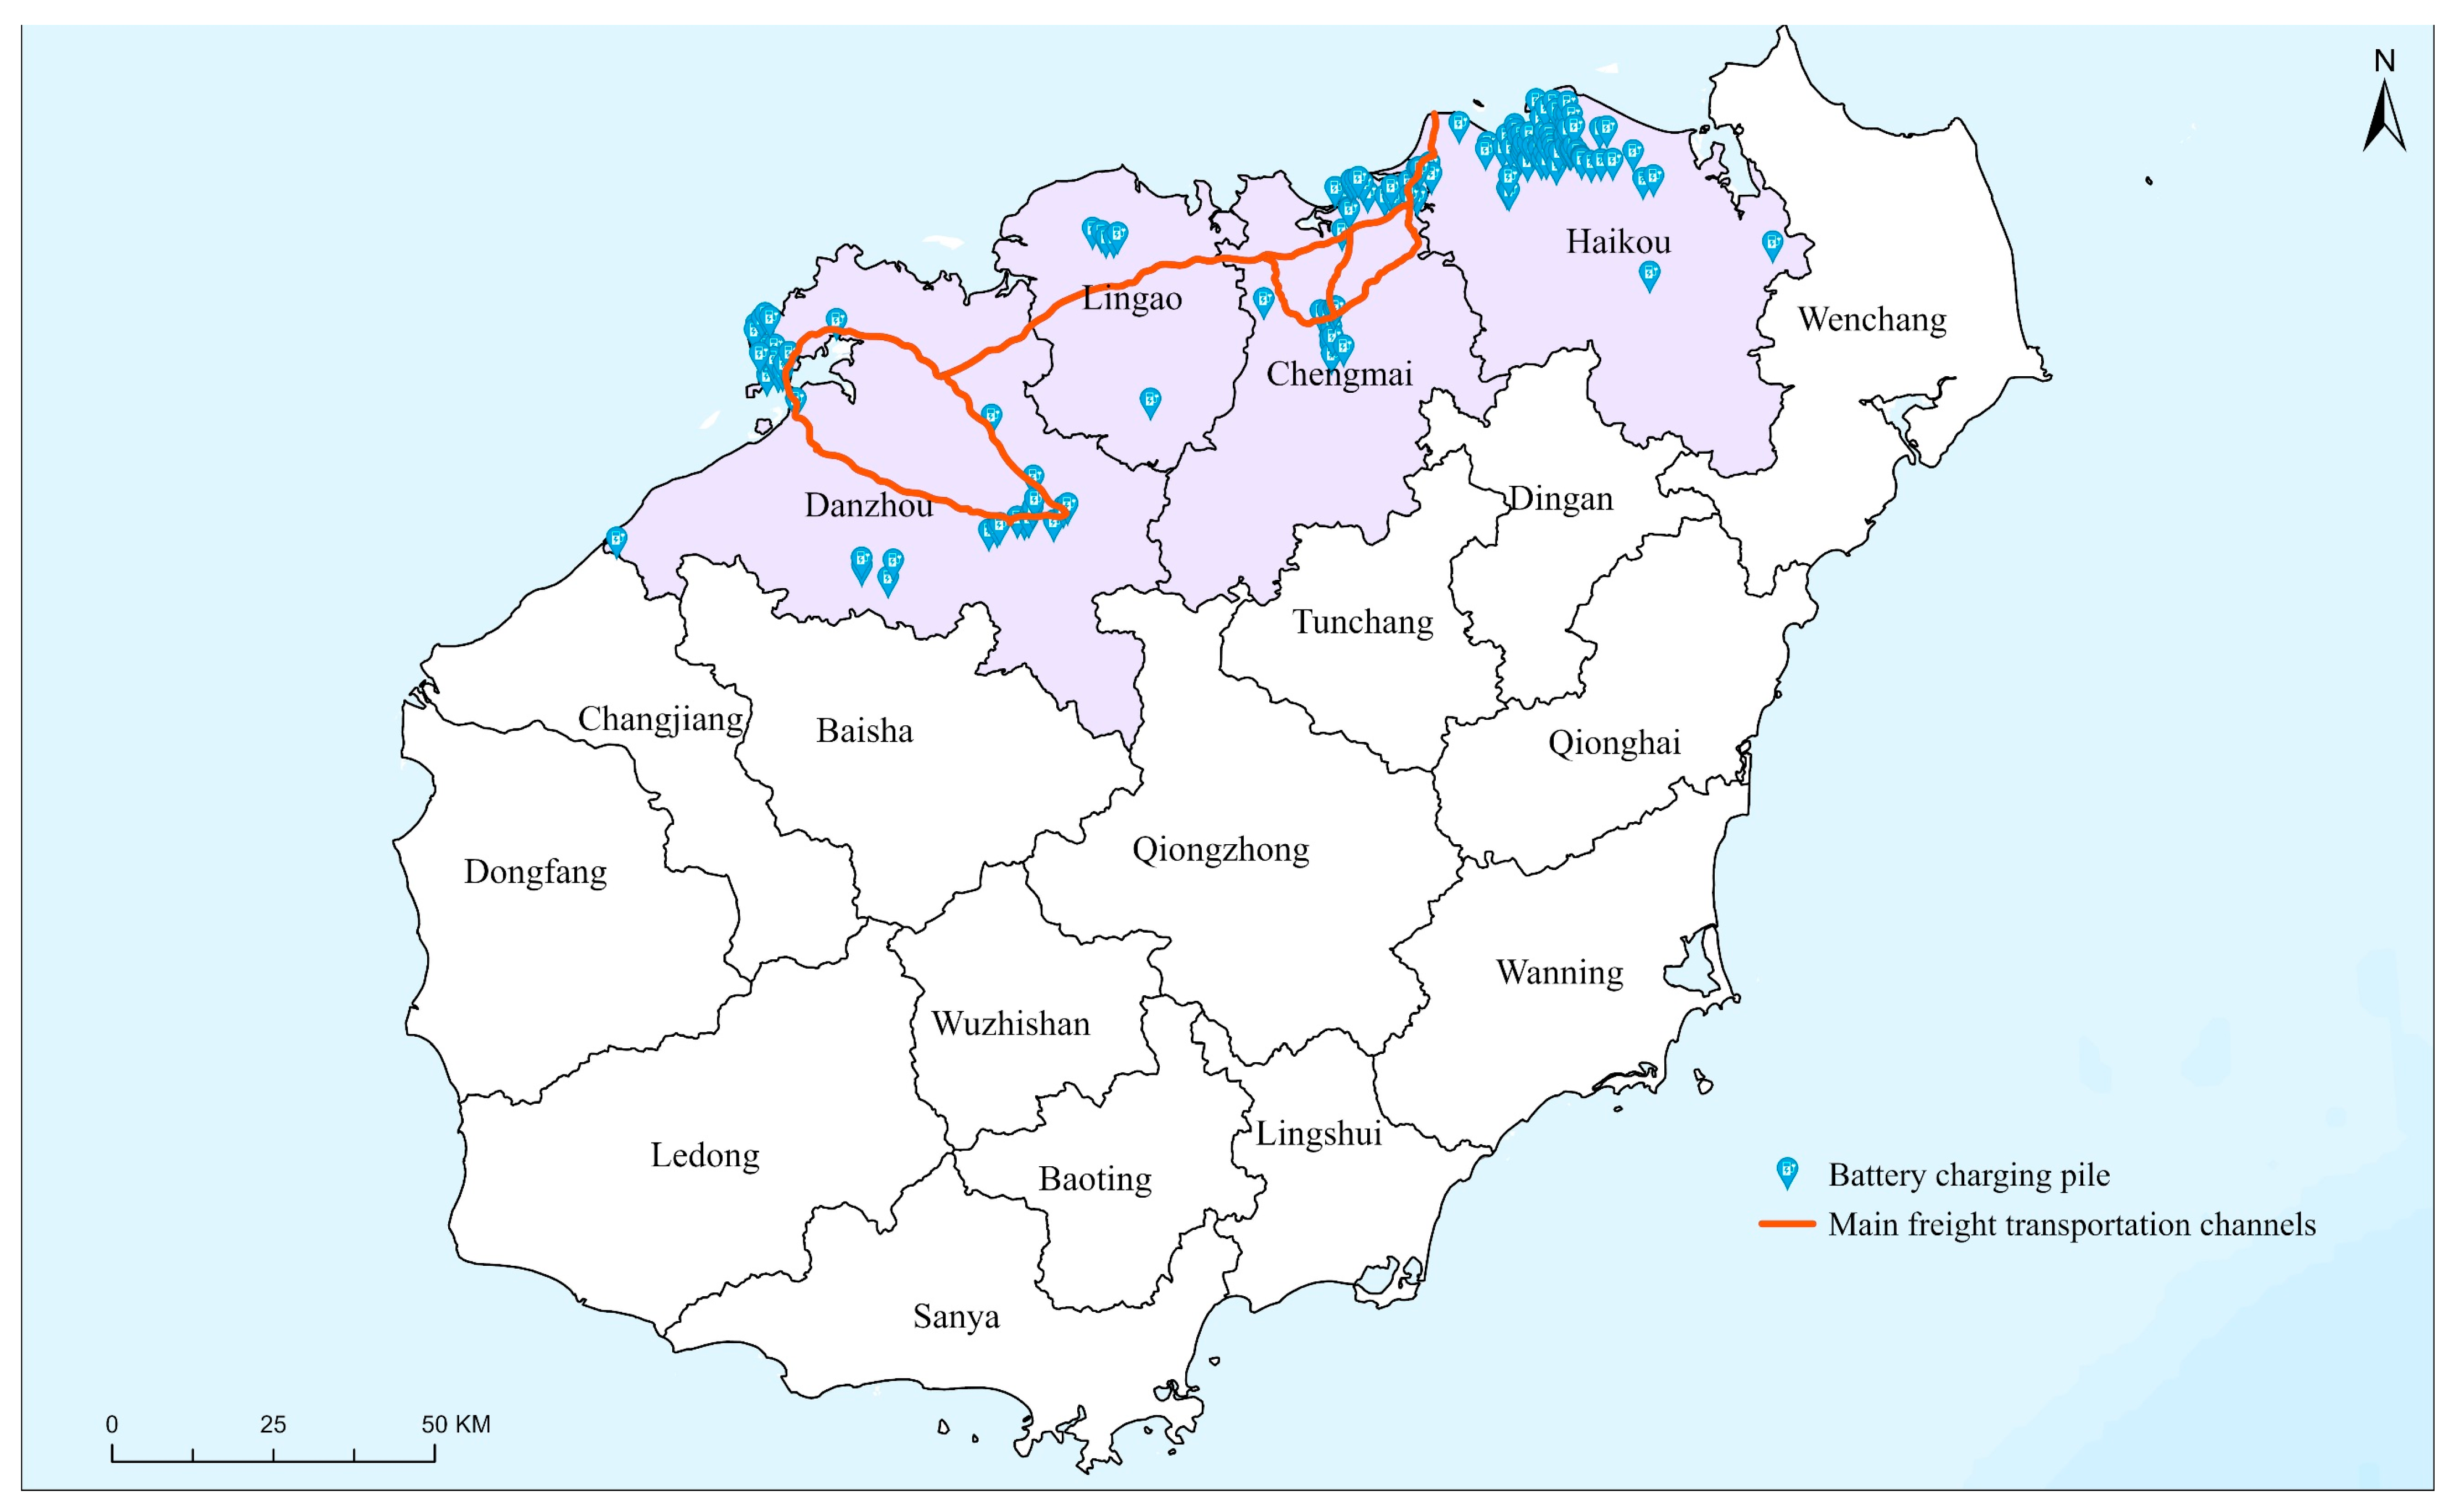
According to the results of the intercity truck transportation channel in this study, the recommended electrification pilot areas in the medium-term plan are Haikou, Danzhou, Chengmai county, and Lingao county, as well as the ports of Haikou and Yangpu, forming a northern Hainan electrification corridor. This region has the following characteristics: it only includes four counties or municipalities, but the number of trucks accounts for about half of the province’s total; the counties and municipalities in the region are close to ports, with a higher concentration of industrial enterprises and shorter freight transportation distances, which are more conducive to the application of electric trucks; and Haikou and Yangpu Ports account for 56% of the total throughput of the province’s ports.
The medium-term plan involves the electrification of 27,000 MHDTs (23% medium-duty trucks and 77% heavy-duty trucks). As most vehicles belong to industrial enterprises and vehicle operation enterprises with few changes in industrial land, it is recommended that enterprises use their own land to arrange charging stations, adopting a charging station layout strategy, with service stations and dedicated charging stations in parking lots as the main focus and roadside emergency charging stations as a supplementary measure. With a 2:1 ratio, the medium-term plan calls for the installation of about 13,500 fast- or super-charging stations. Based on a single charging station construction cost estimate of CNY 110,000 (same as below), the investment needed for charging stations stands at CNY 1.5 billion. If a truck purchase subsidy is implemented, each electric heavy-duty truck will receive a subsidy of CNY 200,000–300,000 and each medium-duty truck will receive CNY 50,000–100,000, with a total subsidy amount of about CNY 5 billion.
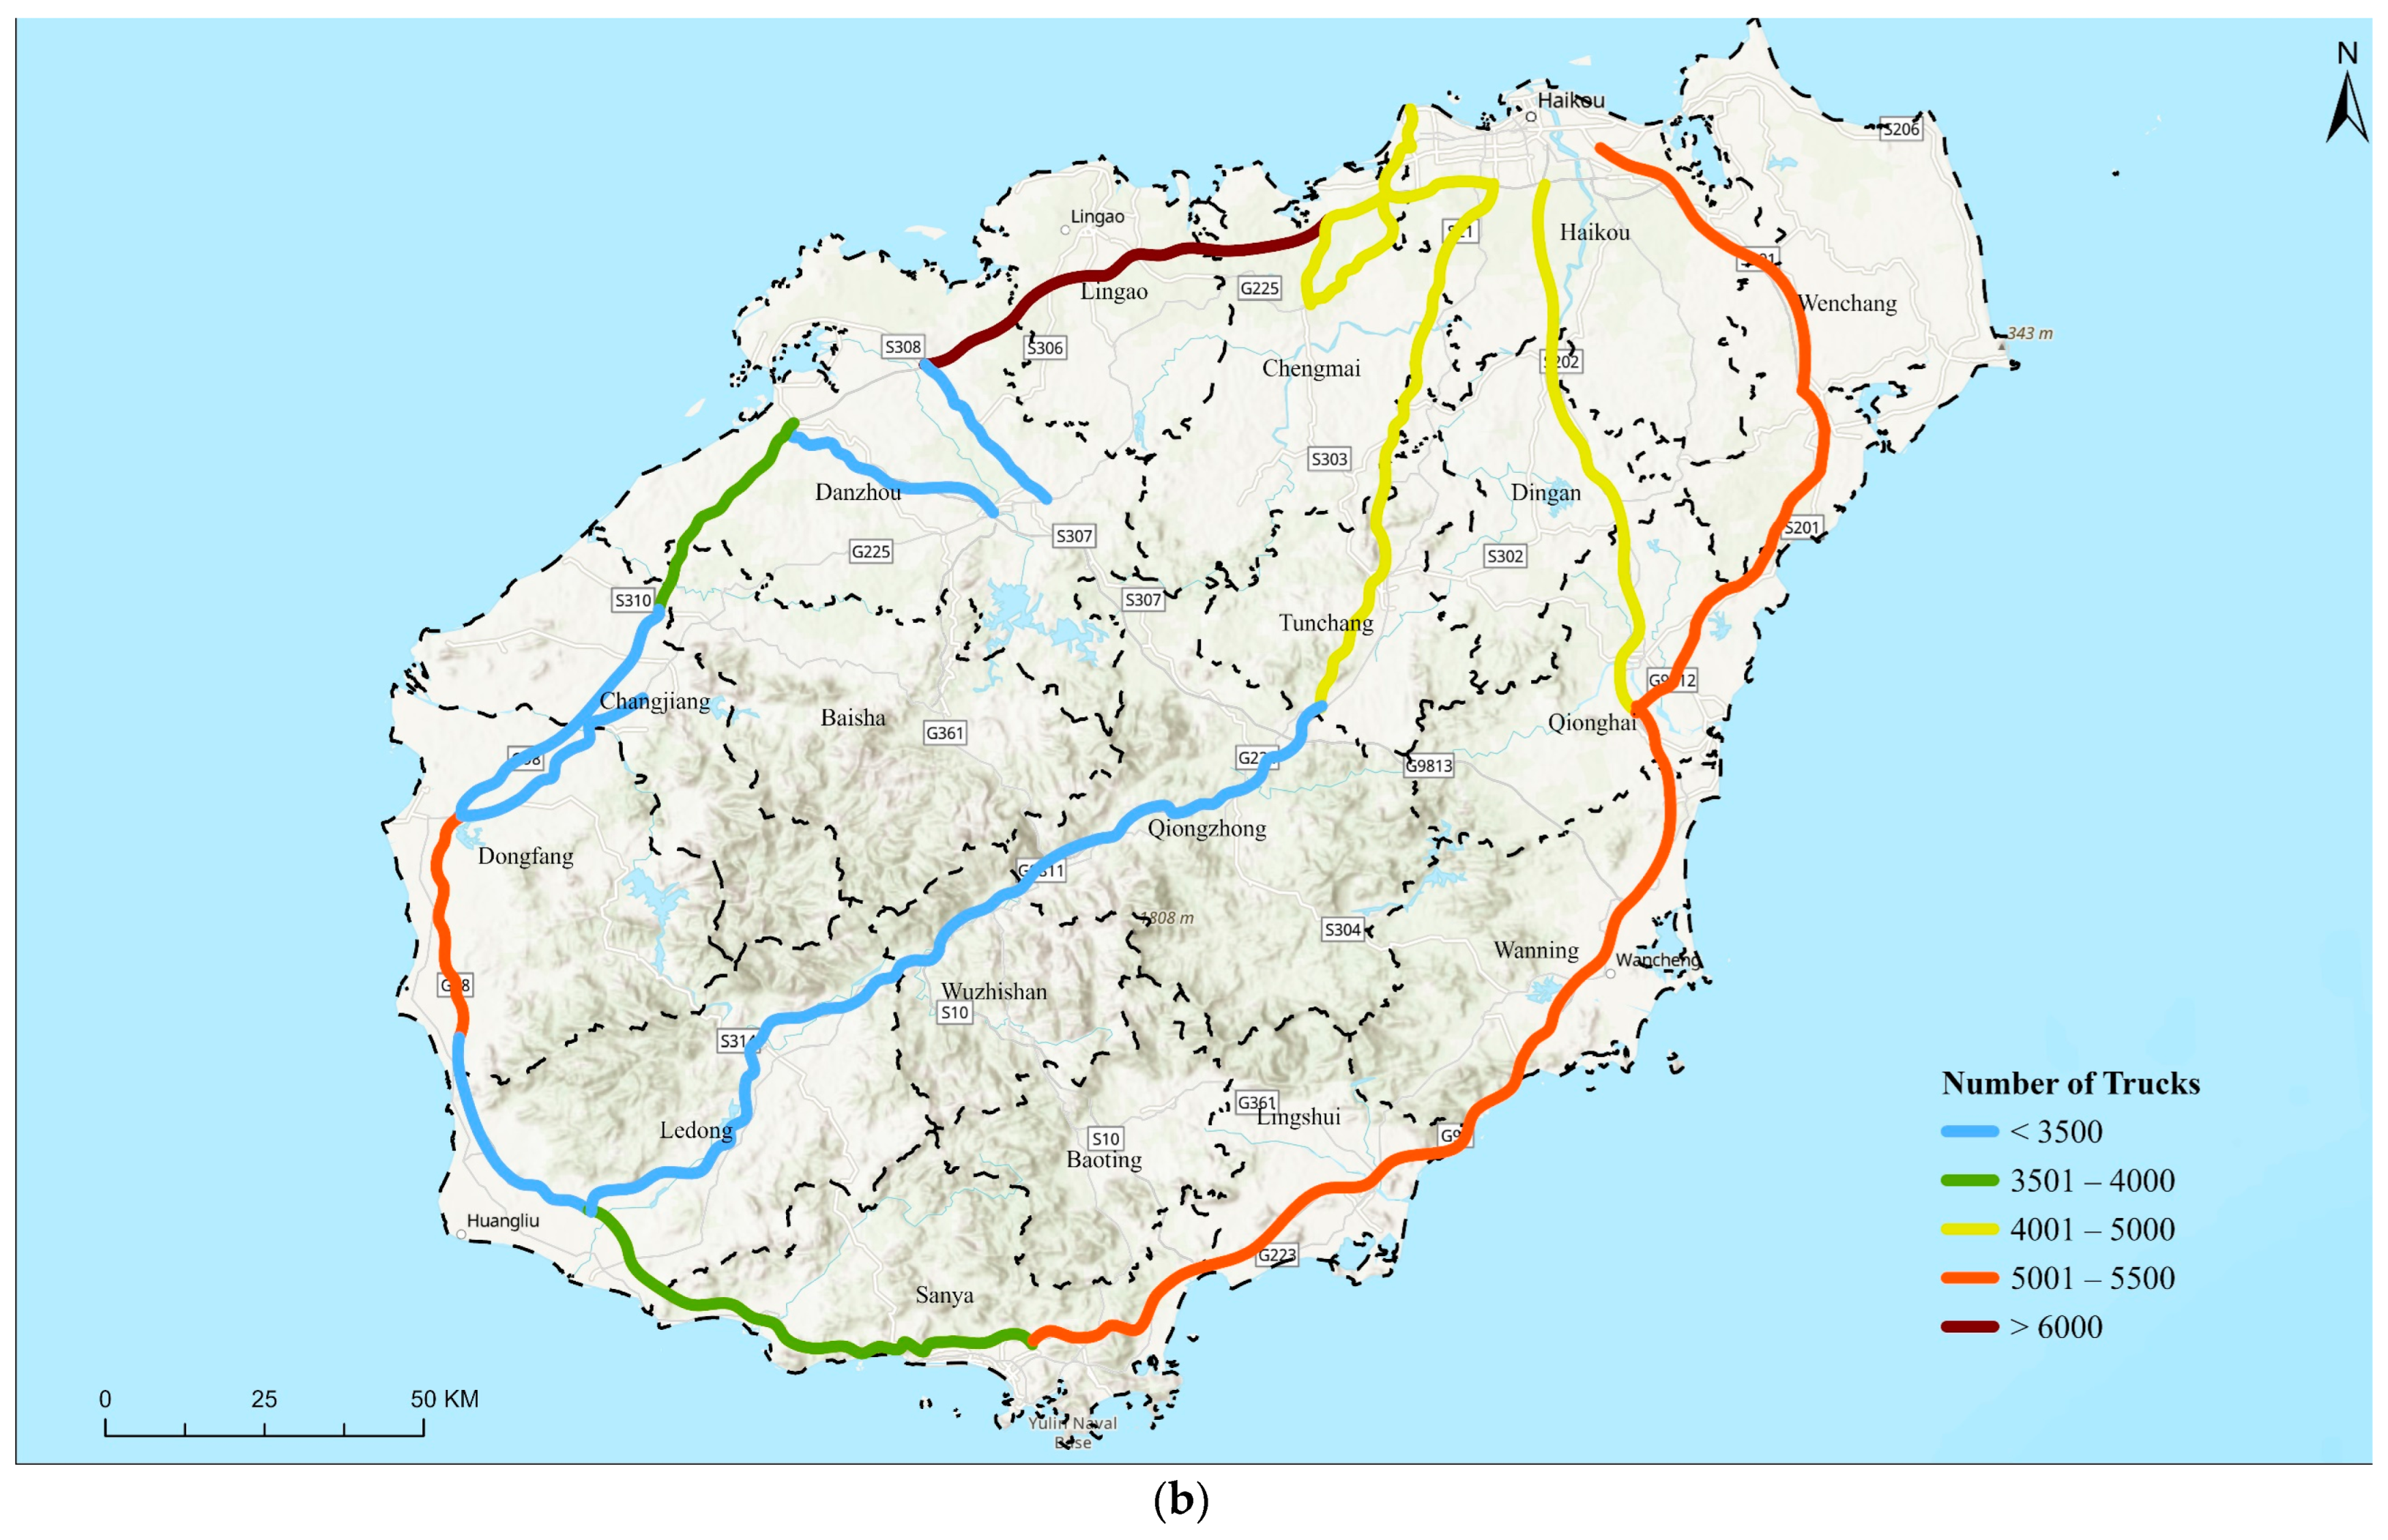
The specific layout plan for the medium term is shown in
Figure 4 (red roads are the main freight transportation channels).
Given that by 2030, the cost of heavy-duty electric trucks may basically be on par with diesel trucks [
30,
31,
32,
33], it is recommended that the long-term plan be set as follows: by 2030, all MHDTs will be zero emission (electric and hydrogen fuel cell vehicles).
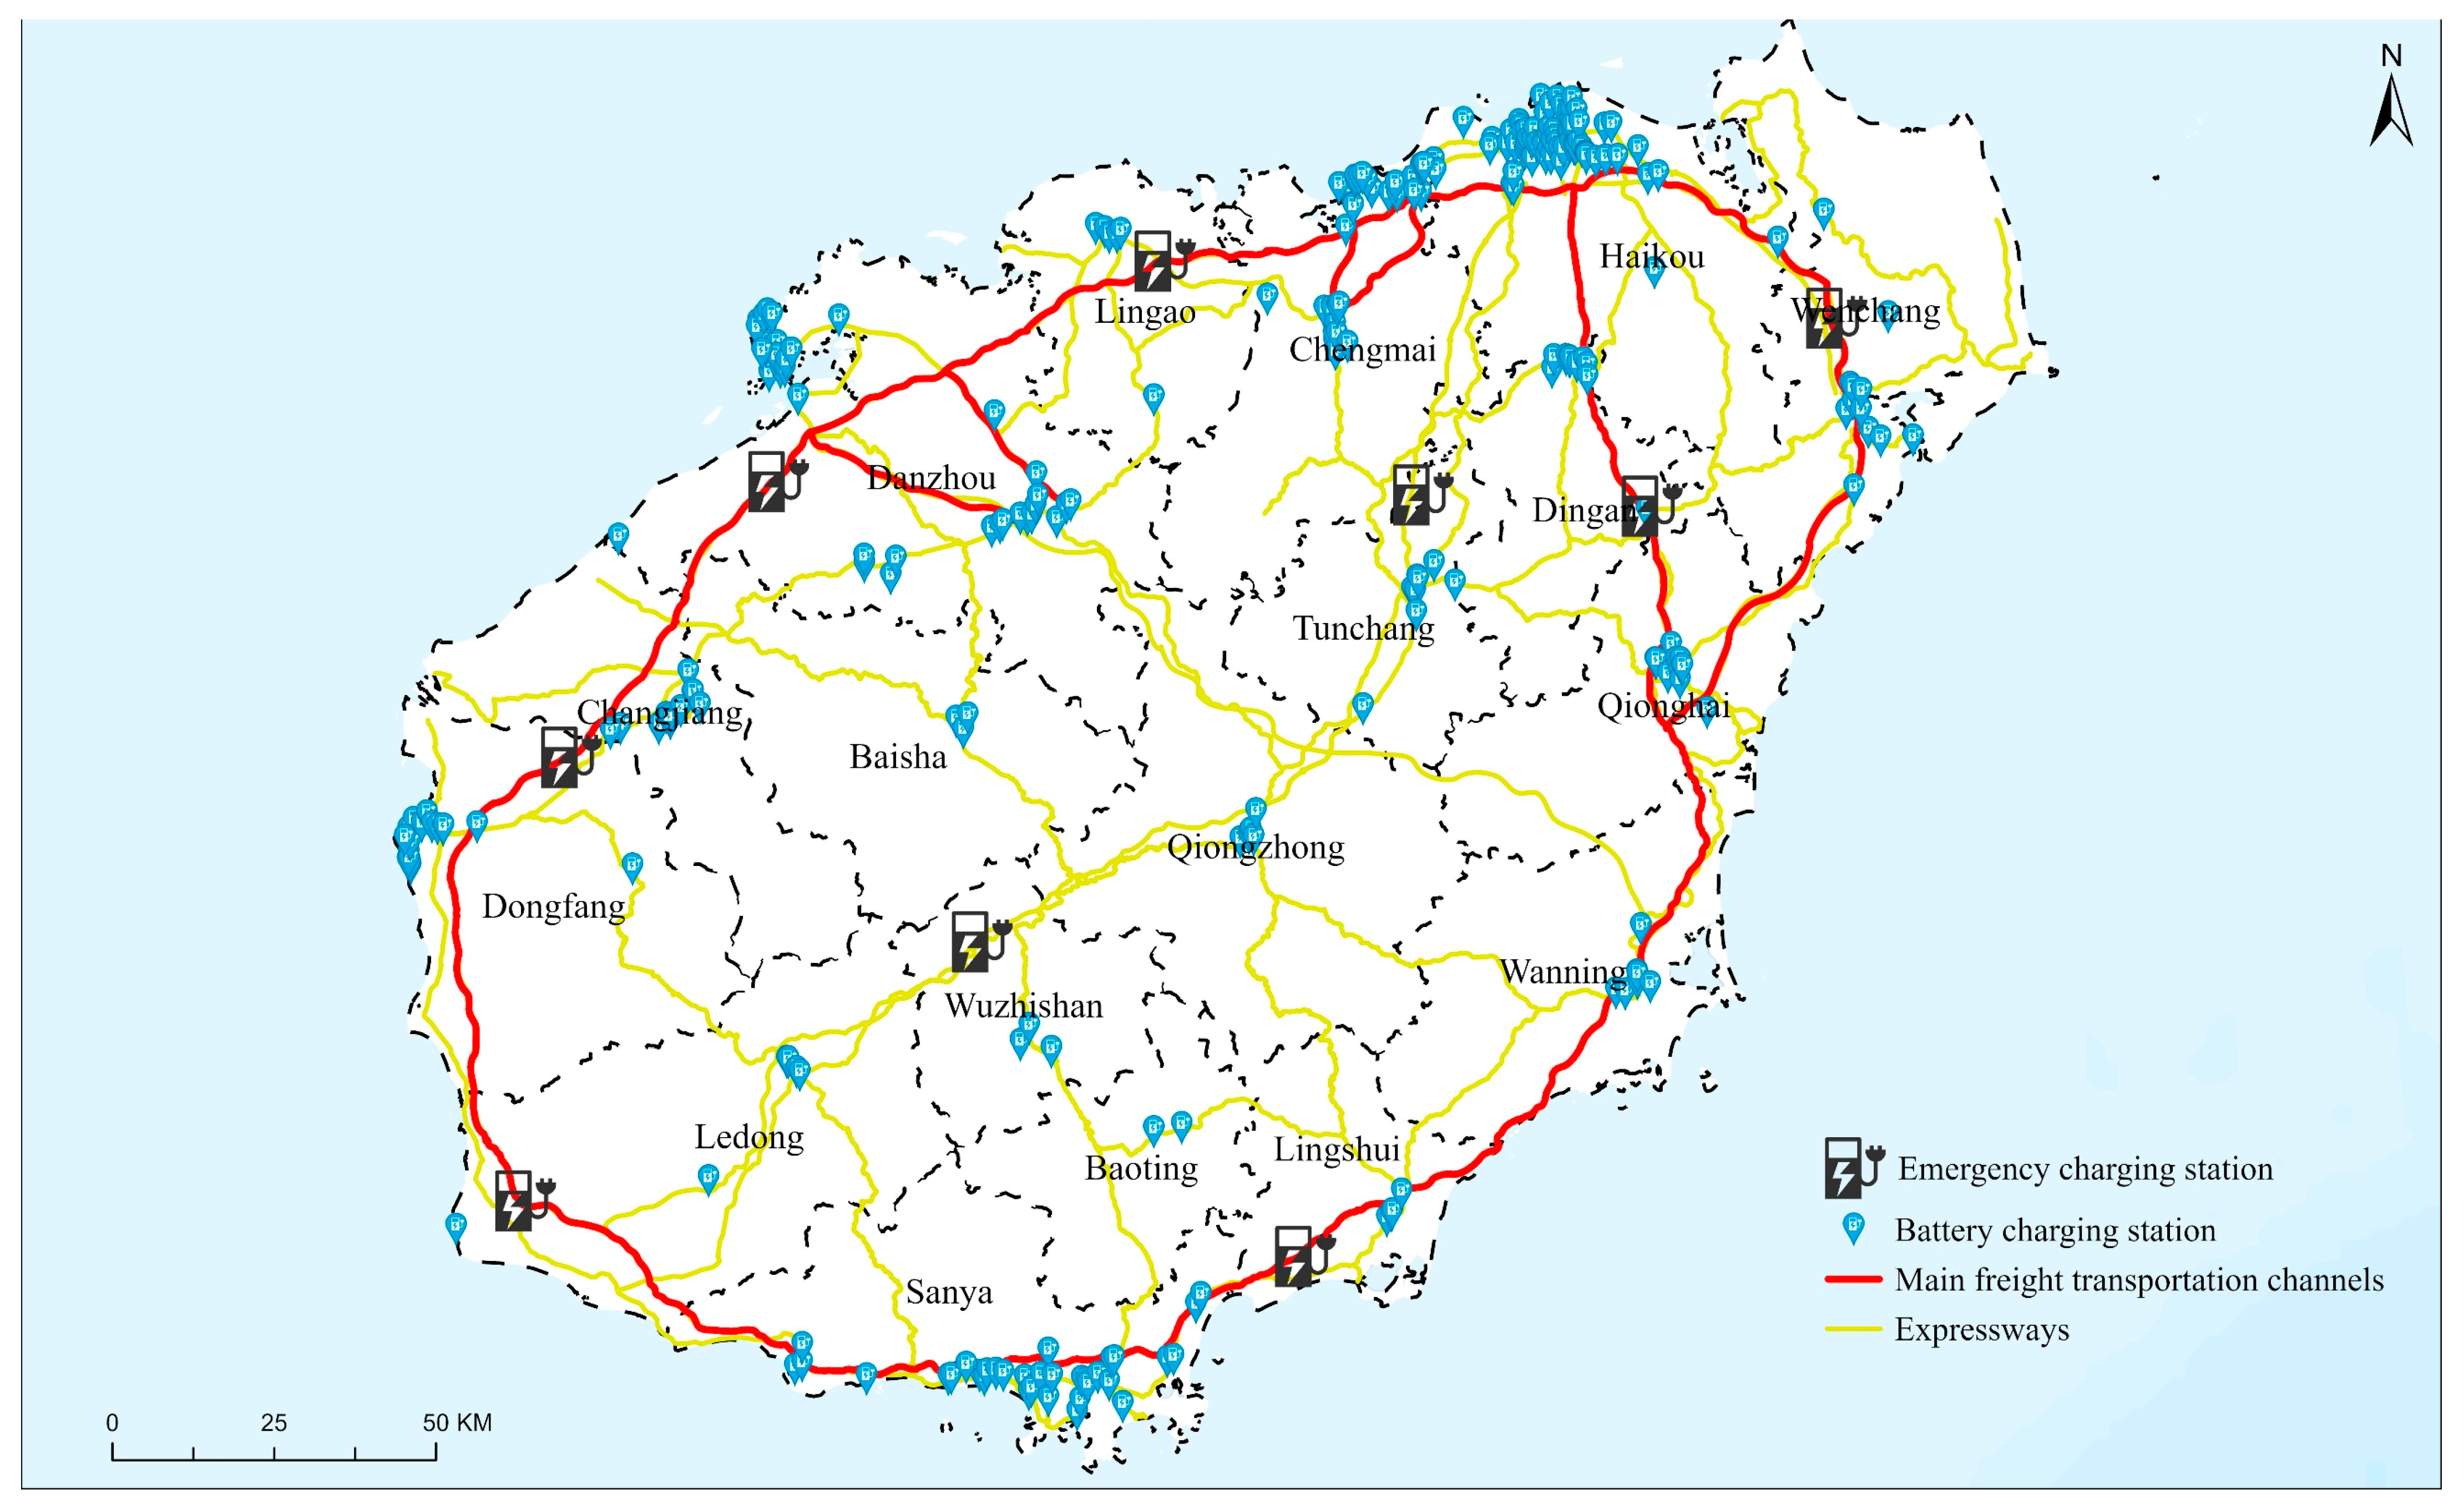
The long-term plan involves 66,000 MHDTs. Industrial enterprises and vehicle operation enterprises use their own land to arrange charging stations or hydrogen refueling stations, with service stations and dedicated stations in parking lots as the main focus and roadside emergency charging stations and hydrogen refueling stations as supplementary. Fast- and super-charging stations or hydrogen facilities are arranged in a 2:1 ratio, with a total of about 33,000 facilities. The accumulated investment cost for charging stations or hydrogen facilities is CNY 3.6 billion; if each heavy-duty truck purchase subsidy ranges from CNY 0 to 300,000 and each medium-duty truck subsidy is about CNY 0–100,000 (tiered, subsidies can be stopped after 2030), the accumulated subsidy amount is about CNY 7.5 billion.
The specific layout plan is shown in
Figure 5 (red roads are the main freight transportation channels).
3.3.2. Vehicle Type Categorization Plan
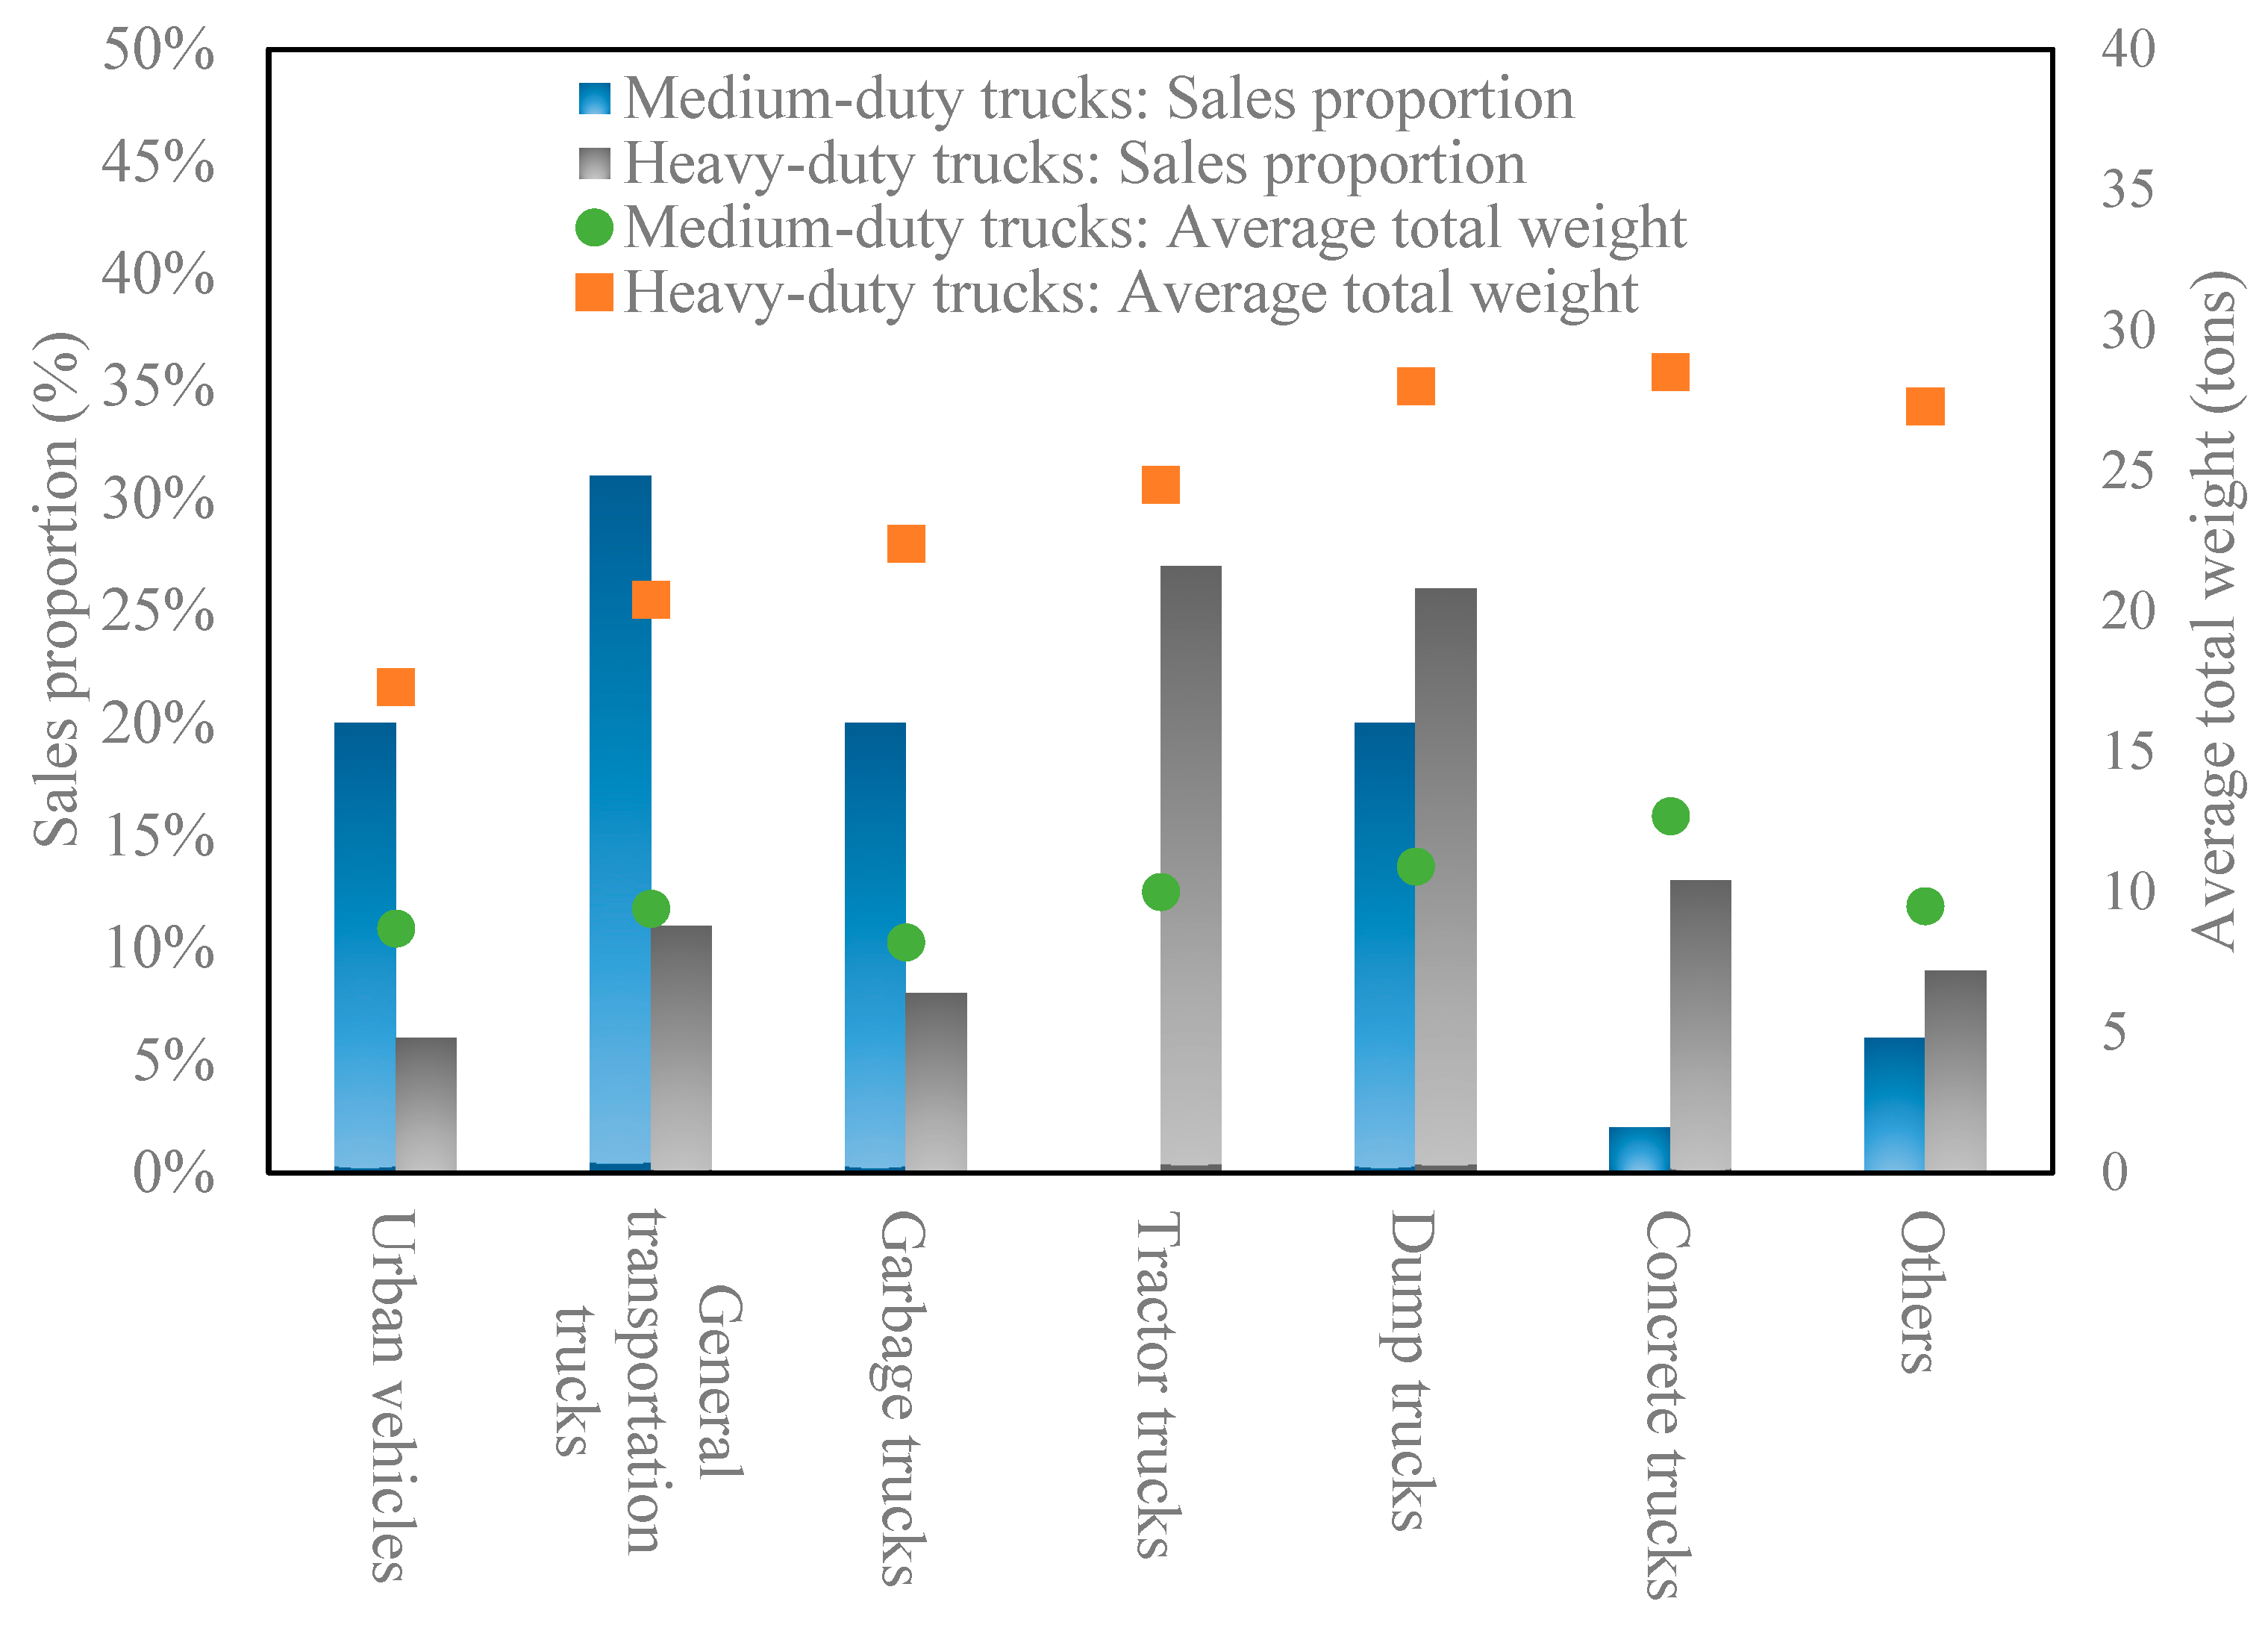
An analysis of the sales proportion and average total weight of various types of MHDTs on Hainan Island from 2015 to 2019 is shown in
Figure 6. The average total weight of each type is calculated based on the gross vehicle weight of each vehicle and the sales proportion of each type. It is assumed that by 2030, the sale proportions of various vehicle types will remain unchanged.
For the medium term (2025), urban vehicles, general transportation trucks, and garbage trucks with a relatively low average total weight among MHDTs are selected as the prioritized target vehicles for electrification. To promote the electrification of heavy-duty trucks in key industries, more than 4000 heavy-duty trucks for short-haul transportation to ports, mining machinery, and major industrial enterprise internal transportation are selected. This achieves the goal of electrifying 27,000 MHDTs by 2025 (consistent with the number of electrified vehicles in the spatial layout plan). If purchase cost subsidies are provided, each heavy-duty truck will receive a subsidy of CNY 200,000–300,000 and each medium truck will receive a subsidy of CNY 50,000–100,000. By 2025, the accumulated subsidy amount will be approximately CNY 3.8–4 billion. According to the 2:1 ratio of fast-changing stations to supercharging stations, about 13,500 charging stations will be installed in the medium term. By 2025, the accumulated investment cost for charging stations will reach CNY 1.5 billion.
The long-term plan’s goal is designed so that by 2030, all MHDTs on Hainan Island will have zero emissions. By 2030, the total number of zero-emission MHDTs will be about 66,000. If purchase cost subsidies are provided, each heavy-duty truck will receive a subsidy of CNY 0–300,000 and each medium truck will receive approximately CNY 0–100,000 (tiered; subsidies can be stopped after 2030). By 2030, the accumulated subsidy amount will reach about CNY 6.7 billion. With a 2:1 ratio of fast-changing stations to supercharging stations or hydrogen facilities, about 33,000 charging stations or hydrogen facilities will be installed. Based on a single changing station construction cost estimate of CNY 110,000, the accumulated investment cost for charging stations will reach CNY 3.6 billion by 2030.
The numbers of various types of MHDTs in the 2025 and 2030 plans are shown in
Table 2.
3.4. Emission Reduction Potential
This study compared the exhaust pollutant and carbon dioxide emission reductions under the two layout scenarios. The results are shown in
Table 3. In the scenario without a zero emission promotion plan (i.e., the baseline scenario), without considering the decrease in carbon dioxide emissions brought by the future improvement in vehicle fuel efficiency, the implementation of the National VI standard will gradually reduce NOx and PM emissions from medium- and heavy-duty diesel trucks, despite the increase in the car parc.
In the two zero-emission layout scenarios of medium- and heavy-duty trucks, by 2025, the vehicle type categorization plan will lead to lower emission reductions of pollutants and carbon dioxide compared to the spatial layout plan. The main reasons are as follows:
- (1)
The vehicle type categorization plan prioritizes the electrification of medium-duty trucks. Since the pollutant emission intensity of medium-duty trucks is lower than that of heavy-duty trucks, the emission reduction effect is also lower.
- (2)
The vehicle type categorization plan will lead to a higher number of heavy-duty diesel trucks in 2025, and heavy-duty diesel trucks have a higher annual average mileage, resulting in higher carbon dioxide emissions.
In addition to the relatively higher emission reductions in the mid-term, the spatial layout plan has advantages such as a high operability and alignment with the designation of low-emission zones. Therefore, the spatial layout plan is recommended in this study.
4. Policy Recommendation
To promote the implementation of the zero-emission layout plan for MHDTs, the following policy recommendations are proposed based on existing policy planning.
First, a northern zero-emission freight pilot zone should be established to encourage ports and key vehicle-using enterprises to prioritize electrification. The zero-emission freight pilot promotion zone is designated as Haikou, Danzhou area, Chengmai county, and Lingao county, as well as the ports of Haikou and Yangpu. Priority is given to the preliminary implementation of electric vehicles in Haikou, Yangpu, and Basuo ports. For port vehicles, it is suggested to consider setting up battery swapping stations in port areas and test the operation of trackless dual-source electric vehicles. Corresponding incentive policies should be developed to encourage large vehicle users to adopt new energy vehicles, such as exempting enterprises that meet clean transportation requirements from production restrictions in heavily polluting weather conditions and providing preferential policies to fleets that reach the specified number of vehicles and annual mileage per vehicle.
Second, subsidies should be provided for purchasing and using zero-emission medium- and heavy-duty vehicles, along with policies such as discount tolls. Before the TCO of electric heavy-duty trucks equals that of diesel trucks in 2030, it is suggested that purchase and operation subsidies are offered in Hainan. Hainan can encourage major users of trucks, such as steel and cement companies, to adopt zero-emission vehicles by leveraging the performance-based classification system in key industries and other policies and providing subsidies to entities that replace their old vehicles with zero-emission alternatives. The province can also coordinate with power grid companies to ensure low-cost grid access for designated charging and battery swapping facilities and provide reasonable subsidies for their construction and operation. Moreover, the provincial government should adopt policies that grant zero-emission vehicles preferential treatment on the road, such as exemption from traffic restrictions based on license plates and reductions or waivers of highway and bridge tolls.
Third, the construction of charging stations should be accelerated to ensure the operation of electric trucks. Taking the period from 2020 to 2025 as the fast-charging infrastructure introduction period, the differences in charging station coverage in coastal and central areas should be comprehensively considered and Haikou, Danzhou, and Chengmai and Lingao counties should be prioritized. Based on the regional differences in the promotion of new energy vehicles, operators should receive support and guidance in building a certain proportion of charging stations in the planned areas, as well as support in terms of land supply, charging facilities, power transmission and distribution network construction, electricity charging prices, approval processes, market access, and the introduction of advanced technologies. Full coverage of fast-charging facilities for trucks on the entire island is expected to be achieved by 2030, ensuring worry-free travel for electric trucks.
5. Conclusions
This study took Hainan Island as an example and investigated the promotion path for zero-emission MHDTs. The following conclusions were reached:
First, through GIS, transportation volume, and traffic flow analyses, it was found that the main OD points of freight transportation on Hainan Island are concentrated in the northern region, namely the surrounding areas of Haikou, the important port line of Haikou–Yangpu–Basuo, and Chengmai and Tunchang counties.
Second, using a logarithmic-linear model and the relationship between freight turnover and vehicle population, the numbers of MHDTs on Hainan Island in 2025 and 2030 were predicted. The number of MHDTs on Hainan Island will reach about 54,000 in 2025 and about 66,000 in 2030.
Third, a zero-emission layout of MHDTs in Hainan Island was constructed. The spatial layout plan focuses on regions, while the vehicle type classification plan focuses on different types of vehicles. Both plans would achieve comprehensive use of zero emission truck by 2030, reducing NOx emissions by 1549 tons, particulate matter (PM) emissions by 62 tons, and CO2 emissions by 3.60 million tons by 2030. Given that the spatial layout plan can achieve higher emission reductions in the medium term, this plan is recommended in this study.
In addition, this study proposes policy recommendations for the promotion of zero-emission MHDTs, including setting up a northern zero-emission freight pilot zone, formulating local zero-emission medium- and heavy-duty truck subsidies and road policies, and accelerating the construction of the supporting energy supply infrastructure such as charging stations and hydrogen refueling stations.
