Article

Remote Detection of Different Marine Fuels in Exhaust Plumes by Onboard Measurements in the Baltic Sea Using Single-Particle Mass Spectrometry

1
Joint Mass Spectrometry Center (JMSC), Chair of Analytical Chemistry, Faculty of Mathmatics and Natural Sciences, University of Rostock, 18059 Rostock, Germany
2
Department Life, Light and Matter (LLM), Interdisciplinary Faculty, University of Rostock, 18059 Rostock, Germany
3
Faculty of Mechanical Engineering, Institute of Chemistry and Environmental Engineering, University of the Bundeswehr Munich, 85577 Neubiberg, Germany
4
Joint Mass Spectrometry Center (JMSC), Cooperation Group “Comprehensive Molecular Analytics”, Helmholtz Zentrum München, 85764 Neuherberg, Germany
5
Leibniz-Institute for Baltic Sea Research Warnemünde (IOW), 18119 Rostock, Germany
6
Photonion GmbH, 19061 Schwerin, Germany
7
Institute for Environmental Studies, Faculty of Science, Charles University, 128 00 Prague, Czech Republic
*
Author to whom correspondence should be addressed.
Atmosphere 2023, 14(5), 849; https://doi.org/10.3390/atmos14050849
Submission received: 31 March 2023 / Revised: 28 April 2023 / Accepted: 8 May 2023 / Published: 10 May 2023
(This article belongs to the Special Issue Atmospheric Shipping Emissions and Their Environmental Impacts)

Abstract

:
Ship emissions are a major cause of global air pollution, and in particular, emissions from the combustion of bunker fuels, such as heavy fuel oil (HFO), show strong impacts on the environment and human health. Therefore, sophisticated measurement techniques are needed for monitoring. We present here an approach to remotely investigating ship exhaust plumes through onboard measurements from a research vessel in the Baltic Sea. The ship exhaust plumes were detected from a distance of ~5 km by rapid changes in particle number concentration and a variation in the ambient particle size distribution utilizing a condensation particle counter (CPC) and a scanning mobility particle sizer (SMPS) instrument. Ambient single particles in the size range of 0.2–2.5 µm were qualitatively characterized with respect to their chemical signature by single-particle mass spectrometry (SPMS). In particular, the high sensitivity of the measurement method for transition metals in particulate matter (PM) was used to distinguish between the different marine fuels. Despite the high complexity of the ambient aerosol and the adverse conditions at sea, the exhaust plumes of several ships could be analyzed by means of the online instrumentation.

1. Introduction

Ship emissions from global maritime cargo and passenger transport contribute significantly to global air pollution. Contrary to European and U.S. trends of overall air pollution reduction, shipping is subject to much lower rates of change and continues to emit high loads of PM2.5, sulfur, carbonaceous aerosols, and metals [1,2,3,4,5,6,7]. These pollutants are particularly known for their severe effects on the climate and human health. Between 60,000 and 400,000 premature deaths from respiratory diseases and lung cancer each year are attributed to ship emissions, as are 14 million cases of childhood asthma [8]. Countermeasures to date have included a global reduction of the permitted sulfur content in ship fuel to 0.5% fuel mass and to 0.1% in sulfur emission control areas (SECA). SECAs have been established in several coastal regions and ports worldwide, such as the entire North American coastal region, the North Sea, the Baltic Sea, and all European Union (EU) ports, to reduce air pollution from ship emissions [9]. Most vessels operating in SECAs use compliant low-sulfur fuels such as marine gas oil (MGO), but desulfurized hybrid blends of low-grade fuel are also in use [10]. In order to enable the use of lower-priced bunker fuel such as heavy fuel oil (HFO) in SECAs, exhaust gas scrubbers are installed in the downstream gas line, which significantly reduce SO2 emissions [5,11,12]. This exhaust gas treatment can also reduce the overall pollutant emissions of the gas and particle phases, which can have a positive effect on human health and the environment [12,13,14]. However, the reduction of the particle phase is often limited [5,11,12,15], so strong health and environmental effects are expected to remain, especially through the allowed use of low-grade bunker fuels when scrubbers are installed [16,17,18]. Previous studies have shown that the type of fuel has a major impact on the physical and chemical properties of emissions [19,20,21,22] and on their health effects [23,24]. Severe acute biological effects have also been shown for cleaner low-sulfur fuels such as MGO without filter technology; nevertheless, enhanced long-term effects could be demonstrated with the combustion of HFO [24].
Currently, numerous ships in SECAs around the world are taking advantage of the possibility of using low-cost bunker fuels in combination with SO2 scrubbers. The low effectiveness of scrubbers in terms of the particulate phase, their significant acute biological effects, and their long-term effects show the need for further research and regulation in this area.
Compliance monitoring is therefore important, but this requires the large-scale use of sophisticated measurement technology. Routine monitoring sites usually rely on gas phase measurements of carbon dioxide (CO2) and sulfur dioxide (SO2) in plumes from passing ships at bridges or port entrances [25,26]. Since these control points are well known, random onboard controls with sampling are conducted [10], as are occasional airspace monitoring by unmanned aerial vehicles at short distances [27] and surveillance flights at longer distances [28]. Particles often reveal very specific and source-related physical and chemical properties and are often transported by the wind over long distances. This enables the analysis of particulate matter (PM) from a distance of several hundred meters to several kilometers on board control vessels [29,30,31,32], but also from land-based measuring stations downwind of shipping lanes, measuring ambient air while recording the ship transponder data (automatic identification system, AIS) [33]. Measurements of PM from ship exhaust have even been successfully performed over distances up to 38 km [6,34,35]. These measurements of particle number concentrations and size distribution changes require clean air conditions; if not, they are reliant on individual marker substances.
Especially in densely populated coastal regions with highly complex aerosols, measurement techniques rely on specific marker substances for source apportionment, which are combinations of the transition metals V, Fe, and Ni for ship emissions [36,37]. Single-particle mass spectrometry (SPMS) is capable of detecting these metals in real time [38,39] and has been used in several studies in ports and other land-based monitoring stations to document air pollution from ships [40,41,42]. It has demonstrated the ability to distinguish between distillate fuel combustion and bunker fuel operation [43,44,45,46].
In this study, we apply SPMS to detect individual ship exhaust plumes from several kilometers away in combination with number-based measurement techniques such as condensation particle counters (CPC) and scanning mobility particle sizers (SMPS) on board the research vessel (RV) Elisabeth Mann Borgese in Lübeck Bay, Baltic Sea. Measurement systems such as SMPS and CPC provide a reliable standard measurement technique for determining the size-related number concentration in ambient air. Therefore, the systems are suitable for ambient air monitoring and rapid detection of ship exhaust plumes. The integration of such number-based measurements and SPMS, which is able to perform real-time chemical characterization of individual particles, can offer a powerful combination for stationary and marine onboard measurements. This powerful combination of highly sensitive measurement instruments has not been used before for flexible marine onboard measurements of ship exhaust plumes, which is a major advantage over land-based and well-known measurement sites.

2. Materials and Methods

2.1. Single-Particle Mass Spectrometer

The SPMS instrument used in this project was manufactured by Photonion GmbH, Schwerin, Germany, and its detailed functionality has been described in several publications [47,48]. Briefly, the device is a bipolar time-of-flight mass spectrometer with an aerodynamic lens and an optical sizing unit, which is similar in basic concept to the ATOF-MS [49]. For velocimetric particle sizing, two 75 mW continuous wave lasers with a wavelength of 532 nm, ellipsoidal mirrors, and photomultipliers are employed. To obtain a considerably more compact design, the mass spectrometer was manufactured in Z-TOF geometry, which was introduced by Pratt et al. (2009) [50]. The instrument was equipped with a KrF excimer laser for ionization of the single particles (λ = 248.3 nm, PhotonEx, Photonion GmbH, Schwerin, Germany). As discussed in previous publications, this wavelength is very well suited for resonance-enhanced laser desorption/ionization (LDI) of iron and other transition metals [51], which is advantageous for the analysis of ship exhaust particles in ambient air. As already described by Passig et al. (2021), the optical setup was optimized to achieve a hit rate of about 50% (# mass spectra/sized particles) [46]. The lens (f = 200 mm) is brought to an off-focus position of 7 mm relative to the particle beam, resulting in a spot size of 150 × 300 µm and an intensity of 5 GW cm−2 at 6 mJ pulse energy [46,52].

2.2. Measurement Site and Aerosol Sampling

The measurements were carried out on board the German RV Elisabeth Mann Borgese in the Bay of Lübeck, about 10 km northeast of Travemünde, with the vessel anchored at the given position during the entire measurement period (54°01′31″ N, 011°04′10″ E). At this location, the incoming and outgoing ship traffic from Lübeck/Travemünde could be detected and analyzed from a distance of 2–5 km at westerly winds (Figure 1). The ambient air for ship emission analysis was sampled at around 20 m (height) above sea level upwind of the research vessel’s stack to avoid contamination from its own exhaust gas. Because of the large distance to the ships, particle enrichment technology was required for SPMS. For this purpose, an aerosol concentrator was used (model 4240, MSP Corp., Shoreview, MN, USA) [53], which concentrates particles from a 300 L min−1 intake air stream into a 1 L min−1 carrier gas stream. The particles then passed through an aerosol dryer (model MD-700-12S-1, Perma Pure LLC, Lakewood, NJ, USA) and were finally concentrated by an additional virtual impactor stage at the inlet of the SPMS to 0.1 L min−1 [54]. The initial concentrator was designed for particles above 1 µm, so the concentration factor for a 0.5 µm particle size is estimated to be 10:1 and drops rapidly for smaller particle sizes, as shown in previous studies [51,55]. For this reason and the detection limitation of SPMS for particles smaller than ~150 nm [49,56], the focus of SPMS data evaluation is placed here on particles in a size range of 0.25–2.5 µm rather than on the ultrafine size mode.
A second sampling line, which was not connected to the concentrator, was utilized to operate a condensation particle counter (CPC), a scanning mobility particle sizer (SMPS, both model 5420, Grimm Aerosol Technik GmbH & Co. KG, Ainring, Germany), and a miniature scanning electrical mobility sizer (mSEMS) with an advanced mixing-based condensation particle counter (aMCPC, Brechtel Manufacturing Inc., Hayward, CA, USA). The CPC was utilized for plume detection with a flow rate of 0.3 L min−1 and provided absolute number concentration data of ambient aerosol at a one-second resolution. The SMPS was operated at the same flow rate with a soft X-ray neutralizer, 3 L min−1 sheath flow, 130 voltage steps, and an up and down scan in a size range of 10–1000 nm. The mSEMS and aMCPC were equipped with an omnidirectional inlet (model 801567, TSI Inc., Shoreview, MN, USA) and operated at 0.27 L min−1 sample flow, 2 L min−1 sheath air flow, 120 size bins, and 63 s up and down scan in a size range of 5–300 nm.

2.3. Meteorological Data

Data on wind direction, wind speed, temperature, air pressure, and humidity could be determined by the measuring station on board (Table A1). The air trajectories were calculated with the interactive HYSPLIT web tool of the National Oceanic and Atmospheric Administration model GDAS with a 0.25° resolution (https://www.ready.noaa.gov/HYSPLIT.php, last accessed on 24 February 2023) [57].

2.4. Data Analysis

To identify the plumes emitted by the transiting ships, a condensation particle counter (CPC) was applied to determine the total number concentration, a scanning mobility particle sizer (SMPS), and mSEMS and aMCPC were used for the size distribution and particle mass concentration. If there was a significant change from the background at the same time in particle number, particle mass, and size distribution, ion marker screening was performed in the single-particle mass spectra during these time periods.
Raw time-of-flight mass spectrometer data were converted to nominal resolution mass spectra based on peak area using custom software on the Matlab platform (MathWorks Inc., Natick, MA, USA). Through ion marker screening, by using markers for ship emissions from LDI SPMS known from previous studies [40,43,44,45,46,58], it was possible to identify the ship exhaust plumes from single-particle data. The ion markers used to detect ship particles in the single particle mass spectra were 40Ca+, 51V+, 54/56Fe+, 58/60Ni+, and 67VO+ in the positive ion mass spectrum and 12nCn (numbers 1–9 were used for n), 97HSO4, and 80SO3 in the negative ion spectrum. The notation used here gives the nominal mass-to-charge ratio of the element or molecule under consideration, the element symbol or formula, and the charge. Since several carbon clusters can usually be observed in the spectrum of soot-containing particles, a general notation has been chosen here. Particles with a ratio of V/(V + Fe) > 0.1 and a signal >0.3 for 97HSO4 and the simultaneous presence of a carbon cluster and the above-mentioned metal ion signals represent particles from bunker fuel combustion. Particles with a ratio of V/(V + Fe) < 0.1, 40Ca+ > 0.1, a signal <0.1 for 97HSO4, and the simultaneous presence of carbon cluster ion signals represent particles from distillate fuel combustion.
To provide an overview of the particle types found in the ambient air, all particles were classified using the adaptive resonance theory neural network (ART-2a) [59], which is from the open-source toolkit FATES (Flexible Analysis Toolkit for the Exploration of SPMS data) [60]. The following parameters were used for the analysis: a learning rate of 0.05, a vigilance factor of 0.8, and 20 iterations. SPMS, in general, provides a number of individual particles with specific chemical signatures but not the mass concentration of these components.

3. Results

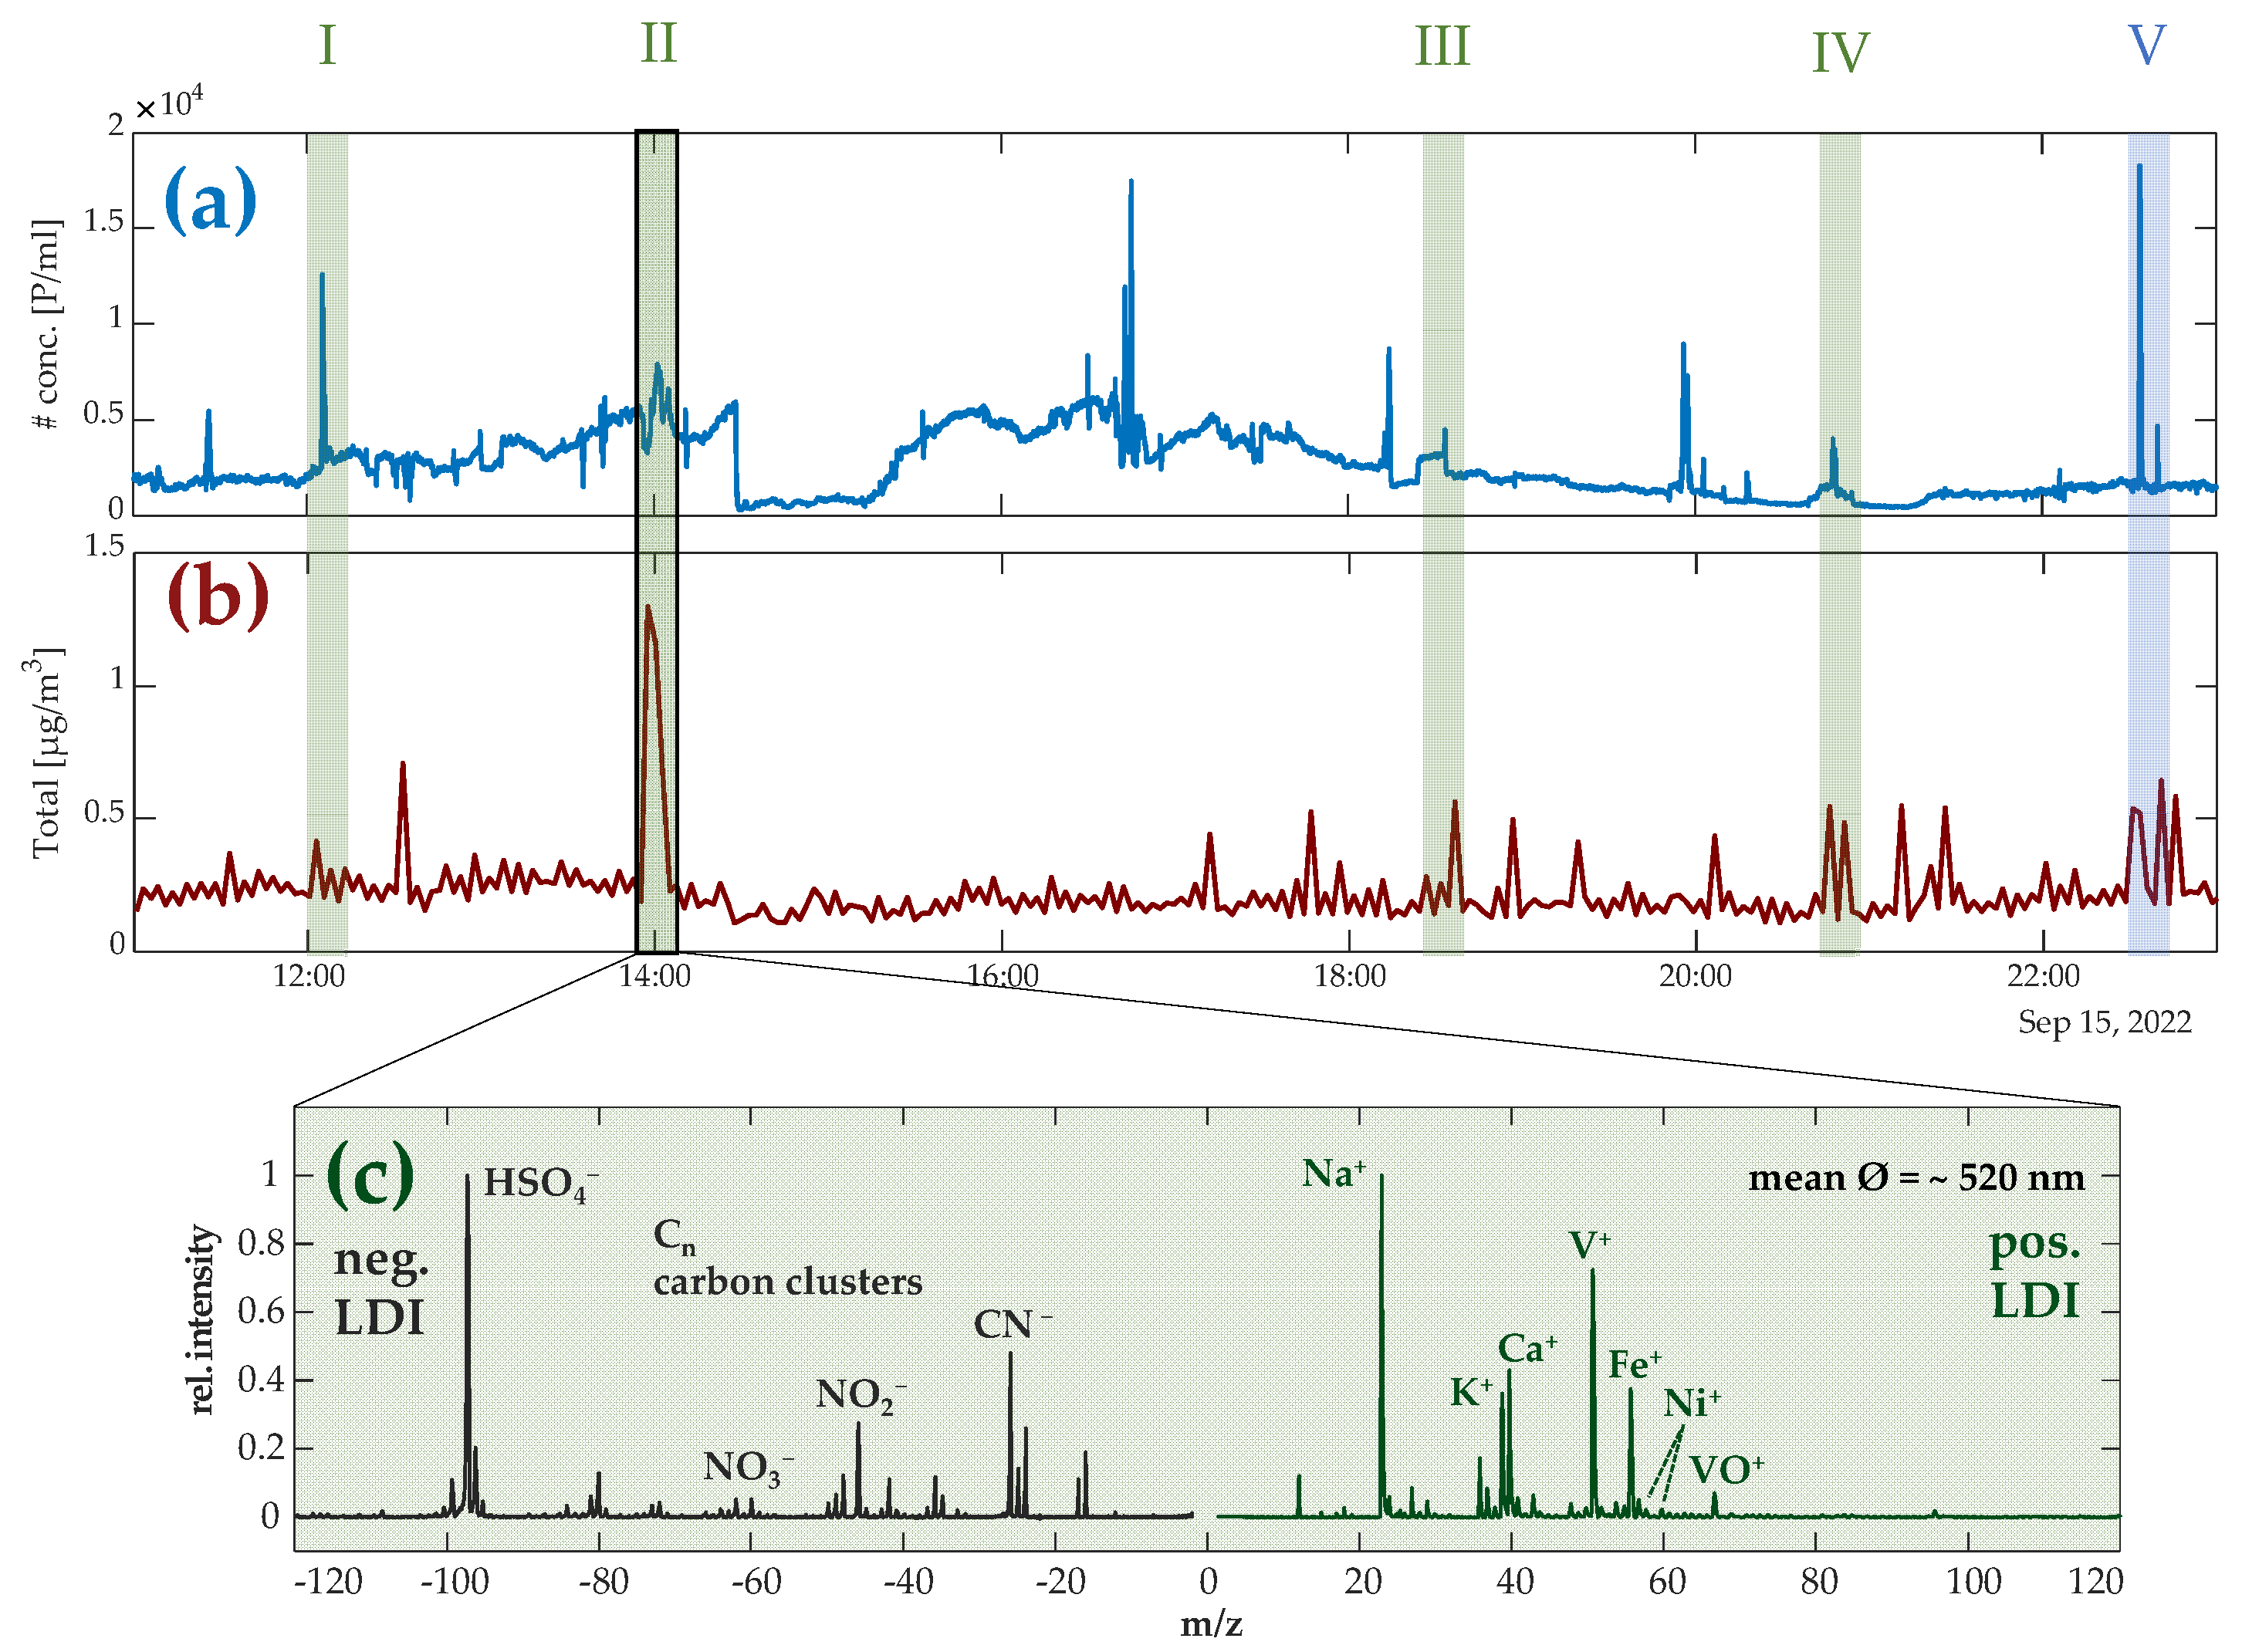
3.1. Temporal Profile of Airborne Particles

The observations took place in early autumn with mean wind speeds of 10.8 m s−1 (5–6 Bft, max. wind speed: 22.2 m s−1; min. wind speed: 6.9 m s−1) from westerly directions 270° ± 30° and 2–5 km downwind the main shipping route to Travemünde harbor (back trajectories are given in Figure A1). The mean PM1 mass measured on board was 0.24 µg m−3 and reached peak values of about 1.5 µg m−3 during the single pollution events caused by transiting ships (Lübeck City measuring station St. Jürgen, 15 September 2022, mean daily PM10 value 8.13 µg m−3, https://www.schleswig-holstein.de/DE/fachinhalte/L/luftqualitaet/Messstationen/LuebeckStJuergen.html, last accessed on 26 February 2023). The progression of particle counter measurements for 09/15/2022 from 10:00 AM over 14 h is shown in Figure 2. Figure 2a depicts the absolute number concentration of particles in the ambient air at the measurement site in P ml−1, and in Figure 2b the mass concentration in µg m−3 is given (calculated particle mass from SMPS data with a relative density of one). Several major individual events can be highlighted during the course of the day, five of which could be identified as passing ships in conjunction with the data from SMPS, mSEMS and aMCPC, and single-particle MS.

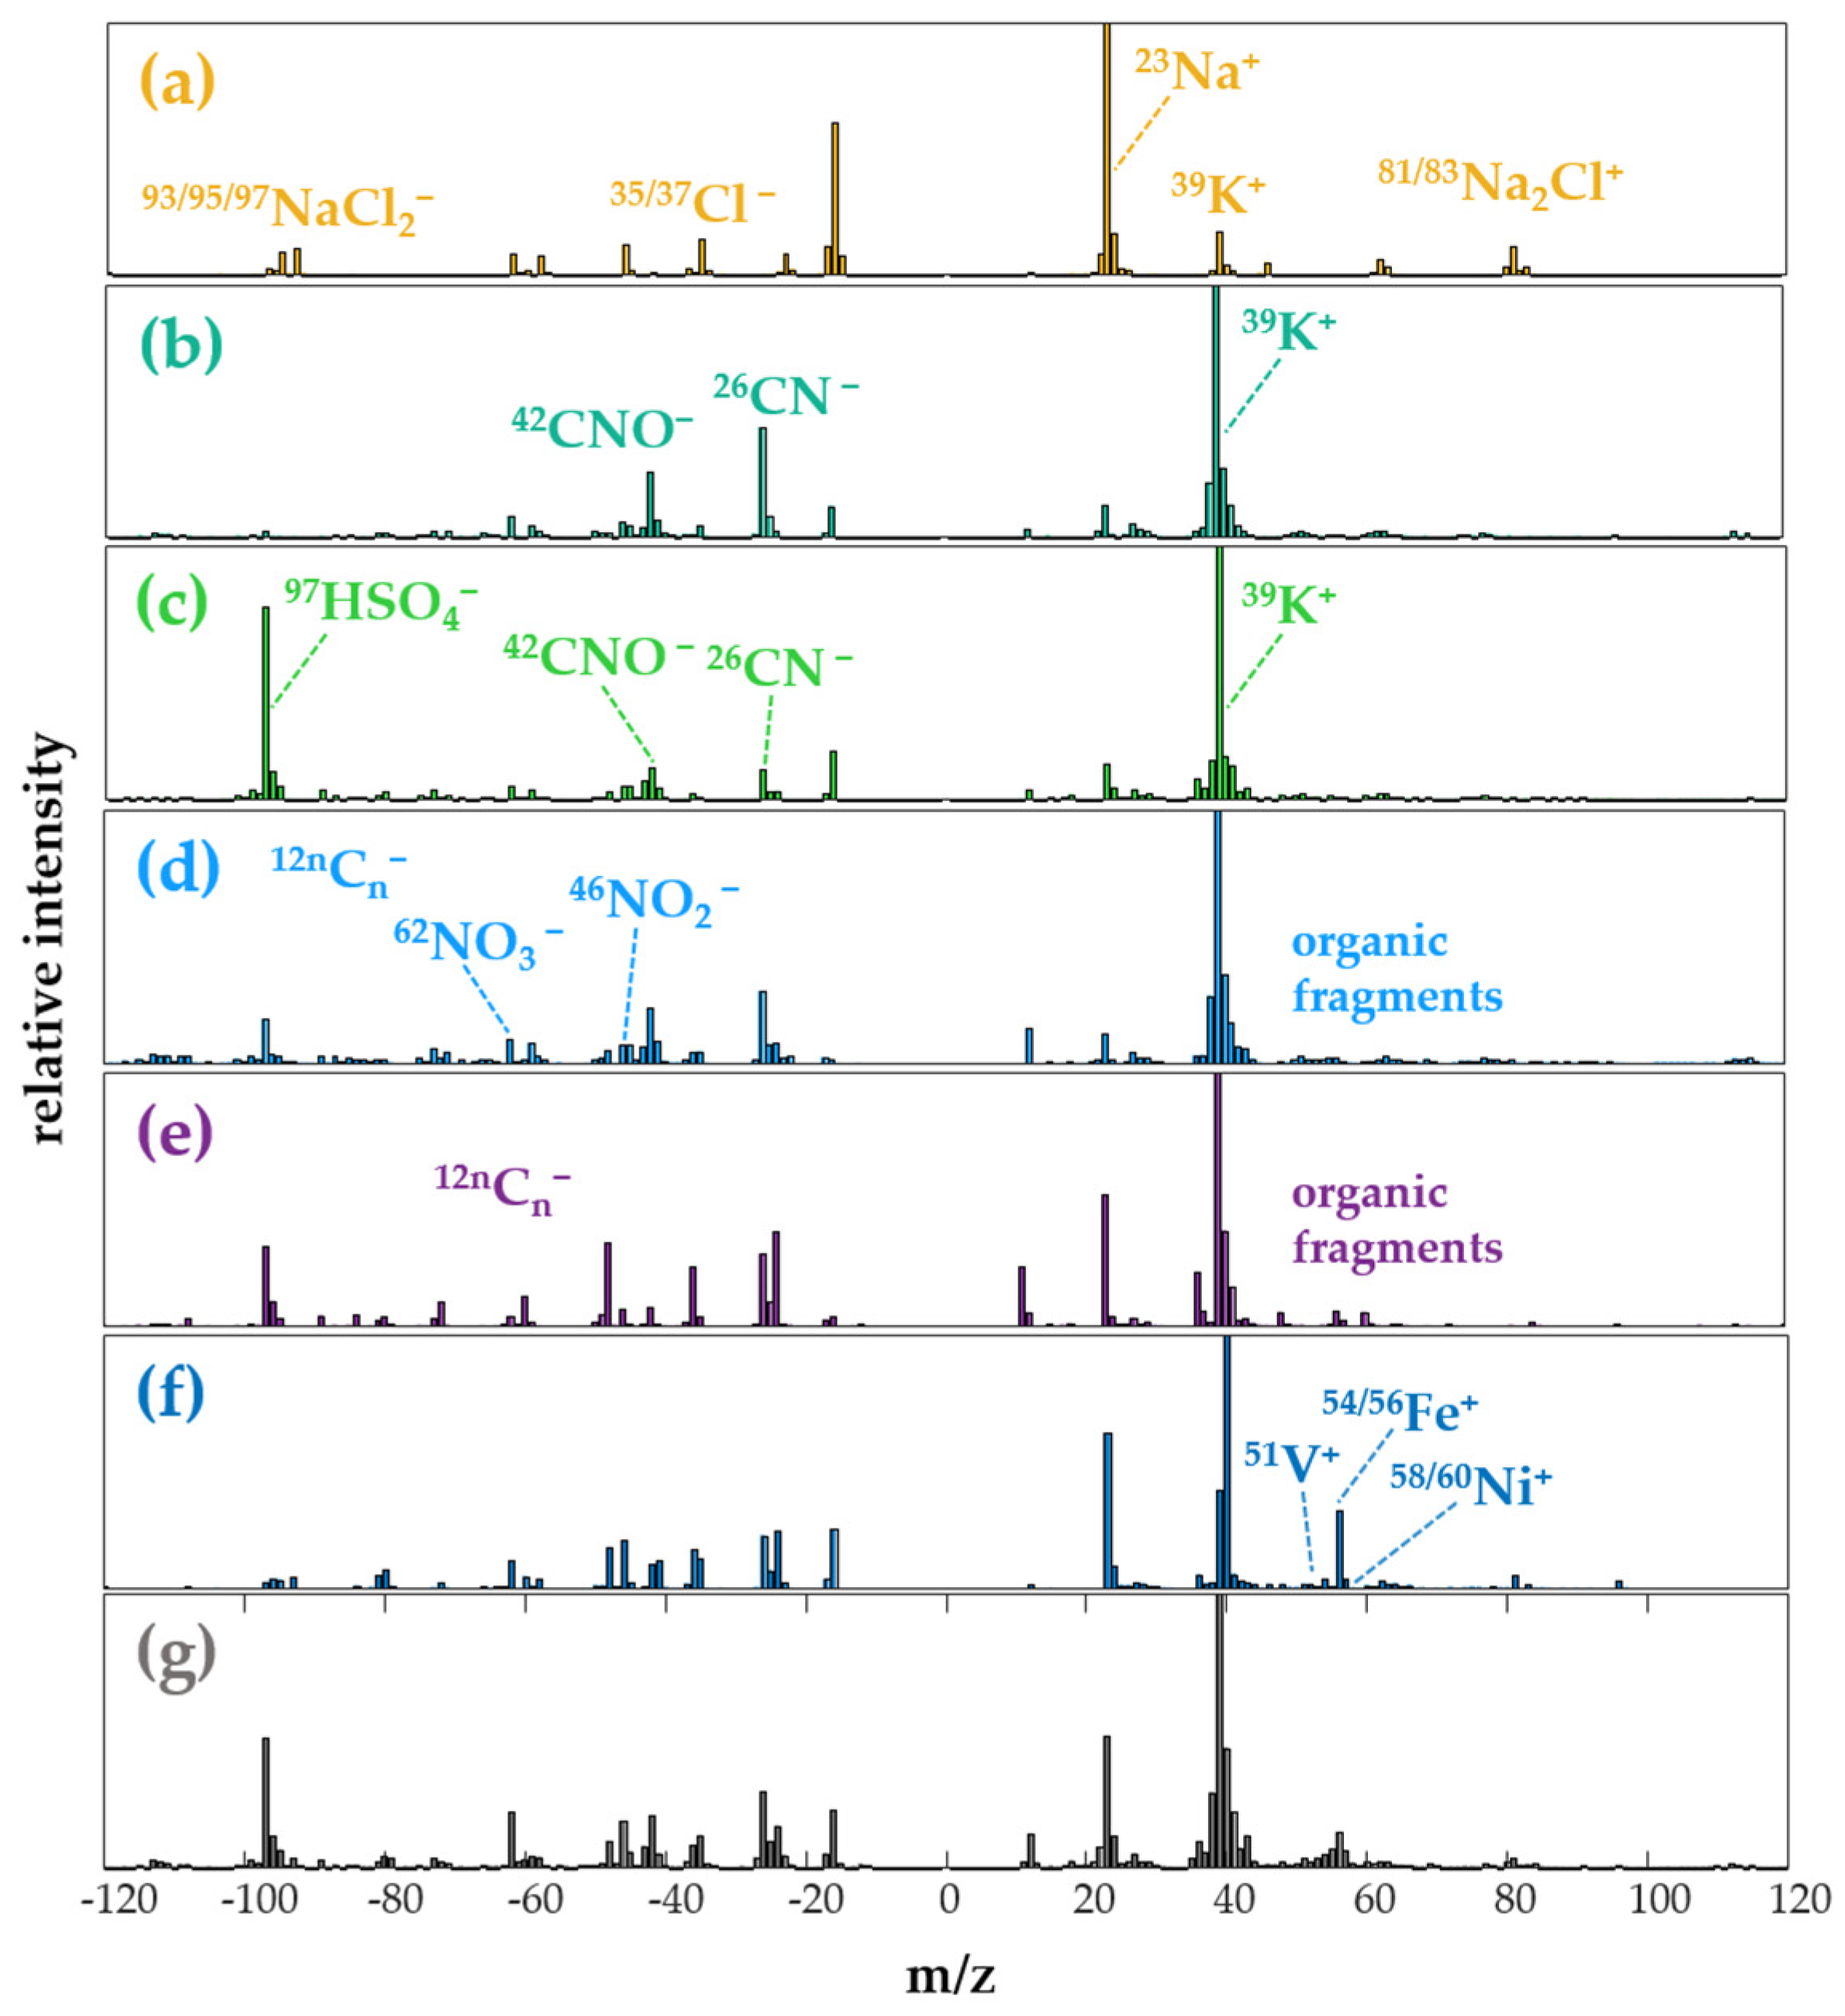
3.2. Chemical Profile of Ship Emission Particles

During the research cruise onboard the RV Elisabeth Mann Borgese on 15 September 2022, 53,597 particles could be sized and chemically analyzed by single-particle mass spectrometry in a timeframe from 11:00 a.m. to 11:00 p.m. (UTC+2). Transient increases in the particle number data from the CPC, SMPS, and mSEMS in the relevant size range of 30–150 nm indicated the presence of ship exhaust plumes. Within these events, the single-particle mass spectra were visually inspected, and particles originating from ship emissions were identified and analyzed. The average mass spectrum of single particles from bunker fuel emissions is given in Figure 2c (pollution event II), whereas the relative peak intensities do not represent the mass concentration of these species. In previous studies of ship emissions, vanadium ion signatures strongly dominated over Fe and Ni [43,44], resulting in vanadium often being used as the singular marker in single-particle mass spectrometry (SPMS) [45]. Due to the resonant ionization of iron by the KrF excimer laser [51] and the resulting significantly higher signal yield of particle-bound Fe, the selection criterion can be extended to V–Fe–Ni [46]. In addition to the signals and ion patterns of the transition metals V, Fe, and Ni, particles with strong signals for Ca, which originate from the additives of the lubrication oil, are also found in ship exhaust plumes [61,62]. Due to the higher sulfur content in the bunker fuel, intense signals for 97HSO4 and 80SO3 can be detected in the anion mass spectra. In addition, frequently occurring signal patterns for EC (elemental carbon clusters; 12nCn) and OC (organic carbon) in combination with the other marker ions mentioned above can enable the evaluation and detection of ship emission particles.
In the observation period, five individual pollution events could be associated with ship passages and identified. The ion pattern screening for particles from ship exhaust plumes was successful in finding and assigning a total of 226 particles in the five sections marked in Figure 2a,b, corresponding to a mean hit rate (ship particles/# mass spectra) of about 13%. All events are marked and color-coded in Figure 2 (I–V). In (c), the normalized spectrum of a typical single-particle mass spectrum from the ship exhaust of bunker fuels such as heavy fuel oil (HFO) is shown. The combination of 40Ca+, 51V+, 54/56Fe+, and 58/60Ni+ in the positive spectrum and 97HSO4, 80SO3, and 12nCn carbon clusters in the negative spectrum shows all characteristic marker signatures for SPMS of ship exhaust particles from HFO. The mean aerodynamic diameter of the particles from this single pollution event is about 520 nm.
The general composition of the whole dataset is shown by a cluster analysis using the ART-2a algorithm; the results can be seen in Figure 3. The analysis revealed 936 particle clusters, with the first 260 containing >86% of all particles included in the cluster analysis. Similar clusters were inspected based on the ion signal pattern and manually grouped into seven particle classes. The seven clusters are, in descending percent frequency throughout the data set, sea salt (25%), KCN (23%), KCN sulfate (17%), OCEC nitrate (15%), unclassified (14%), ECOC (4%), and VFeNi (1%). Marine particles from bunker fuel (VFeNi) account for only about 1% of the signals, with the total share of combustion particles containing soot (ECOC and VFeNi) being about 5%. The high proportion of sea salt particles in the data set can be explained by the measurement location and the partly strong wind. Particles of the classes KCN, KCN sulfate, and OCEC nitrate represent 55% of all analyzed particles and can be attributed to various natural and anthropogenic sources such as biomass combustion and daytime photochemical formation of SOA (secondary organic aerosol). The partially high intensities of the signals for sulfate and nitrate show a high proportion of secondary material. An overview of the seven main particle classes of the cluster analysis with their respective principal components is given in Figure A2.

4. Discussion

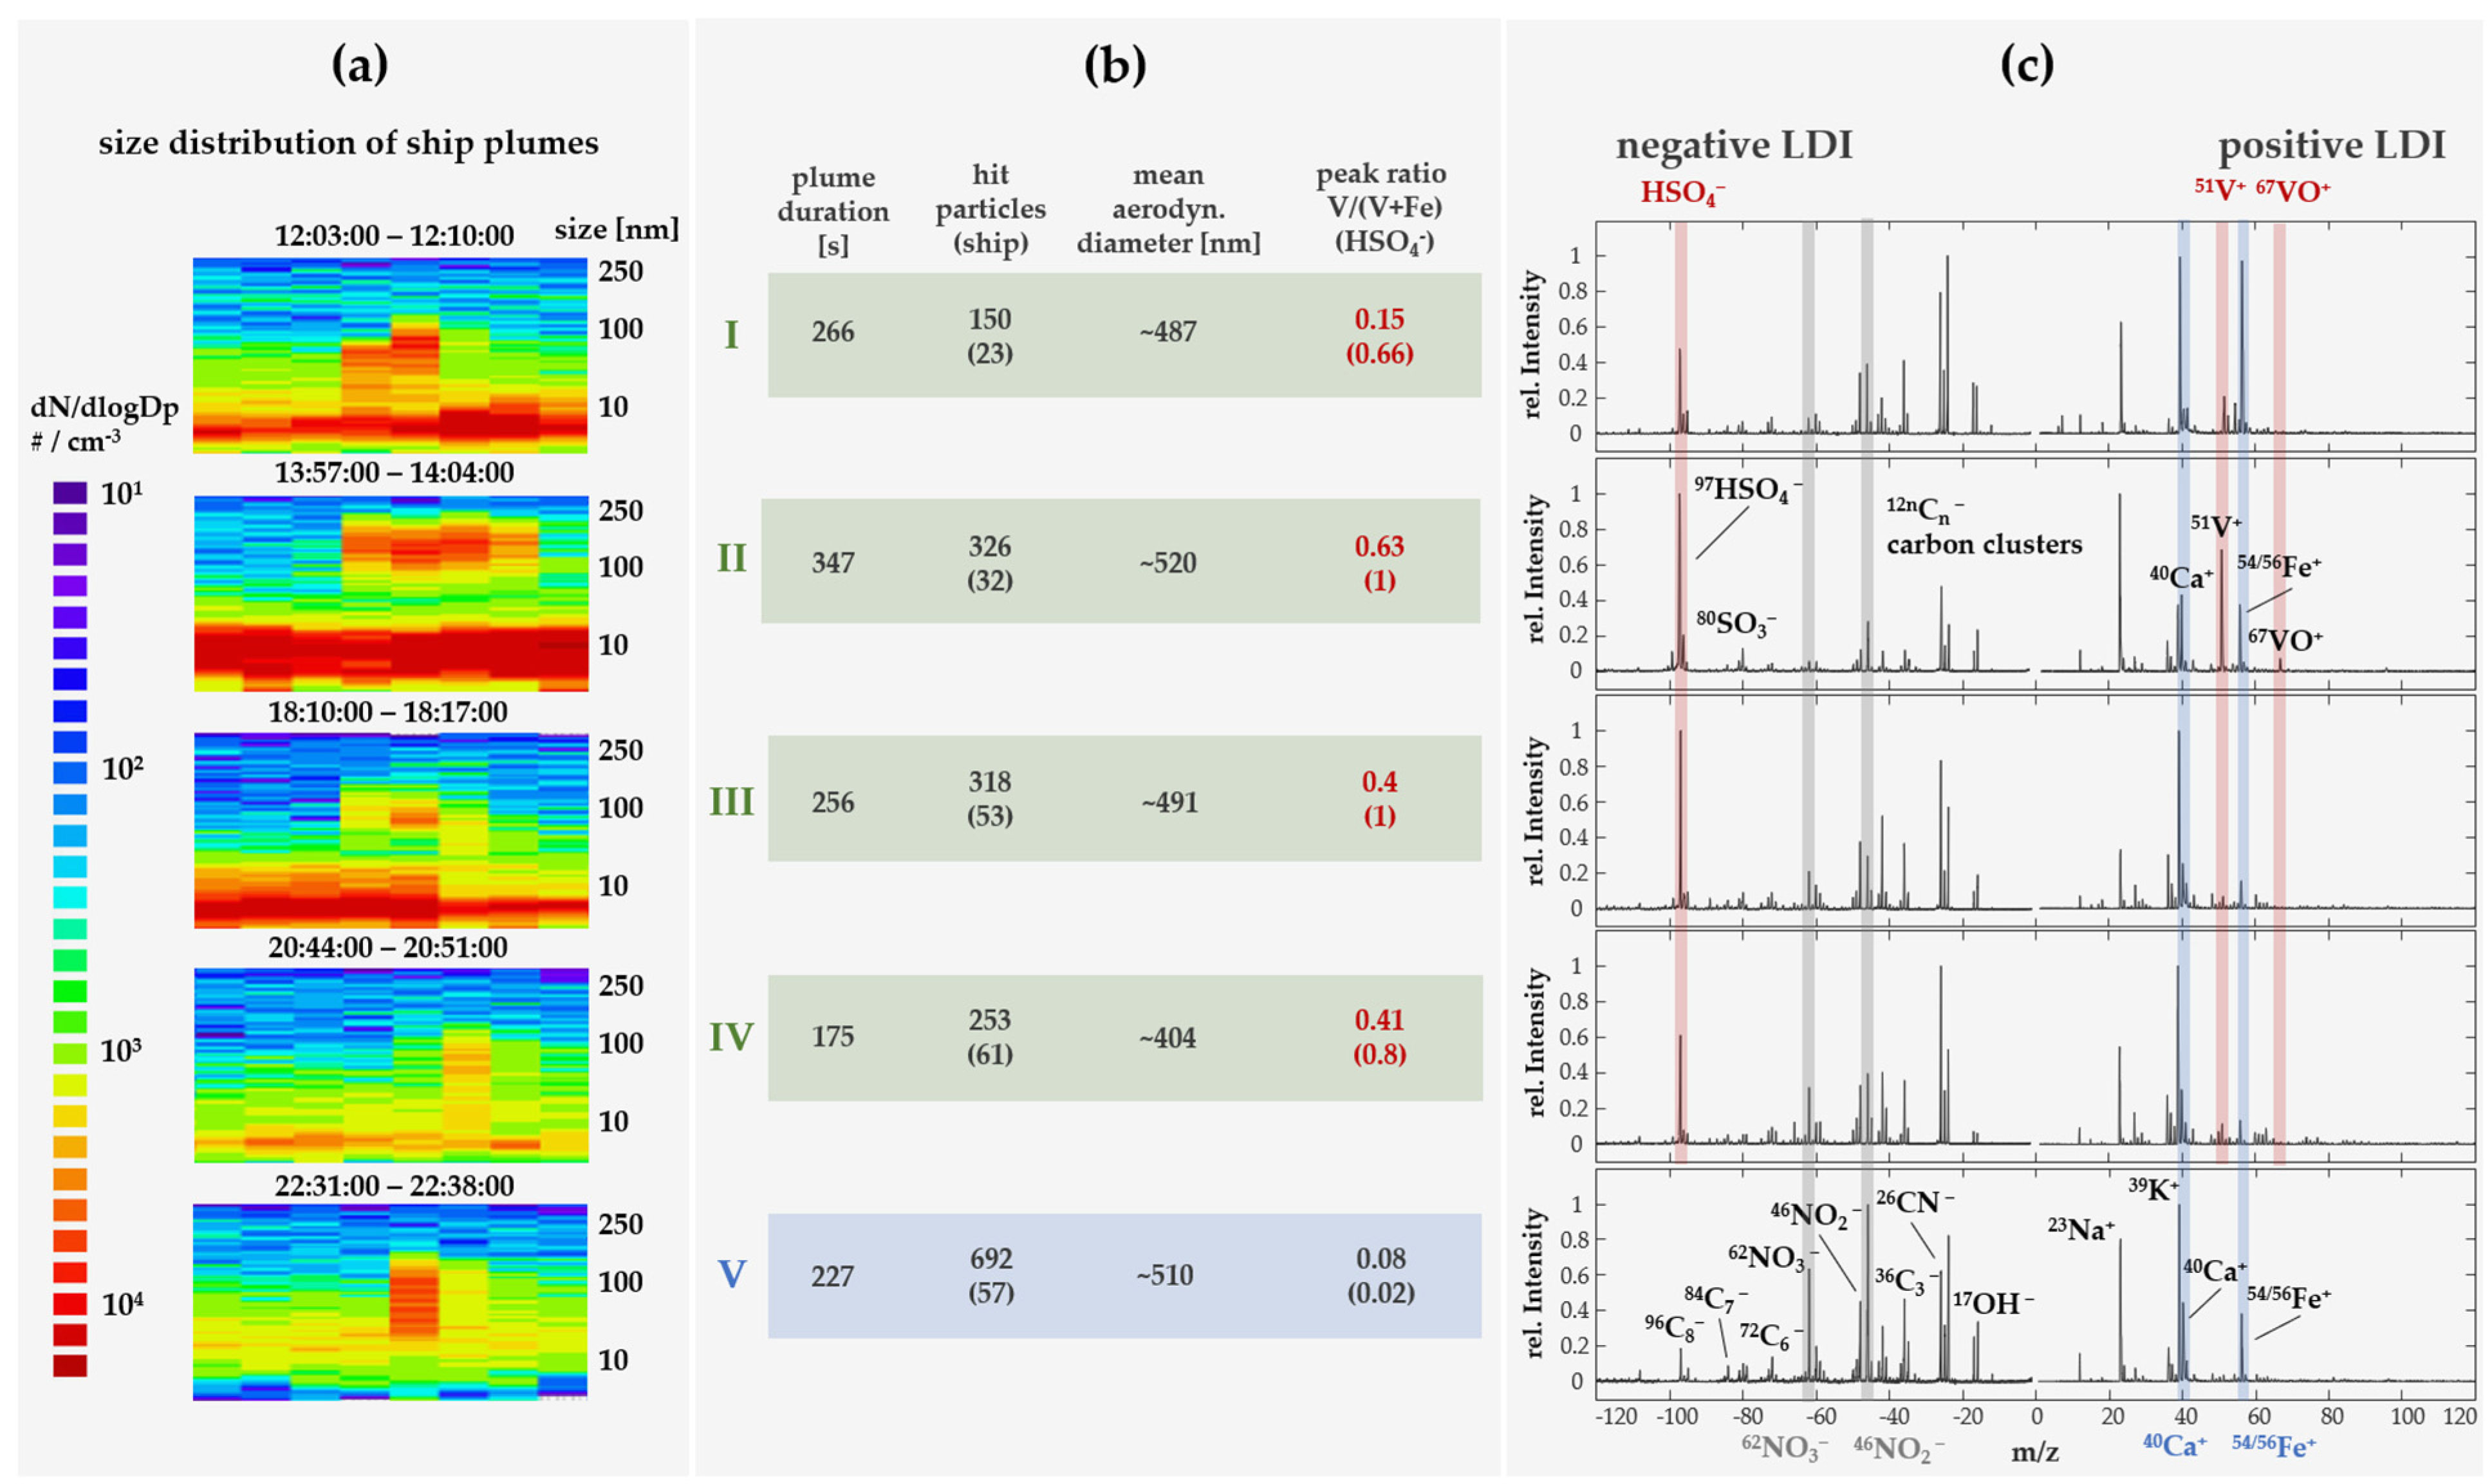
4.1. Ship Plume Detection

The fast mSEMS and aMCPC systems were applied to evaluate the size distribution of the detected ship exhaust particles. The size distributions of individual ship exhaust plumes are depicted in Figure 4a as a function of time from mSEMS and aMCPC measurements. In addition to a continuously high concentration of particles in the range of 5–20 nm, which indicates natural sources such as new particle formation (NPF) [63,64,65], single pollution events in the range of 30–150 nm with an average duration of 250 s can be detected. This is consistent with both laboratory experiments on ship emissions [5] and ambient air measurements [30,33].

4.2. Ship Particle Characterization

The seaport of Lübeck-Travemünde is one of the major German Baltic Sea ports, with an annual capacity of over 400,000 passengers and several million tons of goods handled. The entire Baltic Sea area is a SECA with a 0.1% limit for sulfur in fuel mass, and the compliance level is considered very high with >95% [10], so a violation here will rarely be detected within a one-day measurement. Many of the cargo and passenger vessels operating in the Baltic Sea are equipped with sulfur scrubbers [66], which remove SO2 from the exhaust gas with high efficiency [5,12,15] and allow the use of cheap bunker fuels. However, studies reveal that the impact of sulfur scrubbers on particulate emissions is rather moderate [5,12,15]. The exact mode of operation is described elsewhere in more detail [5,15]. In general, scrubbers run in an open- or closed-loop process. They scrub SO2 with significant efficiency, as well as part of the PM from the ship’s exhaust, utilizing large quantities of seawater, which in the closed-loop process must later be disposed of as wastewater. Several ships equipped with such a sulfur scrubber system operate in the ferry port of Lübeck-Travemünde. These ships operate on different routes to Sweden and Finland, with several passages per day.
In SPMS measurements of airborne particles, the signals of transition metal cations were found to be significantly more stable and reliable marker signals than the ion patterns of EC, OC, and alkali cations, which occur more frequently and in many different particle classes [58,67]. Vanadium has been used as a marker ion in many previous SPMS studies and is well-established. For the detection and differentiation of different marine fuels, the ratio of V and Fe can be used as a first approximation (Figure 4b, peak ratio) [46,68]. In addition to the transition metal ions, 40Ca+ ions could also be detected in all particle classes of ship exhaust plumes, which have already been characterized as residues of additives from lubrication oil in several studies [69,70] and could also be detected in PM from ship emissions [20,71]. Besides the ion patterns of the alkali and transition metals, significant differences in the sulfate signatures can also be detected. Ion profiles for sulfate can be indicative of secondary and aged particles. Freshly emitted particles from bunker ship fuel such as HFO contain significantly higher amounts of sulfur than distillate fuel such as MGO and can be detected via gas–particle conversion of SO2 through SPMS measurements [43,44,72]. As a first-level discriminator, the ratio between V and Fe in relation to the peak intensity of 97HSO4 can be used in the ion marker screening (Figure 4b). On a second level, the ion signal patterns of the carbon clusters 40Ca+ and 56CaO+ can be considered for evaluation. Based on these results, the individual pollution events I–IV can be assigned to the combustion of bunker fuel by passing ships, whereas the ion patterns of event V originate more likely from distillate fuel combustion.
However, the mean particle sizes show a large agreement between events (400–520 nm, Figure 4). One explanation for this is due to the design of the instrument and the detection of the particles in the inlet system based on Mie scattering. When using the 532 nm scattering wavelength, the Mie scattering drops drastically when approaching the Rayleigh limit around 150 nm [73]. In addition to the instrumental influences of the optical particle detection and the concentrator unit, particles in the accumulation mode are often dominant in ambient air in the absence of local emissions. Particles are rapidly accumulating due to secondary material or condensation [74].
Ambient air measurements using SPMS can result in a variety of ion patterns depending on the nature of the airborne particles [38,55,75,76,77]. Figure 3 illustrates the most important particle classes in relation to their abundance in the detected data set, and Figure A2 depicts the nominal mass spectra of the corresponding cluster centers. In the prevailing weather conditions with strong wind and resulting swell, most of the particles detected are sea salt and other partly organic and partly inorganic particles. Besides some aged aerosol, only about 1% of the particles can be directly attributed to ship emissions from bunker fuel combustion due to their V–Fe–Ni-enriched signature. However, the use of the single-particle technique enables the detection of particles from ship emissions, although they represent only a minimal fraction of the total number of particles.

5. Conclusions

This study enabled us to demonstrate marine-based detection and chemical analysis of ship emission particles aboard a research vessel from a distance of ~5 km. Thereby, the combination of fast CPC, SMPS, and mSEMS and aMCPC, as well as single-particle MS, in combination with weather data, highlighted the strengths and fast detection capabilities of airborne ship emission particles. It was shown that PM emissions from ships using HFO and sulfur scrubbers can still be detected and evaluated by their metal and sulfur signatures. This indicates that emissions of health-relevant transition metals and sulfur in PM are not efficiently removed by the scrubbers, and other exhaust gas cleaning equipment is needed to treat ship exhaust gas. In order to perform the detection and analysis of ship exhaust plumes with higher accuracy and in an automated way in land-based or marine-based monitoring stations in the future, SPMS monitoring stations should be able to perform the source attribution autonomously using local weather data, online available ship transponder data, and plume dispersion models [78,79]. To overcome the main disadvantage of the wind dependency of the measuring station, a stationary and a mobile unit (land- or marine-based) could be used.

Author Contributions

Conceptualization, J.S.; methodology, J.S., E.I.R., H.O., R.I., D.S., N.G. and J.H.; formal analysis, J.S., E.I.R. and J.H.; investigation, J.S. and E.I.R.; software, J.S., J.P. and R.I.; writing—original draft preparation, J.S., J.P. and E.I.R.; writing—review and editing, J.S., J.P., H.O., R.Z. and T.W.A.; visualization, J.S.; supervision, J.P., R.Z. and T.W.A.; project administration, H.O., J.H., J.S.-K., R.Z. and T.W.A.; funding acquisition, H.O., D.S.-B., J.S-K., J.H., T.W.A. and R.Z. All authors have read and agreed to the published version of the manuscript.

Funding

This research was funded by the Deutsche Forschungsgemeinschaft (DFG, German Research Foundation)—funding number 471841824 (project “PlumeBaSe”) and dtec.bw—Digitalization and Technology Research Center of the Bundeswehr (project “LUKAS”). Dtec.bw is funded by the European Union—NextGenerationEU.

Institutional Review Board Statement

Not applicable.

Informed Consent Statement

Not applicable.

Data Availability Statement

Data are available on request from Julian Schade ([email protected]).

Acknowledgments

We thank the whole crew of the research vessel Elisabeth Mann Borgese for their successful and great collaboration. Instrumental and technical support was provided by Photonion GmbH, Schwerin, Germany. We thank the State Agency for the Environment, Air Quality Monitoring Schleswig-Holstein for the PM10 data. The authors are grateful to the NOAA Air Resources Laboratory (ARL) for the provision of the HYSPLIT transport and dispersion model and the READY website (https://www.arl.noaa.gov/, last accessed on 6 March 2023) used in this publication.

Conflicts of Interest

The authors declare no conflict of interest.

Appendix A

Figure A1. Illustrates the back trajectories of air masses, ending at 00:00 UTC+2 on the 16 September 2022. The backward trajectories are shown every four hours for a duration of 24 h. The air trajectories were calculated with the interactive HYSPLIT web tool of the National Oceanic and Atmospheric Administration model GDAS with 0.25° resolution (https://www.ready.noaa.gov/HYSPLIT.php, last accessed on 24 February 2023) [57].
Atmosphere 14 00849 g0a1
Figure A2. Illustrates from top to bottom in (ag) the cluster centers of the assigned main clusters: sea salt, KCN, KCN sulfate, OCEC nitrate, ECOC, VFeNi, and total. The clusters are named according to the most important characteristics; in each case, the main signals are marked.
Atmosphere 14 00849 g0a2
Table A1. Presents hourly averaged meteorological data from onboard measurements of the RV Elisabeth Mann Borgese measured on 15 September 2022, at the above-mentioned coordinates (Figure 1, Section 2.2.).
TimeWind DirectionWind Speed [m/s]Air Pressure [hPa]Temperature [°C]Humidity [%]
11:00259° ± 5°10.1 ± 1.51001 ± 0.115.8 ± 0.265.7 ± 2.1
12:00267.5° ± 13.4°11.5 ± 2.61001.4 ± 0.314.7 ± 1.369.7 ± 5.5
13:00264.7° ± 5.3°9.1 ± 1.51001.4 ± 0.215 ± 0.569 ± 1.7
14:00274.5° ± 12.8°11.3 ± 1.51001 ± 0.115.9 ± 0.365.2 ± 3.5
15:00271.6° ± 12.7°11.4 ± 1.71001 ± 0.115.8 ± 0.363.9 ± 2.8
16:00281.7° ± 7.2°11.3 ± 1.61001.1 ± 0.115.7 ± 0.162.9 ± 4.4
17:00282.7° ± 8.3°10.9 ± 1.61001.2 ± 0.115.3 ± 0.163.4 ± 3
18:00280.4° ± 6.2°11.2 ± 1.41001.4 ± 0.214.9 ± 0.261 ± 2.5
19:00271.4° ± 9.3°10.8 ± 1.31001.8 ± 0.114.3 ± 0.366.7 ± 3
20:00267.3° ± 5.5°10.7 ± 1.11001.9 ± 0.113.8 ± 0.271.8 ± 1.9
21:00262.1° ± 6.4°11 ± 1.21002 ± 0.113.4 ± 0.275.4 ± 1.7
22:00267.4° ± 6.1°11.1 ± 1.51002.1 ± 0.113.1 ± 0.275.6 ± 1.6

References

  1. Corbett, J.J.; Winebrake, J.J.; Green, E.H.; Kasibhatla, P.; Eyring, V.; Lauer, A. Mortality from ship emissions: A global assessment. Environ. Sci. Technol. 2007, 41, 8512–8518. [Google Scholar] [CrossRef] [PubMed]
  2. Eyring, V.; Isaksen, I.S.; Berntsen, T.; Collins, W.J.; Corbett, J.J.; Endresen, O.; Grainger, R.G.; Moldanova, J.; Schlager, H.; Stevenson, D.S. Transport impacts on atmosphere and climate: Shipping. Atmos. Environ. 2010, 44, 4735–4771. [Google Scholar] [CrossRef]
  3. Viana, M.; Hammingh, P.; Colette, A.; Querol, X.; Degraeuwe, B.; de Vlieger, I.; van Aardenne, J. Impact of maritime transport emissions on coastal air quality in Europe. Atmos. Environ. 2014, 90, 96–105. [Google Scholar] [CrossRef]
  4. Jonson, J.E.; Gauss, M.; Schulz, M.; Jalkanen, J.-P.; Fagerli, H. Effects of global ship emissions on European air pollution levels. Atmos. Chem. Phys. 2020, 20, 11399–11422. [Google Scholar] [CrossRef]
  5. Jeong, S.; Bendl, J.; Saraji-Bozorgzad, M.; Käfer, U.; Etzien, U.; Schade, J.; Bauer, M.; Jakobi, G.; Orasche, J.; Fisch, K.; et al. Aerosol emissions from a marine diesel engine running on different fuels and effects of exhaust gas cleaning measures. Environ. Pollut. 2023, 316, 120526. [Google Scholar] [CrossRef]
  6. Ausmeel, S.; Eriksson, A.; Ahlberg, E.; Sporre, M.K.; Spanne, M.; Kristensson, A. Ship plumes in the Baltic Sea Sulfur Emission Control Area: Chemical characterization and contribution to coastal aerosol concentrations. Atmos. Chem. Phys. 2020, 20, 9135–9151. [Google Scholar] [CrossRef]
  7. Kuittinen, N.; Jalkanen, J.-P.; Alanen, J.; Ntziachristos, L.; Hannuniemi, H.; Johansson, L.; Karjalainen, P.; Saukko, E.; Isotalo, M.; Aakko-Saksa, P.; et al. Shipping Remains a Globally Significant Source of Anthropogenic PN Emissions Even after 2020 Sulfur Regulation. Environ. Sci. Technol. 2021, 55, 129–138. [Google Scholar] [CrossRef]
  8. Sofiev, M.; Winebrake, J.J.; Johansson, L.; Carr, E.W.; Prank, M.; Soares, J.; Vira, J.; Kouznetsov, R.; Jalkanen, J.-P.; Corbett, J.J. Cleaner fuels for ships provide public health benefits with climate tradeoffs. Nat. Commun. 2018, 9, 406. [Google Scholar] [CrossRef]
  9. IMO. Annex VI of MARPOL 73/78, Regulations for the Prevention of Air Pollution from Ships Reg. 14. Available online: https://www.imo.org/en/OurWork/Environment/Pages/Pollution-Prevention.aspx (accessed on 7 March 2023).
  10. Lähteenmäki-Uutela, A.; Yliskylä-Peuralahti, J.; Repka, S.; Mellqvist, J. What explains SECA compliance: Rational calculation or moral judgment? WMU J. Marit. Aff. 2019, 18, 61–78. [Google Scholar] [CrossRef]
  11. Winnes, H.; Fridell, E.; Moldanová, J. Effects of Marine Exhaust Gas Scrubbers on Gas and Particle Emissions. J. Mar. Sci. Eng. 2020, 8, 299. [Google Scholar] [CrossRef]
  12. Lehtoranta, K.; Aakko-Saksa, P.; Murtonen, T.; Vesala, H.; Ntziachristos, L.; Rönkkö, T.; Karjalainen, P.; Kuittinen, N.; Timonen, H. Particulate Mass and Nonvolatile Particle Number Emissions from Marine Engines Using Low-Sulfur Fuels, Natural Gas, or Scrubbers. Environ. Sci. Technol. 2019, 53, 3315–3322. [Google Scholar] [CrossRef] [PubMed]
  13. Jonson, J.E.; Gauss, M.; Jalkanen, J.-P.; Johansson, L. Effects of strengthening the Baltic Sea ECA regulations. Atmos. Chem. Phys. 2019, 19, 13469–13487. [Google Scholar] [CrossRef]
  14. Yu, C.; Pasternak, D.; Lee, J.; Yang, M.; Bell, T.; Bower, K.; Wu, H.; Liu, D.; Reed, C.; Bauguitte, S.; et al. Characterizing the Particle Composition and Cloud Condensation Nuclei from Shipping Emission in Western Europe. Environ. Sci. Technol. 2020, 54, 15604–15612. [Google Scholar] [CrossRef] [PubMed]
  15. Fridell, E.; Salo, K. Measurements of abatement of particles and exhaust gases in a marine gas scrubber. Proc. Inst. Mech. Eng. Part M J. Eng. Marit. Environ. 2016, 230, 154–162. [Google Scholar] [CrossRef]
  16. Lunde Hermansson, A.; Hassellöv, I.-M.; Moldanová, J.; Ytreberg, E. Comparing emissions of polyaromatic hydrocarbons and metals from marine fuels and scrubbers. Transp. Res. Part D Transp. Environ. 2021, 97, 102912. [Google Scholar] [CrossRef]
  17. Turner, D.R.; Hassellöv, I.-M.; Ytreberg, E.; Rutgersson, A. Shipping and the environment: Smokestack emissions, scrubbers and unregulated oceanic consequences. Elem. Sci. Anthr. 2017, 5, 45. [Google Scholar] [CrossRef]
  18. Thor, P.; Granberg, M.E.; Winnes, H.; Magnusson, K. Severe Toxic Effects on Pelagic Copepods from Maritime Exhaust Gas Scrubber Effluents. Environ. Sci. Technol. 2021, 55, 5826–5835. [Google Scholar] [CrossRef]
  19. Moldanová, J.; Fridell, E.; Winnes, H.; Holmin-Fridell, S.; Boman, J.; Jedynska, A.; Tishkova, V.; Demirdjian, B.; Joulie, S.; Bladt, H.; et al. Physical and chemical characterisation of PM emissions from two ships operating in European Emission Control Areas. Atmos. Meas. Tech. 2013, 6, 3577–3596. [Google Scholar] [CrossRef]
  20. Streibel, T.; Schnelle-Kreis, J.; Czech, H.; Harndorf, H.; Jakobi, G.; Jokiniemi, J.; Karg, E.; Lintelmann, J.; Matuschek, G.; Michalke, B.; et al. Aerosol emissions of a ship diesel engine operated with diesel fuel or heavy fuel oil. Environ. Sci. Pollut. Res. Int. 2017, 24, 10976–10991. [Google Scholar] [CrossRef]
  21. Wu, D.; Li, Q.; Ding, X.; Sun, J.; Li, D.; Fu, H.; Teich, M.; Ye, X.; Chen, J. Primary Particulate Matter Emitted from Heavy Fuel and Diesel Oil Combustion in a Typical Container Ship: Characteristics and Toxicity. Environ. Sci. Technol. 2018, 52, 12943–12951. [Google Scholar] [CrossRef]
  22. Corbin, J.C.; Czech, H.; Massabò, D.; de Mongeot, F.B.; Jakobi, G.; Liu, F.; Lobo, P.; Mennucci, C.; Mensah, A.A.; Orasche, J.; et al. Infrared-absorbing carbonaceous tar can dominate light absorption by marine-engine exhaust. NPJ Clim. Atmos. Sci. 2019, 2, 12. [Google Scholar] [CrossRef]
  23. Winebrake, J.J.; Corbett, J.J.; Green, E.H.; Lauer, A.; Eyring, V. Mitigating the health impacts of pollution from oceangoing shipping: An assessment of low-sulfur fuel mandates. Environ. Sci. Technol. 2009, 43, 4776–4782. [Google Scholar] [CrossRef] [PubMed]
  24. Oeder, S.; Kanashova, T.; Sippula, O.; Sapcariu, S.C.; Streibel, T.; Arteaga-Salas, J.M.; Passig, J.; Dilger, M.; Paur, H.-R.; Schlager, C.; et al. Particulate matter from both heavy fuel oil and diesel fuel shipping emissions show strong biological effects on human lung cells at realistic and comparable in vitro exposure conditions. PLoS ONE 2015, 10, e0126536. [Google Scholar] [CrossRef] [PubMed]
  25. Kattner, L.; Mathieu-Üffing, B.; Burrows, J.P.; Richter, A.; Schmolke, S.; Seyler, A.; Wittrock, F. Monitoring compliance with sulfur content regulations of shipping fuel by in situ measurements of ship emissions. Atmos. Chem. Phys. 2015, 15, 10087–10092. [Google Scholar] [CrossRef]
  26. Zhang, Y.; Deng, F.; Man, H.; Fu, M.; Lv, Z.; Xiao, Q.; Jin, X.; Liu, S.; He, K.; Liu, H. Compliance and port air quality features with respect to ship fuel switching regulation: A field observation campaign, SEISO-Bohai. Atmos. Chem. Phys. 2019, 19, 4899–4916. [Google Scholar] [CrossRef]
  27. Zhou, F.; Hou, L.; Zhong, R.; Chen, W.; Ni, X.; Pan, S.; Zhao, M.; An, B. Monitoring the compliance of sailing ships with fuel sulfur content regulations using unmanned aerial vehicle (UAV) measurements of ship emissions in open water. Atmos. Meas. Tech. 2020, 13, 4899–4909. [Google Scholar] [CrossRef]
  28. Beecken, J.; Mellqvist, J.; Salo, K.; Ekholm, J.; Jalkanen, J.-P. Airborne emission measurements of SO2, NOx and particles from individual ships using a sniffer technique. Atmos. Meas. Tech. 2014, 7, 1957–1968. [Google Scholar] [CrossRef]
  29. Chen, G.; Huey, L.G.; Trainer, M.; Nicks, D.; Corbett, J.; Ryerson, T.; Parrish, D.; Neuman, J.A.; Nowak, J.; Tanner, D.; et al. An investigation of the chemistry of ship emission plumes during ITCT 2002. J. Geophys. Res. 2005, 110, D10. [Google Scholar] [CrossRef]
  30. Lack, D.A.; Corbett, J.J.; Onasch, T.; Lerner, B.; Massoli, P.; Quinn, P.K.; Bates, T.S.; Covert, D.S.; Coffman, D.; Sierau, B.; et al. Particulate emissions from commercial shipping: Chemical, physical, and optical properties. J. Geophys. Res. 2009, 114, D7. [Google Scholar] [CrossRef]
  31. Petzold, A.; Hasselbach, J.; Lauer, P.; Baumann, R.; Franke, K.; Gurk, C.; Schlager, H.; Weingartner, E. Experimental studies on particle emissions from cruising ship, their characteristic properties, transformation and atmospheric lifetime in the marine boundary layer. Atmos. Chem. Phys. 2008, 8, 2387–2403. [Google Scholar] [CrossRef]
  32. Berg, N.; Mellqvist, J.; Jalkanen, J.-P.; Balzani, J. Ship emissions of SO2 and NO2: DOAS measurements from airborne platforms. Atmos. Meas. Tech. 2012, 5, 1085–1098. [Google Scholar] [CrossRef]
  33. Diesch, J.-M.; Drewnick, F.; Klimach, T.; Borrmann, S. Investigation of gaseous and particulate emissions from various marine vessel types measured on the banks of the Elbe in Northern Germany. Atmos. Chem. Phys. 2013, 13, 3603–3618. [Google Scholar] [CrossRef]
  34. Ausmeel, S.; Eriksson, A.; Ahlberg, E.; Kristensson, A. Methods for identifying aged ship plumes and estimating contribution to aerosol exposure downwind of shipping lanes. Atmos. Meas. Tech. 2019, 12, 4479–4493. [Google Scholar] [CrossRef]
  35. Celik, S.; Drewnick, F.; Fachinger, F.; Brooks, J.; Darbyshire, E.; Coe, H.; Paris, J.-D.; Eger, P.G.; Schuladen, J.; Tadic, I.; et al. Influence of vessel characteristics and atmospheric processes on the gas and particle phase of ship emission plumes: In situ measurements in the Mediterranean Sea and around the Arabian Peninsula. Atmos. Chem. Phys. 2020, 20, 4713–4734. [Google Scholar] [CrossRef]
  36. Celo, V.; Dabek-Zlotorzynska, E.; McCurdy, M. Chemical characterization of exhaust emissions from selected canadian marine vessels: The case of trace metals and lanthanoids. Environ. Sci. Technol. 2015, 49, 5220–5226. [Google Scholar] [CrossRef]
  37. Zhang, F.; Chen, Y.; Tian, C.; Wang, X.; Huang, G.; Fang, Y.; Zong, Z. Identification and quantification of shipping emissions in Bohai Rim, China. Sci. Total Environ. 2014, 497–498, 570–577. [Google Scholar] [CrossRef] [PubMed]
  38. Pratt, K.A.; Prather, K.A. Mass spectrometry of atmospheric aerosols--recent developments and applications. Part II: On-line mass spectrometry techniques. Mass Spectrom. Rev. 2012, 31, 17–48. [Google Scholar] [CrossRef]
  39. Passig, J.; Zimmermann, R. Laser Ionization in Single-Particle Mass Spectrometry. In Photoionization and Photo-Induced Processes in Mass Spectrometry; Zimmermann, R., Hanley, L., Eds.; Wiley: Hoboken, NJ, USA, 2021; pp. 359–411. ISBN 9783527682201. [Google Scholar]
  40. Reinard, M.S.; Adou, K.; Martini, J.M.; Johnston, M.V. Source characterization and identification by real-time single particle mass spectrometry. Atmos. Environ. 2007, 41, 9397–9409. [Google Scholar] [CrossRef]
  41. Arndt, J.; Sciare, J.; Mallet, M.; Roberts, G.C.; Marchand, N.; Sartelet, K.; Sellegri, K.; Dulac, F.; Healy, R.M.; Wenger, J.C. Sources and mixing state of summertime background aerosol in the north-western Mediterranean basin. Atmos. Chem. Phys. 2017, 17, 6975–7001. [Google Scholar] [CrossRef]
  42. Wang, X.; Shen, Y.; Lin, Y.; Pan, J.; Zhang, Y.; Louie, P.K.K.; Li, M.; Fu, Q. Atmospheric pollution from ships and its impact on local air quality at a port site in Shanghai. Atmos. Chem. Phys. 2019, 19, 6315–6330. [Google Scholar] [CrossRef]
  43. Healy, R.M.; O’Connor, I.P.; Hellebust, S.; Allanic, A.; Sodeau, J.R.; Wenger, J.C. Characterisation of single particles from in-port ship emissions. Atmos. Environ. 2009, 43, 6408–6414. [Google Scholar] [CrossRef]
  44. Ault, A.P.; Gaston, C.I.; Wang, Y.; Dominguez, G.; Thiemens, M.H.; Prather, K.A. Characterization of the single particle mixing state of individual ship plume events measured at the Port of Los Angeles. Environ. Sci. Technol. 2010, 44, 1954–1961. [Google Scholar] [CrossRef] [PubMed]
  45. Xiao, Q.; Li, M.; Liu, H.; Deng, F.; Fu, M.; Man, H.; Jin, X.; Liu, S.; Lv, Z.; He, K. Characteristics of Marine Shipping Emissions at Berth: Profiles for PM and VOCs. Atmos. Chem. Phys. 2018, 18, 9527–9545. [Google Scholar] [CrossRef]
  46. Passig, J.; Schade, J.; Irsig, R.; Li, L.; Li, X.; Zhou, Z.; Adam, T.; Zimmermann, R. Detection of ship plumes from residual fuel operation in emission control areas using single-particle mass spectrometry. Atmos. Meas. Tech. 2021, 14, 4171–4185. [Google Scholar] [CrossRef]
  47. Li, L.; Huang, Z.; Dong, J.; Li, M.; Gao, W.; Nian, H.; Fu, Z.; Zhang, G.; Bi, X.; Cheng, P.; et al. Real time bipolar time-of-flight mass spectrometer for analyzing single aerosol particles. Int. J. Mass Spectrom. 2011, 303, 118–124. [Google Scholar] [CrossRef]
  48. Zhou, Y.; Huang, X.H.; Griffith, S.M.; Li, M.; Li, L.; Zhou, Z.; Wu, C.; Meng, J.; Chan, C.K.; Louie, P.K.; et al. A field measurement based scaling approach for quantification of major ions, organic carbon, and elemental carbon using a single particle aerosol mass spectrometer. Atmos. Environ. 2016, 143, 300–312. [Google Scholar] [CrossRef]
  49. Su, Y.; Sipin, M.F.; Furutani, H.; Prather, K.A. Development and characterization of an aerosol time-of-flight mass spectrometer with increased detection efficiency. Anal. Chem. 2004, 76, 712–719. [Google Scholar] [CrossRef]
  50. Pratt, K.A.; Mayer, J.E.; Holecek, J.C.; Moffet, R.C.; Sanchez, R.O.; Rebotier, T.P.; Furutani, H.; Gonin, M.; Fuhrer, K.; Su, Y.; et al. Development and characterization of an aircraft aerosol time-of-flight mass spectrometer. Anal. Chem. 2009, 81, 1792–1800. [Google Scholar] [CrossRef]
  51. Passig, J.; Schade, J.; Rosewig, E.I.; Irsig, R.; Kröger-Badge, T.; Czech, H.; Sklorz, M.; Streibel, T.; Li, L.; Li, X.; et al. Resonance-enhanced detection of metals in aerosols using single-particle mass spectrometry. Atmos. Chem. Phys. 2020, 20, 7139–7152. [Google Scholar] [CrossRef]
  52. Schade, J.; Passig, J.; Irsig, R.; Ehlert, S.; Sklorz, M.; Adam, T.; Li, C.; Rudich, Y.; Zimmermann, R. Spatially Shaped Laser Pulses for the Simultaneous Detection of Polycyclic Aromatic Hydrocarbons as well as Positive and Negative Inorganic Ions in Single Particle Mass Spectrometry. Anal. Chem. 2019, 91, 10282–10288. [Google Scholar] [CrossRef]
  53. Romay, F.J.; Roberts, D.L.; Marple, V.A.; Liu, B.Y.H.; Olson, B.A. A High-Performance Aerosol Concentrator for Biological Agent Detection. Aerosol Sci. Technol. 2002, 36, 217–226. [Google Scholar] [CrossRef]
  54. Zhou, Z.; Su, B.; Xie, Q.; Li, L.; Huang, Z.; Zhou, Z.; Mai, Z.; Tan, G. Imroved Aerodynamic Particle Concentrator for Single Particle Aerosol Mass Spectrometry: A Simulation and Characterization Study. Chin. J. Vac. Sci. Technol. 2021, 443–449. [Google Scholar] [CrossRef]
  55. Passig, J.; Schade, J.; Irsig, R.; Kröger-Badge, T.; Czech, H.; Adam, T.; Fallgren, H.; Moldanova, J.; Sklorz, M.; Streibel, T.; et al. Single-particle characterization of polycyclic aromatic hydrocarbons in background air in northern Europe. Atmos. Chem. Phys. 2022, 22, 1495–1514. [Google Scholar] [CrossRef]
  56. Zelenyuk, A.; Yang, J.; Choi, E.; Imre, D. SPLAT II: An Aircraft Compatible, Ultra-Sensitive, High Precision Instrument for In-Situ Characterization of the Size and Composition of Fine and Ultrafine Particles. Aerosol Sci. Technol. 2009, 43, 411–424. [Google Scholar] [CrossRef]
  57. Stein, A.F.; Draxler, R.R.; Rolph, G.D.; Stunder, B.J.B.; Cohen, M.D.; Ngan, F. NOAA’s HYSPLIT Atmospheric Transport and Dispersion Modeling System. Bull. Am. Meteorol. Soc. 2015, 96, 2059–2077. [Google Scholar] [CrossRef]
  58. Furutani, H.; Jung, J.; Miura, K.; Takami, A.; Kato, S.; Kajii, Y.; Uematsu, M. Single-particle chemical characterization and source apportionment of iron-containing atmospheric aerosols in Asian outflow. J. Geophys. Res. 2011, 116, D18. [Google Scholar] [CrossRef]
  59. Song, X.-H.; Hopke, P.K.; Fergenson, D.P.; Prather, K.A. Classification of Single Particles Analyzed by ATOFMS Using an Artificial Neural Network, ART-2A. Anal. Chem. 1999, 71, 860–865. [Google Scholar] [CrossRef]
  60. Sultana, C.M.; Cornwell, G.C.; Rodriguez, P.; Prather, K.A. FATES: A flexible analysis toolkit for the exploration of single-particle mass spectrometer data. Atmos. Meas. Tech. 2017, 10, 1323–1334. [Google Scholar] [CrossRef]
  61. Spencer, M.T.; Shields, L.G.; Sodeman, D.A.; Toner, S.M.; Prather, K.A. Comparison of oil and fuel particle chemical signatures with particle emissions from heavy and light duty vehicles. Atmos. Environ. 2006, 40, 5224–5235. [Google Scholar] [CrossRef]
  62. Toner, S.M.; Sodeman, D.A.; Prather, K.A. Single particle characterization of ultrafine and accumulation mode particles from heavy duty diesel vehicles using aerosol time-of-flight mass spectrometry. Environ. Sci. Technol. 2006, 40, 3912–3921. [Google Scholar] [CrossRef]
  63. Kerminen, V.-M.; Chen, X.; Vakkari, V.; Petäjä, T.; Kulmala, M.; Bianchi, F. Atmospheric new particle formation and growth: Review of field observations. Environ. Res. Lett. 2018, 13, 103003. [Google Scholar] [CrossRef]
  64. Merikanto, J.; Spracklen, D.V.; Mann, G.W.; Pickering, S.J.; Carslaw, K.S. Impact of nucleation on global CCN. Atmos. Chem. Phys. 2009, 9, 8601–8616. [Google Scholar] [CrossRef]
  65. Spracklen, D.V.; Carslaw, K.S.; Kulmala, M.; Kerminen, V.-M.; Mann, G.W.; Sihto, S.-L. The contribution of boundary layer nucleation events to total particle concentrations on regional and global scales. Atmos. Chem. Phys. 2006, 6, 5631–5648. [Google Scholar] [CrossRef]
  66. Winnes, H.; Granberg, M.E.; Magnusson, K.; Malmaeus, K.; Mellin, A.; Stripple, H.; Yaramenka, K.; Zhang, Y. Scrubbers: Closing the Loop; Activity 3. Task 2; Risk Assessment of Marine Exhaust Gas Scrubber Water. Available online: https://www.ivl.se/english/ivl/publications/publications/scrubbers-closing-the-loop-activity-3.-task-2-risk-assessment-of-marine-exhaust-gas-scrubber-water.html (accessed on 2 March 2023).
  67. Ault, A.P.; Moore, M.J.; Furutani, H.; Prather, K.A. Impact of emissions from the Los Angeles port region on San Diego air quality during regional transport events. Environ. Sci. Technol. 2009, 43, 3500–3506. [Google Scholar] [CrossRef]
  68. Viana, M.; Amato, F.; Alastuey, A.; Querol, X.; Moreno, T.; Dos Santos, S.G.; Herce, M.D.; Fernández-Patier, R. Chemical tracers of particulate emissions from commercial shipping. Environ. Sci. Technol. 2009, 43, 7472–7477. [Google Scholar] [CrossRef]
  69. Shields, L.G.; Suess, D.T.; Prather, K.A. Determination of single particle mass spectral signatures from heavy-duty diesel vehicle emissions for PM2.5 source apportionment. Atmos. Environ. 2007, 41, 3841–3852. [Google Scholar] [CrossRef]
  70. Toner, S.M.; Shields, L.G.; Sodeman, D.A.; Prather, K.A. Using mass spectral source signatures to apportion exhaust particles from gasoline and diesel powered vehicles in a freeway study using UF-ATOFMS. Atmos. Environ. 2008, 42, 568–581. [Google Scholar] [CrossRef]
  71. Moldanová, J.; Fridell, E.; Popovicheva, O.; Demirdjian, B.; Tishkova, V.; Faccinetto, A.; Focsa, C. Characterisation of particulate matter and gaseous emissions from a large ship diesel engine. Atmos. Environ. 2009, 43, 2632–2641. [Google Scholar] [CrossRef]
  72. Murphy, S.M.; Agrawal, H.; Sorooshian, A.; Padró, L.T.; Gates, H.; Hersey, S.; Welch, W.A.; Lung, H.; Miller, J.W.; Cocker, D.R.; et al. Comprehensive simultaneous shipboard and airborne characterization of exhaust from a modern container ship at sea. Environ. Sci. Technol. 2009, 43, 4626–4640. [Google Scholar] [CrossRef]
  73. Gaie-Levrel, F.; Perrier, S.; Perraudin, E.; Stoll, C.; Grand, N.; Schwell, M. Development and characterization of a single particle laser ablation mass spectrometer (SPLAM) for organic aerosol studies. Atmos. Meas. Tech. 2012, 5, 225–241. [Google Scholar] [CrossRef]
  74. Seinfeld, J.H.; Pandis, S.N. Atmospheric Chemistry and Physics: From Air Pollution to Climate Change, 3rd ed.; Wiley: Hoboken, NJ, USA, 2016; ISBN 978-1-118-94740-1. [Google Scholar]
  75. Dall’Osto, M.; Beddows, D.C.S.; Kinnersley, R.P.; Harrison, R.M.; Donovan, R.J.; Heal, M.R. Characterization of individual airborne particles by using aerosol time-of-flight mass spectrometry at Mace Head, Ireland. J. Geophys. Res. 2004, 109, D21. [Google Scholar] [CrossRef]
  76. Dallosto, M.; Harrison, R. Chemical characterisation of single airborne particles in Athens (Greece) by ATOFMS. Atmos. Environ. 2006, 40, 7614–7631. [Google Scholar] [CrossRef]
  77. Dall’Osto, M.; Beddows, D.C.S.; McGillicuddy, E.J.; Esser-Gietl, J.K.; Harrison, R.M.; Wenger, J.C. On the simultaneous deployment of two single-particle mass spectrometers at an urban background and a roadside site during SAPUSS. Atmos. Chem. Phys. 2016, 16, 9693–9710. [Google Scholar] [CrossRef]
  78. Badeke, R.; Matthias, V.; Grawe, D. Parameterizing the vertical downward dispersion of ship exhaust gas in the near field. Atmos. Chem. Phys. 2021, 21, 5935–5951. [Google Scholar] [CrossRef]
  79. Matthias, V.; Arndt, J.A.; Aulinger, A.; Bieser, J.; van der Denier Gon, H.; Kranenburg, R.; Kuenen, J.; Neumann, D.; Pouliot, G.; Quante, M. Modeling emissions for three-dimensional atmospheric chemistry transport models. J. Air Waste Manag. Assoc. 2018, 68, 763–800. [Google Scholar] [CrossRef] [PubMed]
Figure 1. The map section of the region for overview illustrates the position of the research vessel in the Bay of Lübeck (Baltic Sea), wind direction, as well as the course of the shipping route to Lübeck/Travemünde.
Atmosphere 14 00849 g001
Figure 2. (a) Total number concentration of airborne particles from CPC with a resolution of 1 s shows several tagged single events throughout the measurement day, which were evaluated for this publication and are related to ship passages. (b) Mass concentration of airborne particles measured by SMPS in a size range of 10–1000 nm. Calculated particle mass from SMPS data with a relative density of 1.0. (c) Average anion mass spectra (neg. LDI) and cation mass spectra (pos. LDI) from the single pollution event II, showing ion signatures of residual fuel emission particles and a mean aerodynamic diameter of ~520 nm.
Atmosphere 14 00849 g002
Figure 3. Percentage distribution of particle classes according to the cluster analysis shown in Figure A2 for onboard measurements on 15 September 2022. The particle classes sea salt, K-CN, KCN sulfate, and unclassified particles already contain about 79% of all clustered particles, and only about 5% of all clustered particles can be attributed to fossil fuel combustion. About 1% of the particles showed a V–Fe–Ni-rich signature and can be directly attributed to ship emissions from residual fuel combustion.
Atmosphere 14 00849 g003
Figure 4. Illustrates the evaluation of the five individual pollution events on 15 September 2022, in temporal order from top to bottom (I–V). Section (a) visualizes the data of the measured size distribution of mSEMS and aMCPC of each ship exhaust plume over time and in a size range of 5–300 nm. Section (b) provides SPMS data on the duration of the plume, the fraction of ship exhaust particles out of the total number of particles measured, the mean aerodynamic diameter of ship exhaust particles measured in the SPMS, the peak ratio of V and Fe, as well as the relative intensity of 97HSO4 ions to distinguish between distillate and residual fuel. Section (c) depicts the average mass spectra of positive and negative ions from SPMS of identified ship particles from each pollution event. Key ions for the evaluation of ship particles in ambient air are marked (40Ca+, 51V+, 54/56Fe+, 67VO+, 46NO2, 62NO3, 80SO3, and 97HSO4). While the ion patterns suggest that pollution events I–IV originated from bunker fuel combustion, the particles from event V are more likely to have originated from distillate fuel combustion.
Atmosphere 14 00849 g004
Disclaimer/Publisher’s Note: The statements, opinions and data contained in all publications are solely those of the individual author(s) and contributor(s) and not of MDPI and/or the editor(s). MDPI and/or the editor(s) disclaim responsibility for any injury to people or property resulting from any ideas, methods, instructions or products referred to in the content.

