1. Introduction
Since the industrial revolution of the 18th century, humans have burned a large amount of fossil fuels and emitted a large volume of greenhouse gases, such as carbon dioxide, into the air, exacerbating the greenhouse effect. Global temperatures are experiencing warming-dominated climate change, and precipitation has also experienced spatiotemporal differences in response to the impact of climate warming, but there is no certain trend of change [
1,
2]. The sixth report of the IPCC (AR6) points out that in 2020 alone, the global land surface and ocean surface temperatures will rise by 1.59 °C and 0.88 °C, respectively [
3]. The climate and environment in arid and semi-arid regions are fragile and sensitive, and the response to global climate change is more obvious [
4]. Rivers are significantly affected by climate change, and respond to changes in temperature and precipitation, causing fluctuations in hydrological factors such as flow, water level, and flow velocity to varying degrees [
5], leading to serious impacts on the stability of the ecological environment of the river and its watershed [
6]. Therefore, how to deal with climate change has become a hot and important issue in river research [
7].
At the same time, with the rapid development of human society, the excessive development and utilization of water resources are becoming increasingly serious. Rivers have encountered problems such as sharp decreases in river flow, soil erosion, water resource shortage, and vegetation degradation, making it difficult to ensure ecological water use in rivers [
8,
9,
10]. In order to alleviate the contradiction between human water use and ecological environment water use, ecological base flow has emerged, and American scholars have been the first to carry out relevant research [
11]. There are different definitions for river conditions in different regions, and the widely recognized concept of ecological base flow refers to the minimum flow that maintains the basic ecological functions of a river and avoids irreversible damage to aquatic communities [
12,
13,
14].
At present, relevant research on ecological base flow mainly focuses on ecological water transportation and scheduling, fishery resources and biodiversity protection, ecological environment governance and restoration, tourism and navigation demand maintenance, ecological compensation mechanism countermeasures, river ecosystem balance, and watershed ecological protection and renewable development, which are derived from ecological base flow calculation methods and their guarantee rates [
15,
16,
17]. Moreover, a relatively complete theoretical and computational system has been formed and there are relatively rich evaluation indicators [
18,
19]. However, there is relatively little research on the ecological base flow of inland rivers in arid areas against the background of climate change [
20]. No research to date has clearly revealed the changing characteristics of river ecological base flow under climate change. Therefore, it is very necessary to carry out research on river ecological base flow in inland arid areas under climate change.
The northern slope of the Kunlun Mountains is a typical inland arid region located in the hinterland of Eurasia, with very sparse precipitation, uneven spatial and temporal distribution of water resources, sparse vegetation, widespread deserts, very fragile ecological environment, sensitive and fragile river ecosystems, and serious ecological water use problems [
21,
22,
23]. With the intensification of human activities and climate change [
24], ecological water use in river basins will be further threatened by water pollution and water shortage [
25]. However, there is currently no research on ecological base flow of rivers in the region in the context of climate change, so carrying out relevant research has very important practical significance.
In this paper, the Kriya, Niya, and Qarqan Rivers on the northern slope of the Kunlun Mountains are selected as typical research objects to analyze the characteristics of climate change in the basin. At the same time, four different hydrological methods are used to calculate the ecological base flow values of three rivers, determine the most suitable calculation method and recommended ecological base flow values, and analyze the change characteristics of the ecological base flow of each river under climate change, and analyze the correlation between them, thereby establishing a model for the change of ecological base flow with temperature and precipitation. It is expected that this will provide a scientific basis for revealing the spatiotemporal differentiation of ecological base flow of rivers on the northern slope of the Kunlun Mountains under climate change, providing protection objectives for ecological base flow in the basin, and achieving optimal allocation of regional water resources and ecological protection.
2. Data and Methods
2.1. Overview of the Research Area
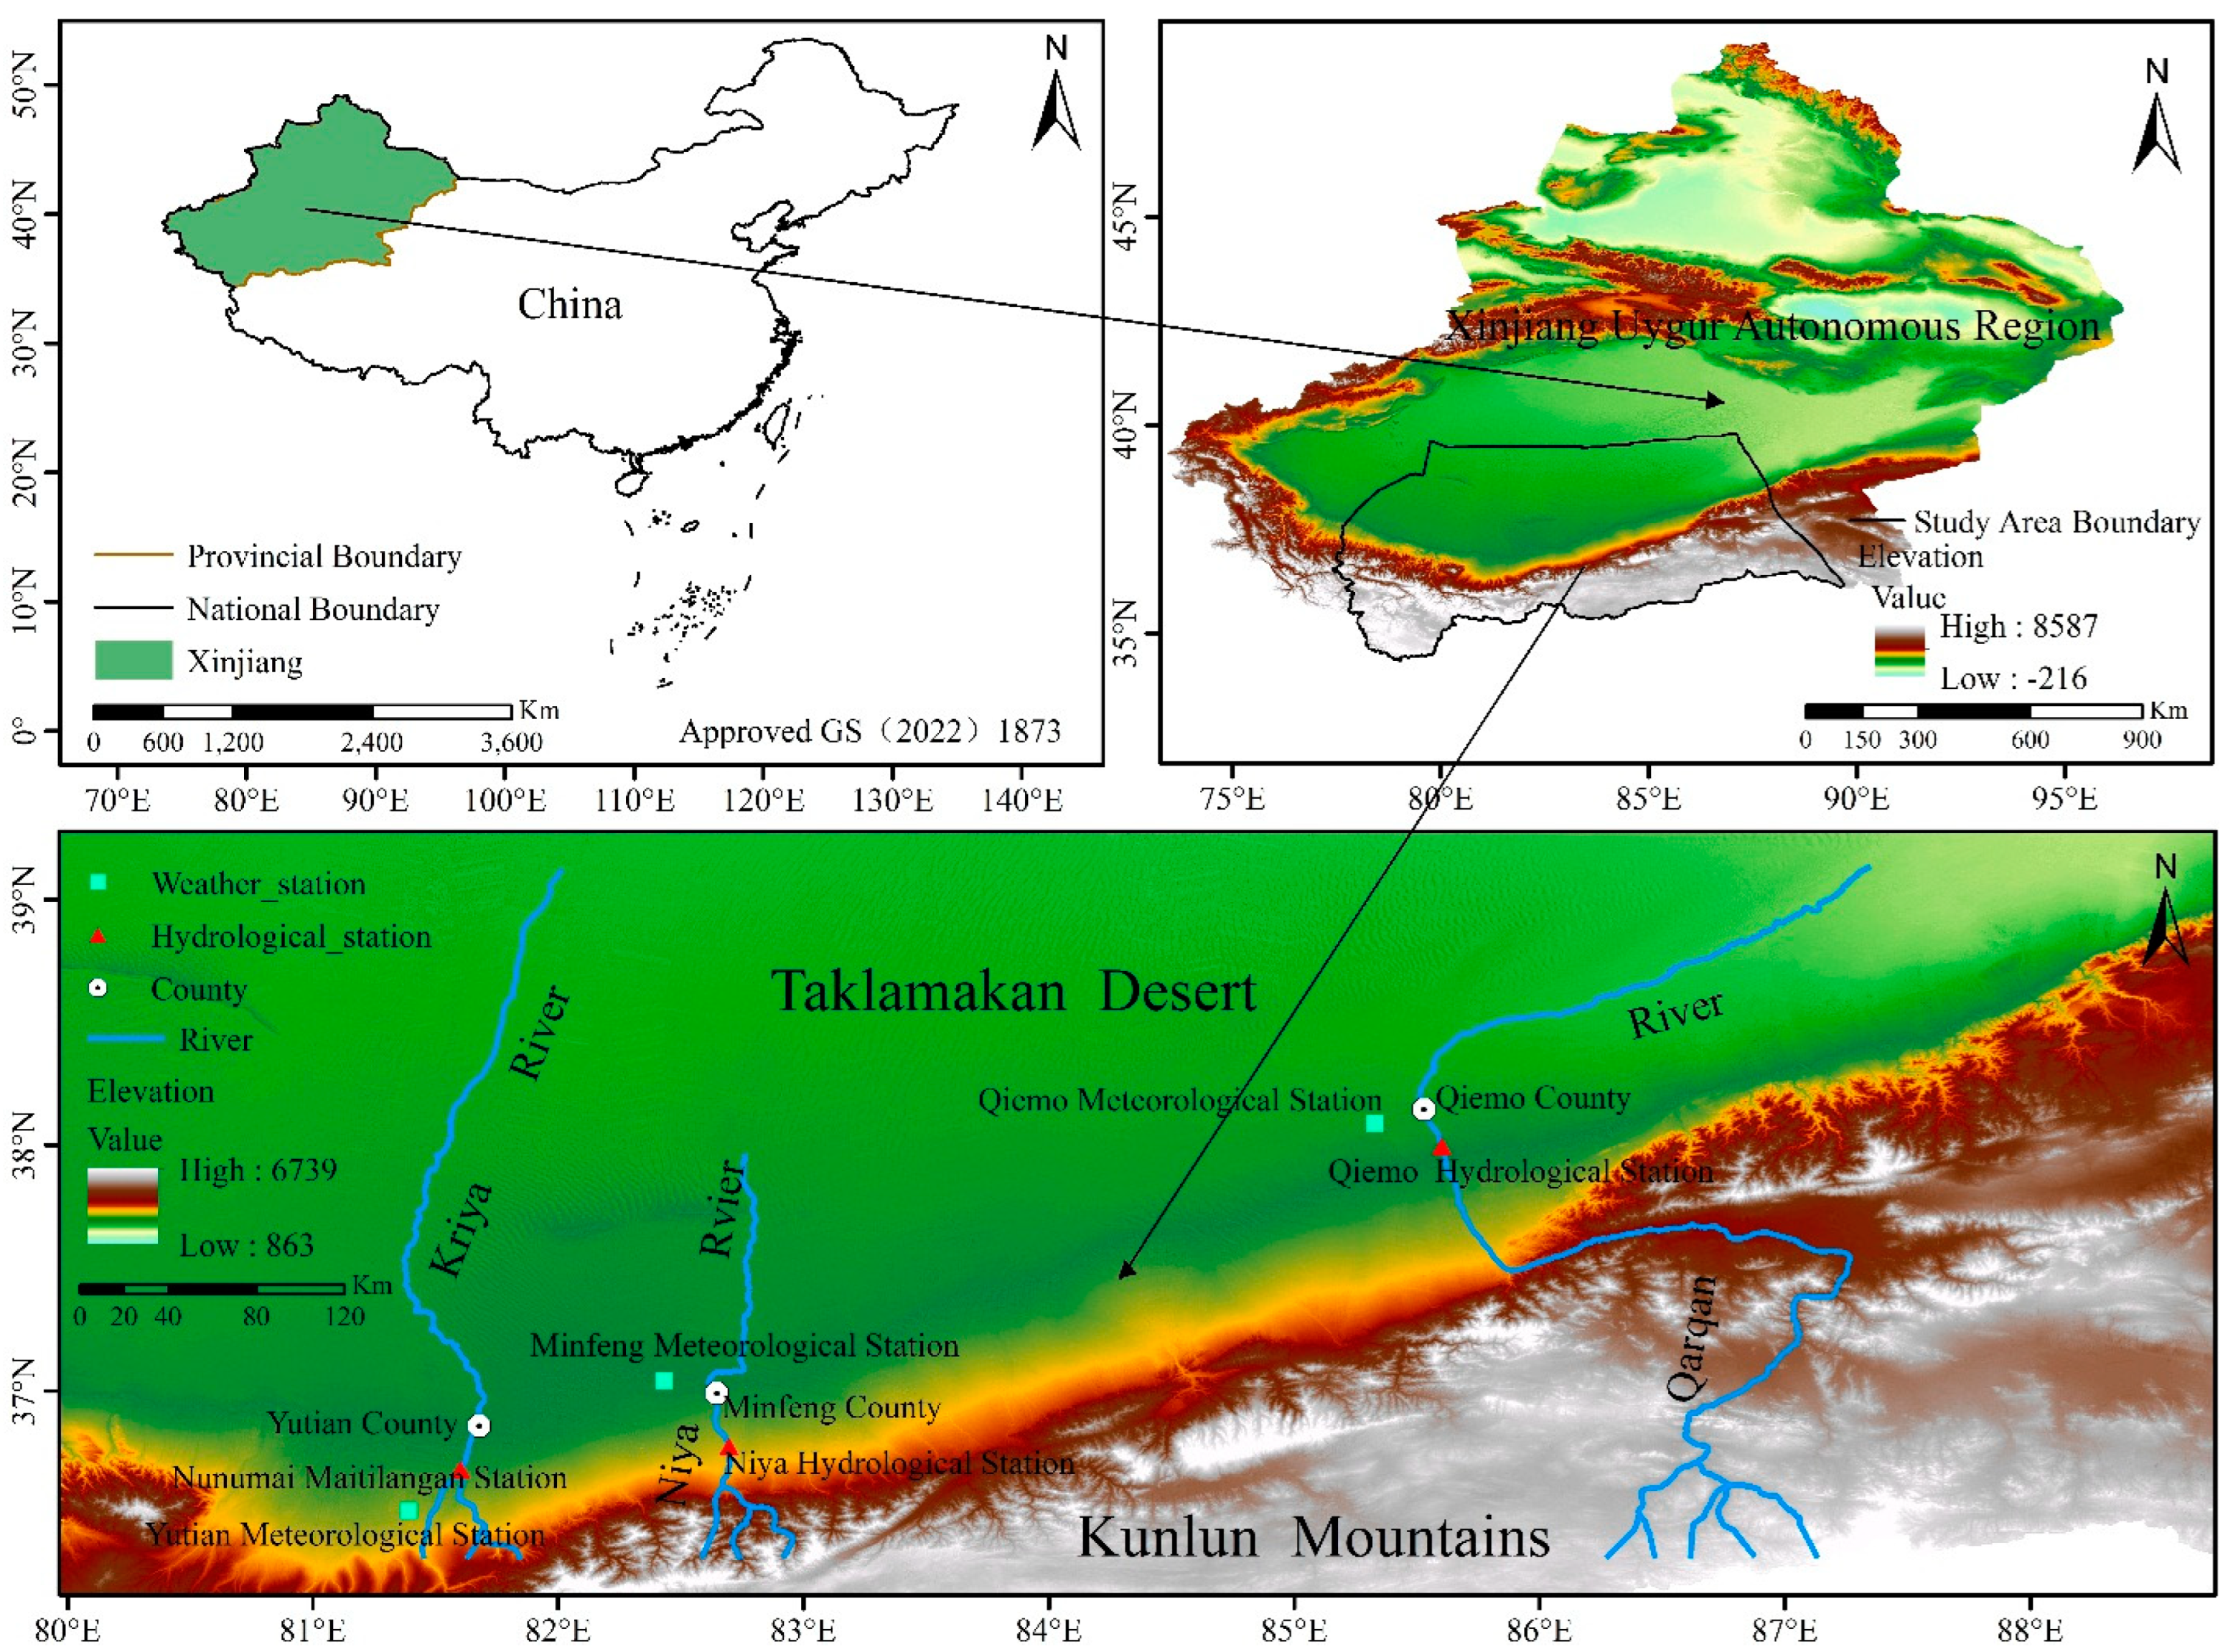
The research area is located in the Xinjiang Uygur Autonomous Region on the northern slope of the Kunlun Mountains in western China. The main sources of river recharge in the basin are precipitation and ice and snow melt water [
26]. The lack of water resources has been an important factor restricting the socio-economic development of the region. The Kriya River is the largest inland river on the northern slope of the Kunlun Mountains, except for the Hotan River. It is located in Yutian County, Hotan Prefecture, Xinjiang. It originates from the Kriya Mountain on the northern slope of the Wustenge Mountain, the main peak of the Kunlun Mountains, and runs through the entire Yutian County from south to north. It disappears in the hinterland of the Taklimakan Desert, with a total length of about 770 km and a total drainage area of about 39,558 km
2 [
27]. The Niya River is a representative of many small rivers on the northern slope of the Kunlun Mountains, located in Minfeng County, Hotan Prefecture, Xinjiang. It originates from the Lushtag Peak on the northern slope of the Kunlun Mountains, with a north-south trend. The end of the river disappears in the depths of the Taklimakan Desert, with a length of about 200 km from north to south and a width of 40 to 90 km from east to west. The total drainage area is 10,160.96 km
2 [
28]. The Qarqan River is the largest river among the small rivers on the northern slope of the Kunlun Mountains, located in Qiemo County, Bayingolin Mongol Autonomous Prefecture, Xinjiang. It originates from the Muzitag Peak on the northern slope of the Kunlun Mountains and eventually flows into the Taitema Lake on the edge of the Taklimakan Desert. The river trend is variable, with a length of about 813 km [
29]. There are three national basic hydrological stations on the Kriya River, the Niya River, and the Chelten River: the Nunumai Maitirangan Station; the Niya Hydrological Station; and the Qiemo Hydrological Station (
Figure 1).
2.2. Data Sources
(1) Meteorological data. In order to facilitate comparison and analysis, this study selected the meteorological data recorded by the Yutian Meteorological Station, Minfeng Meteorological Station, and Qiemo Meteorological Station, where the Kriya River, Niya River, and Chelchen River are located, with the common observation time series of 1958–2019. The main data used include daily, monthly, and annual temperature and precipitation, all of which are sourced from the China Meteorological Data Network. The temperature is automatically monitored and recorded through a standard shutter box, and the precipitation is manually observed and recorded using a 20 cm standard rain gauge.
(2) Hydrological data. This paper selects the relevant hydrometeorological data measured and recorded by three national basic hydrological stations, namely, the Nunumai Maitilangan Station, the Niya Hydrological Station, and the Qiemo Hydrological Station, established on three rivers on the northern slope of the Kunlun Mountains (
Table 1), including the monthly runoff, monthly average temperature, monthly precipitation, and annual runoff of the Nunumai Maitilangan Station from 1957 to 2018, the Niya River Niya Hydrological Station from 1978 to 2018, and the Qarqan River from 1958 to 2014. The measured data such as annual average temperature and annual precipitation are all derived from the Hydrological Data of the Tarim River Basin, a hydrological yearbook of the People’s Republic of China. On this basis, we calculated and analyzed the ecological base flow, spatiotemporal variation, and influencing factors of the three rivers on the northern slope of the Kunlun Mountains under the background of climate change, providing scientific reference for the management and scheduling of river water resources in arid areas.
2.3. Models and Methods
2.3.1. Calculation Method
(1) Tennant method [
30]. This method is a standard setting method for off-site measurement types proposed by Tennant et al. on 58 cross sections of 11 rivers in the United States, analyzing the impact of different flows on fisheries. The ecological base flow is 10% to 30% of the multi-year average flow of the river (at the same time, here, monthly), as the study area belongs to a typical arid area, and all three rivers are seasonal rivers. The ecological base flow standard recommended by Tennant method in
Table S1. Based on the characteristics of the rivers, this study made appropriate improvements to the Tennant method. The flood season was changed to May–October, and the dry season was changed to November–April of the next year. Based on this, the ecological base flow standard for the rivers on the northern slope of the Kunlun Mountains was obtained. The specific calculation formula for the Tennant method is as follows:
where,
Qk is the ecological base flow of the
k-th month in m
3·s
−1;
Mk is the average flow in the
k-th month in m
3·s
−1;
Nk is the percentage of ecological base flow corresponding to month
k.
(2) QP method [
31]. This method is improved from the US 7Q10 method [
32] for water pollution detection and ecological base flow calculation in China. Also known as the average value method of the driest month at different frequencies, it is based on the natural monthly average flow, monthly average water level, or runoff of the node’s long time series (a > 30 years), using the driest month of each year as a frequency curve, and selecting the average flow, monthly average water level, or runoff of the driest month at different frequencies as the minimum value of the node’s basic ecological environmental water demand. The formula is as follows:
where,
Qp is the ecological base flow at frequency
p in m
3·s
−1,
f is the frequency curve function,
q is the monthly average flow in m
3·s
−1, and
qp is equal to frequency
p. According to the “Calculation Specification for Water Demand of River and Lake Ecological Environment” [
32], the frequency
p in this article is selected as 95%.
(3) Average flow method for the driest month in the past 10 years [
33]. The lowest natural monthly average flow in the past 10 years is selected as the ecological base flow. Although the hydrological observation data series required by this method are relatively short, the hydrological data time scales selected in this study are all above 40 years, which can ensure consistency with the time scales of other calculation methods, hereinafter referred to as the DM method. The specific calculation formula is as follows:
where,
Qk is the ecological base flow of the
k-th month in m
3·s
−1;
Mkd is the daily average flow in m
3·s
−1 on day d of month
k, and
n is the time scale of hydrological data.
(4) Texas method [
34]. By calculating the monthly flow frequency, a specific percentage of the 50% guarantee rate corresponding to the monthly average flow is taken as the ecological base flow. Referring to the research results of other relevant domestic scholars [
35,
36], this article selects a design guarantee rate of 50%, corresponding to 20% of the monthly average flow as the ecological base flow value.
2.3.2. Analysis Method
(1) Significance test. F-test: in order to ensure the reliability of the data, the F-test is used to test its significance. The results show that all the above hydrological and meteorological data can pass the significance test standard with a significance level of 0.05, which meets the requirements of further analysis and research.
(2) Trend analysis. In order to reflect the changes in temperature, precipitation, and ecological base flow during different periods and predict future development trends, it is necessary to conduct trend analysis and create a trend change chart based on this to visually analyze the current and future changes in temperature, precipitation, and ecological base flow on the northern slope of the Kunlun Mountains. Using regression trend analysis, make a trend line to determine the trend of temperature, precipitation, and ecological base flow changes in the watershed. The specific formula is as follows:
where,
y is the dependent variable (temperature, precipitation, or ecological base flow), and
x is the independent variable (time),
ε is a constant term.
(3) Correlation analysis. Judging the impact of climate change on ecological base flow, and discussing its related direction and degree of correlation are the basic analysis methods for studying the characteristics of ecological base flow under climate change on the north slope of Kunlun Mountains. Pearson correlation is adopted in this paper, and its calculation formula is as follows:
where,
rxy is the correlation coefficient between temperature, precipitation and ecological base flow,
xi is the annual temperature(precipitation) value in time period
i,
is the average multi-year temperature (precipitation) change value,
yi is the annual ecological base flow value in time period
i,
is the average multi-year ecological base flow change value.
3. Result Analysis
3.1. Climate Change Characteristics
3.1.1. Interannual Characteristics
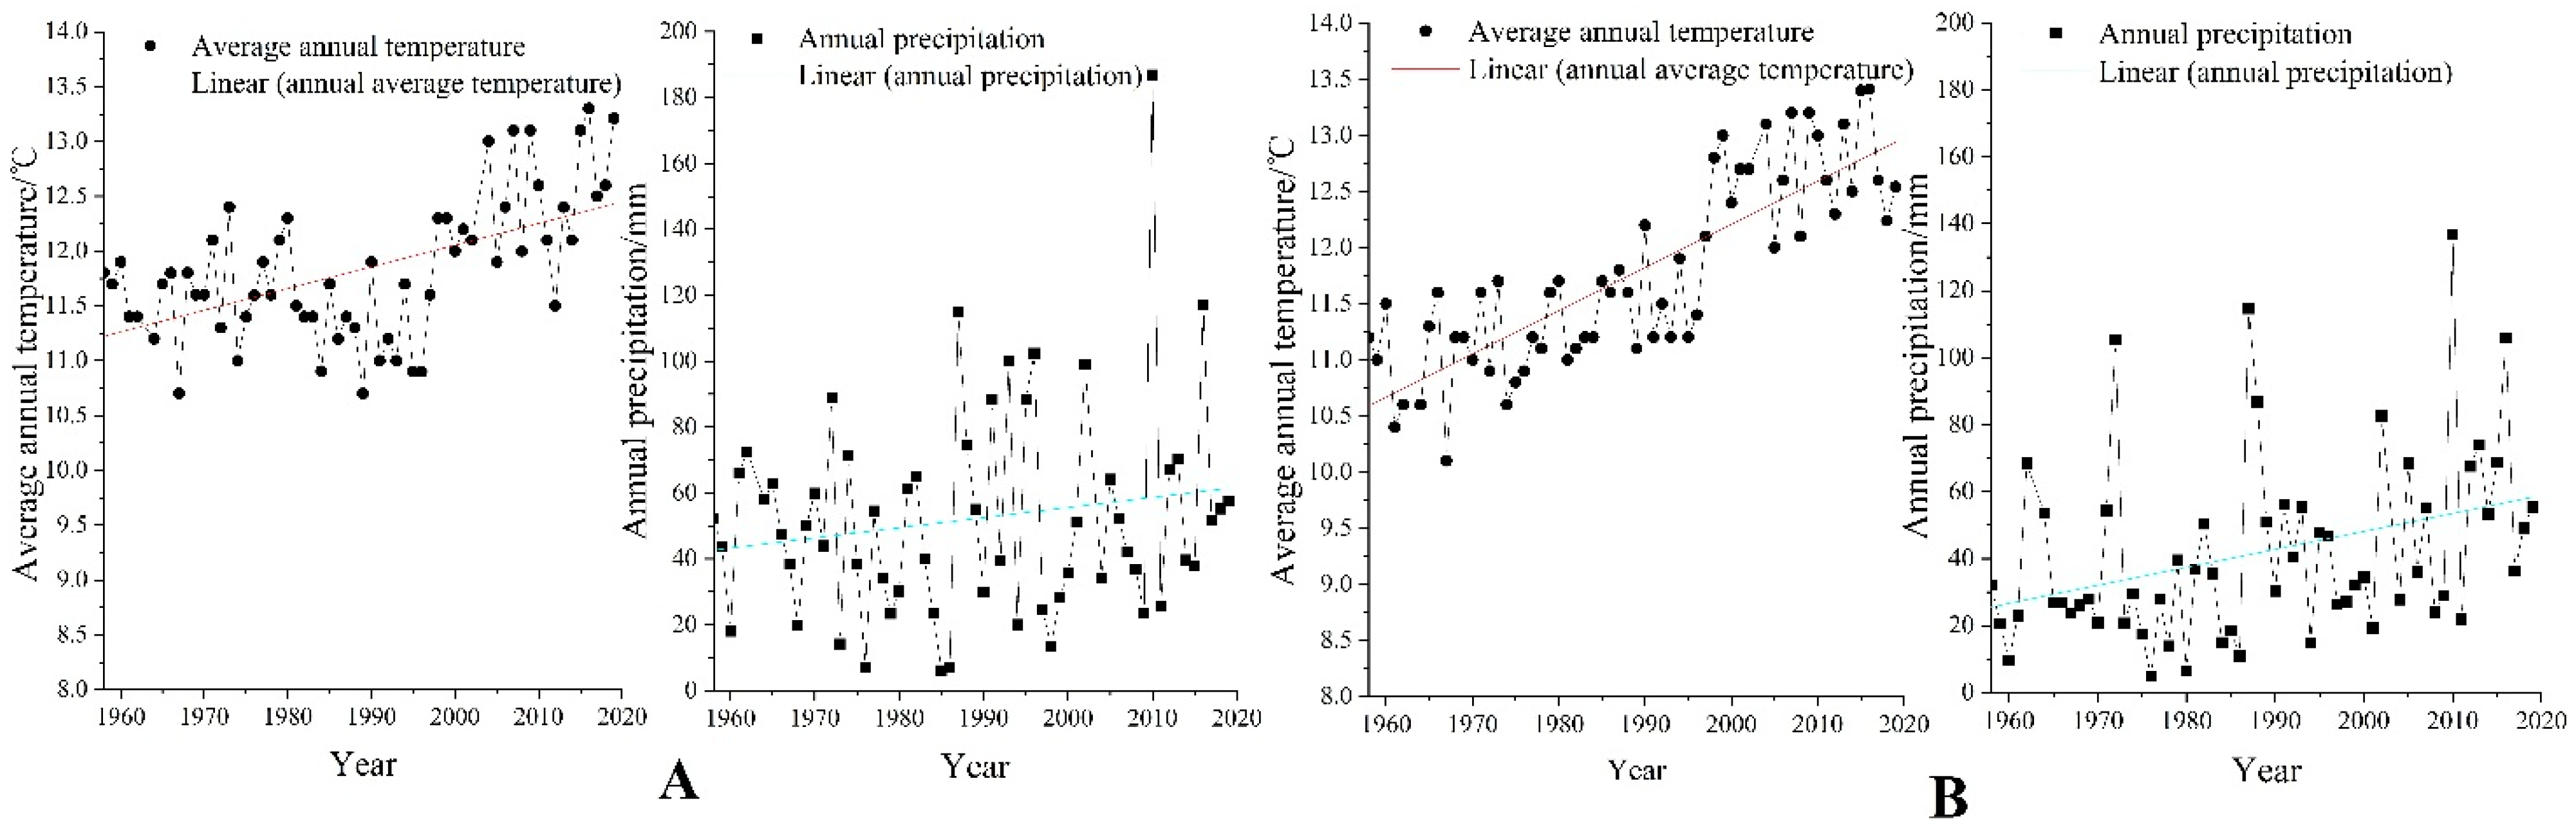
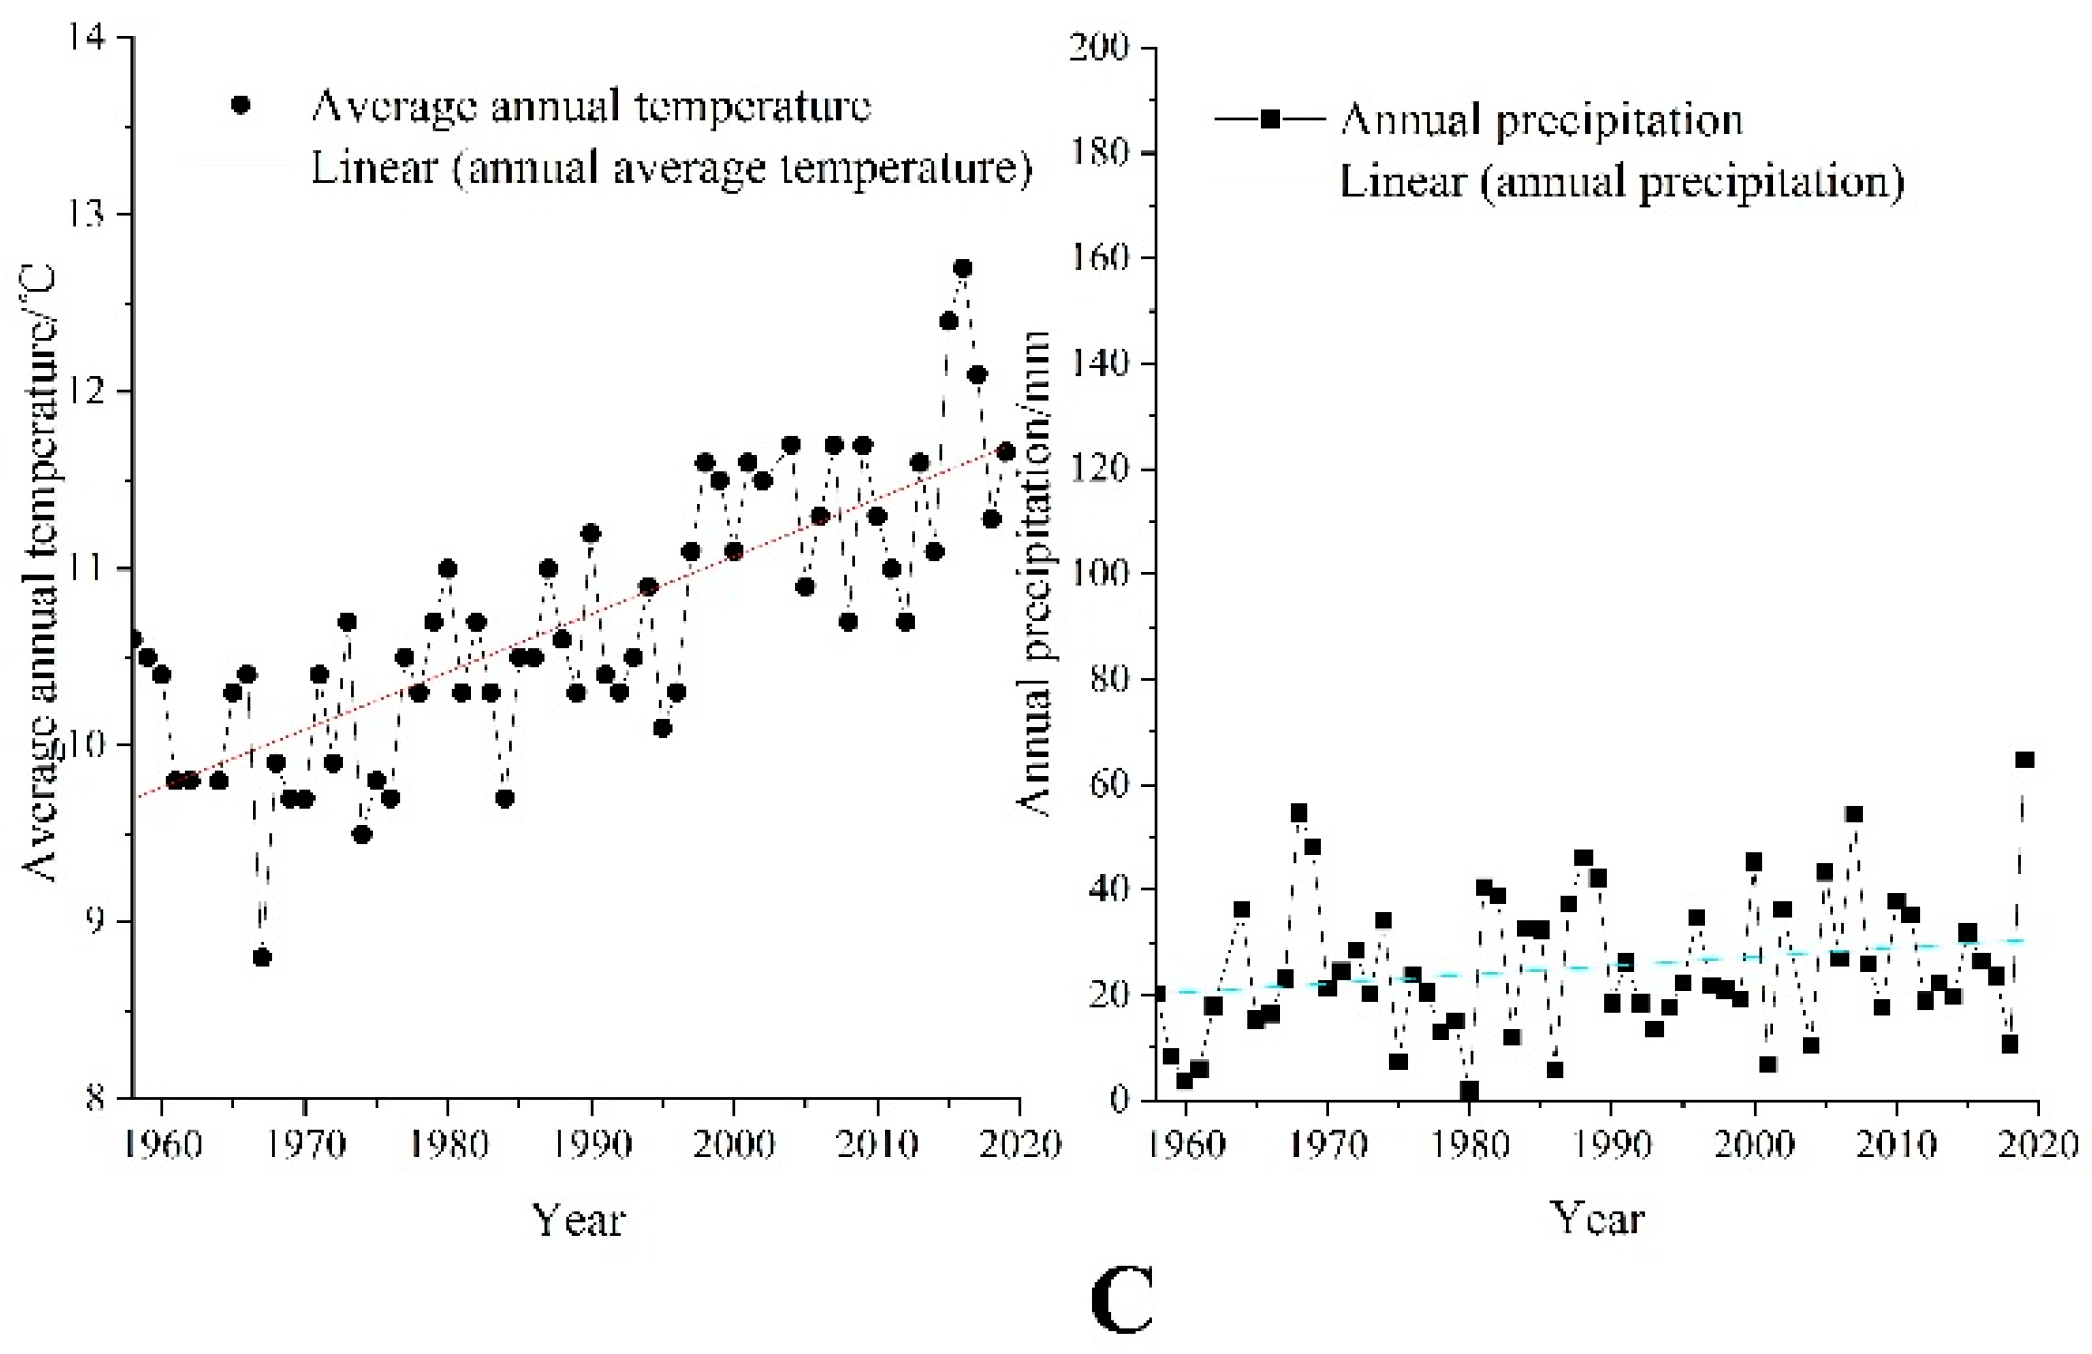
Through trend analysis and linear fitting of the temperature data recorded by meteorological stations for three typical rivers on the northern slope of the Kunlun Mountains, it is concluded that the temperatures of the Kriya River, the Niya River, and the Qarqan River basins warmed at the rates of 0.235 °C•(10a)
−1, 0.223 °C•(10a)
−1, and 0.177 °C•(10a)
−1, respectively, from 1958 to 2019, and precipitation increased at the rates of 0.88 mm•(10a)
−1, 3.90 mm•(10a)
−1, and 7.92 mm•(10a)
−1, respectively. From
Figure 2, it can be seen that the overall trend of annual average temperature changes in the three rivers in the study area from 1958 to 2019 is consistent, and they have been in the process of fluctuating and rising. The maximum and minimum annual temperatures of the Kriya River are 13.3 and 10.7 °C, respectively, with a range of 2.6 °C. The maximum and minimum values of the Niya River are 13.41 and 10.1 °C, with a range of 3.4 °C. The maximum and minimum values of the Qarqan River are 12.7 and 8.8 °C, with a range of 3.9 °C. During the past 60 years, the annual precipitation variation trend of the three rivers in the study area is similar to the annual average temperature, both of which are in the process of fluctuation and increase, and the relative fluctuation frequency and amplitude are greater. The maximum and minimum annual precipitation of the Kriya River are 186.9 mm and 6.2 mm, and the range value is 180.7 mm. The maximum and minimum values of the Niya River are 136.9 mm and 4.8 mm, and the range value is 132.1 mm. The maximum and minimum values of the Qarqan River are 64.7 and 1.9, and the range value is 62.8 mm.
Although the temperature and precipitation of the three rivers are characterized by the Kriya River, the Niya River, and the Qarqan River, there is a spatial differentiation phenomenon, but the overall trend is upward fluctuations. Therefore, it can be concluded that the basins on the northern slope of the Kunlun Mountains are experiencing slow fluctuations in warming and humidifying on an interannual scale.
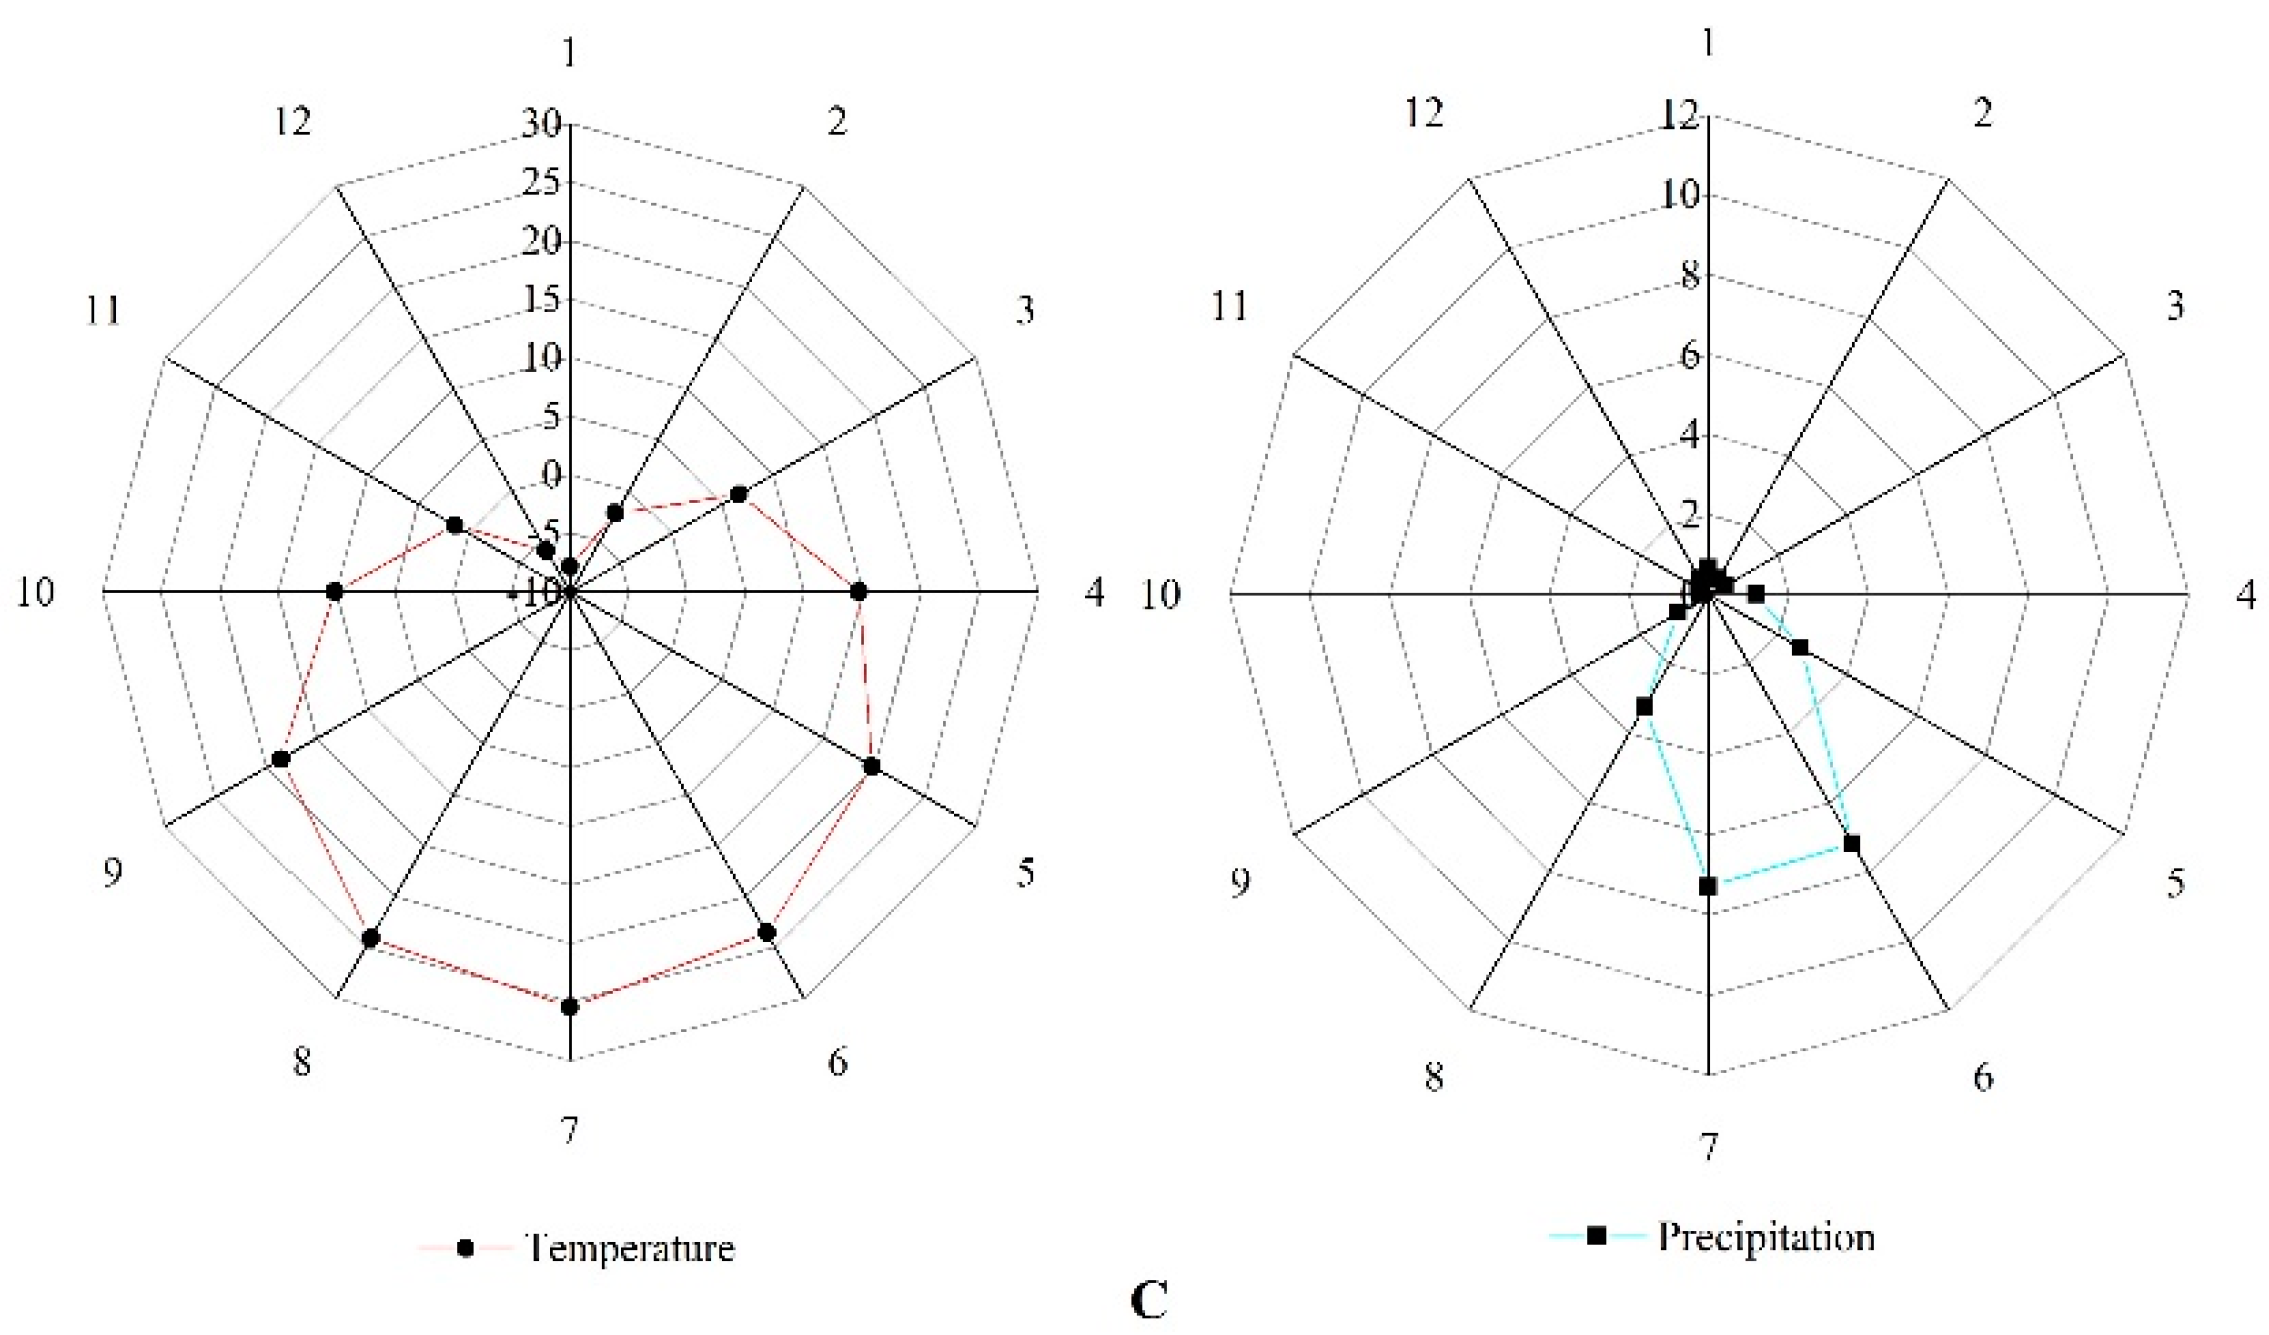
3.1.2. Characteristics within the Year
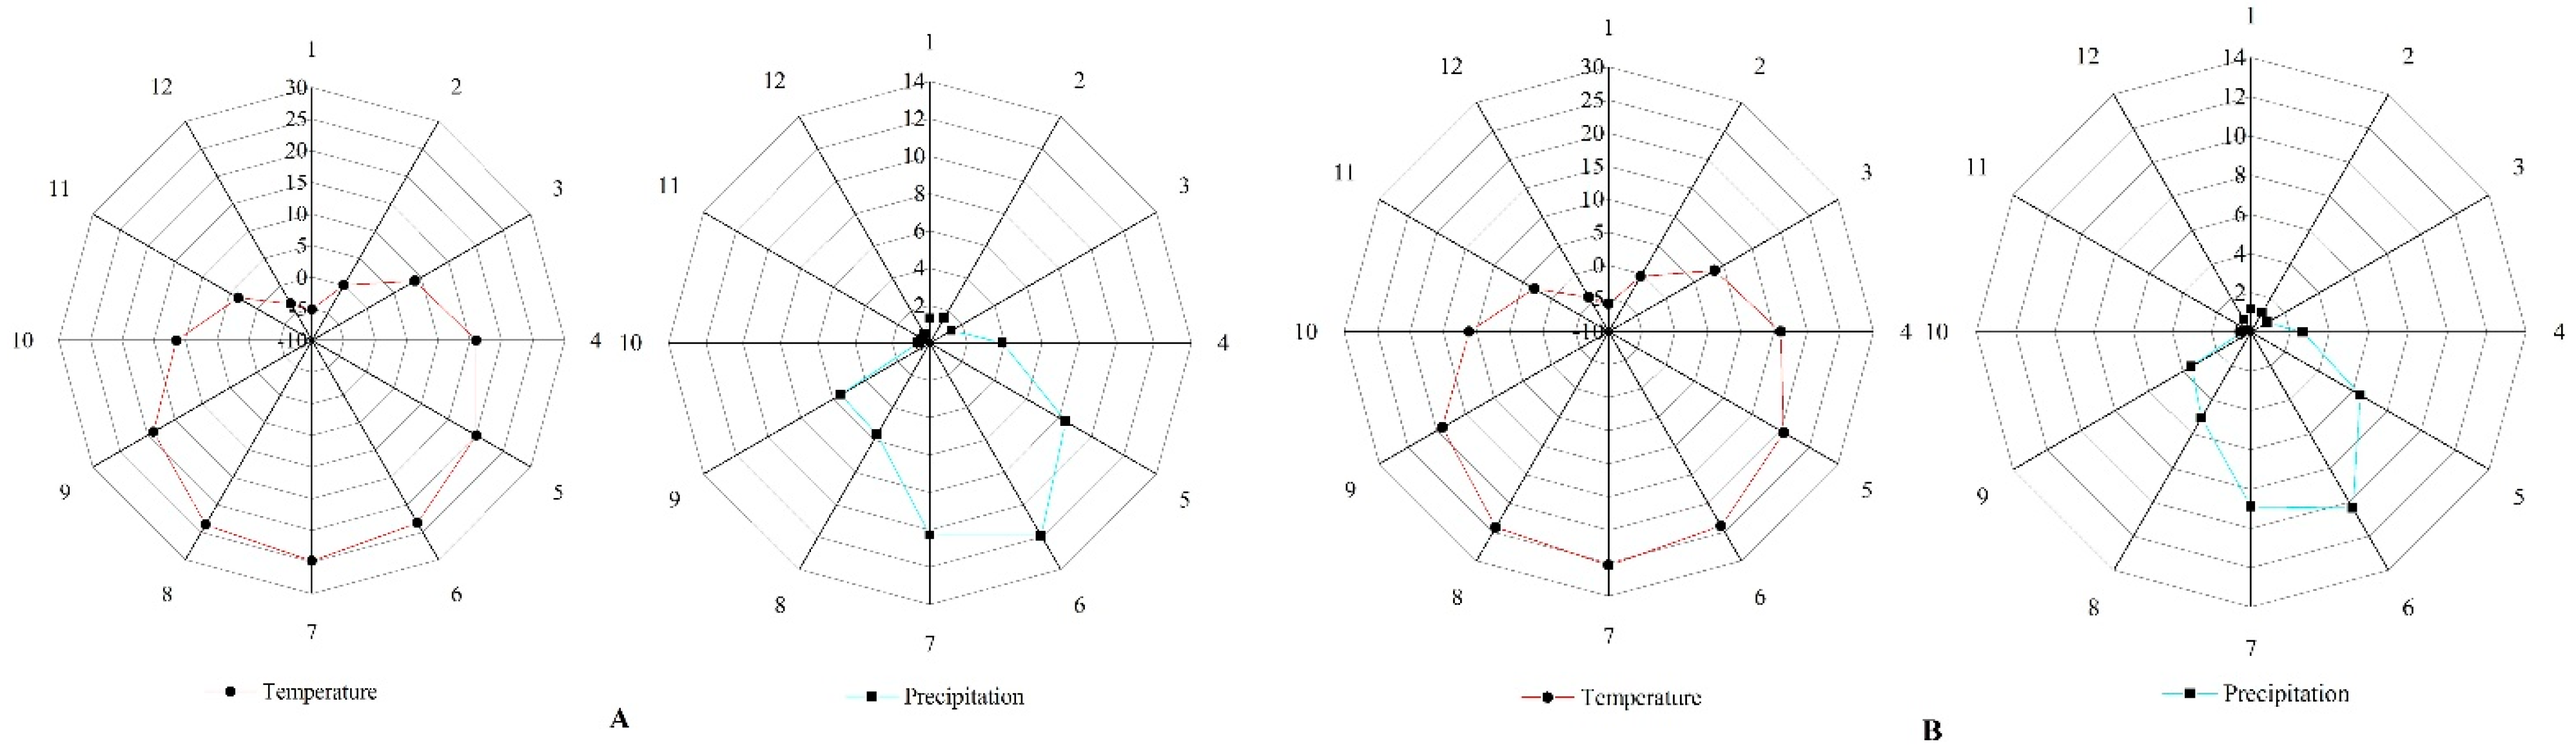
By calculating the annual average monthly temperature and annual precipitation values of the three rivers, and using radar analysis to further study the annual climate change characteristics of typical rivers on the northern slope of the Kunlun Mountains, the monthly average temperature and annual precipitation change results within the year are obtained (
Figure 3). In general, the average maximum monthly temperature of the three rivers occurred in July, with 24.84 °C, 25.36 °C, and 25.44 °C, respectively. The average monthly minimum values of temperature all occur in January, respectively −5.13 °C, −5.81 °C, and −7.82 °C. The maximum monthly precipitation within the year occurs in June or July, with 11.92 mm, 10.35 mm, and 7.29 mm, respectively; The minimum monthly precipitation values are usually in October or November 0.42 mm, 0.19 mm, and 0.22 mm, respectively. Therefore, it can be concluded that the annual climate in the study area is characterized by a distinct temperate continental climate, with significant seasonal changes. The monthly temperature fluctuates sharply, with significant changes in height and height. The monthly precipitation is generally small and there are significant differences from month to month.
3.2. Characteristics of Ecological Base Flow
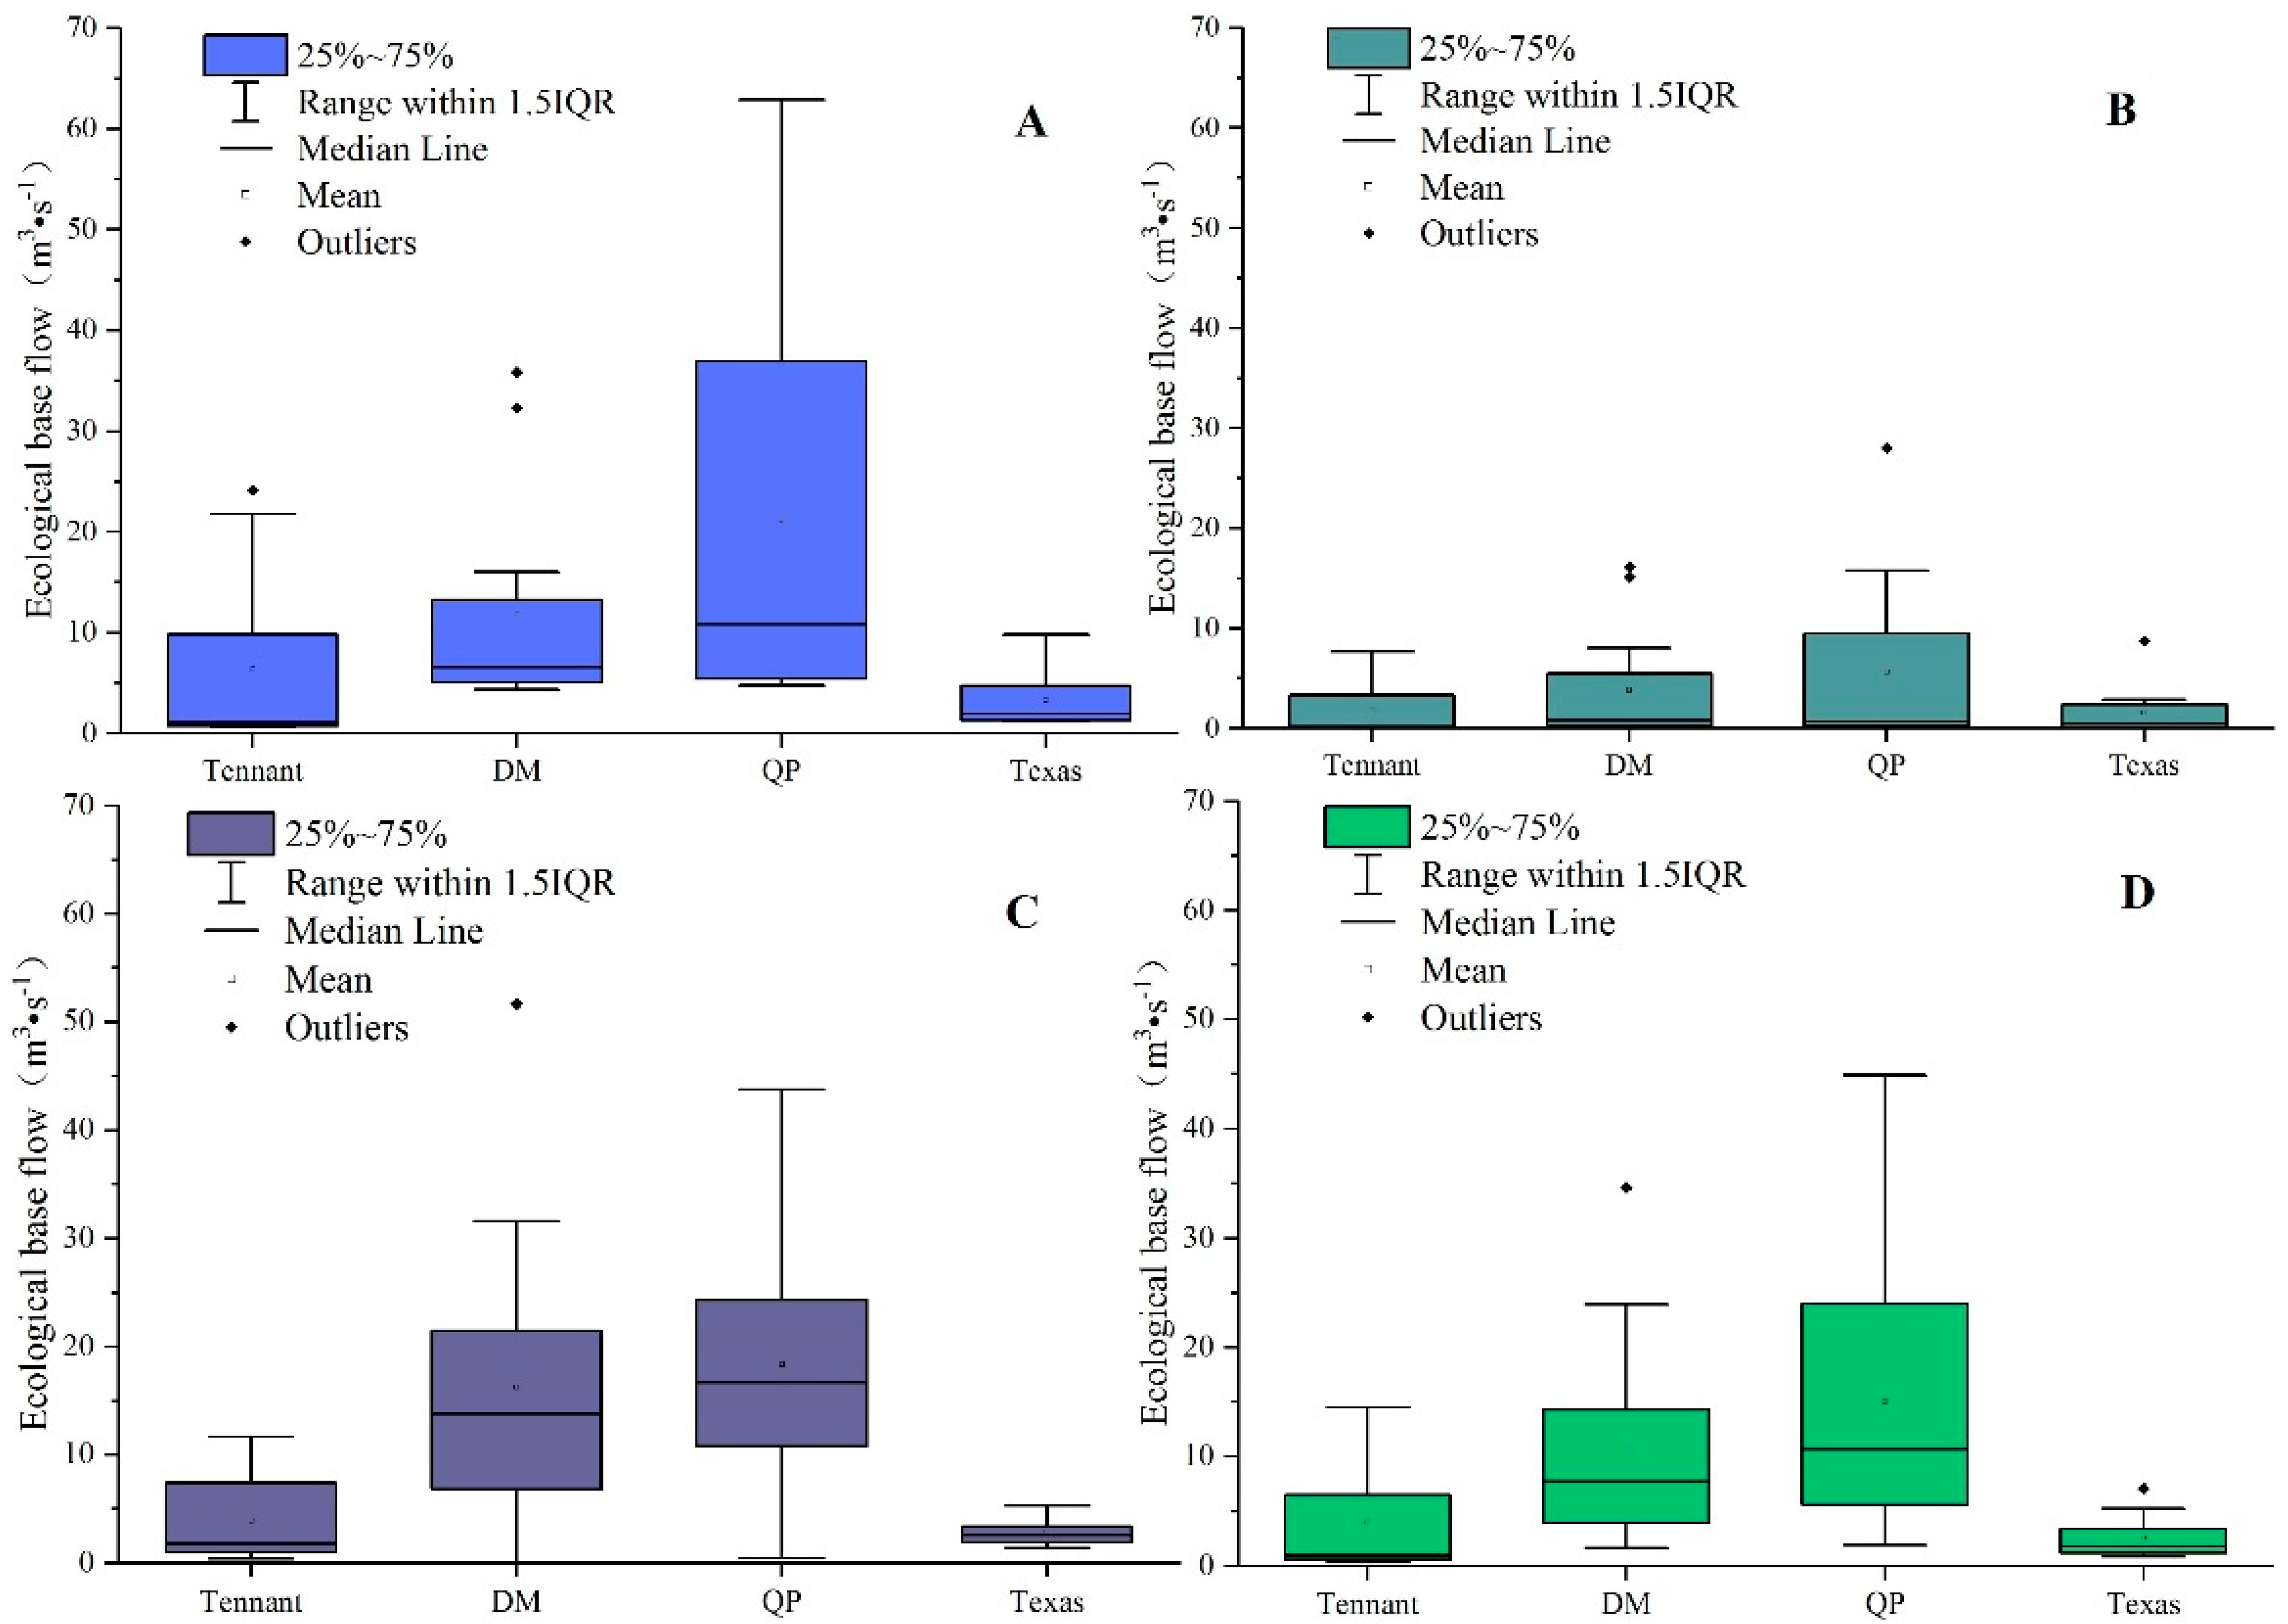
3.2.1. Determination of Ecological Base Flow
Using four hydrological methods including the Tennant method, QP method, DM method, and Texas method, the average annual ecological base flow characteristics of the Kriya River, Niya River, Qarqan River, and the watershed were calculated (
Figure 4). The results show that the four methods can better reflect the seasonal variation characteristics of the rivers on the northern slope of the Kunlun Mountains, and the three rivers show the highest average ecological base flow calculated by the QP method, followed by the DM method. The comparison of 4 calculation methods in
Table S2. Compared with the Tennant method, the results calculated by the Texas method are concentrated within 5 m
3⋅s
−1. Comparing the three calculation methods, the results of QP method and DM method are relatively high, with significant differences in annual changes. The results calculated by the Texas method are small and have no significant changes within the year.
Based on the actual hydrological situation of the rivers on the northern slope of the Kunlun Mountains, referring to studies on ecological base flows in other basins in the arid region [
37,
38], and taking into account the characteristics of climate change, ecosystem protection, and economic and social development needs within the basin, a comparison of the four calculation methods was made. It was found that the Tennant method was more suitable for studying the ecological hydrological situation in the region, and its calculation results were more in line with the actual needs of small inflow of water from inland rivers and fragile ecosystem in the basin in the arid region, At the same time, it meets the relevant requirements for reaching the ecological base flow target in the Supplementary Technical Details for the National Water Resources Survey and Evaluation Ecological Water Volume Survey and Evaluation (Trial Implementation) (April 2018) [
39]. In summary, the results calculated by the Tennant method were selected as the recommended values for the ecological base flow in this paper, and further analysis and research were conducted based on them.
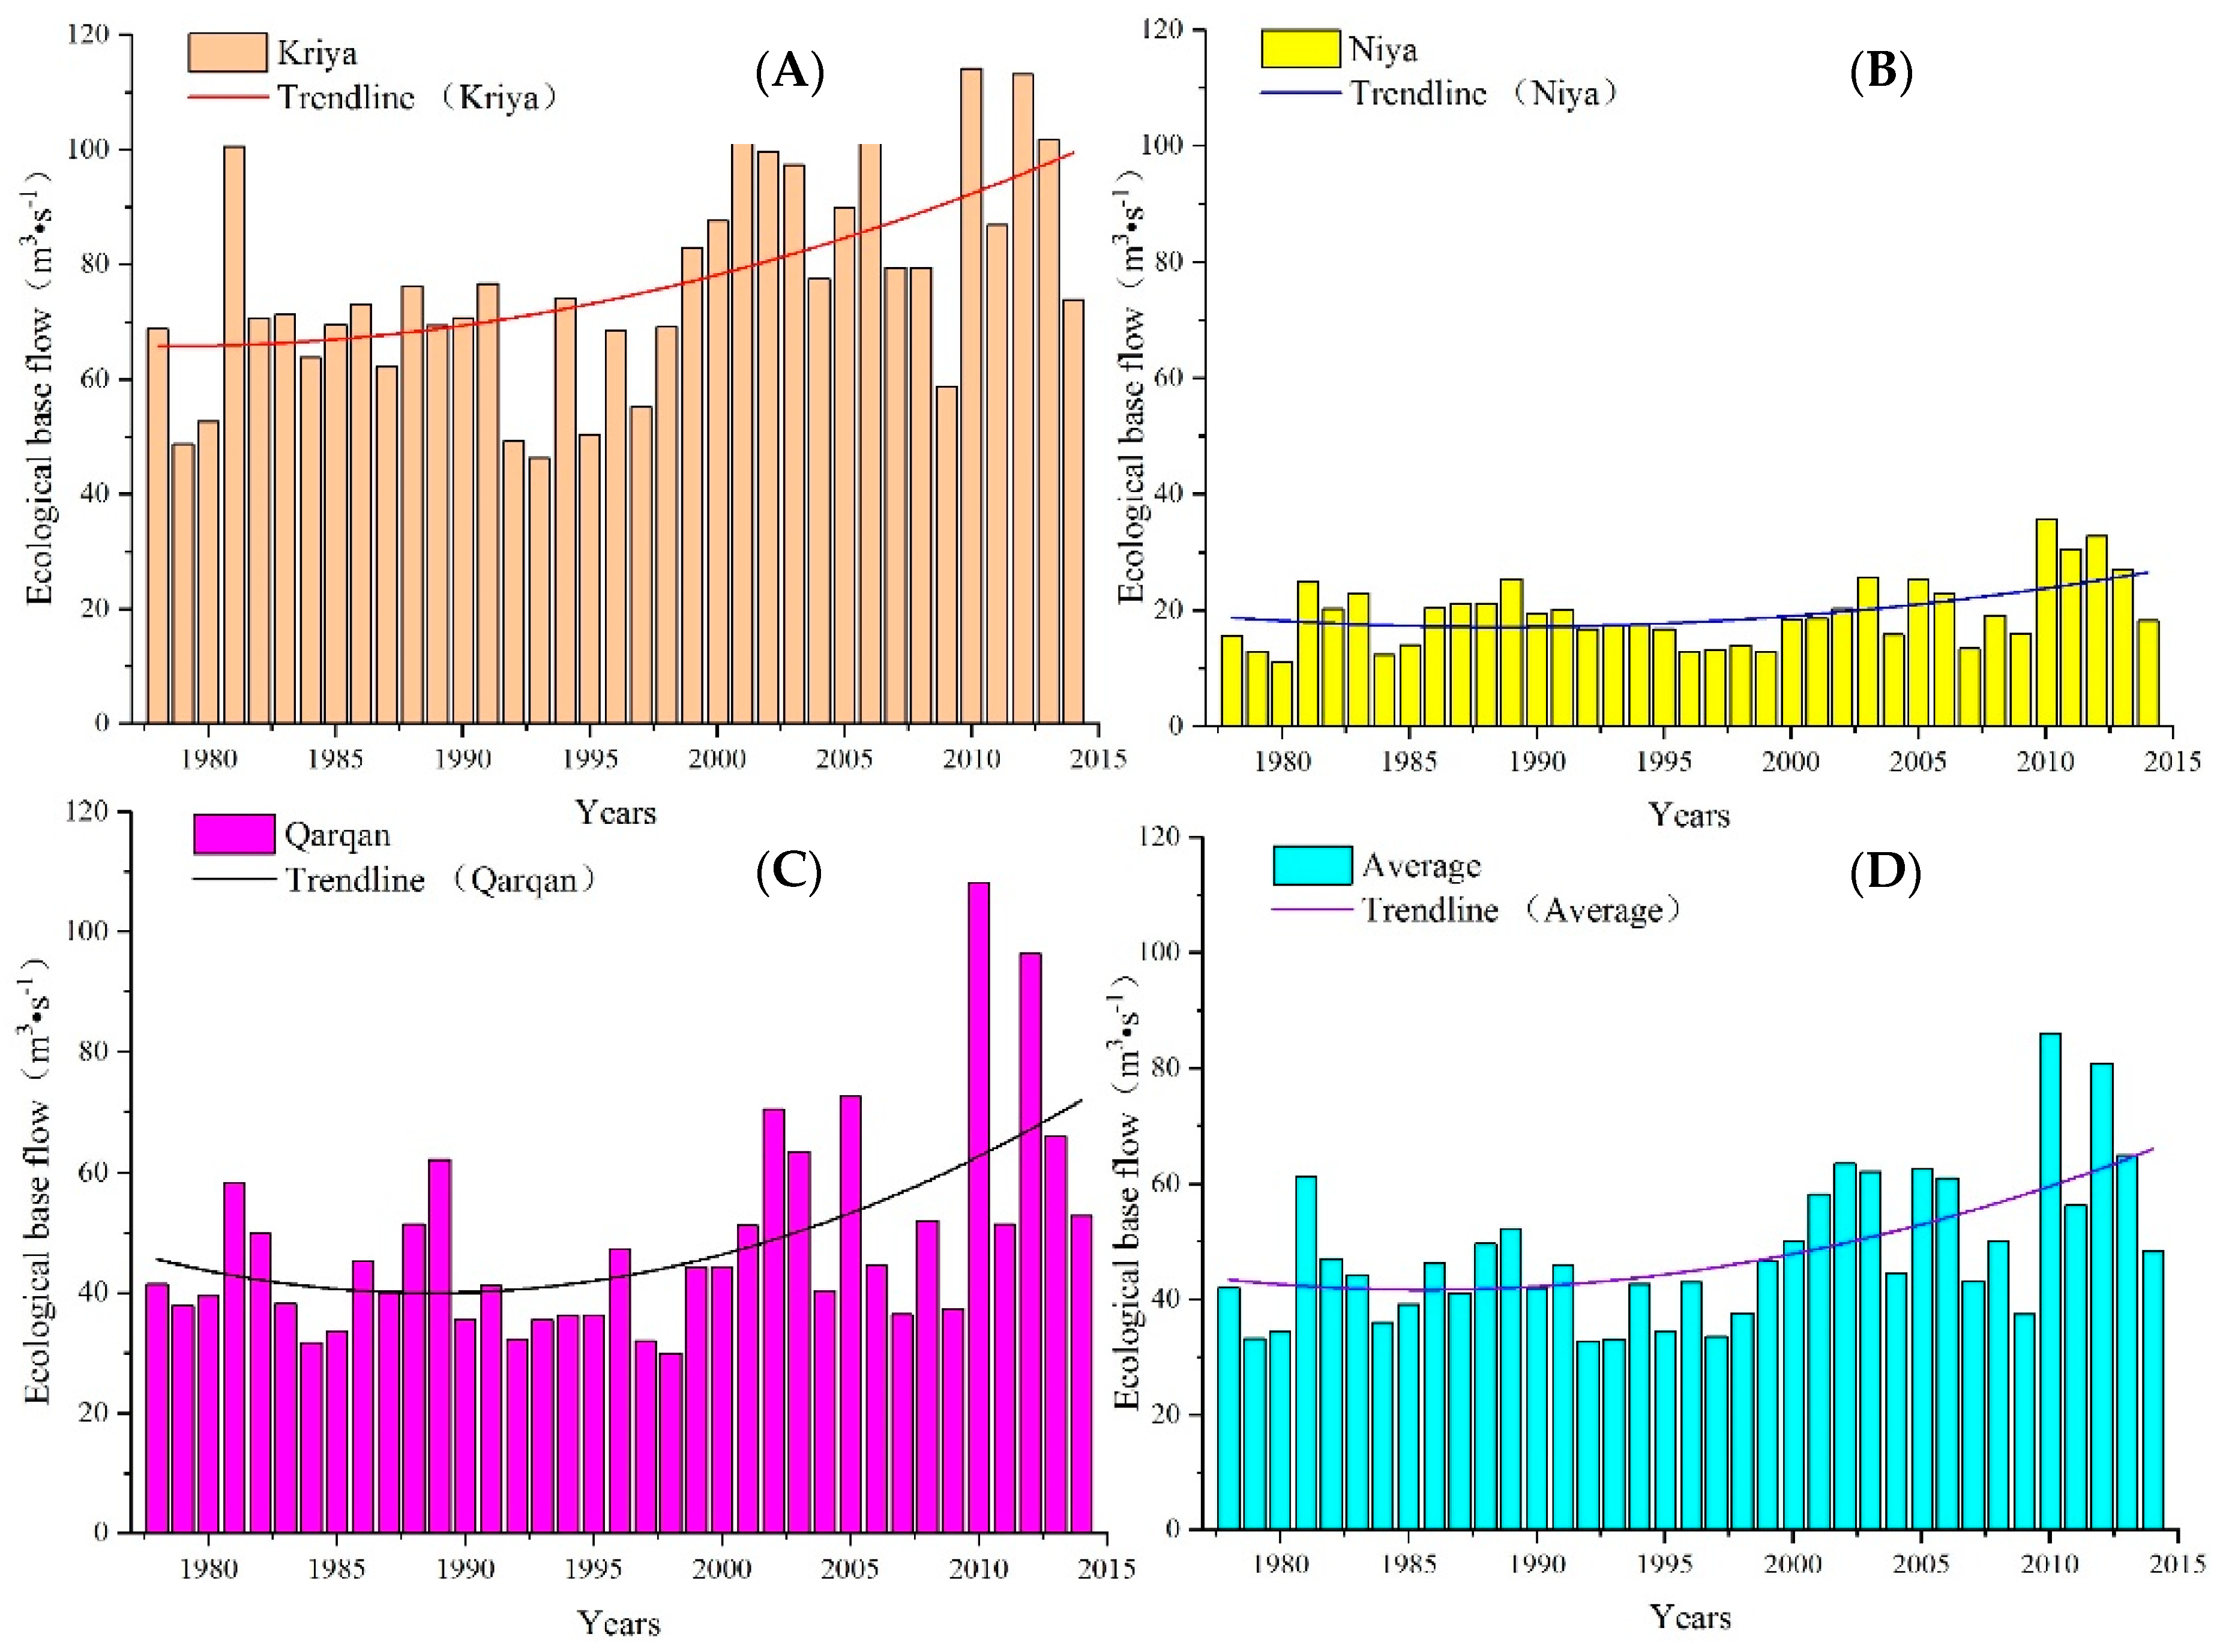
3.2.2. Interannual Characteristics of Ecological Base Flow
Based on the ecological base flow results determined by the Tennant method, we analyzed the trend of ecological base flow changes in the three rivers from year to year. Due to the differences in data, in order to ensure the consistency of the study period, the ecological base flow values of the same time period from 1978 to 2014 were selected for mapping, and the results are shown in
Figure 5. In the past 40 years, the ecological base flow of the three typical rivers on the northern slope of the Kunlun Mountains has shown a slow upward trend consistent with temperature and precipitation, increasing at the rates of 1.378 m
3·s
−1•(10a)
−1, 0.653 m
3·s
−1•(10a)
−1, and 3.066 m
3·s
−1•(10a)
−1, respectively. Among them, the annual ecological base flow value of the Kriya River has increased by 5.098 m
3·s
−1, the Niya River has increased by 2.416 m
3·s
−1, and the Qarqan River has increased by 11.343 m
3·s
−1, The area has increased by an average of 6.286 m
3. This is related to the increase in temperature and precipitation in Xinjiang against the background of global warming [
40], which increases the inflow of rivers and causes response changes in ecological base flow. According to the trend analysis results of ecological base flow in the three rivers and the average basin in
Figure 5, we found that the interannual changes in eco-logical base flow of the three rivers are similar to the interannual changes in temperature and precipitation, and there is a phenomenon of fluctuations and changes, and the amplitude and time are basically consistent. The seasonal spatial variation of ecological base flow in 3 rivers in
Figure S1. The maximum value of specific ecological base flow appeared around 2010, while the minimum value was not fixed, which was consistent with the change of temperature and precipitation, but relatively backward in time. Therefore, combined the aforementioned linear trend analysis results of temperature and precipitation, it can be concluded that the interannual ecological base flow presents a slowly increasing change under the impact of climate change, and there is a specific response relationship between the two.
3.2.3. Annual Characteristics of Ecological Base Flow
We further analyzed the characteristics of ecological base flow within the year, and explored whether its change rule is consistent with the characteristics of climate change within the year. Based on the calculation results of the Tennant method, we list the monthly ecological base flow size and proportion of three typical rivers on the northern slope of the Kunlun Mountains within the year (
Table 2). Among the three rivers, the Kriya River maintains the largest monthly ecological base flow, followed by the Qarqan River and the Niya River, which is related to the river runoff and precipitation. The maximum ecological base flow occurred in July, respectively 24.168 m
3·s
−1, 7.692 m
3·s
−1, and 11.667 m
3·s
−1; The minimum values occurred in January, with 0.668 m
3·s
−1, 0.016 m
3·s
−1, and 0.416 m
3·s
−1, respectively. This distribution is consistent with the annual temperature change. In addition, the proportion of ecological base flow in the three rivers during the flood season is 93.89%, 98.67%, and 86.64%, respectively, indicating that the ecological base flow is mainly concentrated in the months with higher temperatures and more precipitation, which conforms to the characteristics of seasonal changes in the runoff of inland rivers in arid regions. Therefore, it can be concluded that the characteristics of ecological base flow changes in these three typical rivers on the northern slope of the Kunlun Mountains during the year are basically consistent with the characteristics of climate change.
3.3. Climate Change and Ecological Base Flow
Based on determining the impact of climate change on ecological base flow, the response relationship between typical rivers and ecological base flow on the northern slope of the Kunlun Mountains and temperature and precipitation against the background of climate change is further analyzed. All three rivers ar inland rivers, and the main source of river supply is snow melt water and precipitation. Temperature affects the melting of this snow, while precipitation is directly related to the water inflow of the river. Therefore, the correlation between temperature, precipitation, and ecological base flow is analyzed separately.
3.3.1. Temperature and Ecological Base Flow
Temperature changes affect the melting of ice and snow, resulting in changes in river runoff and affecting changes in ecological base flow protection. Based on the above analysis of climate change characteristics, the characteristics of temperature and precipitation changes in the basin where the typical rivers on the northern slope of the Kunlun Mountains are located have been clarified. On this basis, the correlation between river ecological base flow and temperature has been analyzed in two dimensions, inter-annual and intra-annual, respectively. The results are shown in
Table 3.
According to the analysis in the table, the correlation between ecological base flow and annual average temperature in the three rivers is poor, and the correlation coefficient is below 0.1 except for the Kriya River. The correlation with the annual monthly average temperature is good, that is, the ecological base flow of the three rivers shows the same increase and change trend in the month when the temperature increases, and the two show a significant positive correlation (correlation coefficient r is greater than >0.7). Moreover, according to the results of the correlation coefficients in
Table 3, the correlation between the monthly average temperature and the monthly ecological base flow in the Chechen River Basin is the strongest, with correlation coefficient
r = 0.876,
p = 0.
3.3.2. Precipitation and Ecological Base Flow
Precipitation is also an important source of runoff supply for inland rivers in arid regions. Similarly, based on the results of the aforementioned analysis of precipitation characteristics, the correlation between precipitation and river ecological base flow in the basins of three typical rivers on the northern slope of the Kunlun Mountains is further explored from an interannual and intra-annual perspective. The results are shown in
Table 4.
According to the analysis in the table, the correlation between annual precipitation and annual ecological base flow is relatively higher than the annual average temperature, but the correlation coefficients are still below 0.6. The correlation between monthly precipitation and monthly ecological base flow is good, that is, the monthly ecological base flow variation trend of the three rivers is very similar to the monthly precipitation, and the correlation between monthly precipitation and monthly ecological base flow in the Chechen River Basin is the strongest, with a correlation coefficient of r = 0.917, p = 0. Therefore, it can be concluded that due to the impact of climate change, the correlation between the monthly average temperature, monthly precipitation, and monthly ecological base flow of the three rivers within the year is relatively high, while the interannual variation shows significant fluctuations between different years, and the correlation is not strong. However, the overall trend shows a slow increase with the increase of temperature and precipitation.
4. Discussion
We found that the climate of the north slope of Kunlun Mountains is in a slow changing process of warming and humidification; this is consistent with the research conclusion of Chen et al. [
41]. Against the background of climate change, the ecological base flow shows the characteristics of a longer flood season, a shorter non-flood season, uneven spatial distribution and overall increase, which is similar to the research conclusion of Wang et al. [
42]. The ecological base flow and interannual temperature and precipitation changes have little impact, but have a strong correlation with each month within the year. On this basis, we further discuss the influencing factors, guarantee objectives, and management measures of the ecological base flow on the northern slope of the Kunlun Mountains.
4.1. Factors Affecting Ecological Base Flow
In addition to the significant impact of temperature and precipitation on ecological base flow changes, human activities also have an important impact on ecological base flow changes and guarantee in rivers. The water quality monitoring results of Niya River in
Table S3. Through field research and data analysis [
43], it has been found that the current impact of human activities on the ecological base flow on the northern slope of the Kunlun Mountains mainly occurs in three ways: agricultural irrigation, industrial production, and domestic water usage.
Firstly, the construction of water storage and irrigation projects throughout the river has gradually reduced the ecological water volume of the river, which is particularly prominent in spring when agricultural water consumption is large; secondly, with the development of economy and society, water demand for industrial production has increased, leading to the occupancy and serious pollution of water in the river, resulting in a sharp decrease in ecological water use. In addition, the rivers on the northern slope of the Kunlun Mountains are the main sources of domestic water in their basins. With population increases, the annual increase in domestic water consumption gradually, which is particularly significant during the dry season when the ecological base flow of river channels decreases.
4.2. Ecological Base Flow Guarantee
4.2.1. Ecological Base Flow Guarantee Objectives
Based on the above climate change and ecological base flow characteristics and their correlation analysis, taking into account the impact of human activities, combined with the annual guarantee rate of ecological reference flow of the three rivers in
Figure S2, considering the actual characteristics of the rivers in the study area simultaneously, and in combination with the standards listed in the Tennant method, the ecological base flow protection objectives for the three rivers on the northern slope of the Kunlun Mountains, the Kriya River, the Niya River, and the Qarqan River, are proposed, as shown in
Table 5. The changes in Guarantee objectives for three rivers within the year in
Figure S3. Because, during the flood season, the ecosystem in the basin requires more water than dry season, the key protection objectives and tasks of ecological base flow are concentrated in the flood season.
Among them, the Kriya River is located in the central and western parts of the northern slope of the Kunlun Mountains, and ensuring its ecological base flow is the key to ensuring ecological water use in the basin. The Niya River is adjacent to the Kriya River, but its length and runoff are relatively small. Ensuring its ecological base flow is the key to ensuring the continuation of the river, and is also an inevitable requirement for the economic and social development of the basin. The Qarqan River is located in the east of the northern slope of the Kunlun Mountains, with large runoff, long flow direction, and large span, so the river situation is complex. Ensuring its ecological base flow can ensure the health and stability of the river ecosystem, as well as provide scientific support for the protection and restoration of the ecological environment at the edge of the Taklimakan Desert.
4.2.2. Ecological Base Flow Guarantee Measures
Based on the analysis of the ecological base flow characteristics and impact of human activities of the Kriya River, Niya River, and Qarqan River against the abovementioned climate change background, and taking into account the geographical environment, ecological protection, and economic and social development realities of the northern slope of the Kunlun Mountains, the following measures are proposed to ensure the ecological base flow of rivers. Firstly, strengthen the unified management of regional water resources. Coordinating the unified management and scientific scheduling of water resources in the northern slope of the Kunlun Mountains, comprehensively consider the characteristics of different rivers, while taking into account the common points of river ecological restoration and environmental protection. Secondly, strictly supervise and guarantee base flow. Adhere to and improve the “River Leader” system, and strictly urge river leaders and relevant departments at all levels to complete the task of river ecological protection against the background of water shortage and climate change sensitivity in arid areas. In addition, increase technical research. Conduct comprehensive research on the hydrological, chemical, and biological processes of rivers from the perspective of river ecosystems, and strengthen the use of ecological monitoring technologies suitable for inland rivers. Lastly, improve laws and regulations. Improve the legal system for water ecology in line with the region, strengthen the implementation of ecological red line management for water resources, establish a systematic and complete system of water ecological civilization, and protect water resources and water ecological environment from the source.
5. Conclusions
In this study, we used the temperature, precipitation, and runoff data of three typical rivers on the northern slope of the Kunlun Mountains to analyze the characteristics of climate change, clarified the ecological base flow of each river and its spatiotemporal characteristics under the background of climate change, and discussed the impact factors, and then proposed corresponding protection objectives and measures for the ecological base flow of rivers. The main conclusions are as follows:
The climate of the three typical rivers on the northern slope of the Kunlun Mountains is in a slowly fluctuating warming and humidifying state. From 1958 to 2019, the average annual temperature of the Kriya River, the Niya River, and the Qarqan River basins increased at the rates of 0.235 °C•(10a)−1, 0.223 °C•(10a)−1, and 0.177 °C•(10a)−1, respectively, while the annual precipitation increased at the rates of 0.88 mm•(10a)−1, 3.90 mm•(10a)−1, and 7.92 mm•(10a)−1. The maximum monthly temperature of the year occurs in July, which is 24.84, 25.36, and 25.44 °C, respectively; the minimum values all occurred in January, at −5.13, −5.81, and −7.82 °C, respectively. The maximum precipitation occurs in June or July within the year, with 11.92, 10.35, and 7.29 mm, respectively; the minimum values occur in October or November, with 0.42, 0.19, and 0.22 mm, respectively.
The ecological base flow of the three typical rivers on the northern slope of the Kunlun Mountains shows the same fluctuations and increases as climate change. The Tennant method was determined to be the best algorithm for ecological base flow of inland rivers study area. The maximum ecological base flow of the Kriya, Niya, and Qarqan rivers in the year was in July, and their minimum ecological base flows were all in January. The ecological base flow during the flood season of the year is 71.791 m3·s−1, 20.779 m3·s−1, and 41.013 m3·s−1 respectively, accounting for 93.89%, 98.67%, and 86.64% of the annual ecological base flow. The maximum values of the interannual ecological base flow all appeared in 2010, while the minimum values were not fixed, increasing at a rate of 1.378 m3·s−1•(10a)−1, 0.653 m3·s−1•(10a)−1, and 3.066 m3·s−1•(10a)−1, respectively.
The ecological base flow of three typical rivers on the northern slope of the Kunlun Mountains has a strong correlation with monthly temperature and precipitation within the year. The correlation between annual ecological base flow and interannual temperature and precipitation in rivers is weak. Among them, the correlation between monthly temperature, monthly precipitation, and monthly ecological base flow in the Qarqan River Basin is the strongest, with correlation coefficients of 0.876 and 0.917, respectively. We propose the ecological base flow guarantee objectives for the three rivers, and clarify that the flood season is the key point of ecological base flow guarantee. The guarantee objectives are 0.974 m3•s−1, 0.154 m3•s−1, and 2.167 m3•s−1, respectively, for the three rivers.


