1. Introduction
The maximum concentration of electrons in the ionospheric
F2-layer (
NmF2) experiences numerous variations and perturbations [
1,
2,
3]. Regardless the fact that in ionospheric physics the solar activity is considered as the main source of the ionosphere variability, in recent years the strong effects on the ionosphere from below such as volcanic eruptions and dust storms were established [
4,
5]. Among the coupling processes from below, the strong earthquakes are also considered as perturbation sources [
6]. The impact of earthquakes on the
F-region of the ionosphere has been documented and reflected in many publications [
7,
8,
9,
10,
11,
12,
13,
14,
15]. At the same time, the monograph [
6] gives a large number of references to numerous observations (conducted before 2004)
of the ionospheric perturbations preceding earthquakes (IPPE), and later examples of the IPPE [
16], which could also be
ionospheric precursors of earthquakes (IPE) associated with the processes of preparation of earthquakes in the Earth’s crust. Since then, hundreds of articles have been devoted to this topic, which have been published up to the present time [
17,
18,
19,
20,
21,
22,
23,
24,
25,
26,
27,
28,
29,
30,
31,
32,
33,
34,
35]. However, all possible physical mechanisms that could be responsible for the perturbations in the ionosphere before earthquakes are still far from being understood. The scientific literature discusses several physical mechanisms that lead to changes in the ionosphere before earthquakes (see relevant links in the work [
36]). One of the possible options is the anomalous quasi-static electric field, which is observed before an earthquake as a perturbation of the vertical component of the electric field of the atmosphere near the ground surface (
Ez) in earthquake preparation zones. The magnitude of the pre-earthquake perturbation of the vertical component of the quasi-static field at the ground surface Δ
Ez has the order of hundreds of V/m [
37,
38,
39,
40,
41,
42]. The characteristic spatial scale of the perturbation region Δ
Ez (centered at the epicenter of the earthquake) can exceed hundreds [
39] and thousands [
42] of km. There are known examples of registration of strong electric fields in natural conditions even without earthquakes but with presence of air ionization [
43]. It was demonstrated that this effect is provided by the formation of the large-scale volumetric electric charge due to the charge separation in the area of near ground electrode effect as a result of air ionization by radon [
44]. Two very important details concerning the surface layer ionization by radon are described in [
45]: (a) at night-time, due to a sharp temperature inversion near the Earth’s surface, a thin layer is formed, where the concentration of radon is sufficient for a negative space charge to appear at an altitude of 0.5–1 m due to inversion; (b) as the turbulent diffusion or electric field increases, the space charge becomes positive. Both of them are exactly what we regularly observe in our studies of the ionospheric precursors [
16]. The nocturnal ionospheric positive anomalies observed a few days before earthquakes is explained by the radon concentration increase during the night-time temperature inversion [
46] anomaly; both positive and negative anomalies were regularly observed from the very beginning of the seismo-ionospheric studies [
6], so this fact is very important to establish the background mechanism of seismo-ionospheric anomaly generation. The difficulties associated with this mechanism include the need for a fairly long existence of an uncompensated charge in the near-surface layer of the Earth.
The second possible underlying mechanism for generating a quasi-static electric field before earthquakes was proposed in [
47]. It has been suggested that due to activation of positive holes in igneous rocks by pre-earthquake stress the electric current brings these holes to the ground surface and creates the large-scale positive charge on the surface which creates the quasi-static electric field in the direction opposite to the natural vertical atmospheric fair-weather electric field. This possible mechanism has several disadvantages: not all seismically active regions have the igneous rocks; it does not have local time-dependence characteristics for the ionospheric precursors, and it creates only the positive electric field on the ground surface which does not permit one to explain the ionospheric anomalies of opposite polarity.
A seismogenic electric field that has penetrated into the ionosphere can affect ionospheric plasma [
6,
21,
22,
25,
30,
36,
48,
49,
50]. In addition to electron concentration anomalies, perturbations were detected in the amplitudes of ultra-low-frequency (ULF), extremely-low-frequency (ELF) and very-low-frequency (VLF) electromagnetic fields in the ionosphere at altitudes from 500 to 1000 km in different satellite missions, Intercosmos-19 [
51], Cosmos 1809 [
52] and DEMETER (Detection of Electro-Magnetic Emissions Transmitted from Earthquake Regions) [
53,
54], before a series of earthquakes over their epicentral zones. The most intriguing fact is that sometimes the electromagnetic perturbations were registered not only over the seismically active regions but also over the magnetically conjugated regions [
52]. The first interpretation of the conjugated effect was proposed in [
55]. ELF emission at a frequency of 15 Hz was registered via DEMETER satellite [
54] with amplitudes of 1.5–16 mV/m, preferably less than 10 mV/m. Recent measurements on the CSES (China-Seismo-Electromagnetic Satellite) also revealed the conjugated effect registering abnormally high magnitudes of ULF wave amplitudes above the epicenter of a future earthquake with magnitude
M = 8.2 (29 July 2021 in the south of the Alaska Peninsula) and over the magnetically conjugated region as follows from the work [
56].
As was demonstrated in [
55], the IPPE and electromagnetic emissions in conjugated regions are parts of the seismo-ionospheric coupling chain of the processes initiated by the seismogenic electric field on the ground surface. The magnitude of the quasi-static electric field of seismogenic origin, which penetrates into the ionosphere within the earthquake preparation zone, sets the magnitude of the electrodynamic drift in the ionosphere and thereby determines the characteristic size and lifetime of plasma inhomogeneities in the ionosphere/magnetosphere associated with an impending earthquake. The purpose of this work is to estimate the possible maximum values of the electric field of seismogenic origin in the ionosphere (perpendicular to geomagnetic lines of force), before two powerful earthquakes.
Based on experimental results, the seismogenic anomaly of the quasi-static vertical electric field at the ground surface Δ
Ez may exist for hours [
39,
40,
41,
42], so that the penetration of such a field into the ionosphere can cause a redistribution of ionospheric plasma over the earthquake preparation area
, if its magnitude is significant enough. The characteristic spatial scale of the earthquake preparation zone on the ground surface is defined by the radial distance from the epicenter and depends on its magnitude
M. In the scientific literature, there are various (empirical and theoretical) estimates of this scale (in km) given in the publications [
39,
57,
58] (hereinafter, we will use
the minimum estimate of this scale obtained in [
57]), calculated using the elastic deformation on the ground surface produced by ellipsoid inclusion in the crust and its comparison with spatial distribution of the short-term precursors; the maximum distances from the epicenter correspond to the Earth’s crust deformation of order 10
−8. This value can be expressed by the formula
RD = 10
0.43M. It is worth mentioning that the spatial distribution of the pre-earthquake radon activity according to the extended review of [
59] follows the law [
57].
In this study, we develop the model of the quasi-static electric field penetration into the ionosphere to obtain the effect in the ionosphere which conforms with the experimental measurements for two strong and mega earthquakes in the Alaska area which is also supported by the CSES measurements of electron concentration and electromagnetic emission, topside sounding results from the Alouette satellite and ground-based measurements of the vertical ionospheric sounding and GPS TEC ground-based receivers.
The study of seismo-ionospheric relationships is important both from the point of view of fundamental physics and having in mind the applied aspect of strong earthquake prediction.
2. Experimental Setup
Satellite studies of earthquake-related effects are usually accompanied by limitations of different origins: the proper orbit configuration in relation to the earthquake time and position, availability of ground-based supporting measurements, and availability of earthquakes themselves. For example, there were only six earthquakes in Alaska from 1900 with magnitude higher than 8, and the time of not all of them coincided with the existence of the proper satellite in orbit. Fortunately, for the present work we were able to pick up two Alaska earthquakes with satellite and ground-based data. The first of them with a magnitude of M = 8.2 (hereinafter referred to as EQ-1), occurred on 29 July 2021 in the south of the Alaska Peninsula near the city of Perryville. The second (hereafter EQ-2), which was the third strongest earthquake in human history with a magnitude M = 9.2, also happened in Alaska, but much earlier, on 28 March 1964 near the city of Anchorage (the so-called Good Friday earthquake). For the first earthquake, the satellite measurements were provided by the Chinese CSES (China-Seismo-Electromagnetic Satellite). CSES has a sun-synchronous orbit (02 AM–02 PM), orbital altitude 500 km, inclination ~97.32° and orbit period 94.6 min.
The Alouette-1 satellite had the high inclination orbit 80.5° which created different LT orbit conditions with the drift in the local time nearly 7 min per day. The orbit altitude of Alouette-1 was nearly 1000 km (996–1032 km), orbit period 105.5 min.
Ground-based support of the ionosphere control for the first earthquake period was exercised with GPS TEC in the form of the IONEX index provided by the International GNSS Service (IGS), while for the second earthquake we used the data of the ground-based ionosonde situated in the city of Anchorage 120 km northwest from the epicenter of the earthquake.
Emissions were registered in the night-time part of the CSES orbit (near 02 AM). An electric field detector (EFD) measures the spatial electric field in the frequency band from DC to 3.5 MHz, providing data in the four detection frequency bands: ULF (DC-16 Hz), ELF (6 Hz–2.2 kHz), VLF (1.8–20 kHz).
3. Estimation of the Electric Field in the Ionosphere before the M8.2 29 July 2021 Earthquake (EQ-1) near Perryville, Alaska, USA
The crustal earthquake with a magnitude of M = 8.2 (the depth of the hypocenter is 35 km) occurred at a distance of ~99 km southeast of the city of Perryville, Alaska, USA (south of the Alaska Peninsula). It happened on the border of the subduction zone between the Pacific and North American tectonic plates on 29 July 2021 at 06:15:49 UT (or 28 July 2021 at 21:15:49 LT). The geographical coordinates of the epicenter were as follows: φe = 55.36° N, λe = 157.89° W (magnetic inclination angle I ≅ 68° and sin I ≅ 0.93). From 25 July 2021 to 31 July 2021 the flux of solar radio emission at a wavelength of 10.7 cm varied within the range 74-82 SFU (1 Solar Flux Unit ≡ 10−22 W⋅m−2⋅Hz−1), and its average monthly value nearly 81 SFU, i.e., solar activity was low.
An estimate of the radius of the earthquake preparation zone [
57] gives
RD = 10
0.43M = 10
0.43×8.2 =
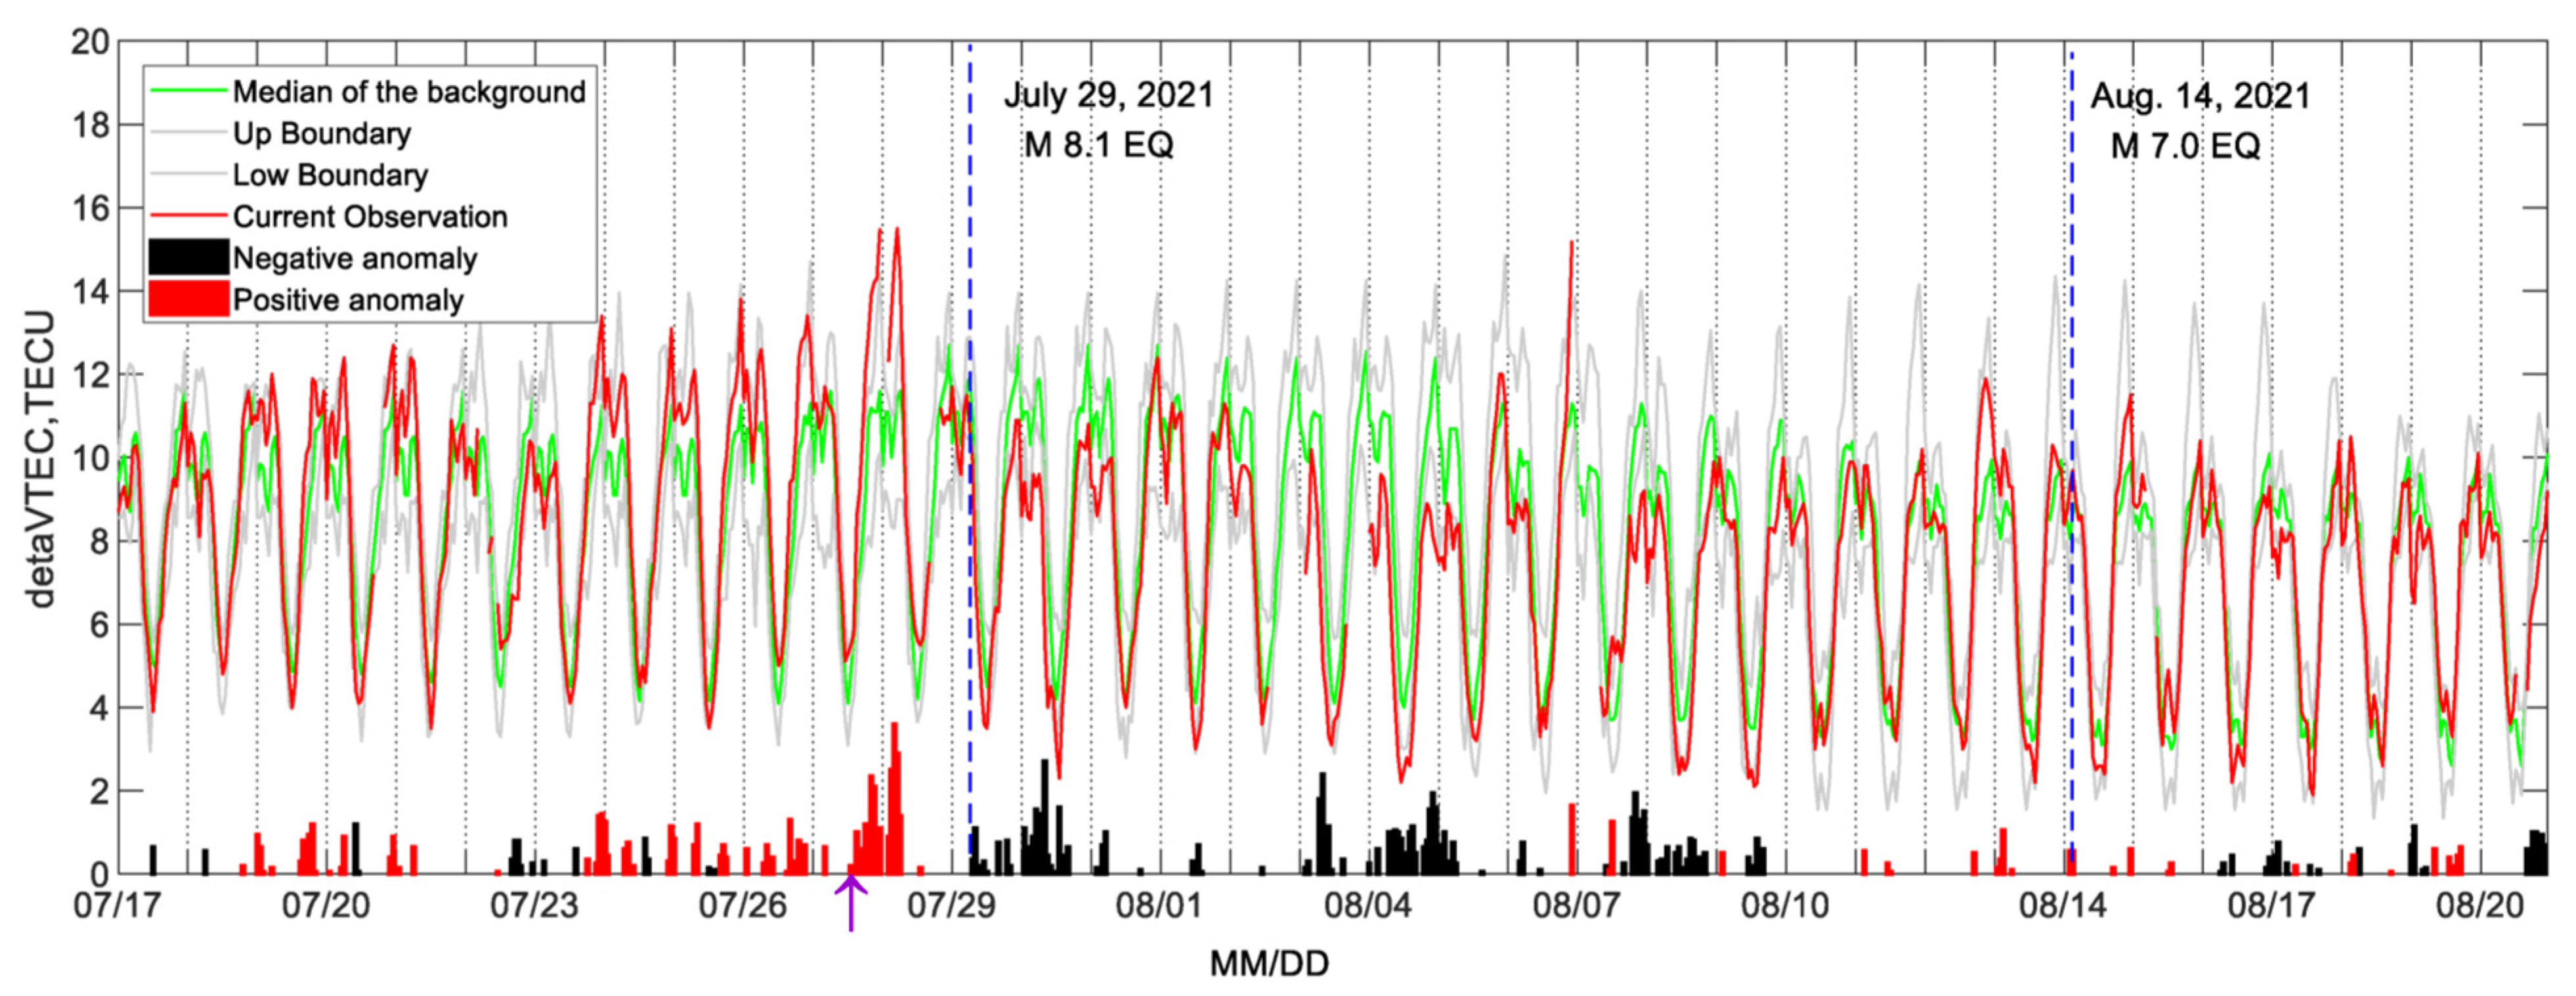
R0 ≅ 3300 km. Measurements of the vertical component of the electric field on the ground surface within the area of preparation of this earthquake were not carried out. However, from the GIM TEC variations over the epicenter of the earthquake (
Figure 1) we can conclude that some perturbation started to develop
within the time interval of 12–13 UT (1–2 h LT) 27.07.2021 (see purple arrow in
Figure 1) in extremely low geomagnetic conditions which lasted almost 5 days. From 00 h UT on 23 July 2021 to 19 h UT 27 July 2021, the geophysical index magnitude was
Kp ≤ 1
+,
DST ≥ −10 nT, −3 nT ≤
IMF Bz ≤ 3 nT according to the Goddard Space Flight Center, NASA, USA (
https://omniweb.gsfc.nasa.gov/form/dx1.html, accessed on 10 February 2023).
In the upper part of
Figure 1, one can see the variations in the GIM TEC over the earthquake epicenter (red line), running median (green line) and upper (UB) and lower (LB) bounds (grey lines). The lower part of the figure (shadowed black and red columns) shows the deviation in the GIM TEC from the running median where the black color is negative deviation and the red color is positive deviation [
56]. The GIM TEC data are provided by the IGS service (
https://cddis.gsfc.nasa.gov/pub/gps/products/ionex accessed on 15 March 2023) in the IONEX format which is a matrix whose elements are TEC values multiplied by 10. Matrix resolution is 2.5° in latitude and 5° in longitude. The TEC values over the epicenter are obtained via the linear interpolation between the closest points of the IONEX table matrix.
As we do not have the direct measurements of the electric field on the ground surface, we can only speculate on its possible magnitude. This speculation is based on the measurements of seismogenic electric field for similar cases of strong earthquakes [
37,
38,
39,
40,
41,
42]. Assuming the existence on the ground surface of the vertical seismogenic electric field anomaly Δ
Ez associated with the arisen TEC anomaly which started 1.75 days before the shock, we can estimate the possible magnitude of a horizontal (perpendicular to geomagnetic lines of force) seismogenic electric field in the ionosphere
Er(ion) using the model proposed below.
3.1. Conductivity Model
As shown in [
29], in order to calculate the penetration of a quasi-static seismogenic field into the ionosphere, it is necessary to set the altitude profile of conductivity from the Earth’s surface to the lower ionosphere (0–90 km) and the value Σ
Pav = (Σ
P + Σ
P*)/2. Here, Σ
P is the Pedersen integral conductivity for the geographical coordinates of the epicenter of the earthquake for the corresponding date and time UT, and Σ
P* is the Pedersen integral conductivity for the magnetically conjugated point (the details of the calculations can be found in [
29]). In the calculations performed below, it is assumed that the integral Pedersen conductivity is determined via the formula
, where z
up = 90 km and z
∞ = 1000 km. According to estimates [
36], σ
p(z) becomes a negligibly small quantity and makes no significant contribution to the integral conductivity Σ
P above the level z = 600 km.
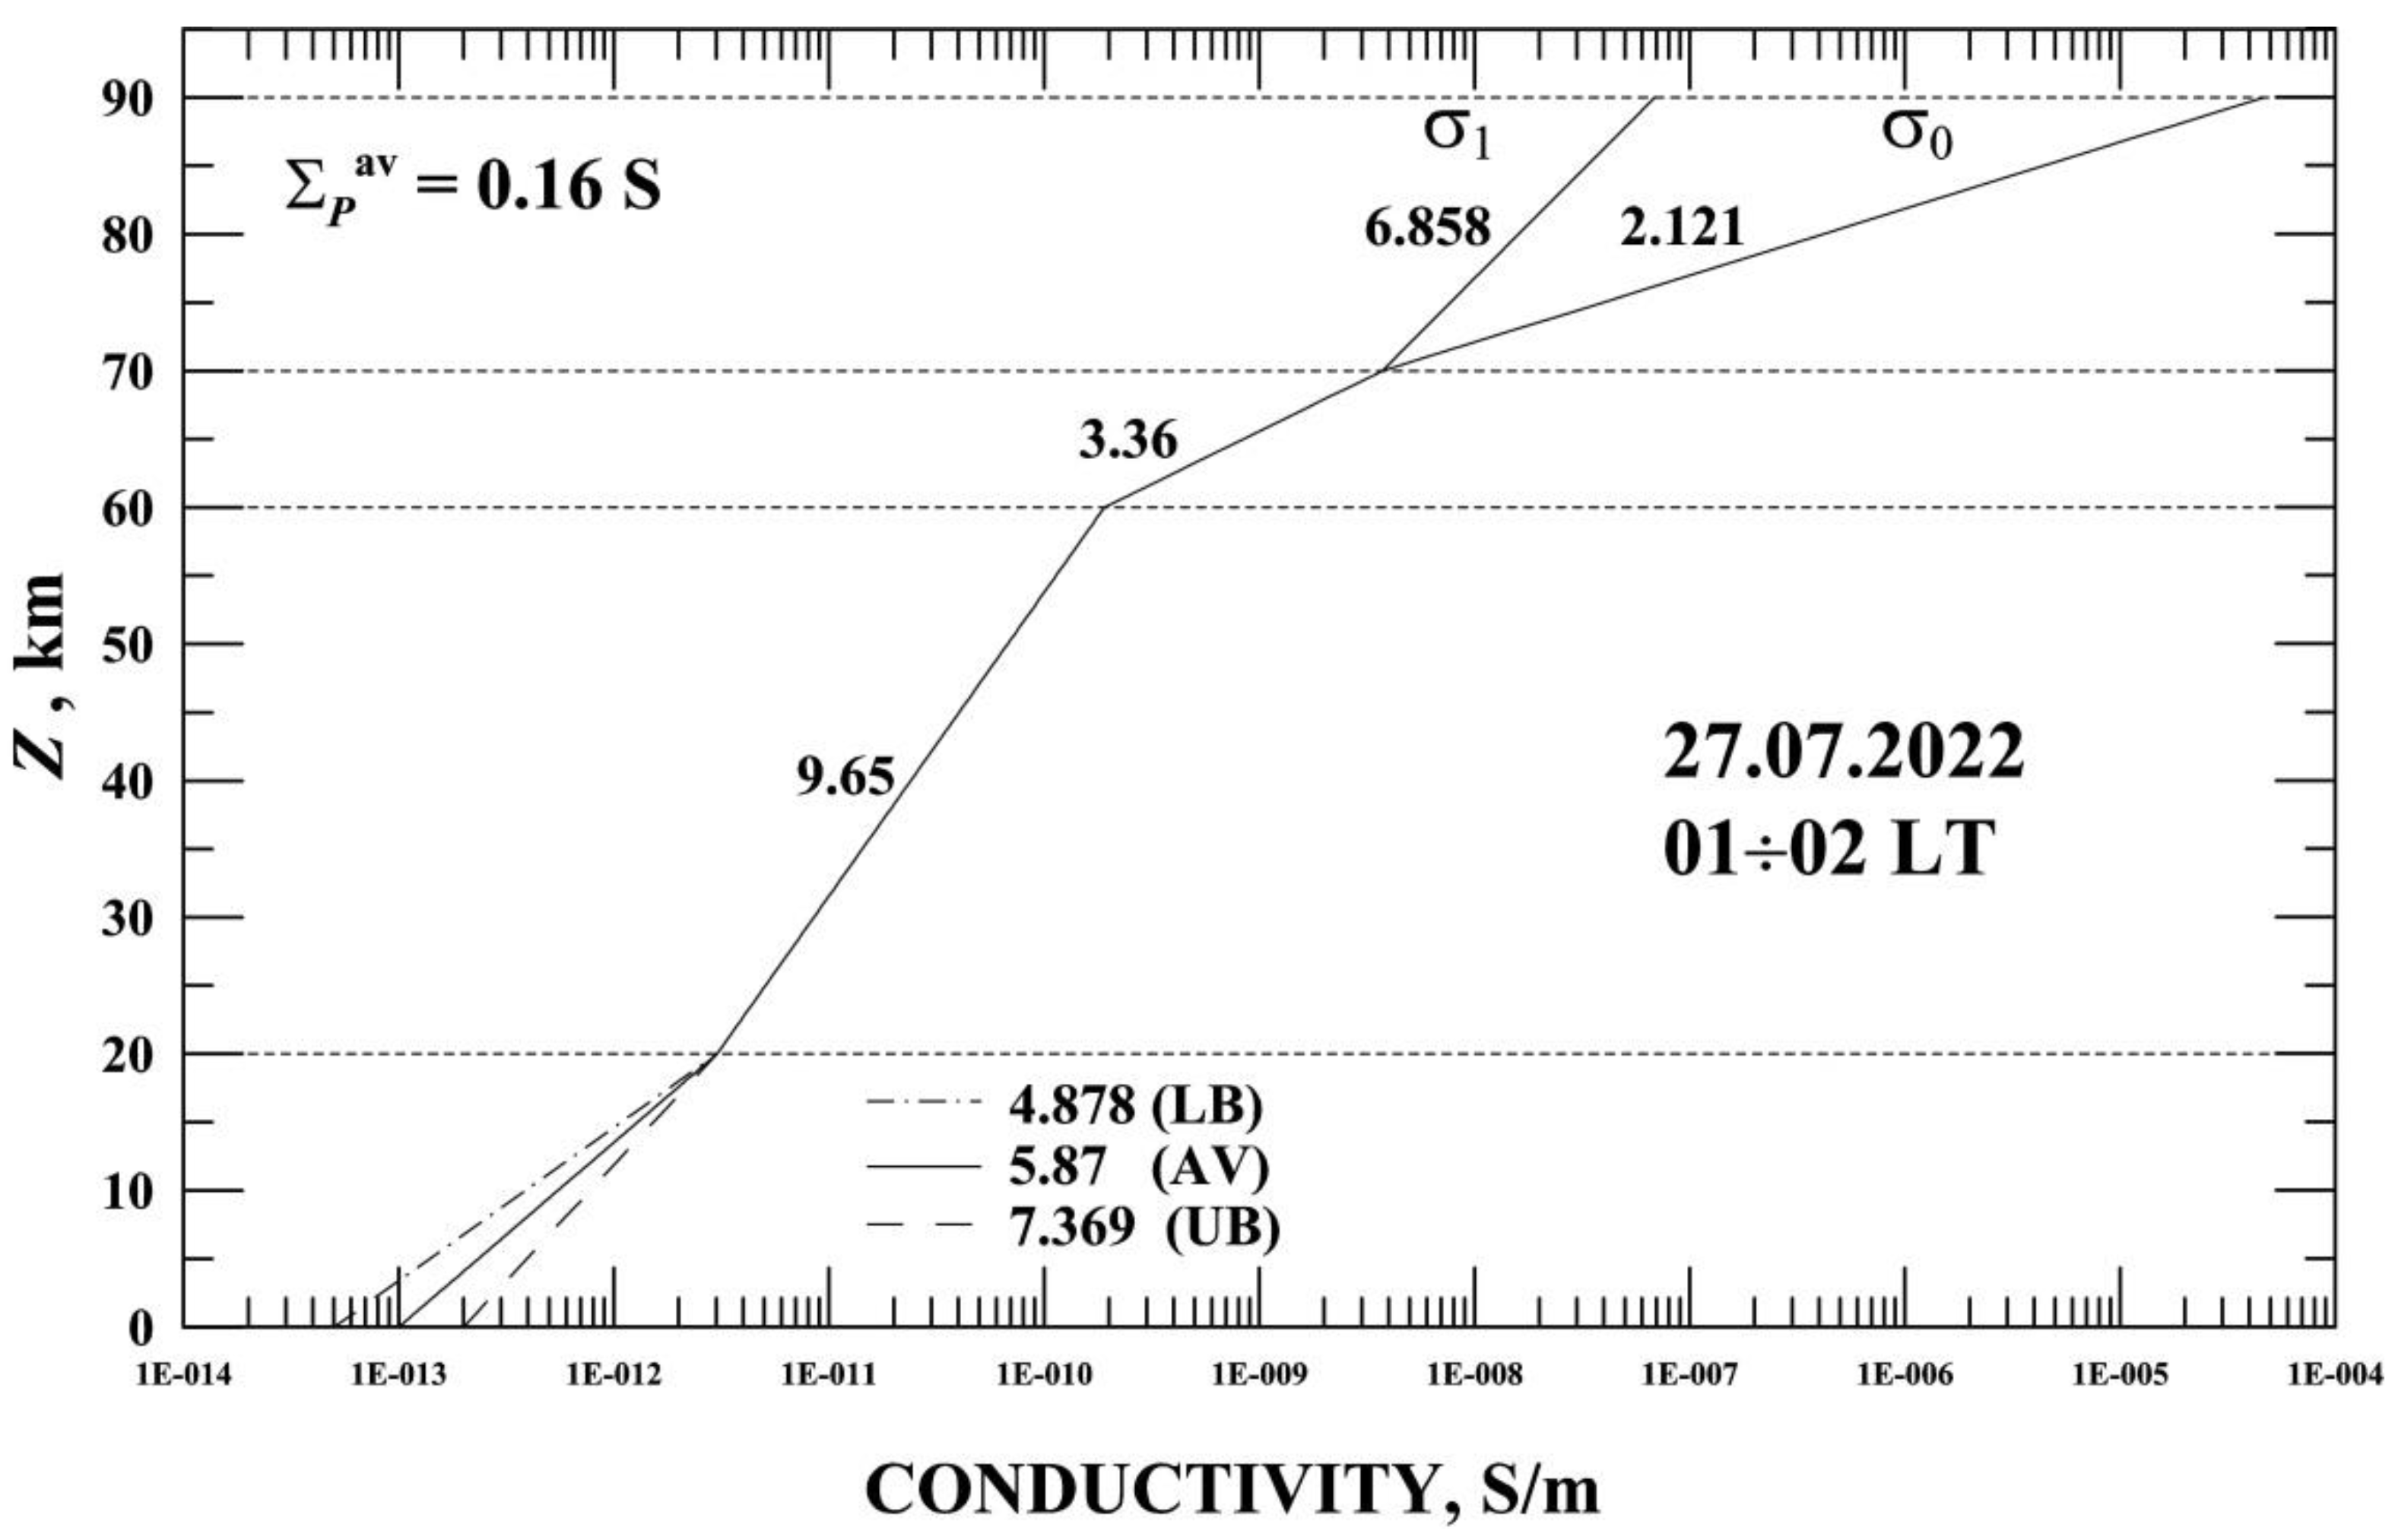
Figure 2 shows this altitude conductivity model, where in the lower part of the profile (first zone, [0,
z1 = 20] km) with dashed and dash-dotted lines the lower (LB) and upper (UB) boundaries of the profile indicate the scatter of conductivity in the fair-weather conditions according to [
60]. In the second [
z1 = 20;
z2 = 60] and the third [
z2 = 60;
z3 = 70] zones, the vertical conductivity profile used further is close to the model provided in [
61]. In the fourth [
z3 = 70;
z4 = 90], anisotropic zone, σ
0(
z) and σ
1(
z) ≡ σ
p(
z) are extrapolated exponentially from their values at
z3 = 70 km to their values at
z4 = 90 km (according to the geographical coordinates of the epicenter of the considered earthquake and the observation moment of the presumed seismogenic anomaly Δ
Ez at the ground surface preceding the ionospheric anomaly).
3.2. Method for Calculating the Seismogenic Electric Field in the Ionosphere Er(ion)
For calculations of the seismogenic electrostatic field (SEP) penetration into the ionosphere, the formalism proposed in [
62] is used in the approximation of vertical direction of the geomagnetic field lines (magnetic inclination
I = 90°) used previously in the study of a thundercloud electrostatic field penetration into the ionosphere, and then developed in studies [
36]. Due to the anisotropy of conductivity associated with the presence of the geomagnetic field, if at the ground surface level there is only a vertical component of the electric field (
Ez) from the axial-symmetric localized source, then (in the cylindrical coordinate system) at the level of the ionosphere only the field component perpendicular to the geomagnetic lines of force (
Er) will be significant.
It follows from [
28] (see, in particular, Formula (34) of that publication) that, when the magnetic field inclination angle is taken into account, the magnitude of the
Er component in the ionosphere will attenuate by the factor sin(
I) as the field source moves on the Earth’s surface from higher latitudes to the equator, i.e.,
Er calculated in the approximation of vertical geomagnetic field lines (
I = 90°) must be multiplied by sin(
I) to obtain its correct value.
Under steady state conditions, the governing equations are
where
J is the electric current density,
σ is the electrical conductivity tensor,
E and Φ are the electrostatic field and potential, respectively. Neglecting the Earth’s curvature, and using cylindrical coordinates (
r,
ϕ,
z) centered at a forthcoming earthquake epicenter and with the
z axis pointing vertically upward, we represent the seismogenic perturbation in the vertical atmospheric field near the Earth’s surface by the spatial distribution, in the form obtained in [
29]:
where
E0 and
R0 are, respectively, the maximum perturbation value of Δ
Ez in the future epicenter of the impending earthquake and the radius of the earthquake preparation zone on the ground surface, and
RE determines the scale of field decrease as it moves away from the epicenter. If one assumes that the geomagnetic field
B is vertical, and the electrical conductivity tensor depends only on
z, the following equation for the electrostatic potential Φ can be obtained from (1), (2) and (3)
where σ
p is the Pedersen conductivity, and σ
0 is the specific conductivity. At altitudes below 70 km, the conductivity is isotropic (σ
0 = σ
p) since the geomagnetic field does not affect drifts of charged particles. Above 70 km, the presence of the geomagnetic field results in the anisotropy of the conductivity (σ
0 ≠ σ
p). Equation (5) can be solved analytically if the conductivities σ
0 and σ
p depend exponentially on altitude.
The electric field components are given by
Since we assume that the geomagnetic field B is vertical, Er is perpendicular to B, while Ez is parallel to B.
Above 90 km, the geomagnetic field-aligned conductivity σ
0 is sufficiently high, it is much larger than the transverse conductivity σ
p, so the geomagnetic field lines of force are nearly equipotential lines for the case of perpendicular electrostatic fields with scale sizes of more than a few tens of kilometers. This makes it possible to consider the ionospheric region from ~90 to ~600 km as a thin conducting layer with a geomagnetic field line-integrated Pedersen conductivity Σ
P (note that the local conductivity σ
p is negligible above 600 km). Thus, the continuity equation of the electric current can be written at
z = 90 km in the following form:
where
∇⊥ denotes the two-dimensional gradient operator
B (in a plane perpendicular to
B); the factor 2 before Σ
Pav accounts for a contribution of the Pedersen conductivity of the magnetically conjugate ionosphere. Equation (10) is explicitly expressed as
Relations (4) and (9) represent the lower and upper boundary conditions, respectively, to evaluate the electrostatic potential Φ.
3.3. Discussion of the Quasi-Static Seismogenic Field near the Earth’s Surface Source Model
As mentioned above, the distribution of the perturbation of the vertical component of the electric field Δ
Ez on the ground surface as a function of the epicentral distance
r is taken in the form (4):
This distribution fits well with long-term measurements of seismogenic anomalies Δ
Ez before earthquakes in their epicentral regions, according to studies presented in [
39]. From study [
29], it follows that the value of
E0 ≅ 1 kV/m at the ground surface, according to the measurements of [
39], is achieved already before earthquakes with
M within the range 4.1–4.7, and before an earthquake with
M = 6.0, the value of
E0 is ≅ 1.3–2.4 kV/m, while the value of the ratio R
E/R
0 lies within the interval [0.6–1.75]. Moreover, the study [
42] described a seismogenic anomaly Δ
Ez on the ground surface, which appeared ~14 h before the earthquake of 12 June 2010 in the area of the Nicobar Islands (India) with a magnitude of
M = 7.5 according to the updated data of the USGS catalog (
https://earthquake.usgs.gov/earthquakes/browse/significant.php?year=2010 accessed on 15 March 2023), which existed for ~41 min. It had an amplitude of Δ
Ez = 1385 V/m at an epicentral distance
Re = 1763 km. An estimate of the value of
E0 for this earthquake (at its epicenter) made in [
29] gives
E0 ≅ 2.9–3.9 kV/m. In
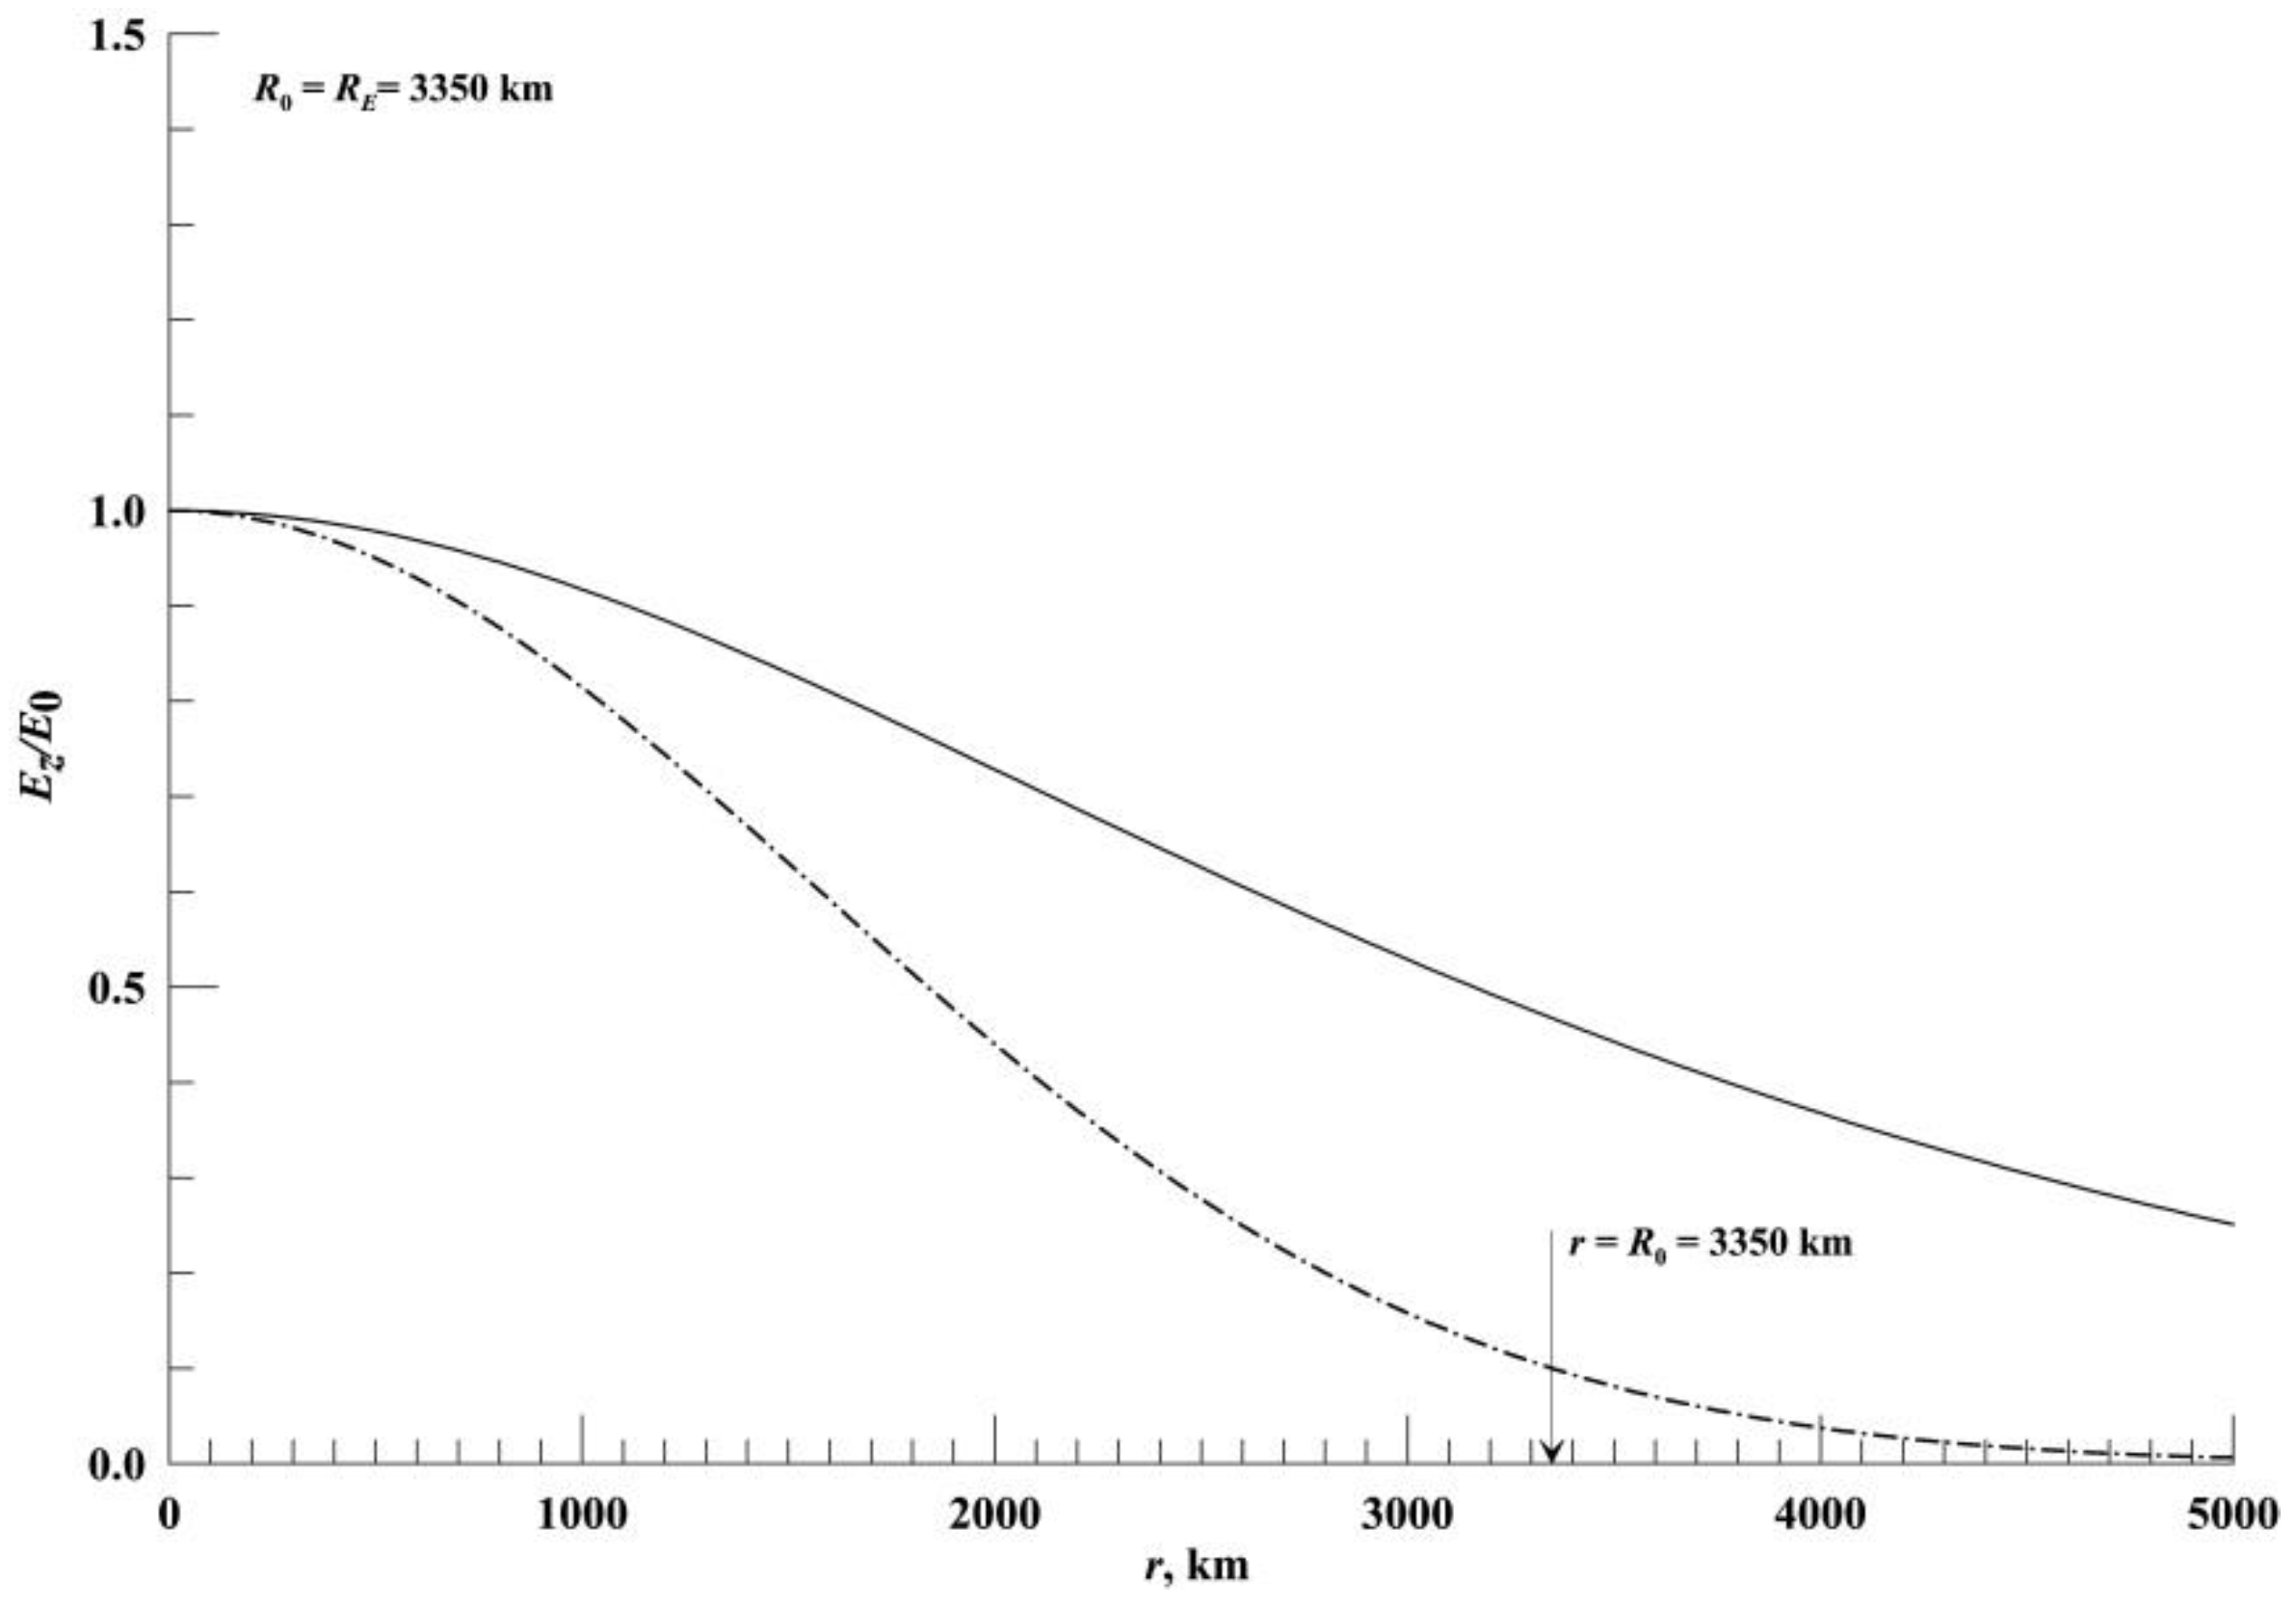
Figure 3, a solid line shows the normalized distribution of
Ez/
E0 on the ground surface depending on
r for the case we are considering, when
R0 =
RE =
RD ≅ 3350 km according to Formula (4). The dash-dotted line shows the corresponding distribution of the seismogenic field on the ground surface, which was used [
36] according to the formula Δ
Ez =
E0 exp[−(
r/
R0)
2 ln10], derived from general considerations, for the same values of
R0.
It follows from the figure that at a linear distance
r =
R0, the formula for the source of the seismogenic field, derived from general considerations and used in [
36] by ≅ 4.68 times underestimates the value of the field compared to Formula (4). This fact is of significant importance in calculating the magnitude of the electric field penetrating from the Earth’s surface to the heights of the ionosphere.
3.4. The Expected Pattern of Distribution of the Seismogenic Field Er(ion) Penetrated into the Ionosphere Depending on the Epicentral Distance before the EQ-1 Earthquake
The calculation of the distribution of the horizontal (perpendicular to geomagnetic field lines) component of the electric field in the ionosphere
Er(ion) is performed in accordance with the formalism presented in detail in [
29] in the cylindrical coordinate system (the base of the vertical
z axis placed at the epicenter of the earthquake on the ground surface) and the input parameters described above. The results of the calculations for
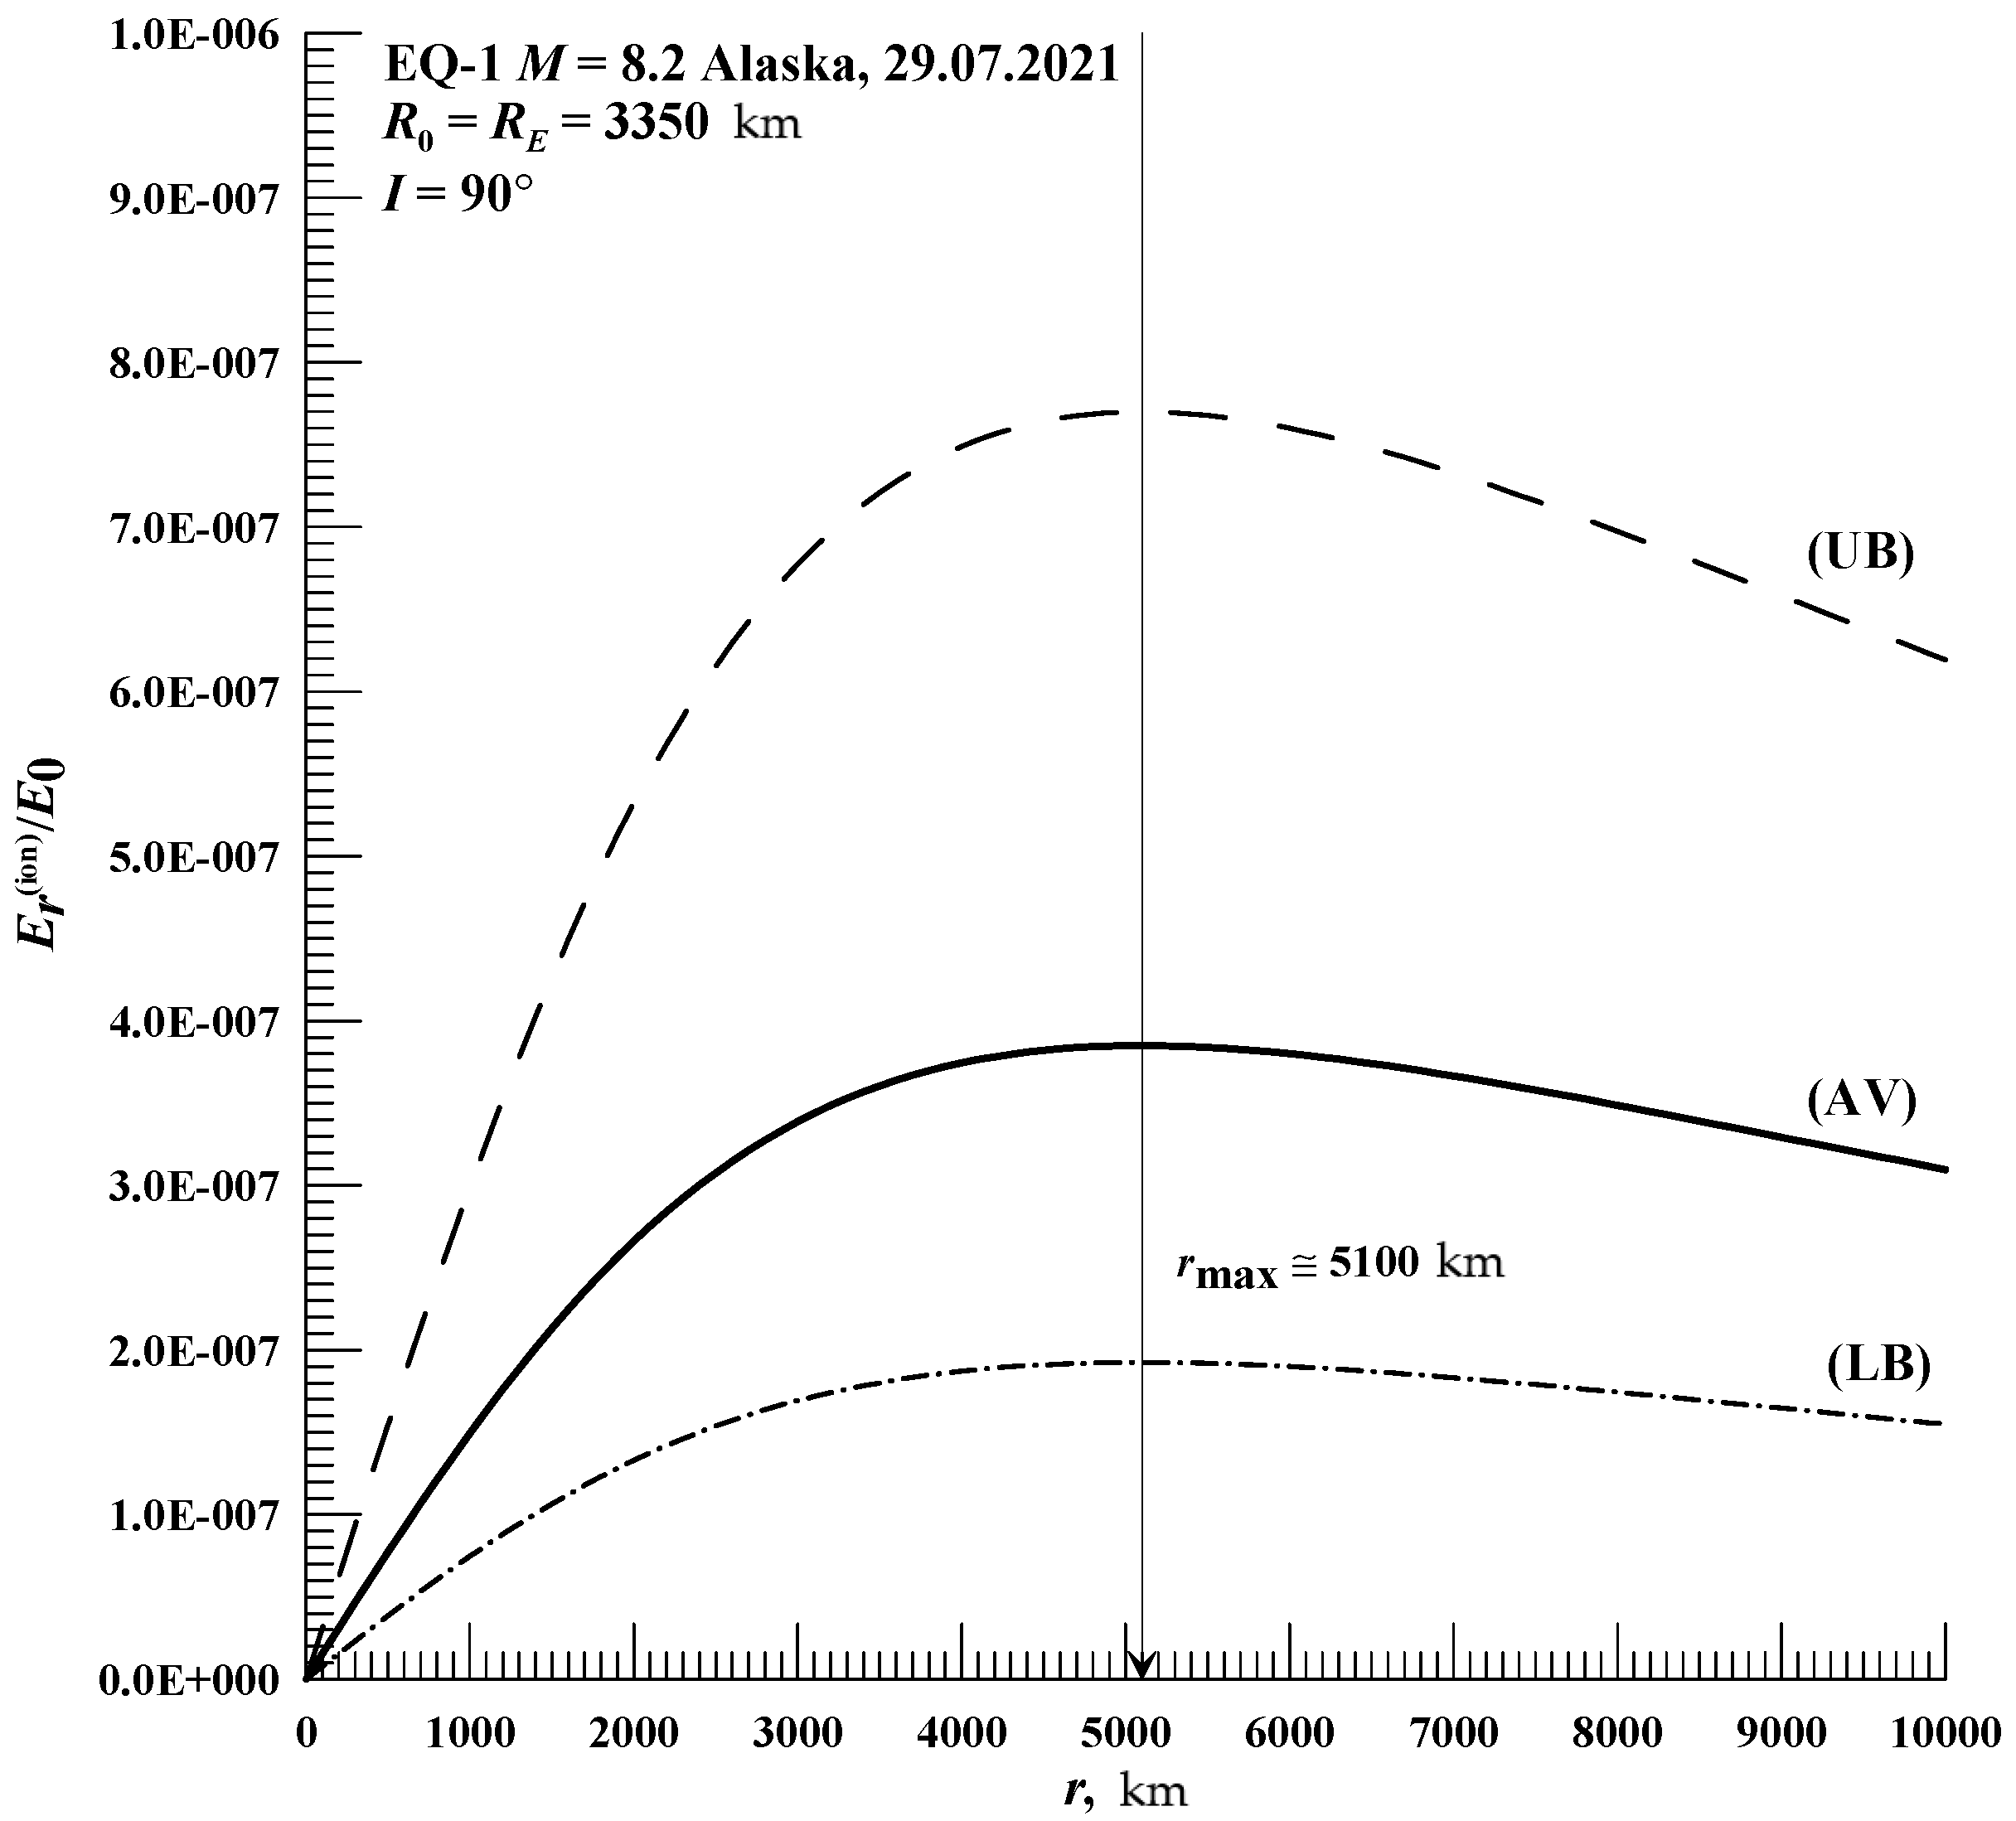
I = 90 are illustrated in
Figure 4, which shows the ratio
Er(ion)/
E0 as a function of the epicentral distance
r for low (LB, dash-dotted line), medium (AV, solid line) and high (UB, dashed line) conductivity values σ
0 (
z = 0) at the ground surface according to the model [
60].
From the figure, it can be seen that the ratio Er(ion)/E0 reaches a maximum value at a distance rmax ≅ 5100 km and is equal to 1.92 × 10⁻⁷ (LB), 3.85 × 10⁻⁷ (AV) and 7.7 × 10⁻⁷ (UB), respectively.
Let us now estimate the maximum value of the expected values of
Er(ion)max in the ionosphere due to a possible seismogenic anomaly of the quasi-static electric field Δ
Ez on the ground surface, which may take place ~42 h or 1.75 days before EQ-1. Let us choose the lower boundaries of values
E0 as reference points. For earthquakes with magnitudes M within the range 4.1–7. 5 mentioned above in
Section 3.3, we obtain 1 kV/m, 1.3 kV/m and 2.9 kV/m, respectively. Then the average value of 〈
E0〉 ≅ 1.7 kV/m, and for average (AV) conductivity values σ
0 (
z = 0) at the ground surface, taking into account the factor sin(
I) ≅ sin (68°) ≅ 0.93, we obtain that
Er(ion)max = sin (68°) × 〈
E0〉 × 3.85 × 10
−7 × 1000 [mV/m] = 0.93 × 1700 V/m × 3.85 × 10
−7 × 1000 ≅ 0.6 mV/m AV ( ≅ 0.3 mV/m and ≅ 1.2 mV/m for LB and UB, respectively).
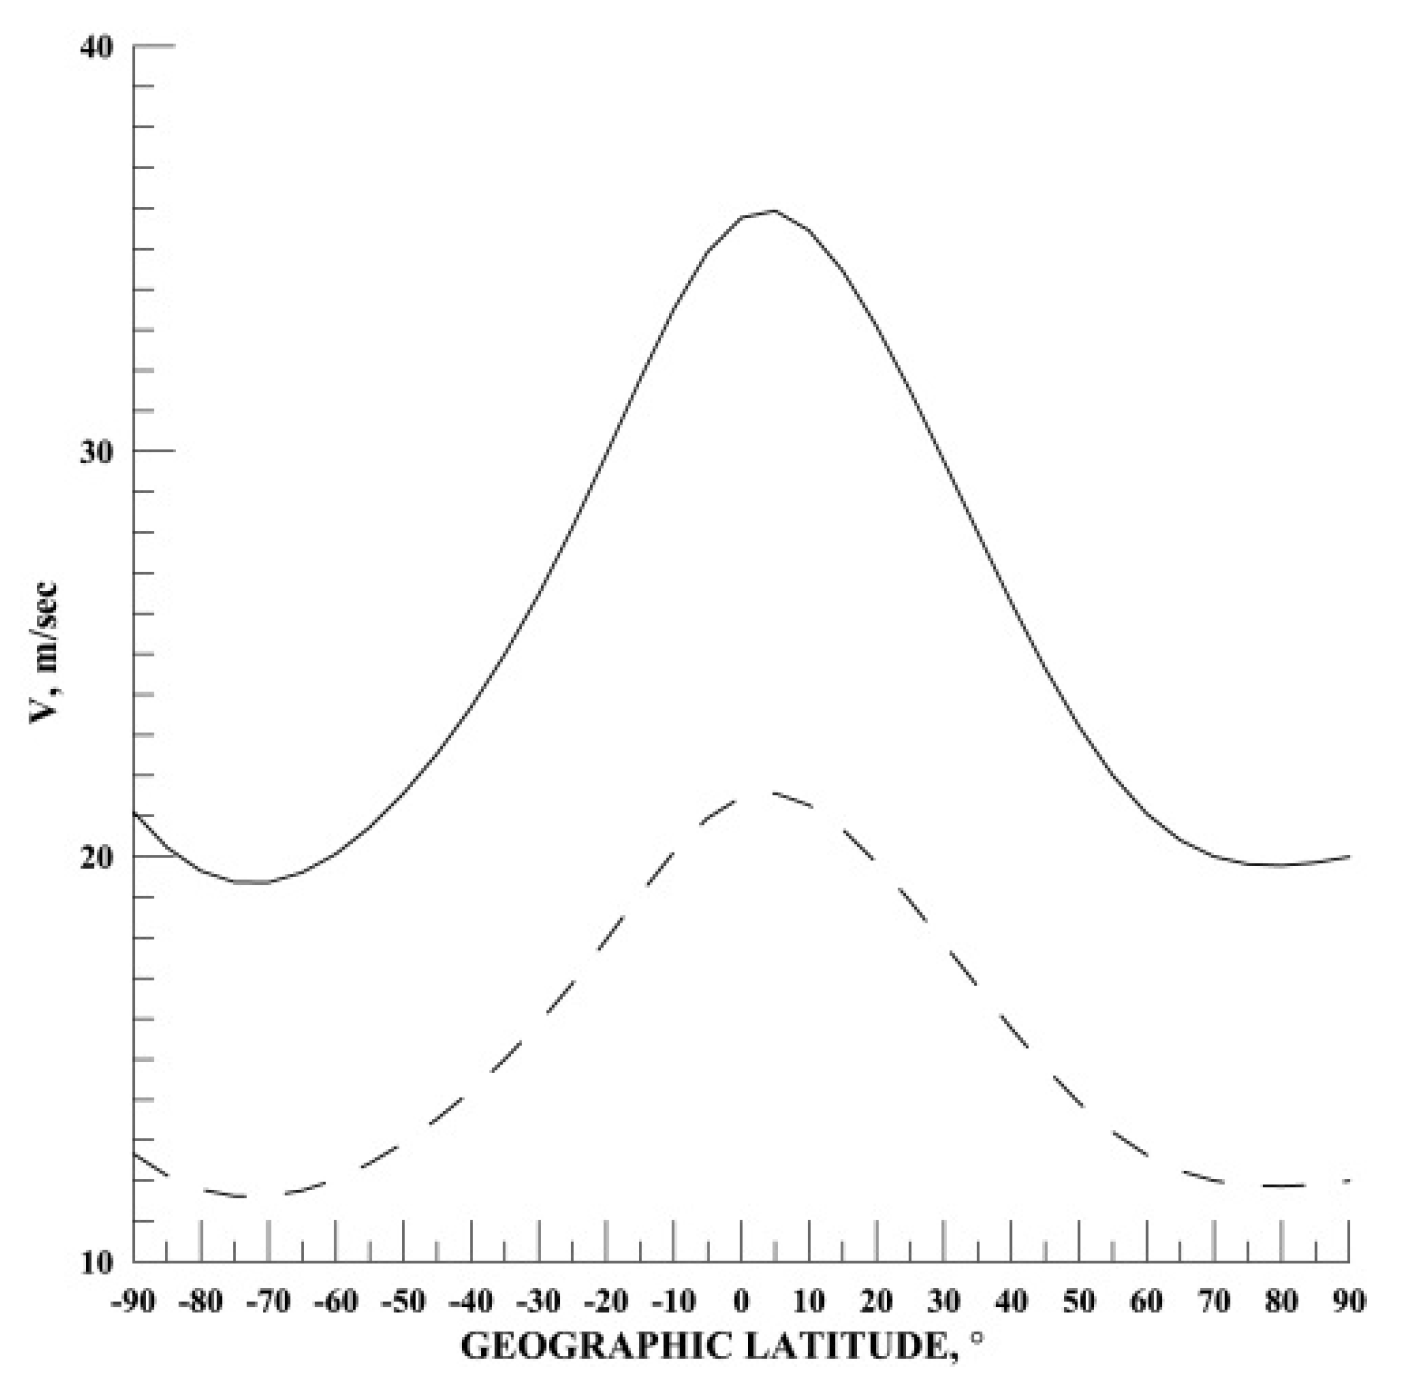
Figure 5 shows the latitudinal distribution of the module velocity electrodynamic drift of plasma V = |V
E×B| = |E × B/B
2| (m/s) at the geographical longitude of the epicenter of the earthquake EQ-1 (λ
e = 157.89° W ≅ 202° E) at altitude
h = 300 km for |E
⊥| ≅
Er(ion) = 1 mV/m (solid line) and 0.6 mV/m (dashed line). Here, E
⊥ is perpendicular to the geomagnetic field line component of the electric field (for calculations, we use the International Geomagnetic Reference Field (IGRF-13) model (
https://ccmc.gsfc.nasa.gov/modelweb/models/igrf_vitmo.php accessed on 15 March 2023)).
From the figure, it is inferred that at all latitudes the magnitudes of the velocity V for Er(ion) = 0.6 mV/m exceed 11 m/s, which is sufficient to create significant effects in the ionosphere.
3.5. Discussion of the Results Obtained for the Earthquake EQ-1 with the Involvement of Additional Data of the CSES Mission (China-Seismo-Electromagnetic Satellite)
Let us sum up some results. The above calculations show that before the EQ-1 earthquake in the night-time ionospheric conditions, 1.75 days before the earthquake, under the low geomagnetic and solar activity, an electric field of a seismogenic nature could be observed. The maximum magnitude of the electric field component perpendicular to magnetic field lines is |E⊥| max and is of order 0.3–1.2 mV/m while the mean maximum value |E⊥|max ≅ 0.6 mV/m at the epicentral distance rmax ≅ 5100 km.
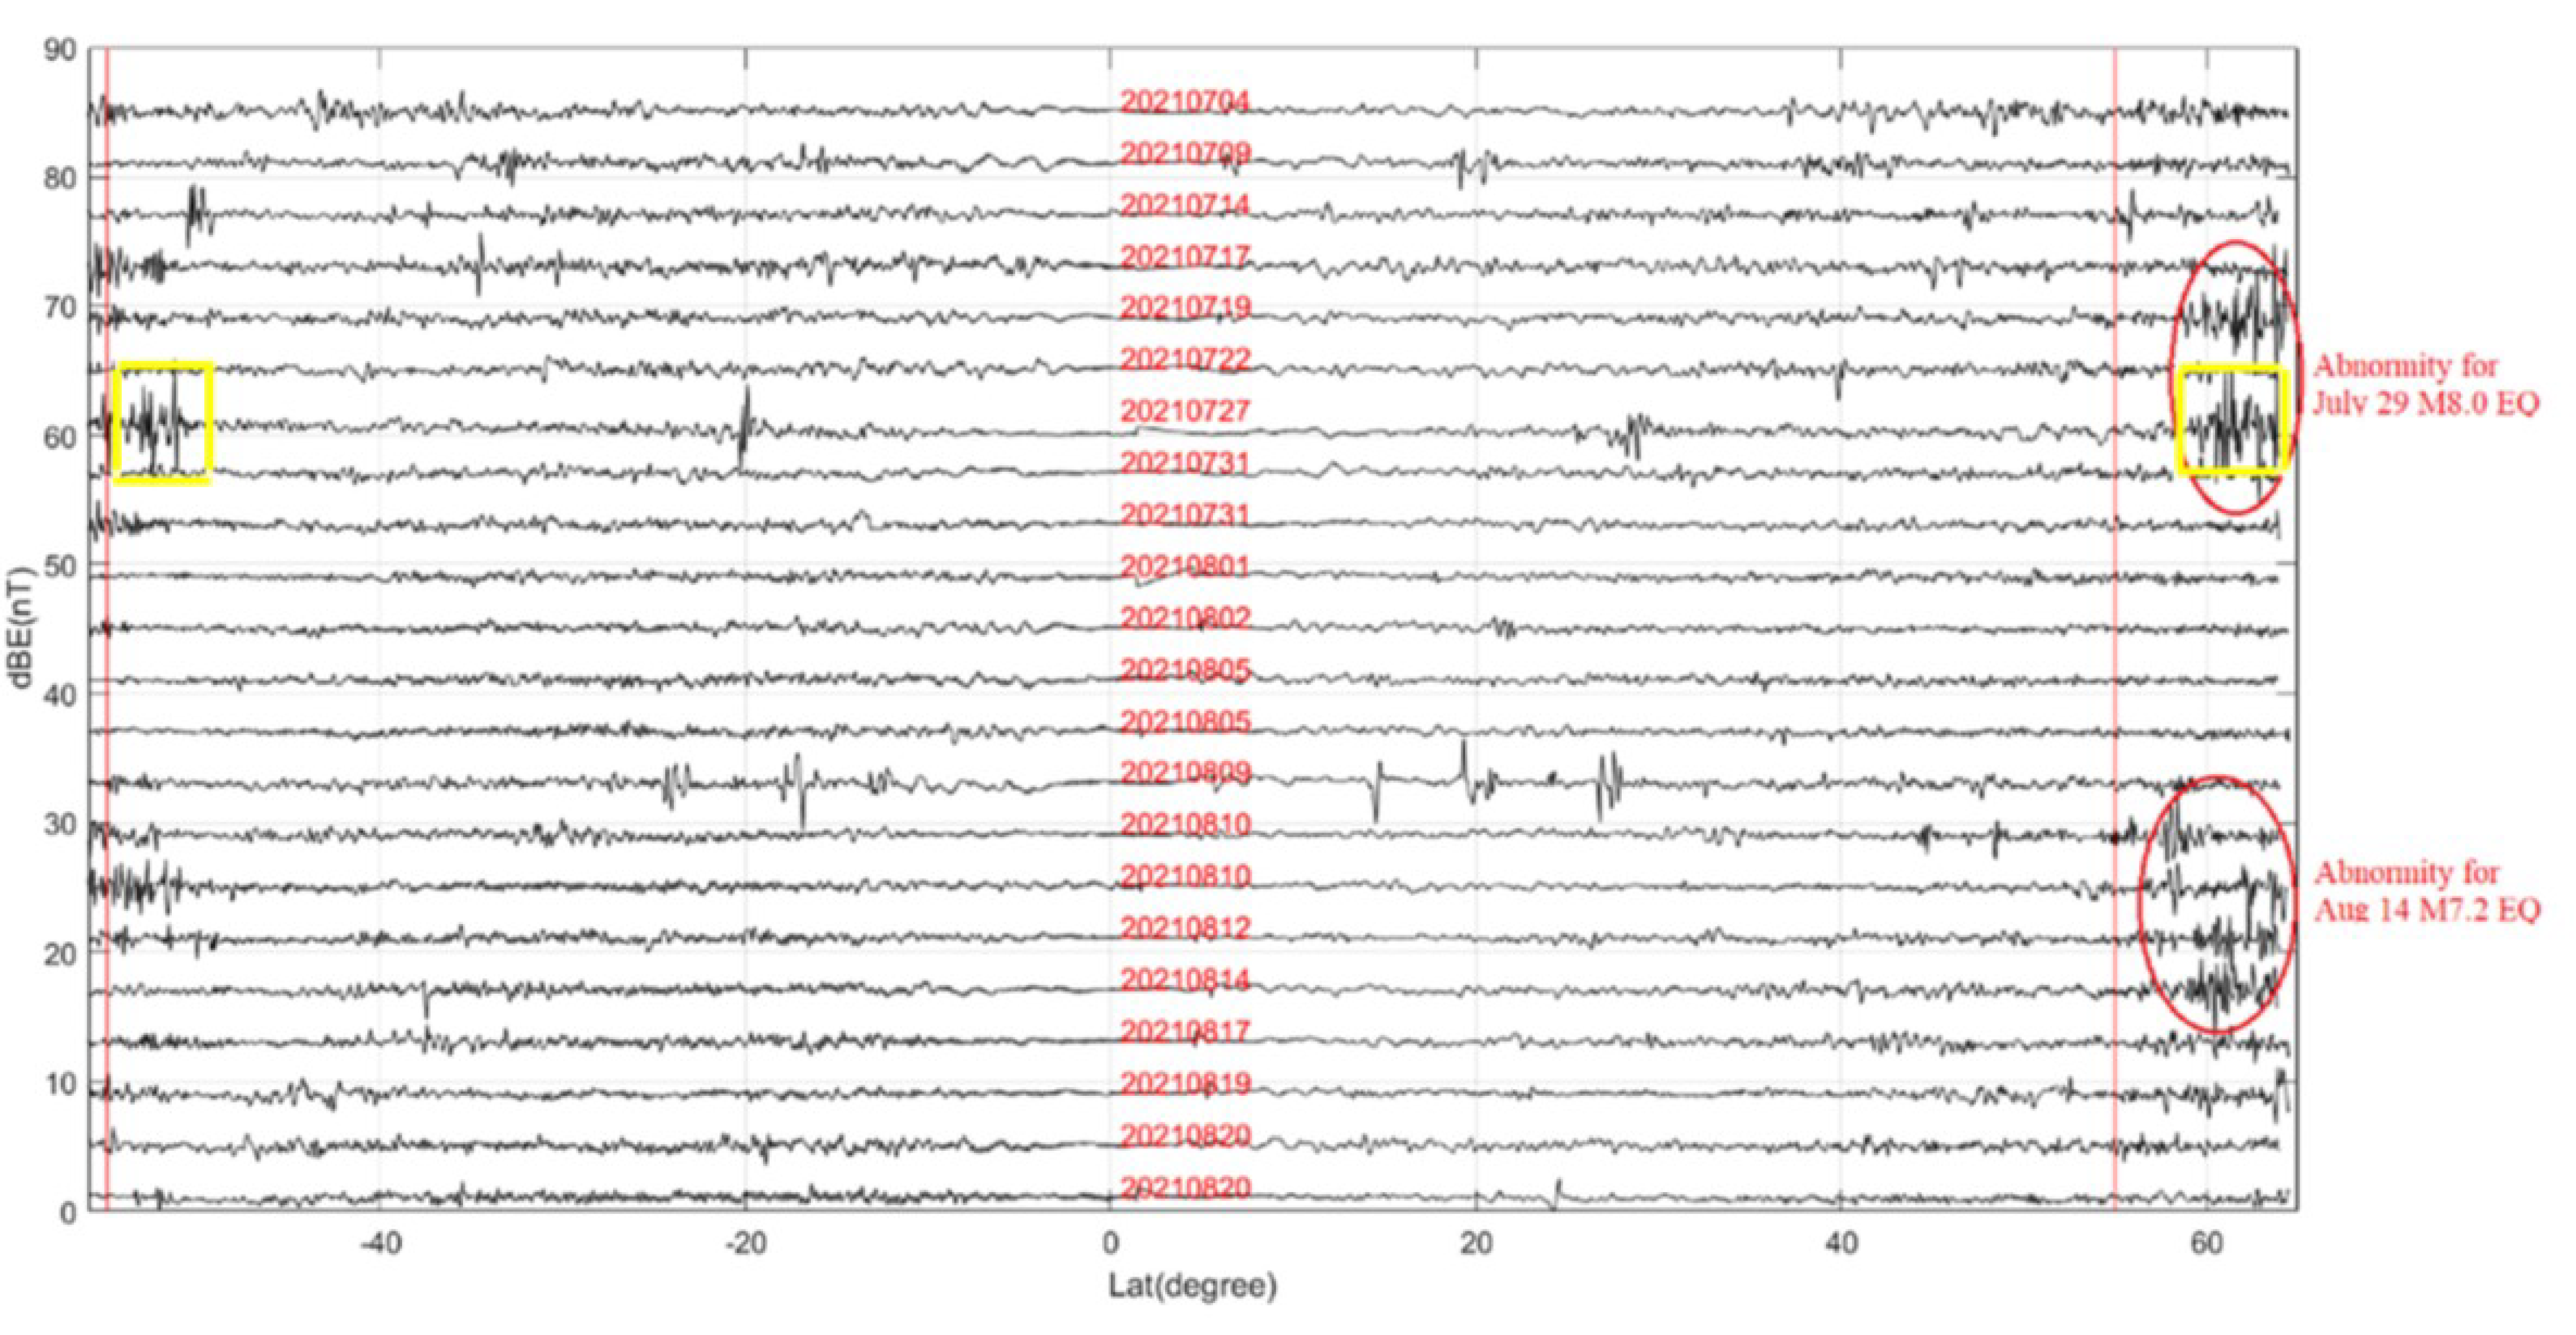
Let us consider now the data of the ULF-band electromagnetic field measurements (from DC to 15 Hz) onboard the CSES mission especially for data taken during the flyby times and trajectories of this satellite passing over the epicentral zone of the EQ-1 earthquake and area magnetically conjugated to it [
56]. The authors claim that “An abnormal ULF wave appeared 10 and 2 days before the mainshock”, i.e., anomalous ULF-band electromagnetic emissions were observed on 27 July 2021 simultaneously with anomalies in TEC, the starting moment of their development was laid into the basis for our calculations of the seismogenic electric field penetration into the ionosphere.
Looking carefully at
Figure 6 it can be seen that the abnormally high amplitudes of ULF-waves of the specified observation range are observed within latitudinal range ≅± 3–3.5° from the latitudinal location of the EQ-1 earthquake epicenter and at the part of the satellite trajectory magnetically conjugated to the epicenter 2 days before the EQ-1 earthquake. The effect of increasing amplitude in ELF-(10–30 Hz), SLF-(30–300 Hz) and ULF-(300 Hz–3 kHz), VLF-(3–30 kHz) bands over the epicentral zones of subsequent earthquakes is known from much earlier experimental works [
63,
64]. The very first description of simultaneous observation of VLF emissions and ionospheric critical frequency
foF2 anomalies in magnetically conjugated regions registered onboard the Intercosmos-19 satellite before the Irpinia M6.3 earthquake in Italy was published in [
51]. The physical interpretation of such effects is given in [
6,
55,
65,
66]. Very briefly, it consists in the fact that the amplification of ELF and VLF emissions occur as a result of their capture in the plasmaspheric ELF-VLF-duct stretched along the geomagnetic field (from one hemisphere to the other), which is formed in the vicinity of a geomagnetic field line passing through the epicenter of an impending earthquake under the influence of a seismogenic electric field that penetrated the ionosphere/plasmasphere. Thus, the presence of amplitudes of ULF-ELF-VLF waves at a magnetically conjugated point with the epicenter of the earthquake clearly indicates the formation of such ducts emerged on closed
L-shells (for the epicenter of the EQ-1 earthquake, located at fairly high geographical latitudes; however,
Le(EQ-1) ≅ 2.9–3.0). The fact established by the CSES satellite data is an experimental confirmation of the assumption put forward at the beginning of
Section 3 that on 27 July 2021 in the time interval of 12–13 h UT (for ~42 h or 1.75 days before the earthquake) in the epicentral zone of the EQ-1 earthquake there was a seismogenic electrical anomaly of the vertical electric field at the ground surface Δ
Ez. The characteristics of a “seismogenic” duct (under specific conditions indicated in [
61]) are described in detail, and at altitudes of ~2000 km, the size of such a “duct” in the zonal direction (west–east) can be ~2000 km, whereas in the meridional direction (pole–equator) it can extend for ~600 km and is centered on a geomagnetic field line passing through the epicenter of the earthquake. The maximum heterogeneity of the electron concentration relative to its central point in the perpendicular cross-section of the magnetic power tube is approximately 15% for conditions of low solar activity.
4. Estimation of the Electric Field in the Ionosphere before the M9.2 28 March 1964 Earthquake (EQ-2) near Anchorage, Alaska, USA
A catastrophic earthquake EQ-2 with magnitude
M = 9.2 according to updated on 07 November 2016 data (Prince William Sound Earthquake or The Great Alaska Earthquake or The Good Friday Earthquake, hypocenter depth 25 km) occurred on 28 March 1964 at 03:36:16 h UT (or 27 March 1964 at 17:36:16 h LT) near Anchorage, Alaska, USA, located about 120 km northwest of the epicenter. The geographical coordinates of the epicenter are φ
e = 60.91° N, λ
e = 147.34° W (magnetic inclination angle
I ≅ 74° and sin
I ≅ 0.96). From 27 March 1964 to 28 March 1964, the flux of solar radiation at the wavelength 10.7 cm was within the range 74–78 SFU and solar activity was very low. The estimate of the minimum radius of the earthquake preparation zone according to Dobrovolsky [
57] gives
RD = 10
0.43M = 10
0.43×9.2 =
R0 ≅ 9000 km.
It should be noted here that the investigation of the ionospheric perturbations preceding earthquakes (IPPE) apparently began with a pioneering work [
67] devoted to the study of the ionospheric effects associated with this particular earthquake. In this work, in particular, it was shown that at the Boulder ISVS, distanced in the arc of the great circle at ~3700 km from the epicenter of the earthquake, well-defined disturbances in the ionosphere were clearly recorded. They were observed as simultaneously existing inhomogeneities in the regions
E (sporadic layer
Es) and
F (
F-scattering) of the ionosphere for about two hours before the shock. Note here that the sequence of planetary
Kp-indices on the day preceding the earthquake and on the day when the earthquake occurred was as follows:
Kp (27.03.1964) = {1
+; 0
0; 2
0; 0
+; 0
+; 1
-; 0
+; 1
0} and, respectively,
Kp (28.03.1964) = {0
0; 0
0; 0
+; 0
0; 0
0; 0
+; 0
0; 0
0}, i.e., the geomagnetic situation was very quiet. A more detailed analysis of the variations of one of the most important, regularly measured parameters at the ISVS, the critical frequency of
F2 layer of the ionosphere (
foF2), a few hours before this earthquake was carried out much later, in [
68] with the data of eight ISVSs. At the same time, it was found that at least a few hours before the earthquake against a quiet background of heliogeomagnetic activity (two days before the earthquake, the average daily number of sunspots was about 15, and the average value of the
AE-index was ~30 nT) specific regional disturbances appeared in the ionosphere both near the epicenter of the anticipated earthquake (~100 km) and at a considerable distance from it (~1000–1500 km), apparently being its precursors.
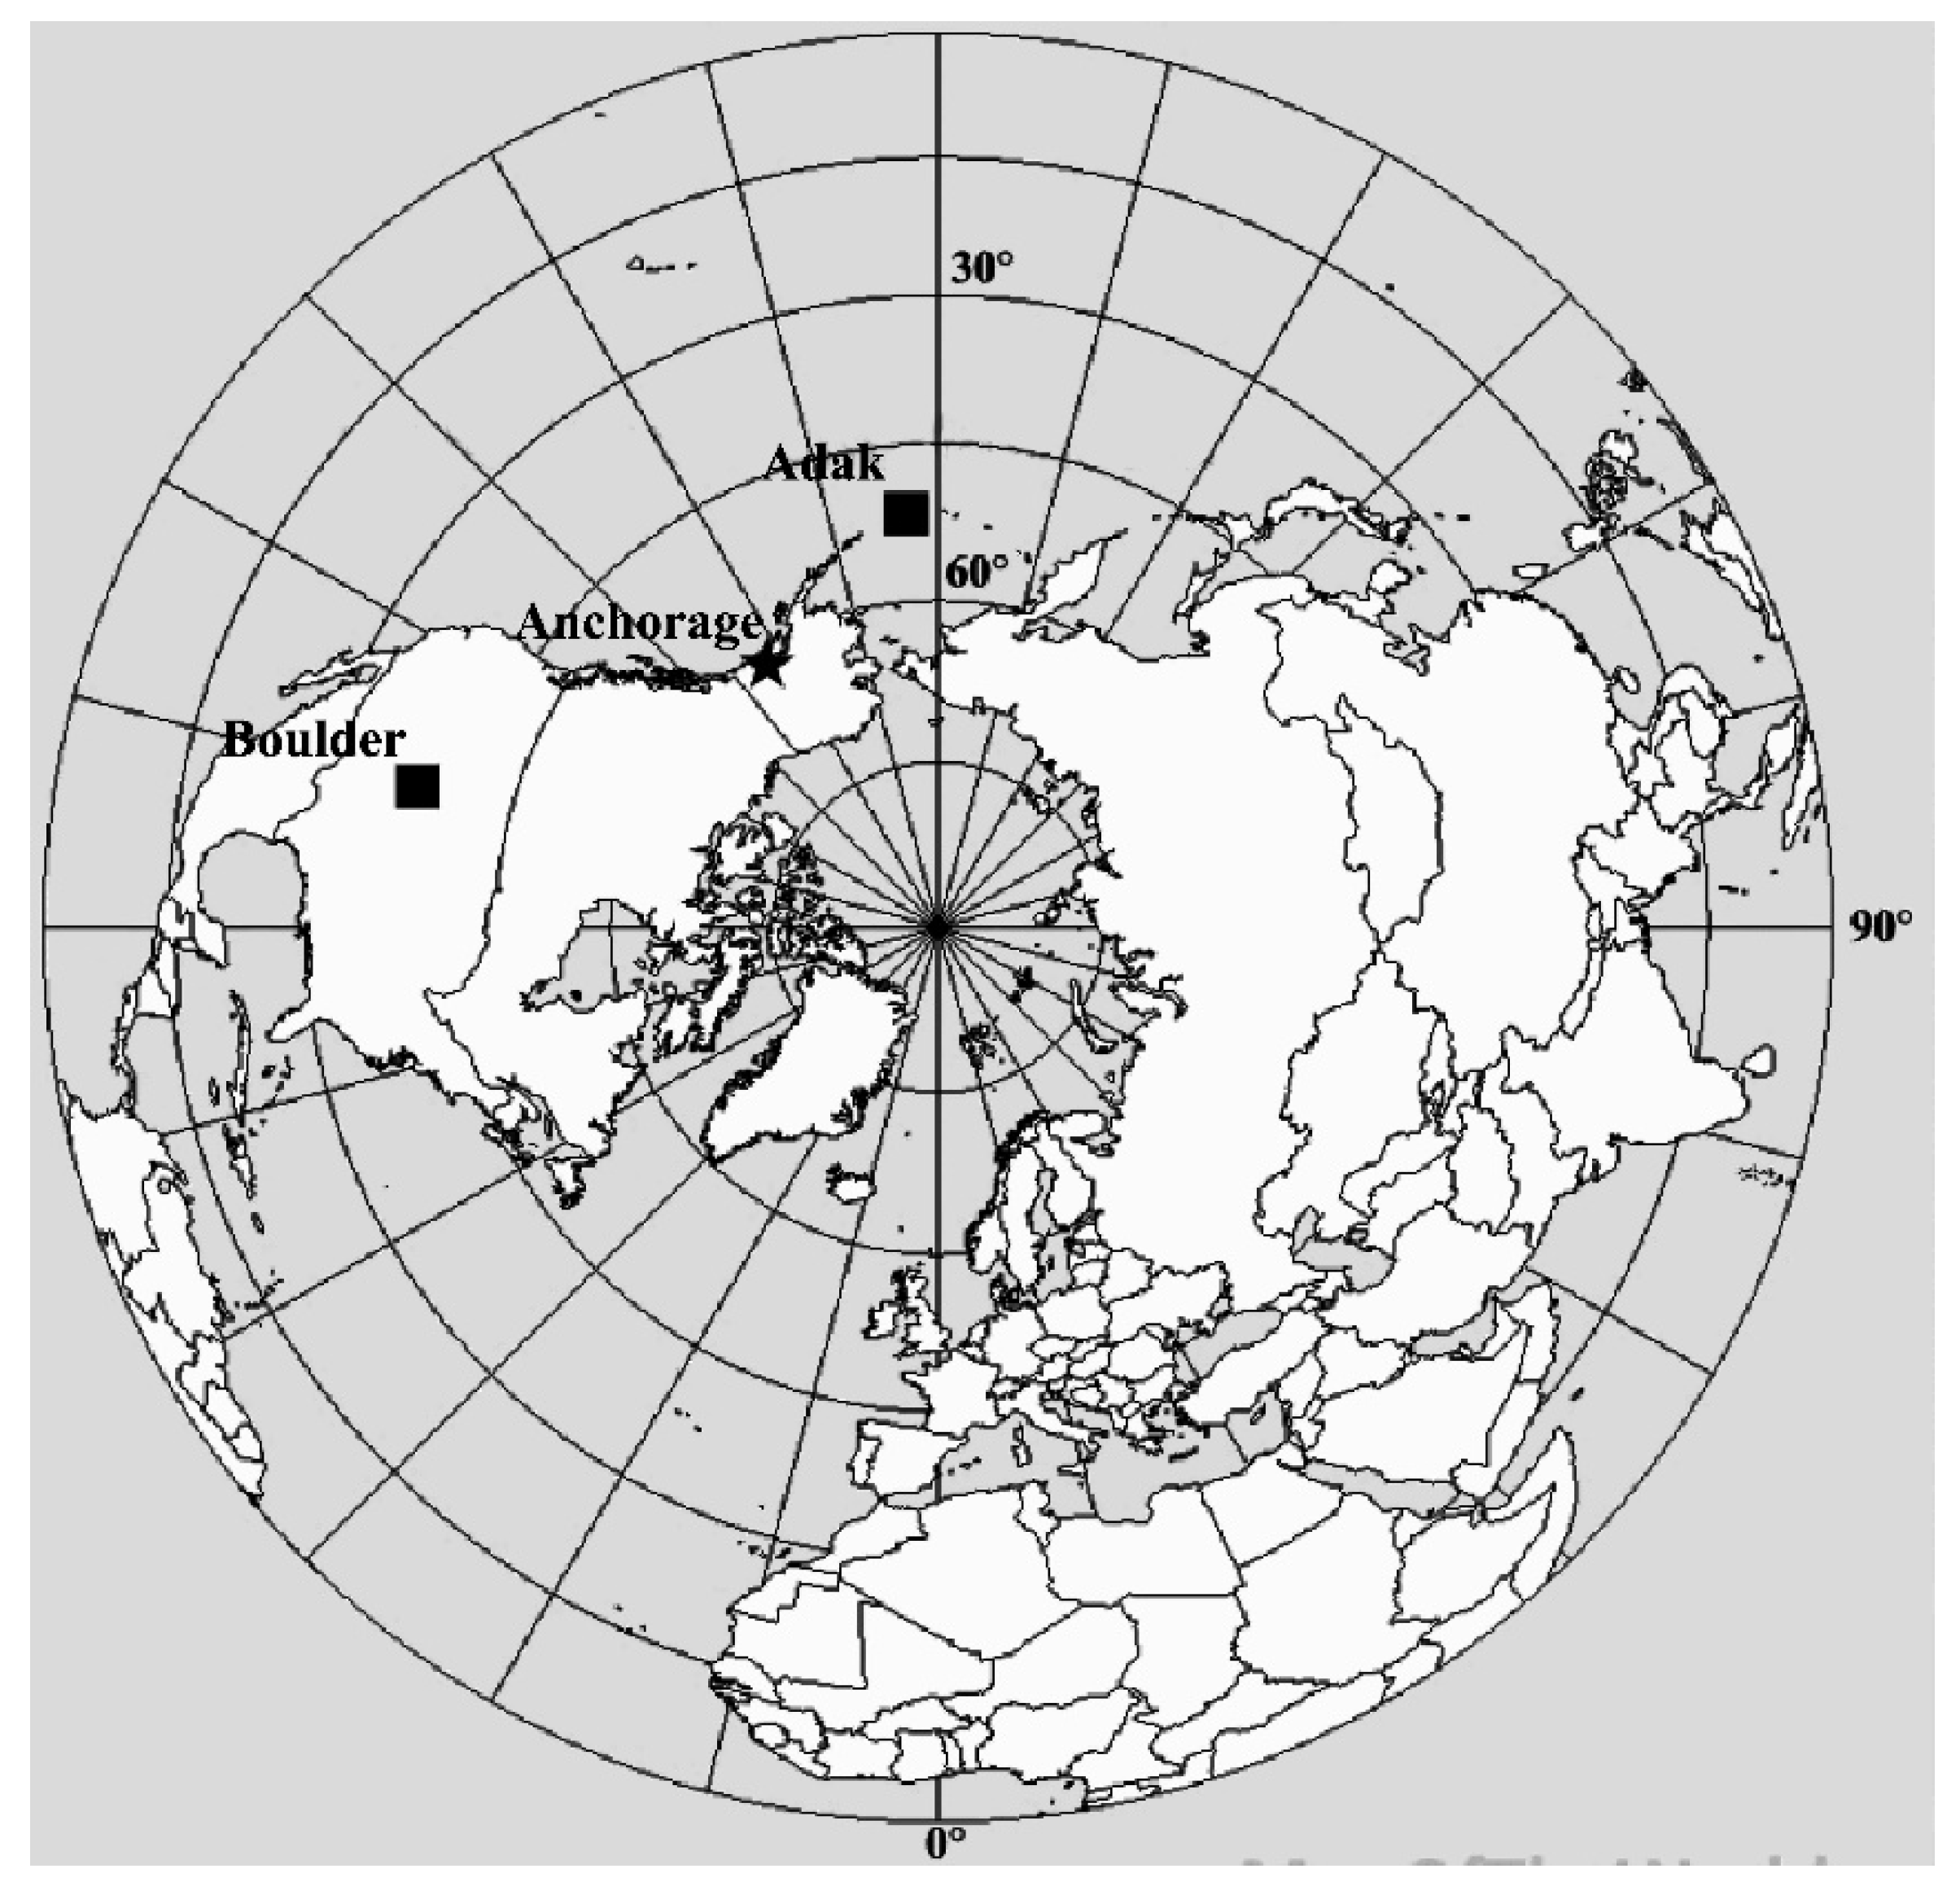
Figure 7 shows the geographical location of all the ISVSs concerning which data are used to further investigate the situation related to the EQ-2 earthquake (the epicenter of the earthquake is marked with an asterisk and almost coincides with the position of the ISVS Anchorage, and the Adak and Boulder ISVS are marked with black squares).
Figure 7 clearly shows the large characteristic spatial scales of physical processes occurring in the zone of preparation of the catastrophic earthquake EQ-2 with a magnitude of
M = 9.2, which is due to its enormous power.
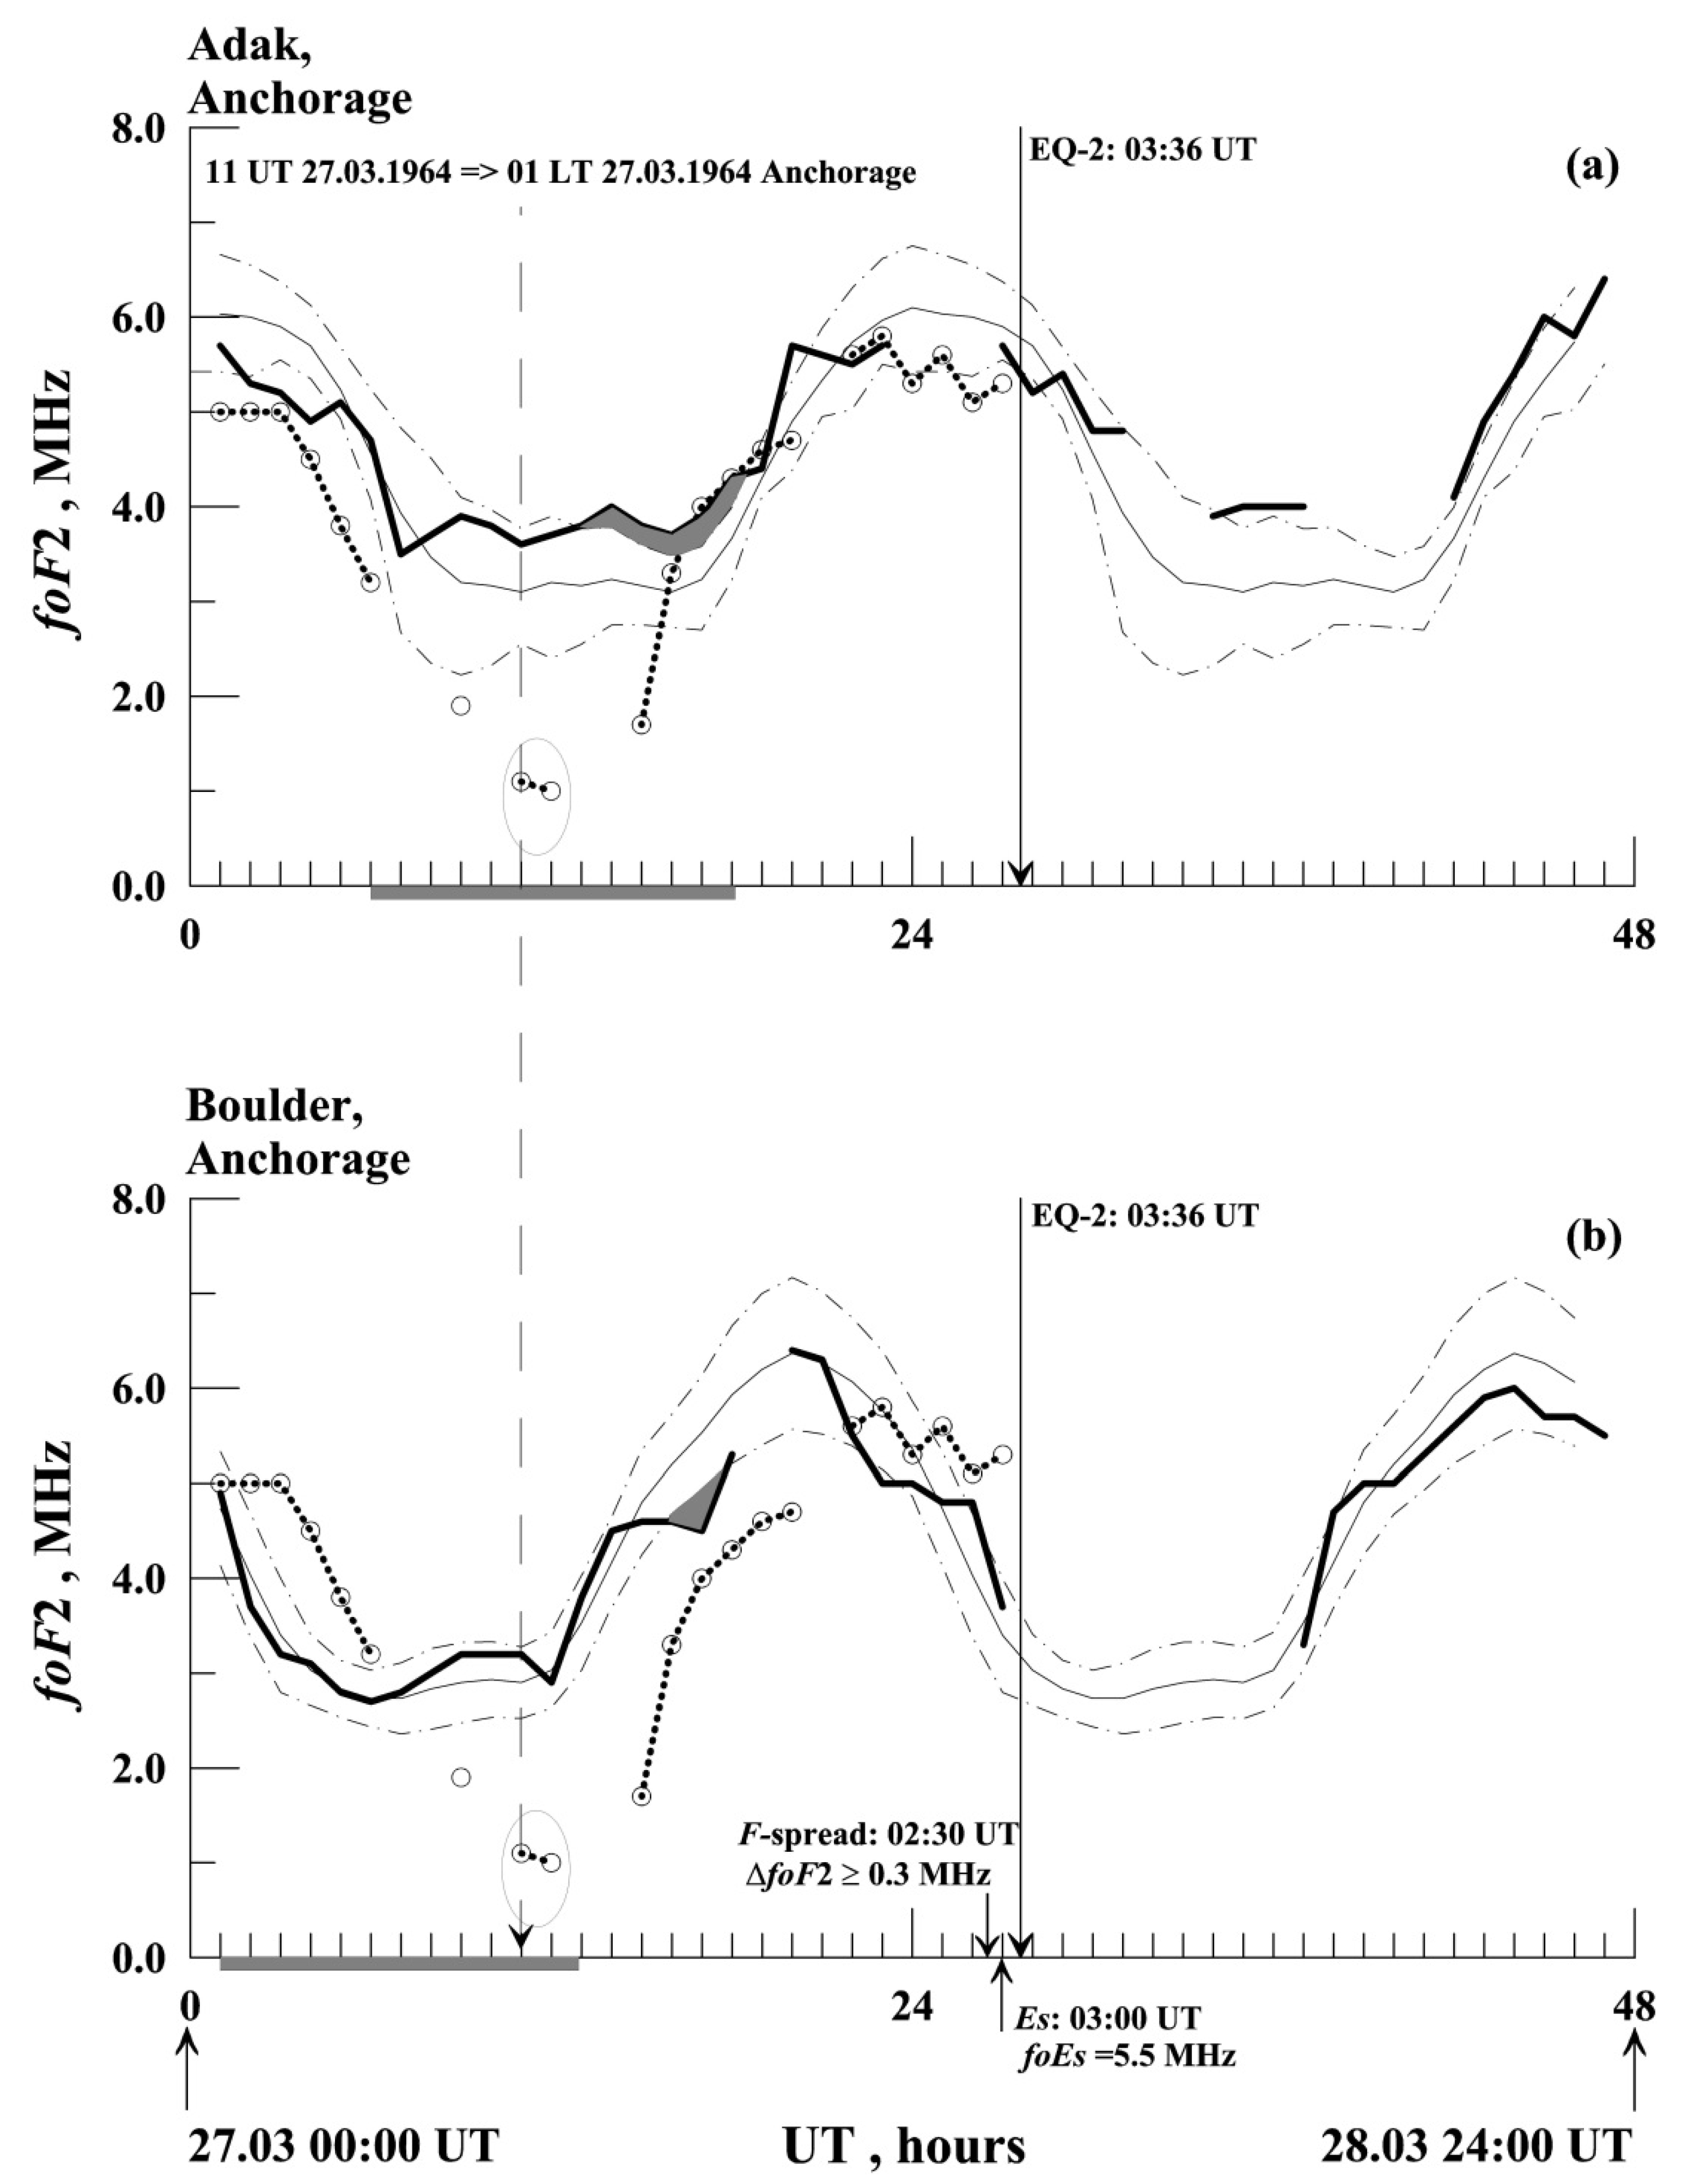
Careful study of
Figure 8 allows one to find that in the time interval 11–12 h UT (03–04 h LT, night) on 27.03.1964 (it is ~15.5–16.5 h before the earthquake) abnormally low values of
foF2 are observed on the ISVS Anchorage compared to the median.
It can be seen from the figure that at the Adak ISVS a few hours before sunrise until the end of the local night the critical frequency exceeds the upper limit
foF2
med + 0.75
IQR (see
Figure 8a, shaded area); regardless, it is significantly distant from the epicenter of the earthquake by ~2090 km along the great circle arc. Nevertheless, it is still inside the zone of preparation of this earthquake. Note that the local time in Anchorage is “ahead” of local time in Adak by ~2 h (LT
Adak ≅ LT
Ancorage −2 h), and Anchorage is located higher in latitude by ~9°.
Contrary to the Adak ISVS, at Boulder ISVS at the same time interval the negative deviation of
foF2 is observed beyond the lower boundary of
foF2
med −0.75
IQR (see
Figure 8b). Recall here that the Adak ISVS is distanced from the epicenter of the EQ-2 earthquake by ~2090 km, and the Boulder ISVS by ~3700 km along the arc of a large circle, but the maximum deviation from the median in the specified time interval for both ISVSs is ≈20%.
To explain the difference in the critical frequency deviation sign, we should consider the longitudinal difference between the ionospheric station locations. Adak is located ~26.5 degrees westward from Anchorage, while Boulder is ~44.6 degrees eastward from Anchorage. Taking into account the differences in the local time −2 h for Adak and +3 h for Boulder in relation to Anchorage, and established in [
70] dependence of the ionospheric precursors on the local time this difference looks quite natural.
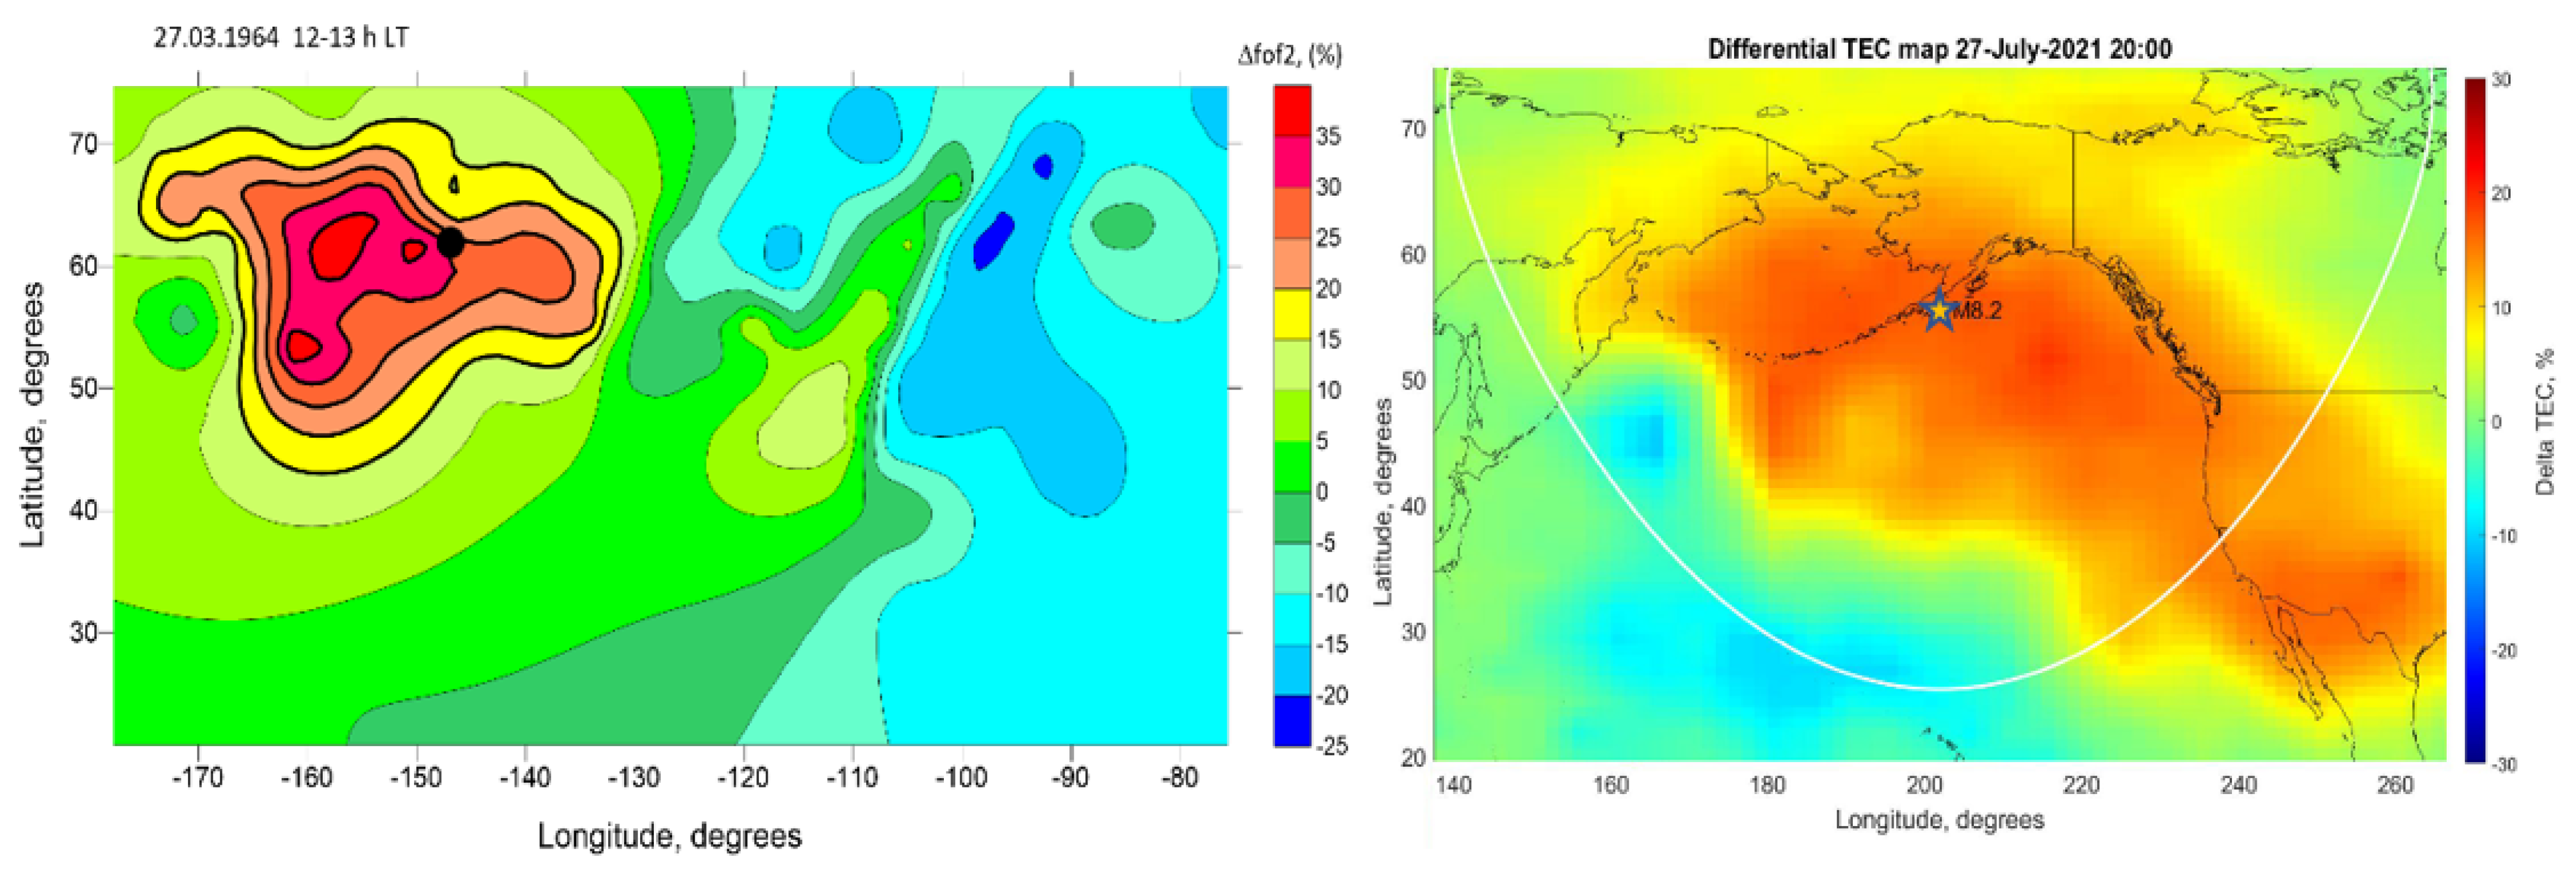
Finalizing the demonstration of the experimental data for the case of the Good Friday earthquake (EQ-2), we have an exceptional lack of data concerning the topside ionosphere monitoring from onboard the Alouette-1 satellite which was in orbit and passed over the EQ-2 preparation zone during day-time hours local time [
69]. The synthetic differential maps (composed from several satellite passes) of the critical frequency
foF2 are shown in the left panel of
Figure 9. They were collected for the time interval when the positive anomalies were observed on the vertical sounding ionograms of the Adak ISVS (
Figure 8a). The most striking fact was that for the EQ-1 of 2021 a similar positive anomaly was registered as well on the GIM differential TEC MAP on 27.07.2021 (
Figure 9, right panel); the description of the procedure for obtaining such a card is detailed in work [
71]. This permits us to be more confident that the observed anomalies are formed under the action of the same physical mechanism: anomalous electrostatic electric field penetrating into ionosphere/plasmasphere. This is also confirmed by estimation of this field for the EQ-2 provided in
Section 4.3.
Suppose here (as well as earlier in
Section 2) that at 11–12 h UT (03–04 h LT, night near the epicentral point close to the ISVS Anchorage) on 27 March 1964, i.e., 15.5–16.5 h before the earthquake, there was a seismogenic anomaly of the vertical electric field Δ
Ez at the ground surface. Let us then make the same assessment of a possible seismogenic electric field in the ionosphere according to the scheme described above in
Section 2, omitting the details.
4.1. Conductivity Model
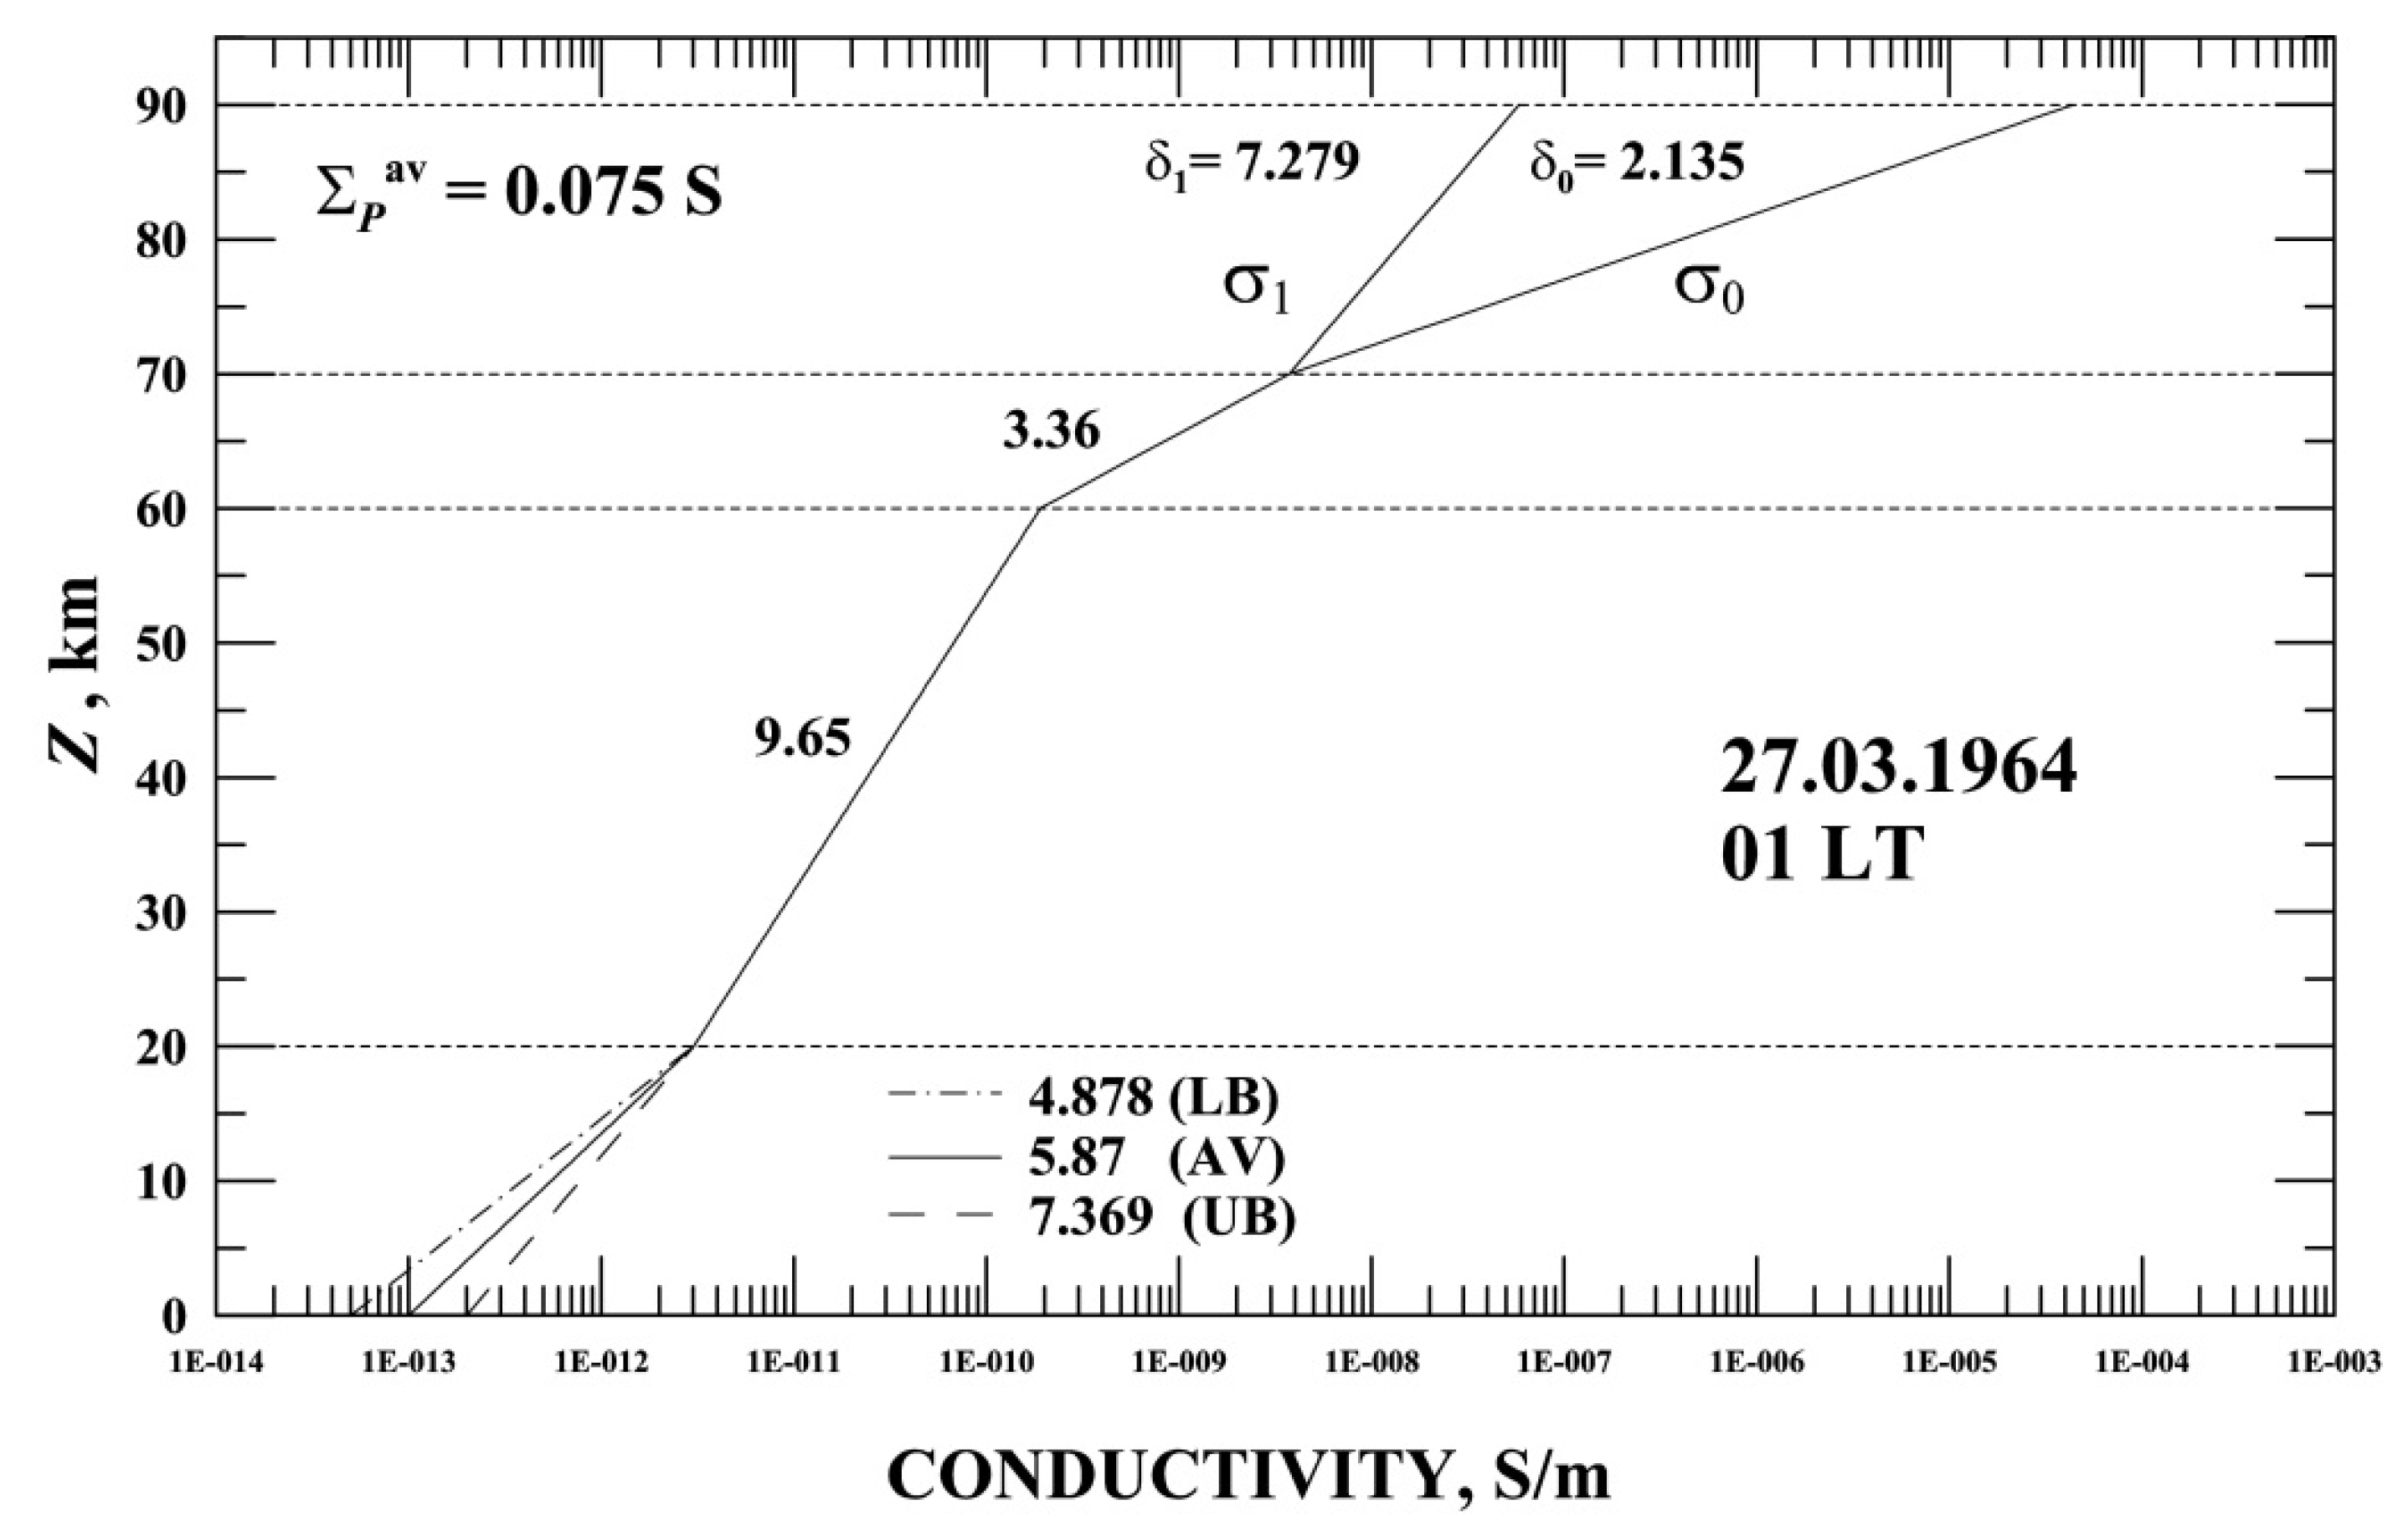
Figure 10 demonstrates the conductivity model used to calculate the magnitude of the seismogenic electric field in the ionosphere (similar to
Figure 2) for the time of 11:00 h UT on 27 March 1964 and the geographical point of the epicenter of the EQ-2 earthquake (the Pedersen integral conductivity Σ
P* ≅ 0.08 S is also calculated for the magnetically conjugated point). For the specified geodetic points and the specified time of 27.03.1964, the values of the corresponding conductivity parameters σ
0(z = 90 km) = 4.38 × 10
−5 S/m, σ
1(z = 90 km) = 5.83 × 10
−8 S/m, Σ
P≅ 0.07 S and Σ
Pav = 0.075 S, taking into account that Σ
Pav = (Σ
P + Σ
P*)/2. Note here that, despite the higher latitude of the epicenter of the EQ-2 earthquake compared to the EQ-1 earthquake (ϕ
e{EQ-2} = 60.91° N > ϕ
e {EQ-1} = 55.36° N), it remains within the range of closed
L-shells, because
Le(EQ-2) ≅ 4.35 (the position of plasmapause is usually about
L = 5).
4.2. Model of the Source of a Quasi-Static Seismogenic Electric Field in the Atmosphere near the Ground Surface
The distribution of the perturbation of the vertical component of the electric field Δ
Ez on the surface as a function of the epicentral distance
r (assuming the cylindrical symmetry of the field source relative to the vertical axis passing through the epicenter of the earthquake) is taken (as in
Section 3.3) in accordance with Formula (4). In this case,
R0 =
RD(
M = 9.2) ≅ 9000 km is the radius of the earthquake preparation zone on the ground surface. The value of
RE (the scale of field decrease in direction from the epicenter) will be determined on the basis of its possible lower boundary (see
Section 3.2), based on the ratio
RE /
R0 = 0.6, i.e.,
RE (EQ-2) ≅ 5400 km.
4.3. Expected Pattern of Distribution of the Seismogenic field Er(ion) Penetrated into the Ionosphere Depending on the Epicentral Distance before the EQ-2 Earthquake
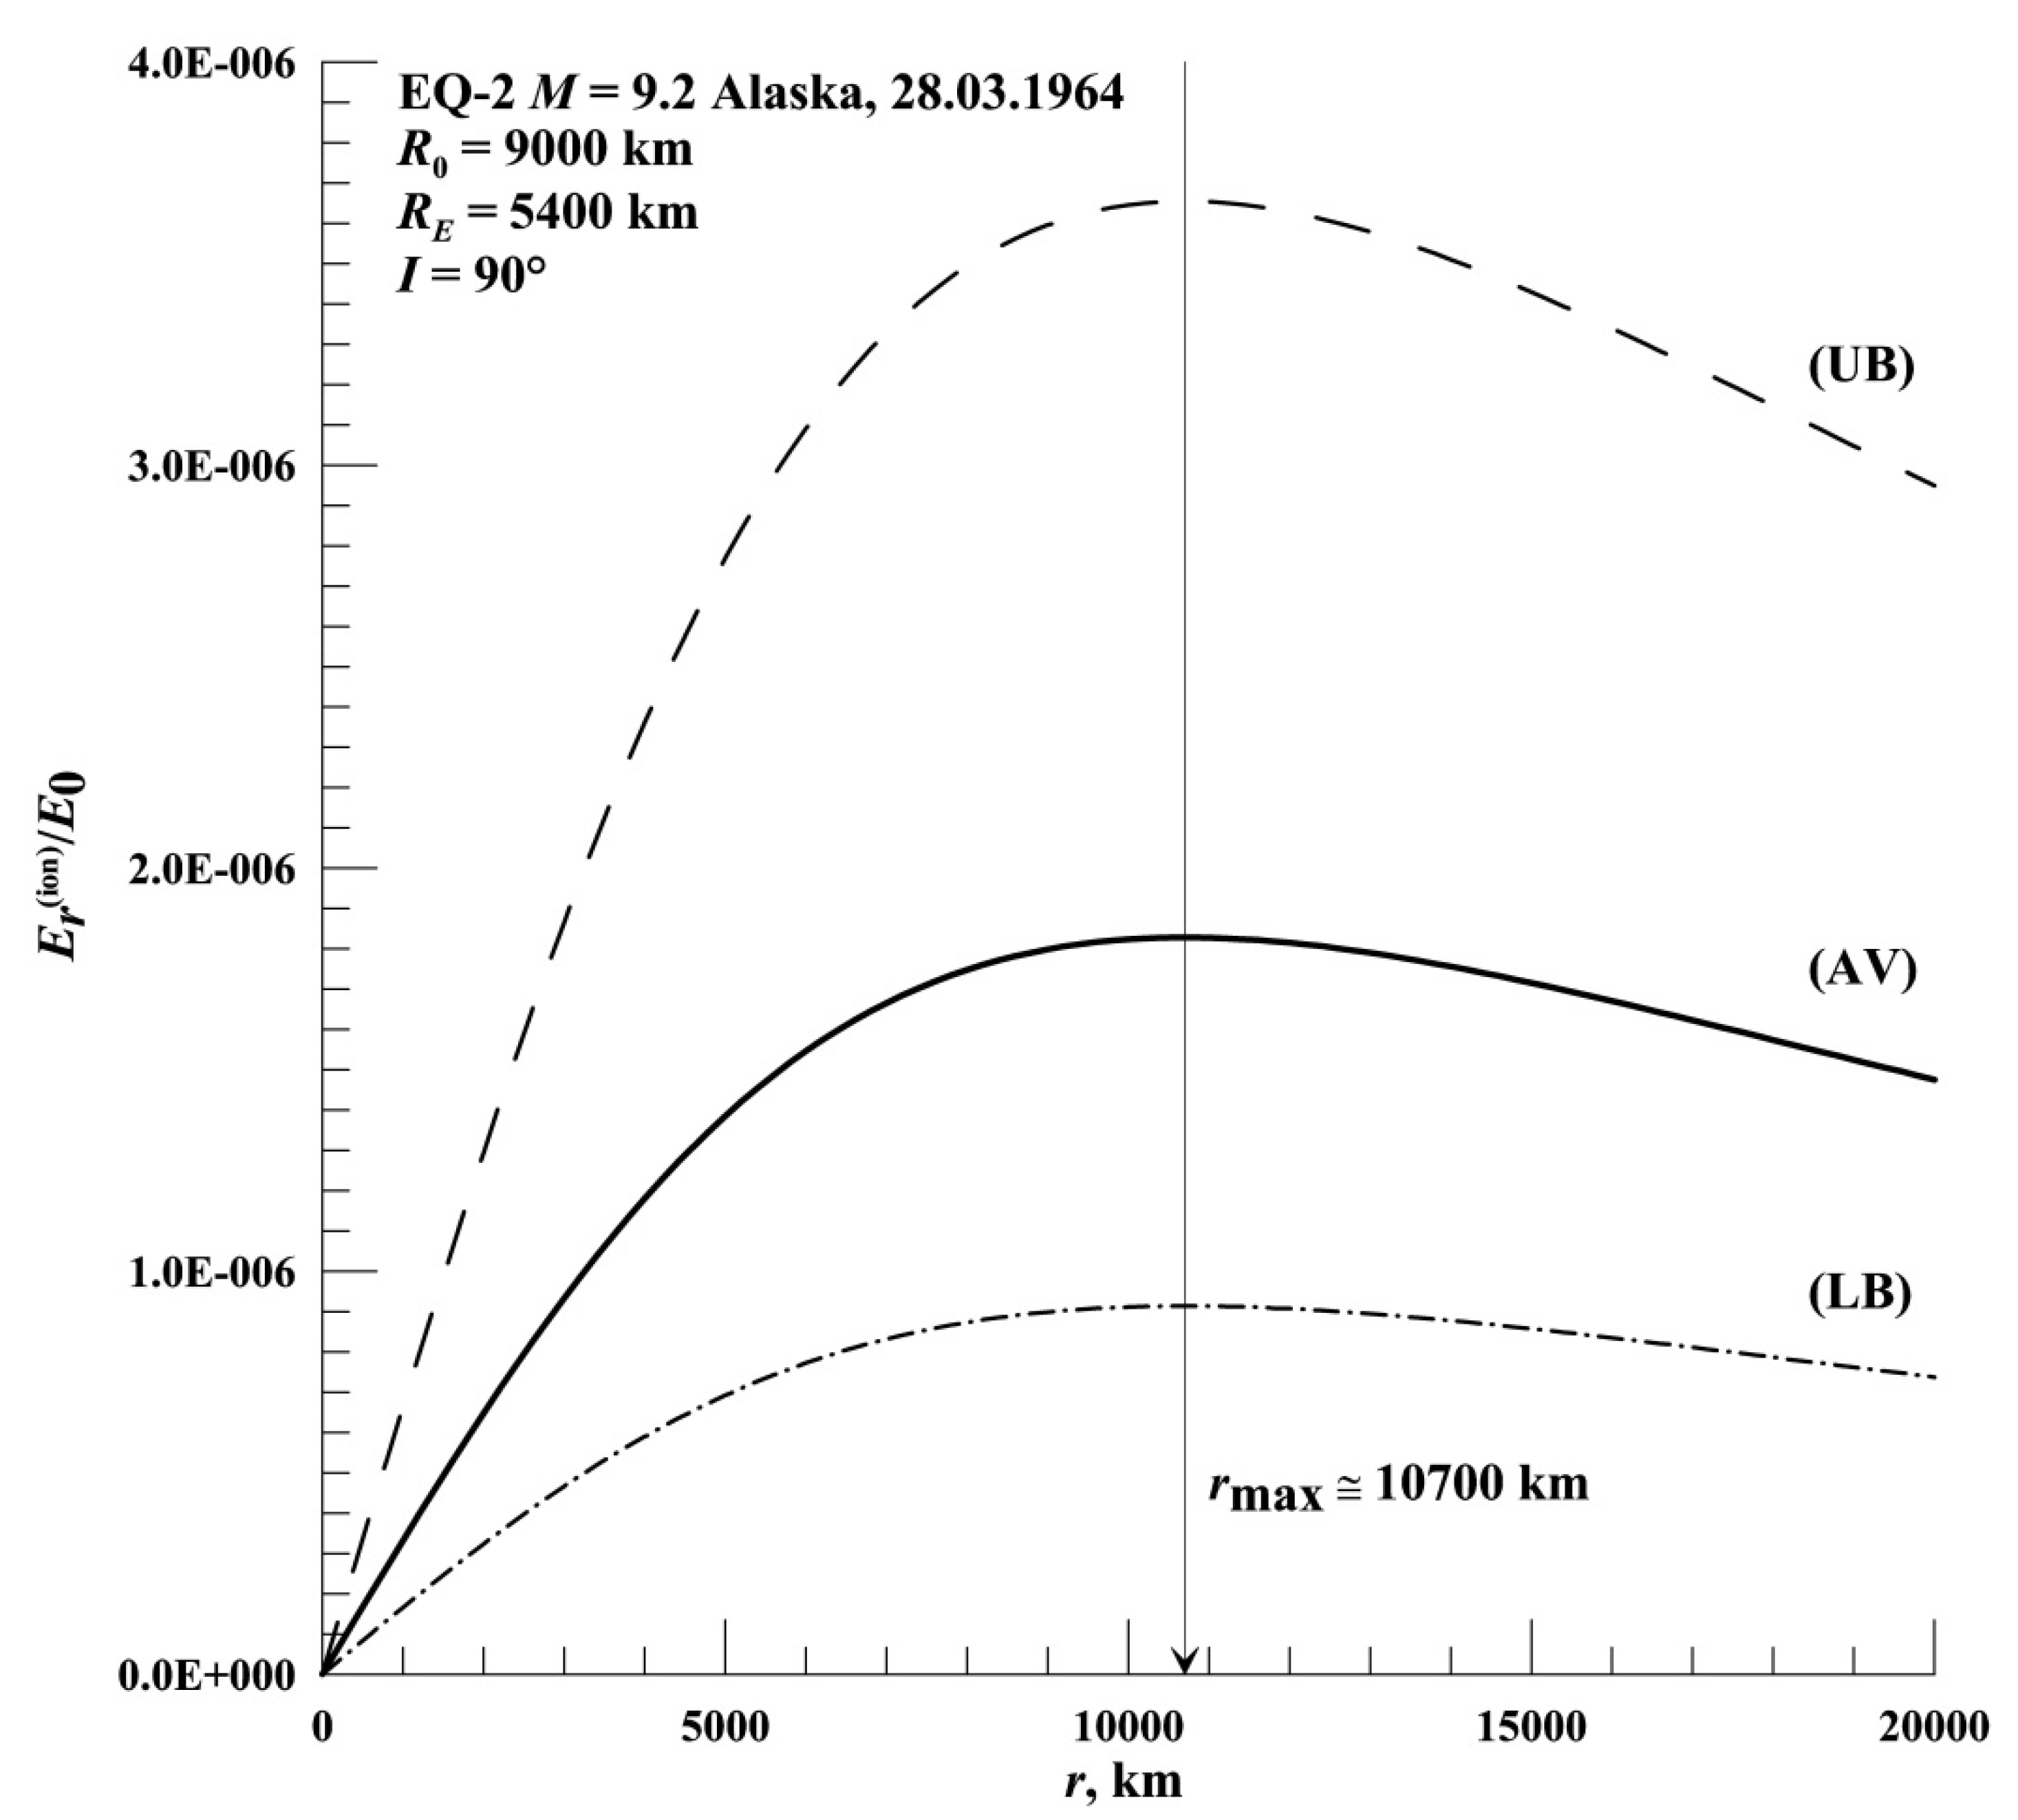
The results of calculations of the horizontal (perpendicular to geomagnetic field lines) component of the seismogenic electric field in the ionosphere
Er(ion) for
I = 90° illustrates
Figure 11. The ratio of
Er(ion)/
E0 (similarly to
Figure 3) is provided as dependence on the epicentral distance
r for low (LB, dashed line), medium (AV, solid line) and high (UB, dashed line) conductivity values σ
0 (
z = 0) at the ground surface according to the model [
60].
From the figure, it can be seen that the ratio Er(ion)/E0 reaches a maximum value at a distance rmax ≅ 10,700 km and is equal to 9.15 × 10⁻⁷ (LB), 1.83 × 10⁻⁶ (AV) and 3.66 × 10⁻⁶ (UB), respectively.
Let us now estimate the maximum value of the expected values of
Er(ion)max in the ionosphere due to a possible seismogenic anomaly of the quasi-static electric field Δ
Ez on the ground surface, which may have occurred ~16 h before the earthquake EQ-2. Let us choose as a reference the lowest limit of the values of
E0, for earthquakes with magnitudes
M from 4.1 to 7. 5 referred to in
Section 3.3 above, i.e.,
E0min = 1 kV/m. Then for the average (AV) values of conductivity σ
0(
z = 0) at the ground surface, taking into account the factor sin
I ≅ sin 74° ≅ 0.96, we get that
Er(ion)max = sin 74° ×
E0min× 1.8 3 × 10
−6 × 1000 [mV/m] = 0.96 × 1000 V/m × 1.83 × 10
−6 (AV) × 1000 ≅ 1.76 mV/m (≅ 0. 88 mV/m and ≅ 3. 51 mV/m for LB and UB, respectively).
Thus, for an EQ-2 earthquake in the ionosphere, |
E⊥|
max∈ [0.88, 3.51] mV/m with an average value of ≅ 1.76 mV/m at an epicentral distance of ≅ 10,700 km. It turns out that at low and medium conductivity values σ
0(
z = 0) at the ground surface according to the [
55] maximum value of |
E⊥|
max ≈ 1–2 mV/m, which is due to the enormous power of this catastrophic earthquake (which had a very large spatial dimension of the preparation zone) and the very favorable geophysical conditions for the penetration of the seismogenic field (deep night and very low solar activity) into the ionosphere.
5. Discussion and Conclusions
The presented model is only part (but a very important part) of the Lithosphere–Atmosphere–Ionosphere Coupling (LAIC) model [
72]. As it is presented in the cited paper, the model considers the chain of several coupling interfaces: lithosphere–atmosphere (crust deformation controlled by
b-parameter and connection with the radon emanation), geochemical interface considering the physics of generation of the thermal anomalies in the atmosphere, and the electromagnetic interface where the near-ground modification of the global electric circuit is mapped at the ionosphere and the magnetosphere. Among the three proposed options of electromagnetic interface, the seismogenic electric field penetration into the ionosphere is described in the present publication. This approach does not use the fantastic values of external fields to obtain the effect in the ionosphere which is criticized in [
28], but also does not fall into the pessimism advocated by the authors of [
28], claiming that electric field penetration in the ionosphere is impossible. We try to conform the theoretical estimations with the results of real experimental measurements of the pre-earthquake electric field in the ionosphere [
73] where the experimentally obtained magnitude of the electric field in the ionosphere exactly coincides with our estimations: 0.91 mV/m.
From another side, we made maximum efforts to obtain as many experimental measurements as possible to formulate the initial and boundary conditions and to consider the pre-earthquake effects in the ionosphere obtained via four different techniques of ionosphere monitoring.
The results of the model calculations show that for an earthquake EQ-1 (M = 8.2), the maximum value of a possible quasi-static seismogenic field |E⊥|max(EQ-1) in the nocturnal ionosphere 1.75 days before the earthquake against the background of low geomagnetic and solar activity lies in the range 0.3–1.2 mV/m with an average maximum value of |E⊥|max ≅ 0.6 mV/m at the epicentral distance rmax ≅ 5100 km.
Similarly, for an earthquake of catastrophic strength EQ-2 (M = 9.2), the maximum value of a possible quasi-static seismogenic field |E⊥|max (EQ-2) in the night ionosphere ~16 h before the shock against the background of low geomagnetic and solar activity lies in the range of 0.88–3.51 mV/m with an average maximum value of |E⊥|max ≅ 1.76 mV/m at the epicentral distance rmax ≅ 10,700 km.
Summarizing, we can say that for the magnitude of earthquakes M = 8–9 under favorable geophysical conditions (night, low solar activity), the maximum value of the seismogenic quasi-static electric field in the ionosphere |E⊥|max tens of hours/units of the day before the earthquake, according to our model estimates, can be 1–2 mV/m. The similarity of the ionospheric effects for both earthquakes was demonstrated via differential ionospheric maps of the critical frequency (for EQ-2) and GIM GPS (for EQ-1).
It should be noted here that the case study we conducted before two powerful earthquakes relies primarily on the study of ionospheric data. However, for the EQ-1 earthquake, the involvement of additional data from the CSES mission made it possible to clearly establish the presence of a geomagnetic field stretched along (from one hemisphere to another) the plasmaspheric ULF-ELF-VLF-duct, which was formed in the vicinity of a geomagnetic field line passing through the epicenter of this earthquake under the influence of a seismogenic electric field that penetrated the ionosphere/plasmasphere. As a result, an anomalous increase of ULF-ELF-VLF wave amplitude was recorded not only over the epicenter of the future earthquake, but also at a point magnetically conjugated with the epicenter position, clearly indicating the formation of such a ductus formed on closed L-shells about two days before the earthquake (27 July 2021).
Conclusions
Based on the analysis of ionospheric data obtained before the powerful earthquakes EQ-1 (M = 8.2) and EQ-2 (M = 9.2), and model representations of the source of the seismogenic quasi-static electric field on the ground surface obtained in the work [Khegai, 2020], estimates of the maximum value of a possible quasi-static seismogenic field perpendicular to geomagnetic lines (|E⊥|max) penetrating into the night-time ionosphere from the earth’s surface (with favorable geophysical conditions - low solar and geomagnetic activity) were made.
It turned out that under favorable geophysical conditions, the value of |E⊥| max (tens of hours/units of the day before the earthquake) for earthquakes with magnitudes M = 8–9 can be 1–2 mV/m. Such values are sufficient to form the plasma-bearing ULF- ELF- VLF-duct, emerging in the vicinity of the geomagnetic field line passing through the epicenter of the earthquake under the influence of a seismogenic electric field that penetrates into the ionosphere/plasmasphere. This leads to an anomalous increase in the ULF-ELF-VLF wave amplitudes captured in the duct, not only over the epicenter of a future earthquake, but also at the point magnetically conjugated to the epicenter of the earthquake, indicating the formation of such a duct, stretching along the geomagnetic field from one hemisphere to another, and emerging at closed L-shells shortly before the earthquake.
The key parameters determining the magnitude of the seismogenic field in the ionosphere are as follows: E0—the magnitude of the seismogenic anomaly at the epicenter of its future earthquake before the earthquake; R0—the radius of the earthquake preparation zone on the ground surface; RE—the scale of field decreases as it moves away from the epicenter; σ0(z = 0 km) is the value of conductivity at the ground surface; σ0(z = 90 km) is the value of conductivity at an altitude of 90 km; σ1 (z = 90 km) is the value of the local conductivity of Pedersen at an altitude of 90 km; and Σ Pav = (ΣP + ΣP* )/2 is the average value of Pedersen’s integral conductivity for two hemispheres. Here, ΣP is the Pedersen integral conductivity for the geographical coordinates of the epicenter of the earthquake for the corresponding date and time UT, and ΣP* is the Pedersen integral conductivity for the magnetically conjugate point.
