Abstract
Atmospheric particulate pollution is one of the most common pollution related issues and poses a serious threat to human health. PM2.5 and PM10 are important indicators of atmospheric particulate pollution currently. Based on the Hybrid Single Particle Lagrangian Integrated Trajectory (HYSPLIT) model, the hourly 72 h backward trajectory of particulate matter in Xi’an from March 2019 to February 2022 was calculated, and the main path of air flow to Xi’an was studied by cluster analysis. Combined with hourly concentration monitoring data of PM2.5 and PM10 at each station, the potential source area of particles in Xi’an was calculated by potential source contribution factor analysis and concentration weighted trajectory analysis. The results show that Xi’an was most polluted in winter, followed by autumn and spring, and cleanest in the summer. The annual average mass concentrations of PM2.5 and PM10 are 48.5 ± 28.7 μg/m3 and 89.2 ± 39.2 μg/m3, respectively, both exceeding the national secondary standard for ambient air quality. On an annual basis, back-trajectory analysis showed that predominantly transport was rapid from the northwest (44%). Transport from the other sectors were 24%, 19%, and 14% from the northeast, southeast, and southwest, respectively, and featured lower windspeeds on average. The potential source areas of particulate matter in Xi’an in the spring are mainly located at the junction of Chongqing, Hunan, and Hubei, and parts of the southeast and north of Sichuan. This study provides context for air quality and atmospheric transport conditions in this region of China.
1. Introduction
Environmental problems are becoming increasingly prominent with the rapid growth of the economy. Atmospheric particulate pollution is one of the most common pollution issues and introduces many hazards [1,2]. Airborne particles, such as PM2.5 and PM10, reduce visibility and increase the incidences of respiratory system diseases. PM2.5, also known as inhalable lung particles, refers to fine particles with a diameter less than 2.5 μm. PM2.5 is the main component of smog and can be suspended in the air for a long time [3,4]. PM10 refers to particles with a diameter less than 10 μm. Because the human nasal cavity can only block particles with a diameter of more than 10 μm, particles with a smaller diameter can directly enter the respiratory tract, which poses a serious threat to health [5,6].
Air quality is not only affected by local pollution but also by the long-distance transportation of pollutants in surrounding cities [7]. Many experts and scholars have conducted a series of relevant studies on the cross regional transport of air pollutants and invented many methods, such as the FLEXPART model [8], Model-3/CMAQ model [9], GEOS-CHEM model [10], etc. As a typical mixed model, HYSPLIT has the advantages of Euler and Lagrange models, which can provide high quality and results consistent with reality. It is widely used in pollution trajectory simulation, pollution source region identification, and quantitative estimation of pollutant concentration [11].
Xi’an is the largest economic, cultural, transportation, and commercial center in northwest China. It suffers from severe particulate matter pollution in winter and spring, which fails to meet the requirements of the local government and citizens [12]. Additionally, Xi’an has experienced more extreme dust weather. Ma et al. [13] pointed out that the concentration of atmospheric particulates in Xi’an City was different in different seasons and affected by the meteorological conditions and pollution in surrounding areas. Jiang et al. [14] found that in 2017, air particulate matter in Xi’an was not only affected by local pollution but also affected by Yan’an, Tongchuan, and Inner Mongolia. Guo et al. [15] conducted a study on the sources of PM2.5 during a heavy pollution period in Xi’an at the end of 2018 and found that Xianyang City was the largest source of contribution from other areas. Past studies on the source of particulate matters in Xi’an City are short-term, and long-term studies on the potential source is relatively rare. Through long-term research, the identification of potential source areas can be more accurate, and some areas with longer distances can also be identified [11]. Using backward trajectory clustering analysis and combining PM2.5 and PM10 monitoring data from Xi’an City, we analyzed the relationship between different atmospheric particulates and the trajectories over a year. Additionally, we investigated seasonality and the potential main sources of particulates through PSCF and CWT analysis. This work provides a reference for improving the ecological environment and strengthening the prevention and control of air pollution.
2. Materials and Methods
2.1. Study Area
Xi’an is located on the Guanzhong Plain in south-central Shaanxi Province, between 107°40′ and 109°49′ east longitude and between 33°42′ and 34°45′ north latitude. This area governs 11 districts and 2 counties with a jurisdiction of 204 km from east to west and 116 km from north to south. The total area is 10,108 square kilometers and includes an urban area of 3582 square kilometers (Figure 1). Xi’an City is located in the transition zone of a humid climate from the southeast coast to an arid climate in the northwest inland area. Influenced by topographic factors, the site has a temperate semi-humid monsoon climate with four distinct seasons.
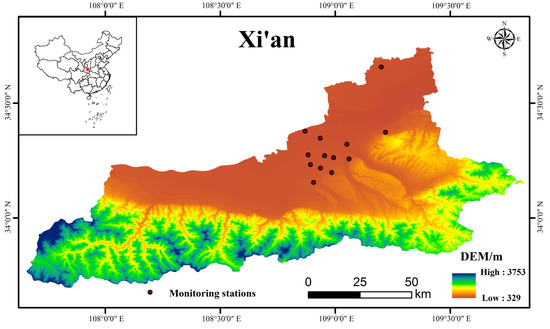
Figure 1.
Study area overview.
2.2. Data Source
The air pollution data, including PM2.5 and PM10, came from the China Air Quality Online Monitoring and Analysis Platform (https://www.aqistudy.cn/) (accessed on 15 May 2022) monitoring stations. Data from 1 March 2019 to 28 February 2022 were used in the analysis. There are 13 automatic monitoring stations for environmental air quality at the China Environmental Monitoring Station in Xi’an City, including the High-Voltage Switch Plant, Xingqing Community, Fangzhicheng, Xiaozhai, People’s Stadium, High-tech West District, Economic Development Zone, Chang’an District, Yanliang District, Lintong District, Caotan, Qujiang Cultural Industry Group, and Guangyuntan Station. We used the hourly monitoring average values of all stations. Missing values have been removed. The presence of some missing values has little impact on the results. Meteorological data for the backward trajectory model came from the re-analysis data of Global Data Assimilation System (GDAS) provided by United States National Centers for Environmental Prediction (https://www.weather.gov/ncep/) (accessed on 10 June 2022). The spatial resolution is 1° × 1°, and the height is divided into 23 layers, including air pressure and horizontal and vertical wind speed.
2.3. Methods
2.3.1. Hybrid Single-Particle Lagrangian Integrated Trajectory (HYSPLIT) Model
The backward trajectory model is built based on Meteoinfo software and the TrajStat plug-in. The HYSPLIT trajectory model is one of the most widely used atmospheric transport and diffusion models in atmospheric science. It was jointly developed by the National Oceanic and Atmospheric Administration (NOAA) and the Australian Bureau of Meteorology (BOM) and is a professional model used to calculate air transport, diffusion, and settlement [16,17,18,19]. A variety of statistical and analytical methods based on the HYSPLIT backward trajectory model have been gradually developed including trajectory clustering analysis, the potential source contribution function method (PSCF), and concentration weighted trajectory analysis (CWT) [20]. These methods have been used in grid analysis and have successfully determined air flow trajectories and pollutant source areas. Meteoinfo is a free meteorological data display and analysis software with some basic GIS functions and was developed by Chinese meteorologists [21]. The TrajStat plug-in integrates HYSPLIT model and can be used to calculate air flow trajectory and complete corresponding analysis work [22]. Taking Xi’an City (34.16° N, 108.90° E) as the trajectory receiving point, the paper calculated hourly backward air flow trajectory in 72 h during the study period.
2.3.2. Trajectory Clustering
Clustering is a process of classifying data into different classes or clusters. In clustering analysis, backward trajectories can be classified according to the direction of trajectory source and trajectory length for statistical analysis [23]. TrajStat provides two clustering methods: Euclidean clustering and angular clustering. Euclidean clustering, mainly based on the length of trajectories, clusters those with similar lengths into a class. Angular clustering, based on the source direction of trajectories, clusters those from the same direction into a class [22]. This paper focuses on the direction of air flow source, so the angular clustering method is adopted. Because the direction of air flow source is dependent on the season, the air flow trajectories are clustered according to seasons: from March to May in spring, from June to August in summer, from September to November in autumn, and from December to February in winter.
2.3.3. Potential Source Contribution Function (PSCF) Method
PSCF analysis was used to calculate the potential source areas of pollutants based on air flow trajectories [24,25]. First, values of the pollutants were introduced into each trajectory; a standard value of pollutants was set; and the trajectory exceeding the standard value is the pollution trajectory. Next, the research area was divided into grids with the same size, and each grid was analyzed separately. PSCF analysis is based on a conditional probability, i.e., the ratio of the number of pollution trajectories (mij) passing through the grid (i, j) to the total number of trajectories (nij) passing through the grid. The higher the PSCF value, the greater the impact on the potential pollution in the receiving point.
The formula is as follows:
When the grid is crossed by a small number of trajectories, it was considered less likely to be a potential source area. Thus, the weighted factor Wij was introduced and is determined according to the total number of trajectories in each grid [26,27,28]. Therefore, the weighted potential source contribution function (WPSCF) is expressed as:
where nij is the total number of trajectories in the grid (i, j); Wij is the weighed factor in the grid (i, j).
The secondary standard value of Ambient Air Quality Standards (GB 3095-2012) is taken as the standard for judging the pollution trajectory [29], with PM2.5 being 75 μg/m3 and PM10 being 150 μg/m3. When the air flow reaches Xi’an City, if the concentration of particles exceeds the standard, its corresponding trajectory is the pollution trajectory; otherwise, it is the clean trajectory.
2.3.4. Concentration-Weight Trajectory (CWT) Method
PSCF analysis has certain limitations since it is based on a conditional probability and can only reflect the proportion of pollution trajectories. Therefore, we introduced concentration weighted trajectory (CWT) analysis [30,31,32]. According to the time of pollution trajectory passing through the grids, the weighted concentration trajectory of air flow in each grid is calculated, and the result can demonstrate the pollution degree of the research area.
where CWTij is the average weighted concentration on the grid (i, j); l is the trajectory; M is the total number of trajectories; Cl is the concentration of trajectory l; Cij is the corresponding average mass concentration when the trajectory l passes through the grid (i, j); τijl is the time that the trajectory l stays in the grid (i, j).
The same weighted factor Wij, as that in the PSCF analysis, can be introduced into CWT analysis to reduce the uncertainty of the results. Therefore, the weighted concentration-weight trajectory (WCWT) is expressed as:
3. Results and Discussion
3.1. Overview of Air Particulate Matter in Xi’an
From 2019 to 2022, the concentration of atmospheric particulate matters in Xi’an City showed an insignificant downward trend (Figure 2). With the exception of February 2020, the average mass concentration of PM10 was higher than PM2.5. The maximum monthly average mass concentration of PM10 appeared in March 2021, with a concentration of 205.3 μg/m3. The maximum monthly mean mass concentration of PM2.5 was 135.6 μg/m3 in January 2020. The variation of PM10 concentration fluctuates greatly, and the difference between the maximum and minimum values is more than 150. The concentration changed in PM2.5 was relatively flat. PM2.5 and PM10 have the same trend of change, reaching the highest value in January or March and the lowest value in August or September each year. The minimum values of PM2.5 and PM10 occur in August or September each year.
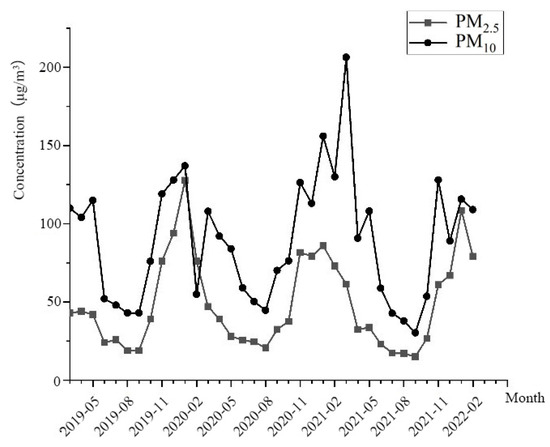
Figure 2.
Monthly average concentrations of PM2.5 and PM10 from 2019 to 2022.
In terms of seasons, the concentrations of PM2.5 and PM10 varied consistently and are lowest in summer and highest in winter (Figure 3). The concentrations of PM2.5 in spring and autumn are similar, and the concentration of PM10 in spring is higher than in autumn. For the most polluted winter and spring, the concentrations of PM2.5 and PM10 in winter are 86.9 ± 18.1 μg/m3 and 112.7 ± 27.4 μg/m3; the concentration of PM2.5 and PM10 in spring is 60.3 ± 24.7 μg/m3 and 112.0 ± 34.48 μg/m3. The concentration of PM2.5 in spring and winter is 2.8 and 2.4 times higher than that in summer, and the concentration of PM10 is 2.4 and 4.0 times higher than that in summer. The annual average mass concentration of PM2.5 is 48.5 ± 28.7 μg/m3, about 38.6% higher than the national average secondary concentration limit of PM2.5 (35 μg/m3). The number of days with the average concentration exceeding the standard is 180 days, and the over-standard rate is 16.7%. The degree of PM10 pollution is severe with an annual average mass concentration of 115.09 ± 39.2 μg/m3, which is about 53.5% higher than the national average secondary concentration limit of PM10 (70 μg/m3). The number of days with the average concentration exceeding the standard is 140 days, and the over-standard rate is 13.0%. Summer is the high occurrence period of severe convective weather, which is more conducive to the diffusion of air pollutants, and precipitation will remove part of the air particles to a certain extent.
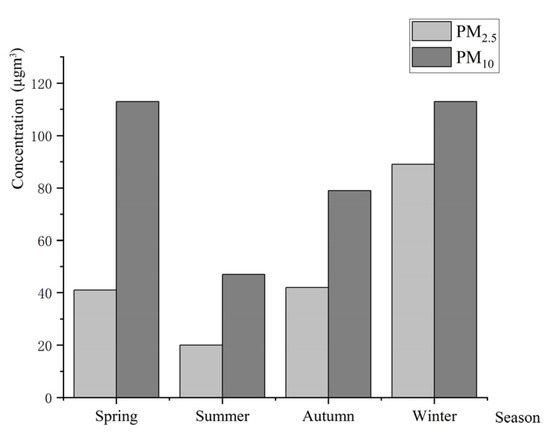
Figure 3.
Average concentrations of PM2.5 and PM10 in the four seasons from 2019 to 2022.
Particulate matter concentrations and meteorological conditions are highly linked as has been noted in many studies [33,34,35]. Summer is a period of high incidence of severe convective weather, which is more conducive to the diffusion of air pollutants, and precipitation will to some extent remove some air particulate matter. In Xi’an City, inversion occurs all year round; that is, the temperature rises with the increase of altitude. The warmer and lighter air flow rises above the colder and heavier air flow, which forms a stable atmospheric stratification and weakens the vertical exchange of air flow [36,37]. Inverse temperature is not conducive to the diffusion of water vapor and smoke in the air, which further aggravates air pollution. The phenomenon of inversion in Xi’an City is the most common in winter, followed by autumn and spring, and the least in summer [38].
3.2. Linear Relationship between PM2.5 and PM10
By analyzing the correlation between PM2.5 and PM10, we can roughly understand their homology. With the change of seasons, the correlations between PM2.5 and PM10 does not change significantly (Figure 4). The correlation between summer and autumn is above 0.7, and the correlation between spring and winter is above 0.6. From spring to winter, the value of PM2.5/PM10 increases. In spring and summer, the contribution of PM2.5 to air particulate matter pollution cases was low, and PM10 was the main contributor. In autumn and winter, the proportion of PM2.5 in air pollution increases gradually. PM2.5/PM10 can be used to initially identify the sources of atmospheric particles with different diameters. When the diameter of PM2.5/PM10 is less than 0.2, it is considered as being influenced by natural dust. When the value of PM2.5/PM10 is greater than 0.6, it is considered as being influenced by man-made pollution [39]. Pollution intensifies in the spring because of increased sandstorm frequency during springtime in Xi’an City [40]. Ordinary sandstorms mainly affect the concentration of particles with a diameter below 10 μm. PM2.5 and PM10 mainly sourced from dust, industry, coal, and vehicle exhaust. In winter, the ratio of PM2.5/PM10 is greater than 0.6, indicating that human sources have a great influence. Compared with PM10, the mass concentration of PM2.5 is more susceptible to secondary sources. In winter, Xi’an City uses coal as the main heating energy, so a large number of organic particles and inorganic salts produced in the incomplete combustion of coal are one of the important sources of PM2.5 [41].
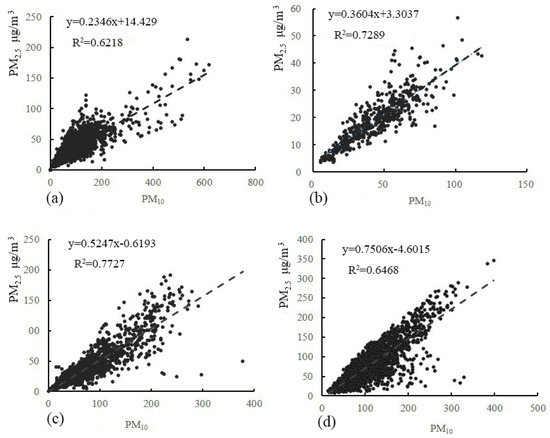
Figure 4.
Linear fitting of the relationship between PM10 and PM2.5 mass concentration in Xi’an with different seasons, spring (a), summer (b), autumn (c) and winter (d).
3.3. Backward Trajectory Distribution Characteristics
The backward trajectory over 72 h in Xi’an City from March 2019 to February 2022 was simulated hourly which resulted in a total of 26,304 trajectories (Figure 5). After seasonal clustering analysis, the trajectories are clustered into four categories in spring, five categories in summer, four categories in autumn, and four categories in winter (Table 1). In 2021, the backward air flow trajectories are clustered into five categories. Annually, the air flow from the northwest accounts for the highest proportion, reaching 43.98% in total, and moves fast over long distances. The air flow from the northeast, southeast, and south moves slowly over short distances. The highest concentrations of PM2.5 and PM10 in the northwest air flow pass through Jiuquan City, Xining City, Lanzhou City, Tianshui City, and Baoji City. The mass concentrations of PM2.5 and PM10 in the air flow from the southeast from Xiangyang City, Shiyan City, and Shangluo City are low and similar to the south passing through northern Chongqing City and Ankang City. The mass concentration of PM2.5 in the air flow from the northwest passing through Alxa League, Yinchuan City, Yan’an City, and Tongchuan City is the lowest.
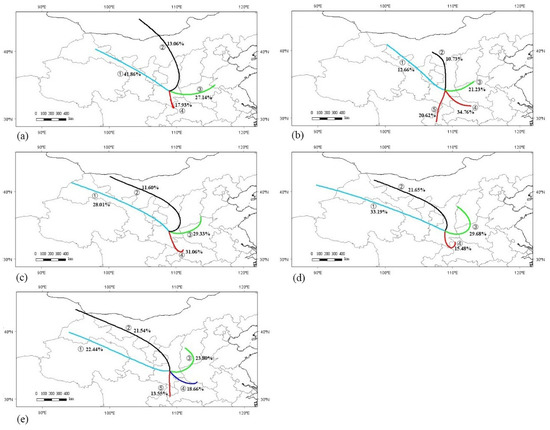
Figure 5.
Clustering of annual and seasonal trajectories in Xi’an, with different periods, spring (a), summer (b), autumn (c), winter (d) and all year (e).

Table 1.
Statistical analysis of PM2.5 and PM10 mass concentrations in different tracks of Xi’an in four seasons and all year.
The air flow arriving in Xi’an City in the spring is divided into four categories and the flow through the northwest accounts for the largest proportion, reaching 41.9%. The air flow from the east ranks second, accounting for 27.1%. The air flow from the south and north accounts for 17.9% and 13.1%, respectively. The concentration of PM10 in the air flow from the south, passing through Ankang City and Shangluo City, is high and similar to the northwest, passing through Jiuquan City, Zhangye City, Guyuan City, and Baoji City. The concentration of PM2.5 in air flow from the south is the highest among the four categories.
In summer, air directions vary and are grouped into five categories. The southeast air flow from Xiangyang City, Shiyan City, and Shangluo City accounts for the largest proportion, reaching 34.8%. The proportion of air flow from the north passing through Ordos City, Yan’an City, and Tongchuan City accounts for the smallest proportion, reaching 10.7%. The concentration of PM10 in the northwest air flow from Alxa League, Guyuan City, and Baoji City which moves the fastest is the highest. The concentration of PM10 in the air flow from the north is the lowest. The concentration of PM2.5 in air flow from all directions is similiar and low.
The air flow in autumn is divided into four categories. The northwest accounts for 39.6%. The southeast accounts for 31.1%. The east air flow accounts for 29.3%. The concentrations of PM2.5 and PM10 in the air flow from the southeast passing through Shiyan City, Ankang City, and Shangluo City are much higher than other clusters.
The air flow in winter is divided into four categories. The northwest accounts for 54.84% in total with the farthest movement distance. The air flow from the south accounts for the smallest proportion at 15.5%, with the shortest movement distance. The concentrations of PM2.5 and PM10 in the south air flow from Shiyan City and Ankang City are the highest. The concentrations of PM2.5 and PM10 in the air flow from the north, passing through Alxa League, Yinchuan City, and Yan’an City, are the lowest.
3.4. PSCF Analyses
In the area where the trajectory passes, a grid of 0.5° × 0.5° is established according to the latitude and longitude. The potential pollution sources of PM2.5 and PM10 in Xi’an City in spring and winter are analyzed through the PSCF method. The results are shown in the Figure 6. The greater the WPSCF value, the greater the contribution of this area to the air pollution concentration in Xi’an City. Generally, the area with a WPSCF value higher than 0.5 is the main potential source area. This study analyzed the spring and winter when particulate pollution is severe.
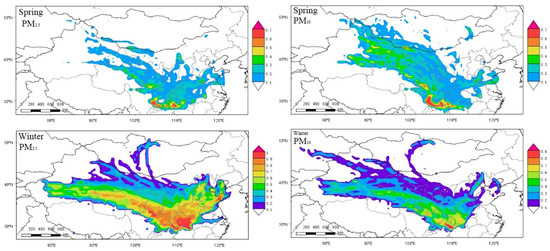
Figure 6.
WPSCF analysis results of particulate matter Xi’an.
The potential source areas of PM2.5 in spring are mainly scattered within a small area of south Shaanxi Province. In addition to Xiangxi Tujia and Miao Autonomous Prefecture, Enshi City and Youyang City at the junction of Hunan Province, Hubei Province, and Chongqing City, some areas are also distributed in the junction of southeastern Sichuan City and Chongqing City. They are far away from Xi’an City, which indicates that the contribution level from local pollution is low. In spring, the potential source areas of PM10 are large. In addition to the potential source areas of PM2.5, there a few areas with WPSCF values higher than 0.5 in southeastern Xinjiang.
The potential source areas of PM2.5 in Xi’an City in winter are the largest in a face pattern. The WPSCF value in central and southern Hubei Province is close to 1. The areas with WPSCF value higher than 0.7 are widely distributed in the south of Shaanxi Province, the west of Henan Province, Hubei Province, Chongqing City, and the junction of Sichuan City and Gansu City. The areas with WPSCF values higher than 0.5 include northern Qinghai Province, Henan Province, Shandong Province, southern Shanxi Province, and central Hebei Province. The potential source areas of PM2.5 in winter cover most of the central part of the country. The potential source areas of PM10 in winter are mainly distributed in Chongqing City, central and southern Hubei Province, and the junction of Hubei Province, Hunan Province, and Chongqing City. The WPSCF value at the junction of the three places is higher than 0.7; thus, the area makes a great contribution to pollution in Xi’an City.
3.5. CWT Analyses
The results of the weighted trajectory analysis of PM2.5 and PM10 concentrations in Xi’an City in spring and winter are shown in the Figure 7. WPSCF and WCWT analysis results of PM2.5 and PM10 in Xi’an City have good consistency, but the ranges of potential source areas are slightly different. In addition to WPSCF results, the potential source areas of PM2.5 in spring are also distributed at the junction of Sichuan City and Gansu City, parts of the western Henan Province, and central Inner Mongolia. In spring, the main contribution source areas of PM10 are mainly distributed in the northwest of Xi’an City, including northern Sichuan Province, northern Qinghai Province, and central Gansu Province.
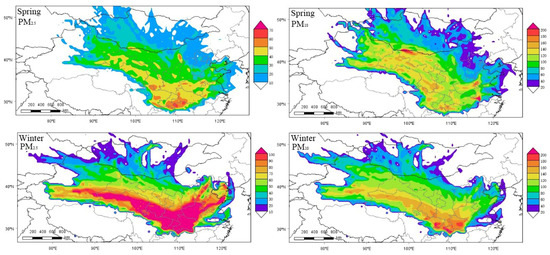
Figure 7.
WCWT analysis results of particulate matter in Xi’an.
The distribution range of potential source areas of PM2.5 in winter in Xi’an City is the largest. The figure shows that areas with a WCWT value above 90 cover many provinces and cities, from eastern Sichuan Province to northern Hunan Province, all of Hubei Province and Henan Province, central and southern Shaanxi Province and Shanxi Province, southern Hebei Province, northeastern Qinghai Province, and southern Gansu Province. The areas with WCWT value above 70 cover all the areas of Shaanxi Province, Gansu Province, Ningxia Province, Shanxi Province, Hebei Province, and Shandong Province. The potential source areas of PM10 in Xi’an City are mainly distributed in the south of Xi’an City. The areas with a WCWT value greater than 200 include southeastern Chongqing City and central and western Hubei Province. The areas with WCWT value greater than 150 μm in the south of Xi’an City are located in western Hubei Province, central and southern Chongqing City, northwestern Sichuan Province, and some in the west of Xi’an City are distributed in a long and narrow belt along southern Gansu Province and northwestern Qinghai Province.
4. Conclusions
Based on the hourly observation data of PM2.5 and PM10 in Xi’an City from March 2019 to February 2022, this paper analyzed trajectories of air flow and the potential source areas of particulate pollution through cluster analysis, PSCF, and CWT methods. The air quality in Xi’an City is poor in the spring and winter. The ranking of air particulate pollution in four seasons is winter > spring > autumn > summer. From 2019 to 2021, the average concentrations of PM2.5 and PM10 are 48.5 ± 28.7 μg/m3 and 115.09 ± 39.2 μg/m3, which exceeds the national secondary standards by 38.6% and 53.5%, respectively. Seasonal and spatial changes are evident in the direction of air flow source in Xi’an City. In spring and winter, the air flow mainly comes from the northwest, accounting for more than 50%. In autumn, the air flow from the northwest and northeast accounts for over 30%. In summer, the directions of air flow source are divergent, and the proportion of air flow in each direction is average. Compared with other directions, the air flow from the northwest moves faster and longer and passes through a wider range.
The potential source areas of particulate pollution in winter in Xi’an City are larger than in the spring. The potential source areas of PM2.5 in winter are the largest, covering eastern Sichuan Province, central and western Hubei Province, northern Hunan Province, Shaanxi Province, and central and southern Shanxi Province. The potential source areas of PM10 are small and mainly distributed in the southeast of Chongqing City and its junction with Hubei Province. In spring, the potential source areas of particulate matter are distributed around Xi’an City and neighboring provinces and cities. Chongqing City and northern Hunan Province are the main potential source areas of PM2.5. The potential source areas of PM10 are scattered in northern Gansu Province and northeastern Qinghai Province.
Xi’an City is located in the south of Guanzhong Basin. Guanzhong Basin, located in the south of the Loess Plateau, is a basin plain that narrows and closes in the west and opens to the east. The Qinling Mountains are located about 60 km south of Xi’an City, and the ridge is 200 to 2800 m above sea level. Because of the topography, the diffusion conditions in the Guanzhong area are relatively poor, and the polluted air flow from the northwest or north is blocked by the Qinling Mountains. Meanwhile, the northwest airflow turns to east wind after crossing the border [42,43,44]. A large number of loess-covered surfaces in the Mu Us Sandland of northern Shaanxi Province, Tengger Desert and Badain Jaran Desert in western Inner Mongolia, and Kumtag Desert in eastern Xinjiang all supply abundant particulate matter to Xi’an City. Strong northwest and north winds blow out from the northwest-southeast potential source areas of particulate matter.
The results of this paper can provide suggestions for atmospheric control in Xi’an City. However, results are limited as the accuracy of trajectories with long movement distance may be skewed and are only based on the monitoring data of Xi’an City. In a further study, we will consider using monitoring data from more areas to improve the accuracy and further verify the results through experimental analysis.
Author Contributions
B.Z., B.H. and P.L. conceived the main idea of the paper, B.Z. and B.H. wrote the manuscript, T.L. and Y.J. revised the abstract, C.L. revised the figure, Y.M. revised the table, and all authors contributed to improving the paper. All authors have read and agreed to the published version of the manuscript.
Funding
This research was funded by [National Natural Science Foundation of China] grant number [42007070 and U2040208], [Key Laboratory Project of Shaanxi Provincial Education Department] grant number [20JS100] and [Shaanxi Province Innovation Capability Support Plan in 2022] grant number [2022KJXX-86].
Institutional Review Board Statement
Not applicable.
Informed Consent Statement
Not applicable.
Data Availability Statement
Not applicable.
Acknowledgments
We would like to thank Joseph Elliot at the University of Kansas for her assistance with English language and grammatical editing of the manuscript.
Conflicts of Interest
The authors declare no conflict of interest.
References
- Liu, J.; Kiesewetter, G.; Klimont, Z.; Cofala, J.; Heyes, C.; Schopp, W.; Zhu, T.; Cao, G.Y.; Sanabria, A.G.; Sander, R.; et al. Mitigation pathways of air pollution from residential emissions in the Beijing-Tianjin-Hebei region in China. Environ. Int. 2019, 125, 236–244. [Google Scholar] [CrossRef] [PubMed]
- Timonen, K.L.; Vanninen, E.; Hartog, J.D.; Ibald-Mulli, A.; Brunekreef, B.; Gold, D.R.; Heinrich, J.; Hoek, G.; Lanki, T.; Peters, A.; et al. Effects of ultrafine and fine particulate and gaseous air pollution on cardiac autonomic control in subjects with coronary artery disease: The ULTRA study. J. Expo. Sci. Environ. Epidemiol. 2006, 16, 332–341. [Google Scholar] [CrossRef]
- Hong, H.; Wan, X.Y.; Chen, T.T.; Zou, C.W. Update on the toxicological effects and mechanism of PM2.5. J. Earth Environ. 2020, 11, 125–142. (In Chinese) [Google Scholar]
- Cheriyan, D.; Hyun, K.Y.; Jaegoo, H.; Choi, J.H. Assessing the distributional characteristics of PM10, PM2.5, and PM1 exposure profile produced and propagated from a construction activity. J. Clean. Prod. 2020, 276, 124335. [Google Scholar] [CrossRef]
- Hoek, G.; Pattenden, S.; Willers, S.; Antova, T.; Fabianova, E.; Braun-Fahrlander, C.; Forastiere, F.; Gehring, U.; Luttmann-Gibson, H.; Grize, L.; et al. PM10, and children’s respiratory symptoms and lung function in the PATY study. Eur. Respir. J. 2012, 40, 538–547. [Google Scholar] [CrossRef] [PubMed]
- Xie, W.; You, J.; Zhi, C.X.; Li, L. The toxicity of ambient fine particulate matter (PM2.5) to vascular endothelial cells. J. Appl. Toxicol. 2021, 41, 713–723. [Google Scholar] [CrossRef] [PubMed]
- Wang, G.C.; Wang, D.Q.; Chen, Z.L. Characteristics and transportation pathways and potential sources of a severe PM2.5 episodes during winter in Beijing. China Environ. Sci. 2016, 36, 1931–1937. (In Chinese) [Google Scholar]
- Owen, R.C.; Cooper, O.R.; Stohl, A.; Honrath, R.E. An analysis of the mechanisms of North American pollutant transport to the central North Atlantic lower free troposphere. J. Geophys. Res. Atmos. 2006, 111, D23S58. [Google Scholar] [CrossRef]
- Wang, L.L.; Wang, Y.S.; Sun, Y.; Li, Y.Y. Using Synoptic Classification and Trajectory Analysis to Assess Air Quality during the Winter Heating Period in Urumqi, China. Adv. Atmos. Sci. 2012, 29, 307–319. (In Chinese) [Google Scholar] [CrossRef]
- Park, R.J. Natural and transboundary pollution influences on sulfate-nitrate-ammonium aerosols in the United States: Implications for policy. J. Geophys. Res. Atmos. 2003, 109, D15204. [Google Scholar] [CrossRef]
- Shanavas, A.K.; Zhou, C.L.; Menon, R.; Hopke, P.K. PM10 source identification using the trajectory based potential source apportionment (TraPSA) toolkit at Kochi, India. Atmos. Pollut. Res. 2020, 11, 1535–1542. [Google Scholar] [CrossRef]
- Sun, B.; Guo, L.X.; Wang, Q.; Liu, Y.F. The Satisfaction Survey of Air Quality in Xi’an City Based on the Perspective of Residents. J. Xianyang Norm. Univ. 2021, 36, 61–63. (In Chinese) [Google Scholar]
- Ma, B.B.; Wang, L.J.; Tao, W.D.; Liu, M.M.; Zhang, P.Q.; Zhang, S.W.; Li, X.P.; Lu, X.W. Phthalate esters in atmospheric PM2.5 and PM10 in the semi-arid city of Xi’an, Northwest China: Pollution characteristics, sources, health risks, and relationships with meteorological factors. Chemosphere 2020, 242, 125226. [Google Scholar] [CrossRef] [PubMed]
- Jiang, H.; Duan, K.Q. Analysis of seasonal primary pollutants and their potential source areas of Xi’an in 2017 based on HYSPLIT model. J. Lanzhou Univ. (Nat. Sci.) 2020, 56, 243–252. (In Chinese) [Google Scholar]
- Guo, Q.Y.; Yang, X.C.; Wu, Q.Z.; Du, M.M.; Zhang, Y.M. An analysis of PM2.5 regional sources from heavy pollution in the winter of Xi’an based on numerical simulation. Acta Sci. Circumstantiae 2020, 40, 3103–3111. [Google Scholar]
- Su, L.; Yuan, Z.B.; Fung, J.C.H.; Lau, A.K.H. A comparison of HYSPLIT backward trajectories generated from two GDAS datasets. Sci. Total Environ. 2015, 506, 527–537. [Google Scholar] [CrossRef]
- Cui, L.K.; Song, X.Q.; Zhong, G.Q. Comparative Analysis of Three Methods for HYSPLIT Atmospheric Trajectories Clustering. Atmosphere 2021, 12, 698. [Google Scholar] [CrossRef]
- Sha, X.Z.; Chu, R.H.; Li, M.; Xiao, Y.; Ding, J.F.; Feng, L.S. Transmission of Seeding Agent for Aircraft Precipitation Enhancement Based on the HYSPLIT Model. Atmosphere 2022, 13, 1508. [Google Scholar] [CrossRef]
- Xu, Y.N.; Chen, C.; Li, Q.K.; Wang, J.Y. Analysis of PM2.5 and PM10 Pollution Characteristics during Heating Period in Shenyang. J. Eng. Therm. Energy Power 2017, 32, 121–125. [Google Scholar]
- Qor-el-aine, A.; Beres, A.; Geczi, G. Dust storm simulation over the Sahara Desert (Moroccan and Mauritanian regions) using HYSPLIT. Atmos. Sci. Lett. 2022, 23, e1076. [Google Scholar] [CrossRef]
- Wang, Y.Q. MeteoInfo: GIS software for meteorological data visualization and analysis. Meteorol. Appl. 2014, 21, 360–368. [Google Scholar] [CrossRef]
- Wang, Y.Q.; Zhang, X.Y.; Draxler, R.R. TrajStat: GIS-based software that uses various trajectory statistical analysis methods to identify potential sources from long-term air pollution measurement data. Environ. Model. Softw. 2009, 24, 938–939. [Google Scholar] [CrossRef]
- Wang, X.Q.; Zhang, T.S.; Xiang, Y.; Lv, L.H.; Fan, G.Q.; Ou, J.P. Investigation of atmospheric ozone during summer and autumn in Guangdong Province with a lidar network. Sci. Total Environ. 2020, 751, 141740. [Google Scholar] [CrossRef] [PubMed]
- Lowell, L.A.; William, C.M.; Willy, Z.S. A residence time probability analysis of sulfur concentrations at grand Canyon National Park. Atmos. Environ. 1985, 19, 1263–1270. [Google Scholar]
- Dimitriou, K.; Kassomenos, P. Combining AOT, Angstrom Exponent and PM concentration data, with PSCF model, to distinguish fine and coarse aerosol intrusions in Southern France. Atmos. Res. 2016, 172, 74–82. [Google Scholar] [CrossRef]
- Zachary, M.M.; Lun, Y.; Zacharia, M. Application of PSCF and CWT to Identify Potential Sources of Aerosol Optical Depth in ICIPE Mbita. Open Access Libr. J. 2018, 5, 1–12. [Google Scholar] [CrossRef]
- Mcgowan, H.; Clark, A. Identification of dust transport pathways from Lake Eyre, Australia using Hysplit. Atmos. Environ. 2008, 42, 6915–6925. [Google Scholar] [CrossRef]
- Polissar, A.V.; Hopke, P.K.; Harris, J.M. Source Regions for Atmospheric Aerosol Measured at Barrow, Alaska. Environ. Sci. Technol. 2001, 35, 4214–4226. [Google Scholar] [CrossRef]
- Wang, Y.Q.; Zhang, X.Y.; Arimoto, R. The contribution from distant dust sources to the atmospheric particulate matter loadings at XiAn, China during spring. Sci. Total Environ. 2006, 368, 875–883. [Google Scholar] [CrossRef]
- Hopke, P.K.; Ning, G.; Cheng, M.D. Combining chemical and meteorological data to infer source areas of airborne pollutants. Chemom. Intell. Lab. Syst. 1993, 19, 187–199. [Google Scholar] [CrossRef]
- Hsu, Y.K.; Holsen, T.M.; Hopke, P.K. Comparison of hybrid receptor models to locate PCB sources in Chicago. Atmos. Environ. 2003, 37, 545–562. [Google Scholar] [CrossRef]
- Stohl, A. Trajectory statistics—A new method to establish source-receptor relationships of air pollutants and its application to the transport of particulate sulfate in Europe. Atmos. Environ. 1996, 30, 579–587. [Google Scholar] [CrossRef]
- Kumar, R.; Lee, J.A.; Delle Monache, L.; Alessandrini, S. Effect of Meteorological Variability on Fine Particulate Matter Simulations Over the Contiguous United States. J. Geophys. Res. Atmos. 2019, 124, 5669–5694. [Google Scholar] [CrossRef]
- Rabha, S.; Saikia, B.K.; Singh, G.K.; Gupta, T. Meteorological Influence and Chemical Compositions of Atmospheric Particulate Matters in an Indian Urban Area. ACS Earth Space Chem. 2021, 5, 1686–1694. [Google Scholar] [CrossRef]
- Mcnider, R.T.; Pour-Biazar, A. Meteorological modeling relevant to mesoscale and regional air quality applications: A review. J. Air Waste Manag. Assoc. 2020, 70, 2–43. [Google Scholar] [CrossRef]
- Reynolds, D.R.; Chapman, J.W.; Edwards, A.S.; Smith, A.D.; Wood, C.R.; Barlow, J.F.; Woiwod, I.P. Radar studies of the vertical distribution of insects migrating over southern Britain: The influence of temperature inversions on nocturnal layer concentrations. Bull. Entomol. Res. 2005, 95, 259–274. [Google Scholar] [CrossRef]
- Li, J.; Chen, H.B.; Li, Z.Q.; Wang, P.C.; Fan, X.H.; He, W.Y.; Zhang, J.Q. Analysis of Low-level Temperature Inversions and Their Effects on Aerosols in the Lower Atmosphere. Adv. Atmos. Sci. 2019, 36, 1235–1250. [Google Scholar] [CrossRef]
- Wang, Y.F.; Fu, Q.; Zhao, M.N.; Gao, F.; Di, H.G.; Song, Y.H.; Hua, D.X. A UV multifunctional Raman lidar system for the observation and analysis of atmospheric temperature, humidity, aerosols and their conveying characteristics over Xi’an. J. Quant. Spectrosc. Radiat. Transf. 2017, 205, 114–126. [Google Scholar] [CrossRef]
- Choi, H. Comparison of PM1, PM2.5, PM10 Concentrations in a Mountainous Coastal City, Gangneung Before and After the Yellow Dust Event in Spring. J. Environ. Sci. Int. 2008, 17, 633–645. [Google Scholar]
- Hu, Y.J.; Jiang, N. Influence of dust storm on atmospheric environment quality in Xi’an, China. J. Desert Res. 2020, 40, 53–60. (In Chinese) [Google Scholar]
- Tan, J.H.; Zhang, L.M.; Zhou, X.M.; Duan, J.C.; Li, Y.; Hu, J.N.; He, K.B. Chemical characteristics and source apportionment of PM2.5 in Lanzhou, China. Sci. Total Environ. 2017, 601–602, 1743–1752. [Google Scholar] [CrossRef] [PubMed]
- Wang, L.; Meng, R.L.; Cao, L.; Gao, F.; Chen, H.; Li, Y.H.; Zhang, J.Y.; Yan, D.J.; Liu, X.; Niu, T.T.; et al. Influence of dust events on air guality of shaanxi province from 2016 to 2020. J. Desert Res. 2022, 42, 130–138. (In Chinese) [Google Scholar]
- Wei, N.; Wang, N.L.; Huang, X.; Liu, P.P.; Chen, L. The effects of terrain and atmospheric dynamics on cold season heavy haze in the Guanzhong Basin of China. Atmos. Pollut. Res. 2020, 11, 1805–1819. [Google Scholar] [CrossRef]
- Zhao, T.; Bai, H.Y.; Yuan, Y.; Deng, C.H.; Qi, G.Z.; Zhai, D.P. Spatio-temporal differentiation of climate warming (1959–2016) in the middle Qinling Mountains of China. J. Geogr. Sci. 2020, 30, 657–668. [Google Scholar] [CrossRef]
Disclaimer/Publisher’s Note: The statements, opinions and data contained in all publications are solely those of the individual author(s) and contributor(s) and not of MDPI and/or the editor(s). MDPI and/or the editor(s) disclaim responsibility for any injury to people or property resulting from any ideas, methods, instructions or products referred to in the content. |
© 2023 by the authors. Licensee MDPI, Basel, Switzerland. This article is an open access article distributed under the terms and conditions of the Creative Commons Attribution (CC BY) license (https://creativecommons.org/licenses/by/4.0/).