Article

Brake Particle PN and PM Emissions of a Hybrid Light Duty Vehicle Measured on the Chassis Dynamometer

by
Panayotis Dimopoulos Eggenschwiler
*,
Daniel Schreiber
and
Joel Habersatter
Empa, Swiss Federal Laboratories for Materials Science and Technology, Automotive Powertrain Technologies Laboratory, CH-8600 Dübendorf, Switzerland
*
Author to whom correspondence should be addressed.
Atmosphere 2023, 14(5), 784; https://doi.org/10.3390/atmos14050784
Submission received: 31 March 2023 / Revised: 18 April 2023 / Accepted: 21 April 2023 / Published: 26 April 2023
(This article belongs to the Special Issue Traffic Related Emission and Control)

Abstract

:
Brake particle emissions number (PN) and mass (PM) of a light-duty hybrid-electric vehicle have been assessed under realistic driving patterns on a chassis dynamometer. Therefore, the front-right disc brake was enclosed in a specifically designed casing featuring controlled high scavenging air ventilation. The WLTC cycle was chosen for most measurements. Different scavenging flow rates have been tested assessing their influence on the measured particles as well as on the temperature of the braking friction partners. Particle transport efficiencies have been assessed revealing scavenging flow rates with losses below 10%. During the performed cycle, most brake particle emissions occurred during braking. There were also isolated emission peaks during periods with no brakes in use, especially during vehicle accelerations. Sequential WLTC cycles showed a continuous decrease in the measured PN and PM emissions; however, size-number and size-mass distributions have been very similar. The measured PN emission factors (>23 nm) at the right front wheel over the WLTC cycle lie at 5.0 × 10¹⁰ 1/km, whereas the PM emission factor lies at 3.71 mg/km for PM < 12 µm and 1.58 mg/km for PM < 2.5 µm. These values need to roughly triple in order to obtain the brake particle emission of all four brakes and wheels of the entire vehicle. Thus, the brake PN emissions factors have been in the same order of magnitude as the tailpipe PN of a Euro 6 light-duty vehicle equipped with a particle filter. Finally, differences between brake particle emissions in hybrid and all-electric operating modes have been assessed by a series of specific measurements, demonstrating the potential of all-electric vehicle operation in reducing brake particles by a factor of two.

Graphical Abstract

1. Introduction

Particulate matter emissions caused by the transportation sector remain of particular concern for the environment and human health, especially in urban areas [1,2]. Several toxicological and epidemiological studies reveal a correlation between traffic pollutants and adverse health effects such as an increased risk for lung cancer, coronary atherosclerosis, and skin diseases [3,4,5,6]. Particulate emissions from road traffic consist of exhaust particles, generated by incomplete combustion of fuels or by evaporation of lubricating oil components, and non-exhaust particles, which are either generated by the vehicles or already exist in the environment and are stirred up by the vehicles and resuspended into the air [7].
While exhaust-related emissions continue to decrease due to improved exhaust aftertreatment and electrification of the transportation sector, non-exhaust emissions arising from brake discs and pads, as well as tires, move into focus. Vehicle brakes contribute a significant share of traffic-related particle emissions. Studies report that brake wear particles can account for a share of up to 21% of the total PM10 load emitted by vehicles in urban areas [8,9]. Based on published work (e.g., [10,11,12,13]), a fraction of ca. 35–55% becomes airborne, whereas the remaining fraction deposits either on the brake assembly partners or on the road surface. While exhaust-related PM has been extensively studied, brake wear particles have been identified as an increasingly important source of pollution only recently and are expected to gain even more importance over the upcoming years [14]. A more comprehensive study including the trajectories of brake and tire wear particles in urban environments is in [15]. Hence, there is a common understanding that future regulations should aim in limiting brake particle emissions.
In modern disc brake system configurations, flat brake pads are pushed against a rotating metal disc. The brake pad is composed of different components such as binders, fillers, frictional additives, reinforcing fibers, and lubricants, whereas the brake disc is usually made of grey cast iron with additional performance-improving coatings. Moreover, an estimated proportion of ca. 70% of the total braking power is provided by the front brakes [9].
The chemical composition of the induced brake abrasion largely depends on the specific brake material configuration and its associated brake friction parameters as well as the operating conditions (speed, deceleration, pressure, torque) and the temperature developed during braking [16,17,18,19]. Despite variations in brake material, Fe, Cu, Zn, Ba, and Sb have been ascribed to the brake operation and thus used as tracers for brake wear [20,21,22,23,24,25,26,27]. Moreover, the gasification of resins participating in the composition of the pads can lead to hydrocarbon particle generation [16,17], and metal oxides may form by the oxidation of metals [28]. Mass size distributions of brake wear particulate matter have been typically reported to be unimodal with the peak varying between 1 μm and 6 μm [9,17,18,20,29]. In contrast, many researchers (e.g., [3,4,5,6,7,8,9,10,11,12,13,14,15,16,17,18,19,20,21,22,23,24,25,26,27,28]) report bi- or even multimodal particle number size distributions with at least one peak in the fine and/or ultrafine fraction and an increased share of particle mass in the PM2.5 range. It is proposed that these particles are formed through evaporation, condensation, and subsequent aggregation of primary particles and are thus associated with high braking forces and high rotor temperatures [29].
According to [9], brake wear emission factors (EF) have been reported to lie in the range of 2.0–8.0 mg/km (PM10, [9]) per light-duty vehicle (LDV), which is close to the exhaust emissions of Euro 5/6 diesel vehicles, [9]. Recently updated EFs demonstrate similar values [14]. Hagino et al. [29] performed a laboratory experiment on a brake dynamometer using urban city driving cycles and observed airborne brake particle EFs of 0.04–1.4 mg/km/vehicle for PM10 and 0.04–1.2 mg/km/vehicle for PM2.5. Meanwhile, Hagen et al. evaluated brake wear emission factors on a brake dynamometer setup [30] and during on-road driving with a specialized semi-enclosed brake measurement setup [31] following a 3 h subsection of the Los Angeles City Traffic (LACT) cycle. The resulting PM10 emission factors lie at 4.6 mg/km/brake for the dynamometer setup and 1.4–2.1 mg/km/brake for the on-road evaluation. Moreover, a particle number EF of ca. 4.9 × 10¹⁰ 1/km/brake is estimated for realistic vehicle brake temperatures [30].
The few studies in this field are hardly comparable, as there are no standardized measurement methods. The obtained results are in many cases inconsistent or even contrasting as a consequence of the wide range of different experimental setups [31,32,33]. The determined emission factors highly depend, among others, on the testing methodology, the used duty cycle, and the measurement technique. Therefore, the Particle Measurement Program (PMP) group has been developing a harmonized, commonly accepted test procedure for sampling and measuring brake particle emissions [34] based on measurements on a specific brake test bench involving only the friction partners (without the vehicle). Furthermore, a standardized braking cycle in the form of the worldwide harmonized type certification test for light-duty vehicles (WLTC) has been defined, also for the brake test bench [35,36,37]. Only very recently have the results of an interlaboratory comparison been published involving brake particle measurements on specific brake components test benches [38,39,40]. The two cycles, although both labeled WLTC, are different. While the WLTC brake cycle involves only the brakes in a specific dynamometer for the WLTC emission cycle, the entire vehicle is used on a chassis dynamometer, which has to be adjusted in order to reflect the vehicle’s resistance characteristics.
The present study focuses on the quantification of brake particle emissions of a hybrid light-duty vehicle on the chassis dynamometer in driving conditions that closely resemble real driving characteristics. Therefore, the right front wheel brake of the vehicle has been enclosed in a customized arrangement that allows for the measurement of the brake particle number (PN) and its mass (PM). Moreover, the vehicle was tested in all-electric and hybrid modes to evaluate the impact of the brake recuperation on the emitted particles. To our knowledge so far, the present study is one of the very few, evaluating brake particle emissions in realistic driving conditions. The reported emission values and factors have the potential to be a widely used reference. However, it has to be kept in mind that the present study involves only one vehicle with one standard brake configuration. All vehicle manufacturers rely on a number of brake component suppliers. The presented results are of importance but cannot be considered representative. So, a further aim of the present study is to demonstrate the potential of the measuring technique and to encourage repetition with various vehicles and braking components. Apart from that, it can pave the way for further brake wear assessments with improved compatibility.

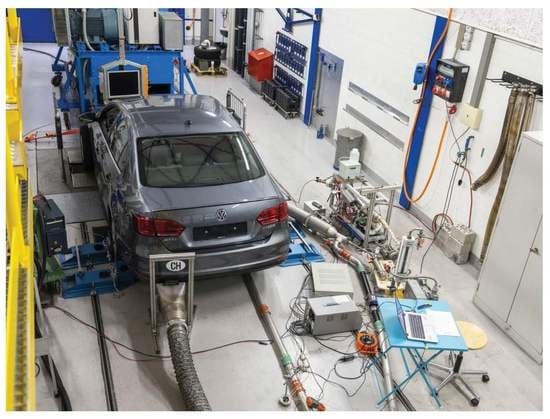
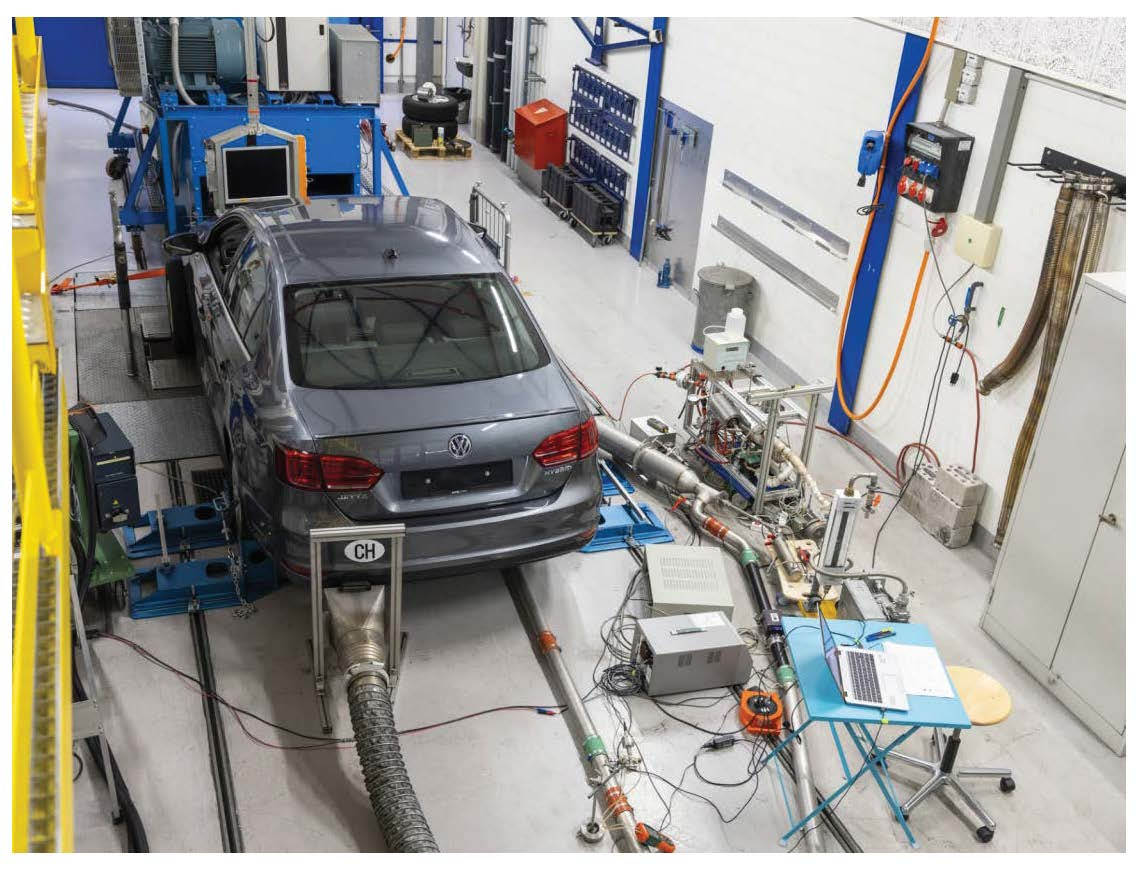
2. Experimental Setup

2.1. PN Measurement Setup

The measurement setup is designed in close accordance with the Particle Measurement Program (PMP) protocol for the quantification of combustion particles. A comprehensive study of measurement setups for brake and exhaust PN/PM can be found in [41]. Figure 1 depicts an overview of the conceptual setup used for evaluating the brake wear of the light-duty vehicle on the chassis dynamometer.
For the measurement of the brake particles, the front right brake disc is enclosed in a customized housing with a rolling mechanical seal. To create enough space for the brake encapsulation, an extender is added to the front axle with the narrower emergency wheel mounted to it. The brake housing is shown in Figure 2a. The vehicle’s emergency wheel was then mounted on the extender. In Figure 2b, the enclosed brake is behind the emergency wheel, only the outflow pipe can be seen in the lower left corner. This assembly was chosen in order to have minimal changes to the vehicle geometry and accommodate the additional components. The different parts had to be designed and manufactured at high precision in order to allow the required good fitting.
The emergency wheel has a diameter of 620 mm, whereas the diameter of the original wheel is 820 mm. Thus, for identical vehicle velocities (regardless of whether the chassis is on the dynamometer or in the street), the emergency wheel and the disc brake have a 30% higher rotational velocity. The brake particles with this assembly will be higher than with the normal wheel. However, the emergency wheel diameter is only 10% smaller than the smallest tire diameter allowed for this vehicle.
The forces on the chassis dynamometer have been measured with the original wheels as well as with the emergency wheel and the brake casing assembly. No significant differences have been found. Thus, also no differences are expected for deceleration energies.
In order to avoid complications with this particular wheel casing in combination with the emergency wheel at the highest velocities of the WLTC cycle, it was decided to measure always the five repetitions of the cycle without the last, extra high-velocity WLTC part. Only the following two repetitions included the entire WLTC with the high-velocity part.
For creating the aerosol carrying the brake particles a compressor of ambient air with integrated drying was used. The air was fed to an activated carbon absorber and a particle filter to supply the encapsulation with sufficient scavenging airflow of 220 kg/h. Downstream the brake the aerosol is discharged to the measurement devices used for the assessment of particle number (PN) and particle mass distribution (PM), see Figure 1 and Figure 3.
While PN emissions are investigated through a PMP compliant particle sampler equipped with a volatile particle remover (VPR) and a particle counter (TSI 3010, with 50% cut off at 23 nm), counting all particles above 23 nm. PM emissions are assessed through an impactor that is discussed in the following section.

2.2. PM Measurements
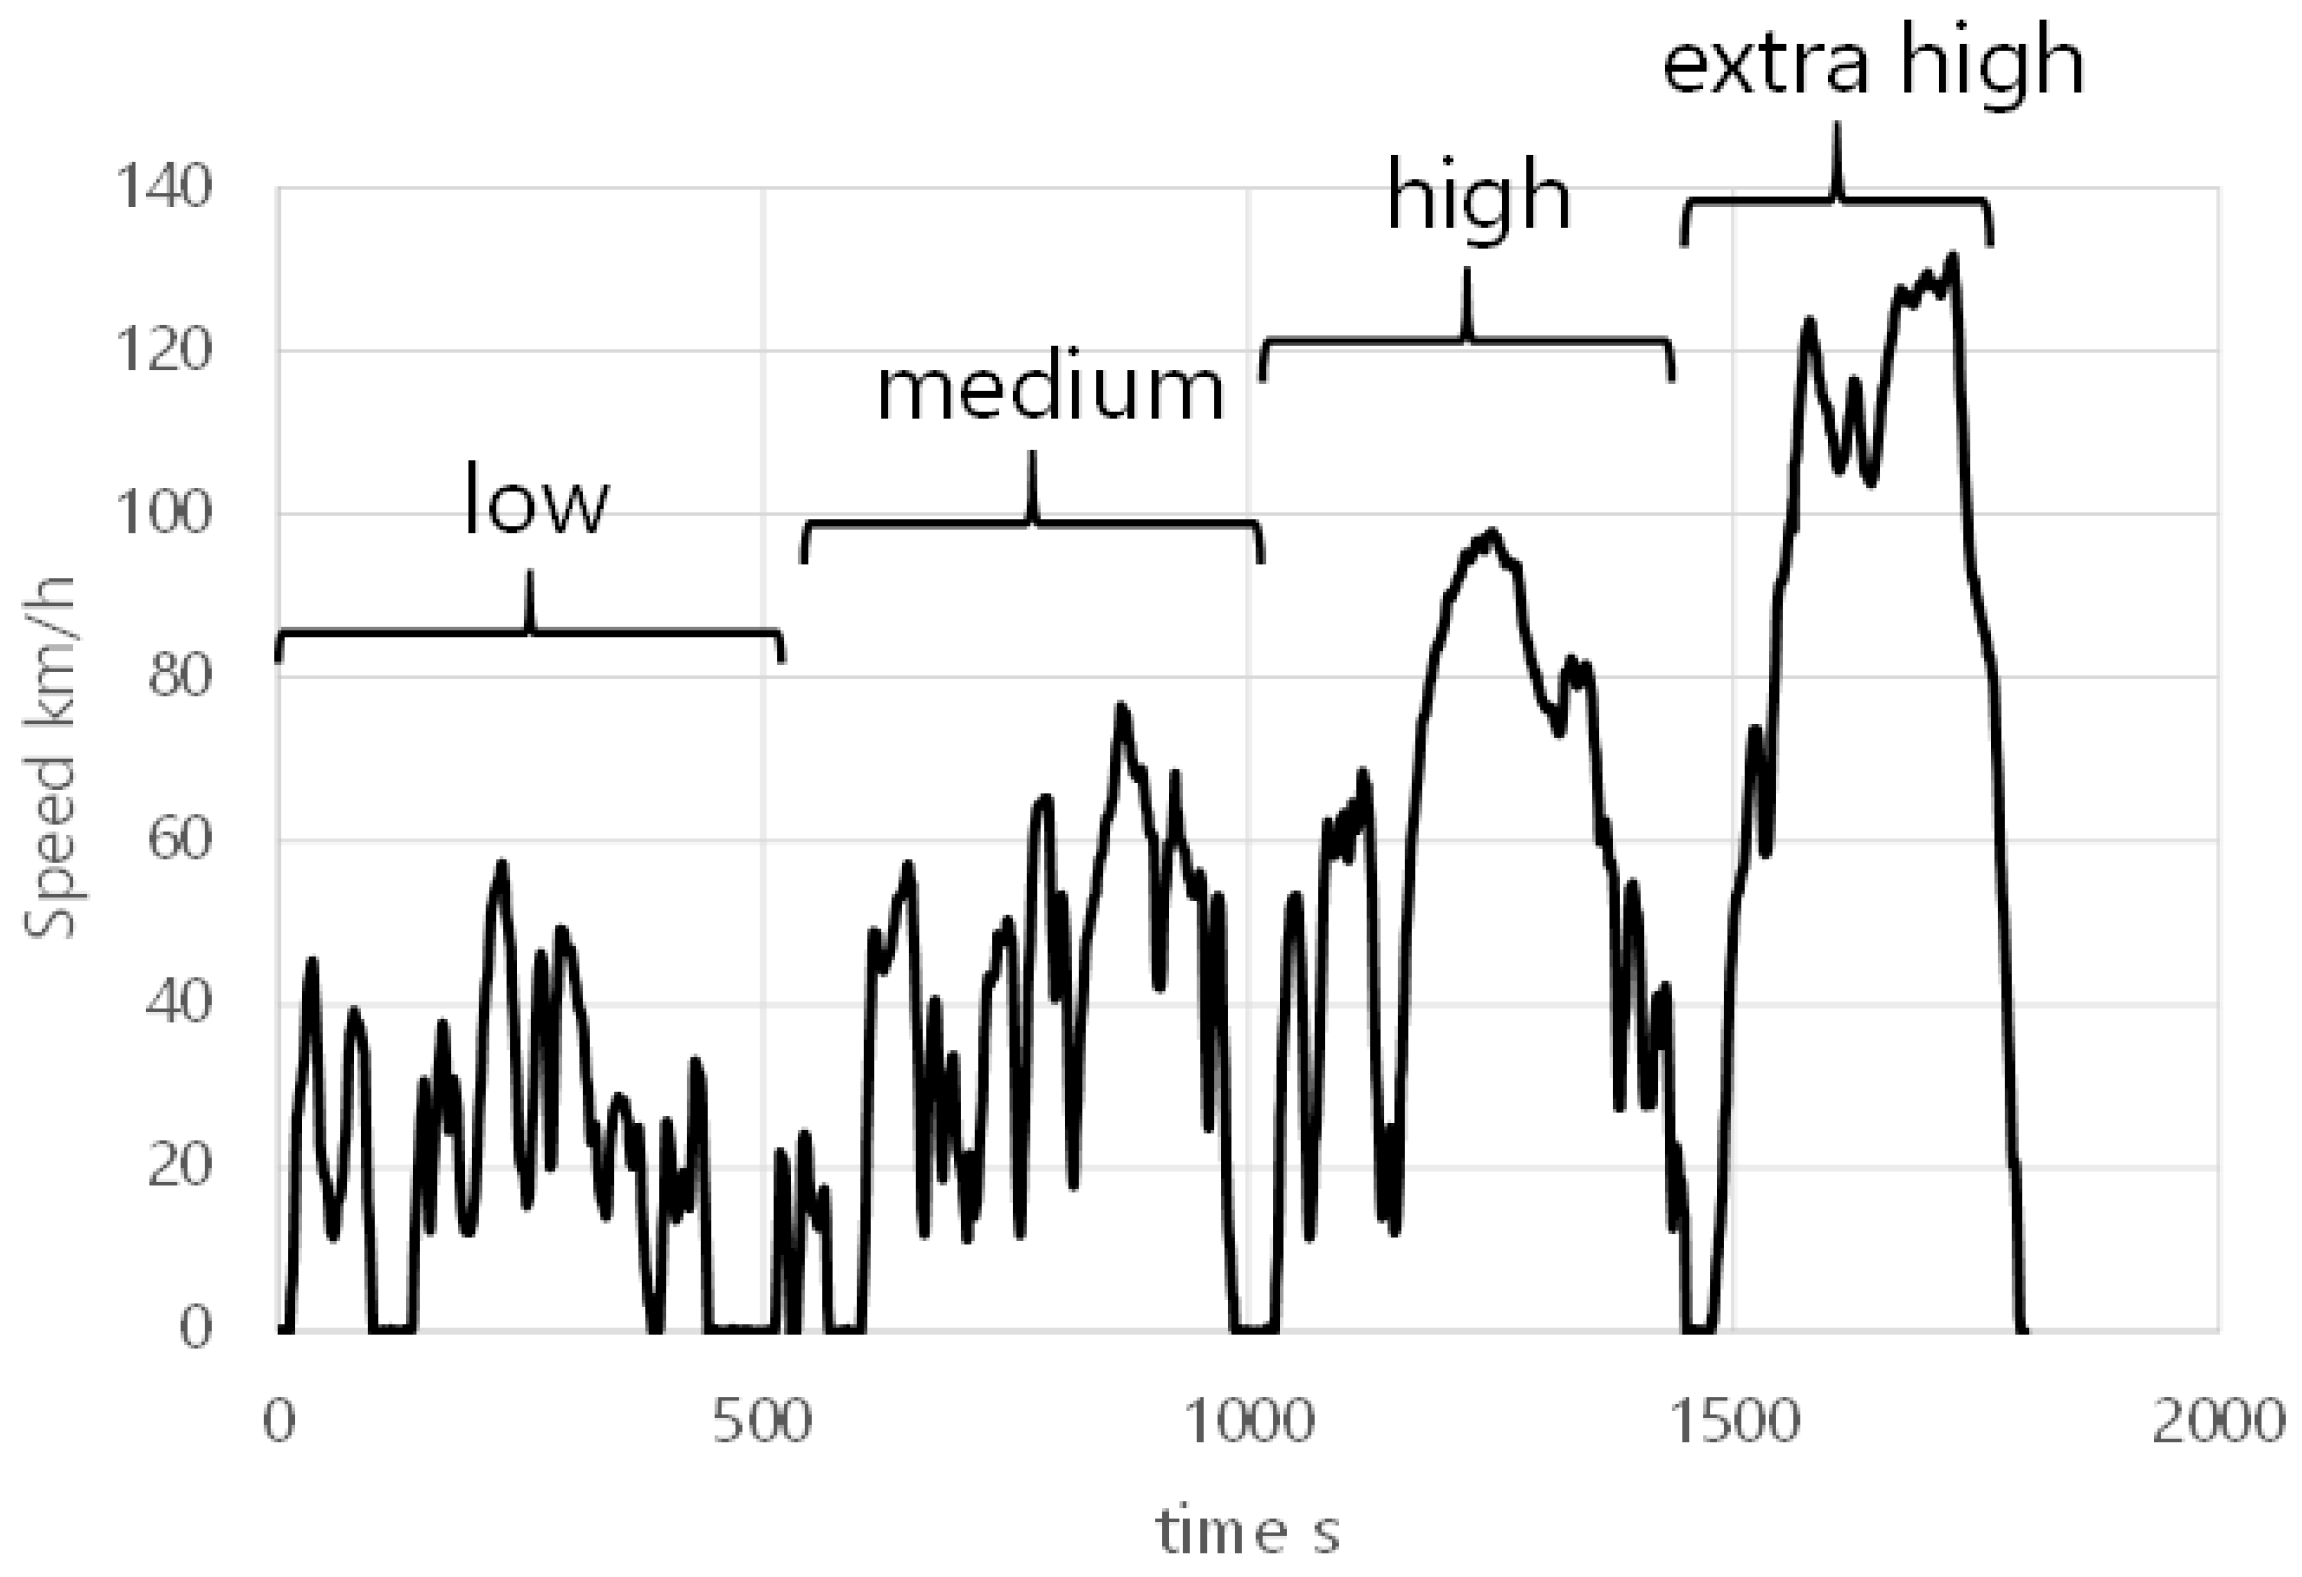
A 13-stage Dekati low-pressure impactor (DLPI) is used to determine the gravimetric mass-size distribution of the emitted brake particles. The subdivision is based on the equivalent aerodyne diameter (Di) of the particles leading to a particle spectrum of 13 size classes ranging from 30 nm to 12.06 µm based on the assumption that the particles are spherical and have a density of 1 g/cm3. Polycarbonate foils are used as particle carriers for the measurement of mass-size distributions and electron microscopy studies. For the last stage of the impactor (stage 0), a backup filter is used (Teflon-coated glass fiber filter, TX 40), which collects the particles remaining from the former stages which are smaller than 30 nm. In order to prevent electrostatic influences due to possibly charged films, the films were electrically neutralized with a high-voltage electrical ionizer before weighing.

2.3. Driving Cycle

To assess brake particle emissions for a variety of different driving characteristics, on the chassis dynamometer, the current WLTC emission certification cycle for light duty was chosen (Figure 4). This cycle should not be confused with the specific WLTC braking cycle which is defined only for a brake dynamometer (without a vehicle). The WLTC driving cycle consists of four parts: low, medium, high, and extra high speed. The respective maximum speed (vmax) of each sub-cycle is defined as follows:
  • Low: vmax ≤ 60 km/h;
  • Medium: 60 km/h < vmax ≤ 80 km/h;
  • High: 80 km/h < vmax ≤ 110 km/h;
  • Extra high: vmax > 110 km/h.

2.4. Test Vehicle

The vehicle used for the brake particle tests is a gasoline hybrid passenger car, a VW Jetta 1.4 TSI hybrid. It is powered by a 1.4 L, 110 kW gasoline engine and a 20 kW electrical unit with 1.1 kWh Li-ion battery. The hybrid drive is designed according to the following key points:
  • The vehicle can reach a maximum velocity of 45 km/h in all-electric mode;
  • The maximum distance that can be driven in all-electric mode lies at 2 km;
  • In the remaining operating range, the combustion engine is always active (with or without electrical support).
The vehicle was commissioned in 2014 and had a mileage of 71,000 km at the time the measurements reported in this work were performed.
The brake partners are serial production parts. The disc brakes were original, and the pads (ECE) were replaced at around 60,000 km. Thus, the pads have been used for approx. 11,000 km under every day normal driving prior to the measurements reported in this study.

2.5. Evaluation of the Measurement Setup

To characterize the experimental setup, several measurements were performed before studying brake wear particle emissions.

2.5.1. Background

In order to examine the background noise present in the brake particle measurements, the PN particle concentration was measured for one hour with non-rotating, non-braking wheels and a constant purge airflow of 220 kg/h. Figure 5 shows a time-resolved graph of the measured PN concentration (1/cm3).
The graph illustrates that the concentration remained stable at very low levels of 0.09–0.10 1/cm3 throughout the testing.

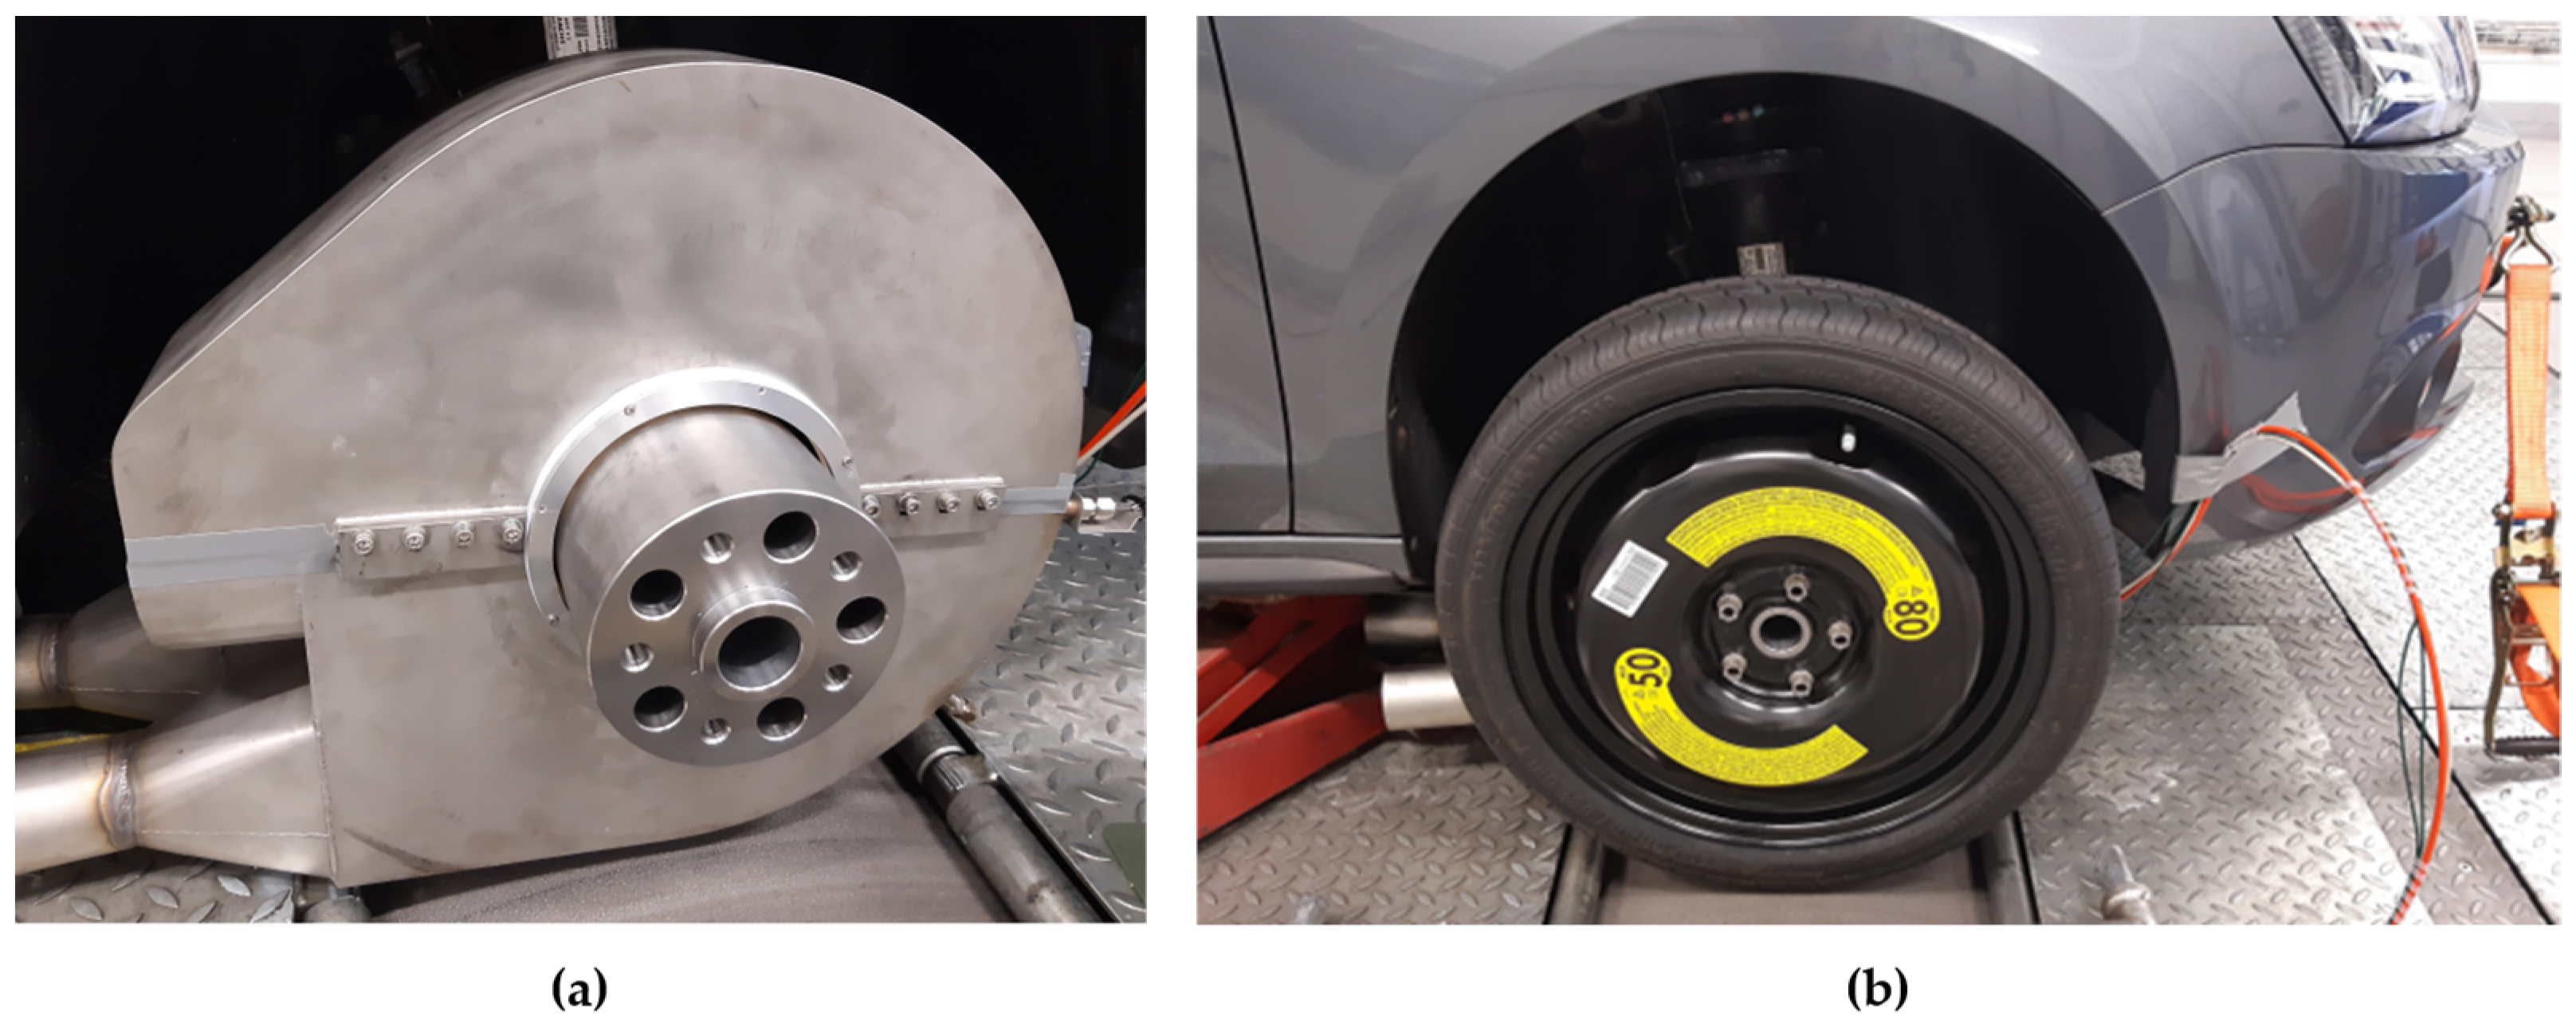
2.5.2. Brake Disc Temperature and Scavenging Air Flow

In order to evaluate the influence of the experimental setup on brake cooling, the temperatures of the enclosed right front brake disc and the left front brake disc (in normal vehicle configuration) have been measured and compared at the end of each of five consecutively performed WLTC cycles (without extra high). The temperatures were measured at a standstill, directly after the brake piston (in the direction of rotation).
Figure 6 indicates that temperatures of the right, enclosed brake, and the left, unhoused brake only differ minimally (ca. 5 °C, apart from the fifth repetition, where the difference was 18.5 °C). Hence, the selected scavenging airflow of 220 kg/h is sufficient to avoid excessive heat accumulation within the brake housing.

2.5.3. Particle Transport Efficiency of the Transfer Line

To reduce the airspeed and, hence, the particle losses over the transfer line, the discharge pipe incorporates a 7° opening angle. For an estimation of the particle transport efficiency over the whole piping, diffusion, inertial, and gravimetric losses from the brake housing outlet to the 13-stage DLPI are considered. Diffusion losses are estimated according to Holman [40] and Friedlander [41], inertial losses according to Piu et al. [42], and gravimetric losses according to Fuchs [43] and Thomas [44]. The graph in Figure 7 depicts the estimated transport efficiency for the chosen purge air flow of 220 kg/h as a function of the particle diameter (dp) assuming particle densities of 0.7, 1.0, and 2.0 kg/dm3.
The plot indicates that lighter particles show a superior efficiency at particle diameters above 2 µm. Meanwhile, higher-density particles (2 kg/dm3) show a significant decrease in transport efficiency (<90%) from a diameter of 5 µm and onwards.
Moreover, the influence of the purging airflow on the measurement setup has been assessed by calculating the transport efficiency for air flows of 170 kg/h and 270 kg/h in addition to the chosen flow of 220 kg/h. The obtained results indicate that the airspeed has no impact on the particle transport efficiency for assumed particle densities of 1 kg/dm3 and aerodynamic diameters of 0.01–10 µm.

3. Results and Discussion

3.1. Brake PN Emissions

3.1.1. Brake PN Emissions during the WLTC Cycle

For measuring the brake PN emissions over time, the WLTC cycle was chosen and repeated seven times. Figure 8a shows the measured brake PN emissions (PN > 23 nm (1/cm3)) of two repetitions of the entire WLTC.
The measured PN are very consistent underlining the good repeatability of the results and the capabilities of the developed and used measurement setup. Brake PN emissions occur almost simultaneously in both repetitions; however, differences in magnitude are obvious. As could be expected, the highest peaks in brake PN emissions occur during the extra high phase featuring the highest decelerations. Moreover, Figure 8b shows that brake particles are mainly, but not only, emitted during braking phases indicated through pink bars, as identified by the forces on the chassis dynamometer. Some emission peaks have been measured during non-braking phases, as indicated exemplarily through the red outline in Figure 8b. These have to be particles that have been generated during previous braking events, remain loosely on the friction partners, and are emitted in a later instant. In the red outline, for instance, the vehicle velocity exceeds 80 km/h for the first time since the test began. In addition, the air flowing around the friction partners is reaching the highest velocities for the first time after the initial, slow part of the WLTC cycle. Thus, it can be assumed that increased aerodynamic drag is responsible for this peak not directly associated to a brake event.

3.1.2. Repeatability of the Measured PN

Five WLTC cycles (without the extra-high part) have been subsequently performed in order to assess the repeatability of the brake events and the measurements. Figure 9a shows the time history of the dynamometer force (F-Dyno [N]) for the five cycles (1–5). For clarity, only a part of the WLTC cycle is shown in Figure 9, ranging from 750 s to 1000 s. Very good reproducibility of the applied dynamometer forces, over the five WLTC repetitions is apparent. Figure 9b shows the corresponding measured PN-emissions. Similar to Figure 8, emission peaks mainly occur during braking phases indicated through blue bars. Additionally, the red frame in Figure 9b shows that even weak brake events can lead to abruptly higher PN concentrations. While the temporal occurrence of the peaks is identical over all consecutive repetitions, the magnitude of the peaks is decreasing after each repetition. The cause can be linked to the necessary running-in of the friction partners, often described in the literature as “bedding” [45].
Figure 10 shows the cumulated brake PN emissions for each sub-cycle of the five consecutively repeated WLTC cycles, Figure 10a indicates that most brake particulate matter is emitted during the high-speed part of the cycle, less during the medium speed, and even less during the low-speed portion. Moreover, the bars suggest that the “bedding” effect influences PN emissions at all three cycle phases (low, medium, and high) similarly. It is of interest, that this “bedding” effect was evident although the friction partners have been used for a sufficient time and mileage on the vehicle (see Section 2.4). Furthermore, these identical friction partners have been used in all preparatory measurements as described in Section 2.5. Figure 10b further illustrates the PN emission decrease (in %) for each repetition compared to the first. The results indicate that the rate of PN emission decrease is comparable for all parts of the WLTC cycle.

3.1.3. PN Emission Factors

Based on the measured PN, and the distances traveled during the WLTC parts, the derivation of emission factors is straightforward. In Figure 11, the emission factors of the five consecutive WLTC cycles together with the mean values are shown. The resulting average value of 5.49 × 10¹⁰ 1/km agrees well with the findings of zum Hagen et al. [30,31], who reported an average brake particle emission factor of 4.9 × 10¹⁰ 1/km. it should be kept in mind that [30] used a different driving cycle (LACT) and different particle counting equipment (EEPS with 5~560 nm). In general, the conducted measurements show that over the WLTC cycle, the brake PN emission factors are on the order of 5 × 10¹⁰ 1/km. Emission factors have been derived also for the two subsequently performed full WLTC cycles (including the extra high part). The resulting value of 5 × 10¹⁰ 1/km lies slightly below the average value for the reduced WLTC cycles, possibly due to the “bedding” effect. The two full WLTC cycles have been measured following the five repetitions of the WLTC without the extra high part.
The “bedding” effect is also reflected in Figure 11. The largest difference in emission factors occurs between repetitions 1 and 2 (25.4%); thereafter, the values slowly start to stabilize the reduction in the next two repetition decreases to 11.4% and 6.2%, respectively. However, the fifth repetition shows a decrease of 20% in PN.
The PN emission factors were derived from the measurements performed, where all sampling took place on the right front wheel. Thus, the emission factors can be doubled to obtain the corresponding emission factors from both front wheels. In order to determine the total brake particle emissions, the emissions from the rear axle must also be included. In real vehicle operation, the braking forces on the rear axle are lower than on the front axle but are corrected accordingly depending on the axle load. In a first approximation, the PN emission factors listed can be tripled to estimate the total brake particle emissions from all wheels, thus the estimated brake particle emission factor for the entire vehicle over the WLTC cycle lies approx. at 1.5 × 10¹¹ 1/km. This is on the same order of magnitude as the exhaust PN emission factors of modern diesel vehicles equipped with a particulate filter (DPF), [46]. This approximation does not take into account the possible brake particle reduction due to the hybridization given the fact that recuperative braking does not make use of the mechanical brakes. Nevertheless, the hybridization of the vehicle is a light one, relying on a small-size battery (see Section 2.4). A preliminary assessment of the hybridization impact on the brake particle emissions is provided in Section 3.3.

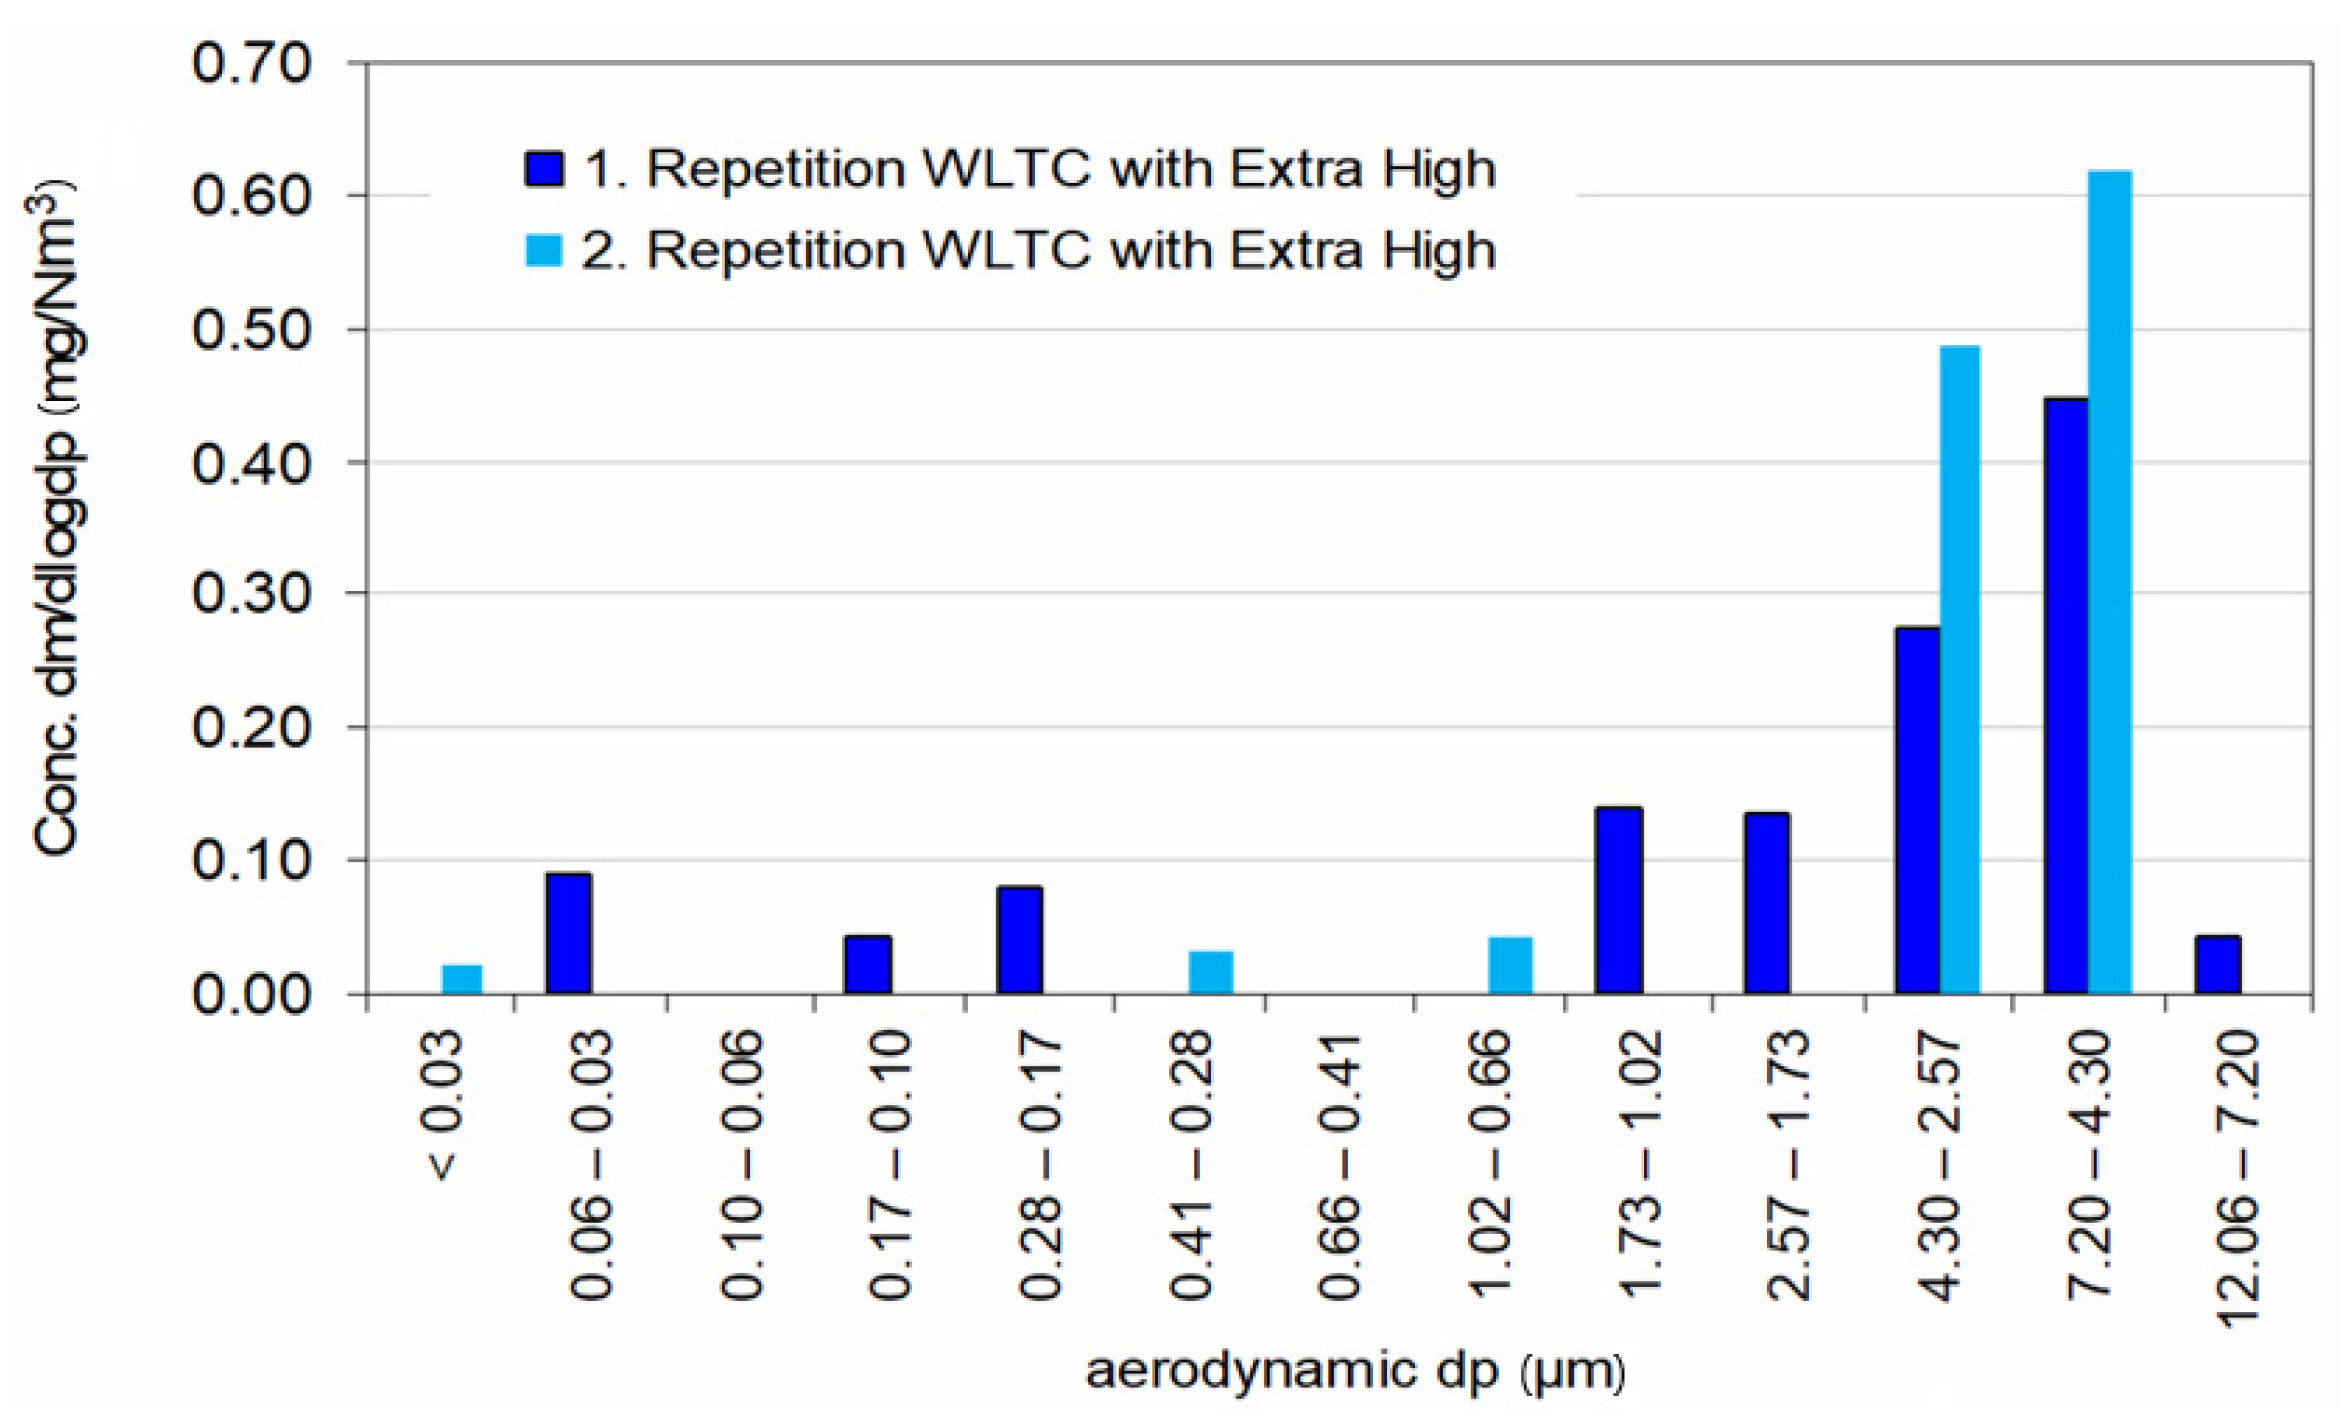
3.2. Brake PM Emissions

Brake PM Emissions in 13 Size Classes

In parallel to PN measurements, the particle mass distribution was measured during the two full WLTC cycles through the Dekati low-pressure impactor (DLPI). The absolute accumulated particle concentration (mg/Nm3) on each foil is shown in Figure 12. The mass distribution is background compensated and diameter weighted assuming a lognormal particle distribution on the carrier foils.
Figure 12 illustrates that particles with an aerodynamic diameter of 1–10 µm account for the most brake wear mass from brake pads and discs during the driving cycle. The total particulate mass from one cycle, consisting of the sum of the 13 stages of the impactor (13 differential measurements), was subject to relatively large measurement uncertainty. Therefore, the emission factors were determined from foil loadings of three consecutive WLTC cycles (without extra high) that sum up to a total of 11 km. The determined emission factors result in an average value of 3.71 mg/km for PM < 12 µm and 1.58 mg/km for PM < 2.5 µm. Once again, these values are derived from the measurements at the one front wheel and have to be roughly tripled for deriving the brake particle PM emissions of the entire vehicle. Thus, the entire PM emission is estimated at 11.13 mg/km for PM < 12 µm and 4.74 mg/km for PM < 2.5 µm. These values are similar to those of zum Hagen et al. [31]. They report a PM10 of 4.6 mg/km per wheel.

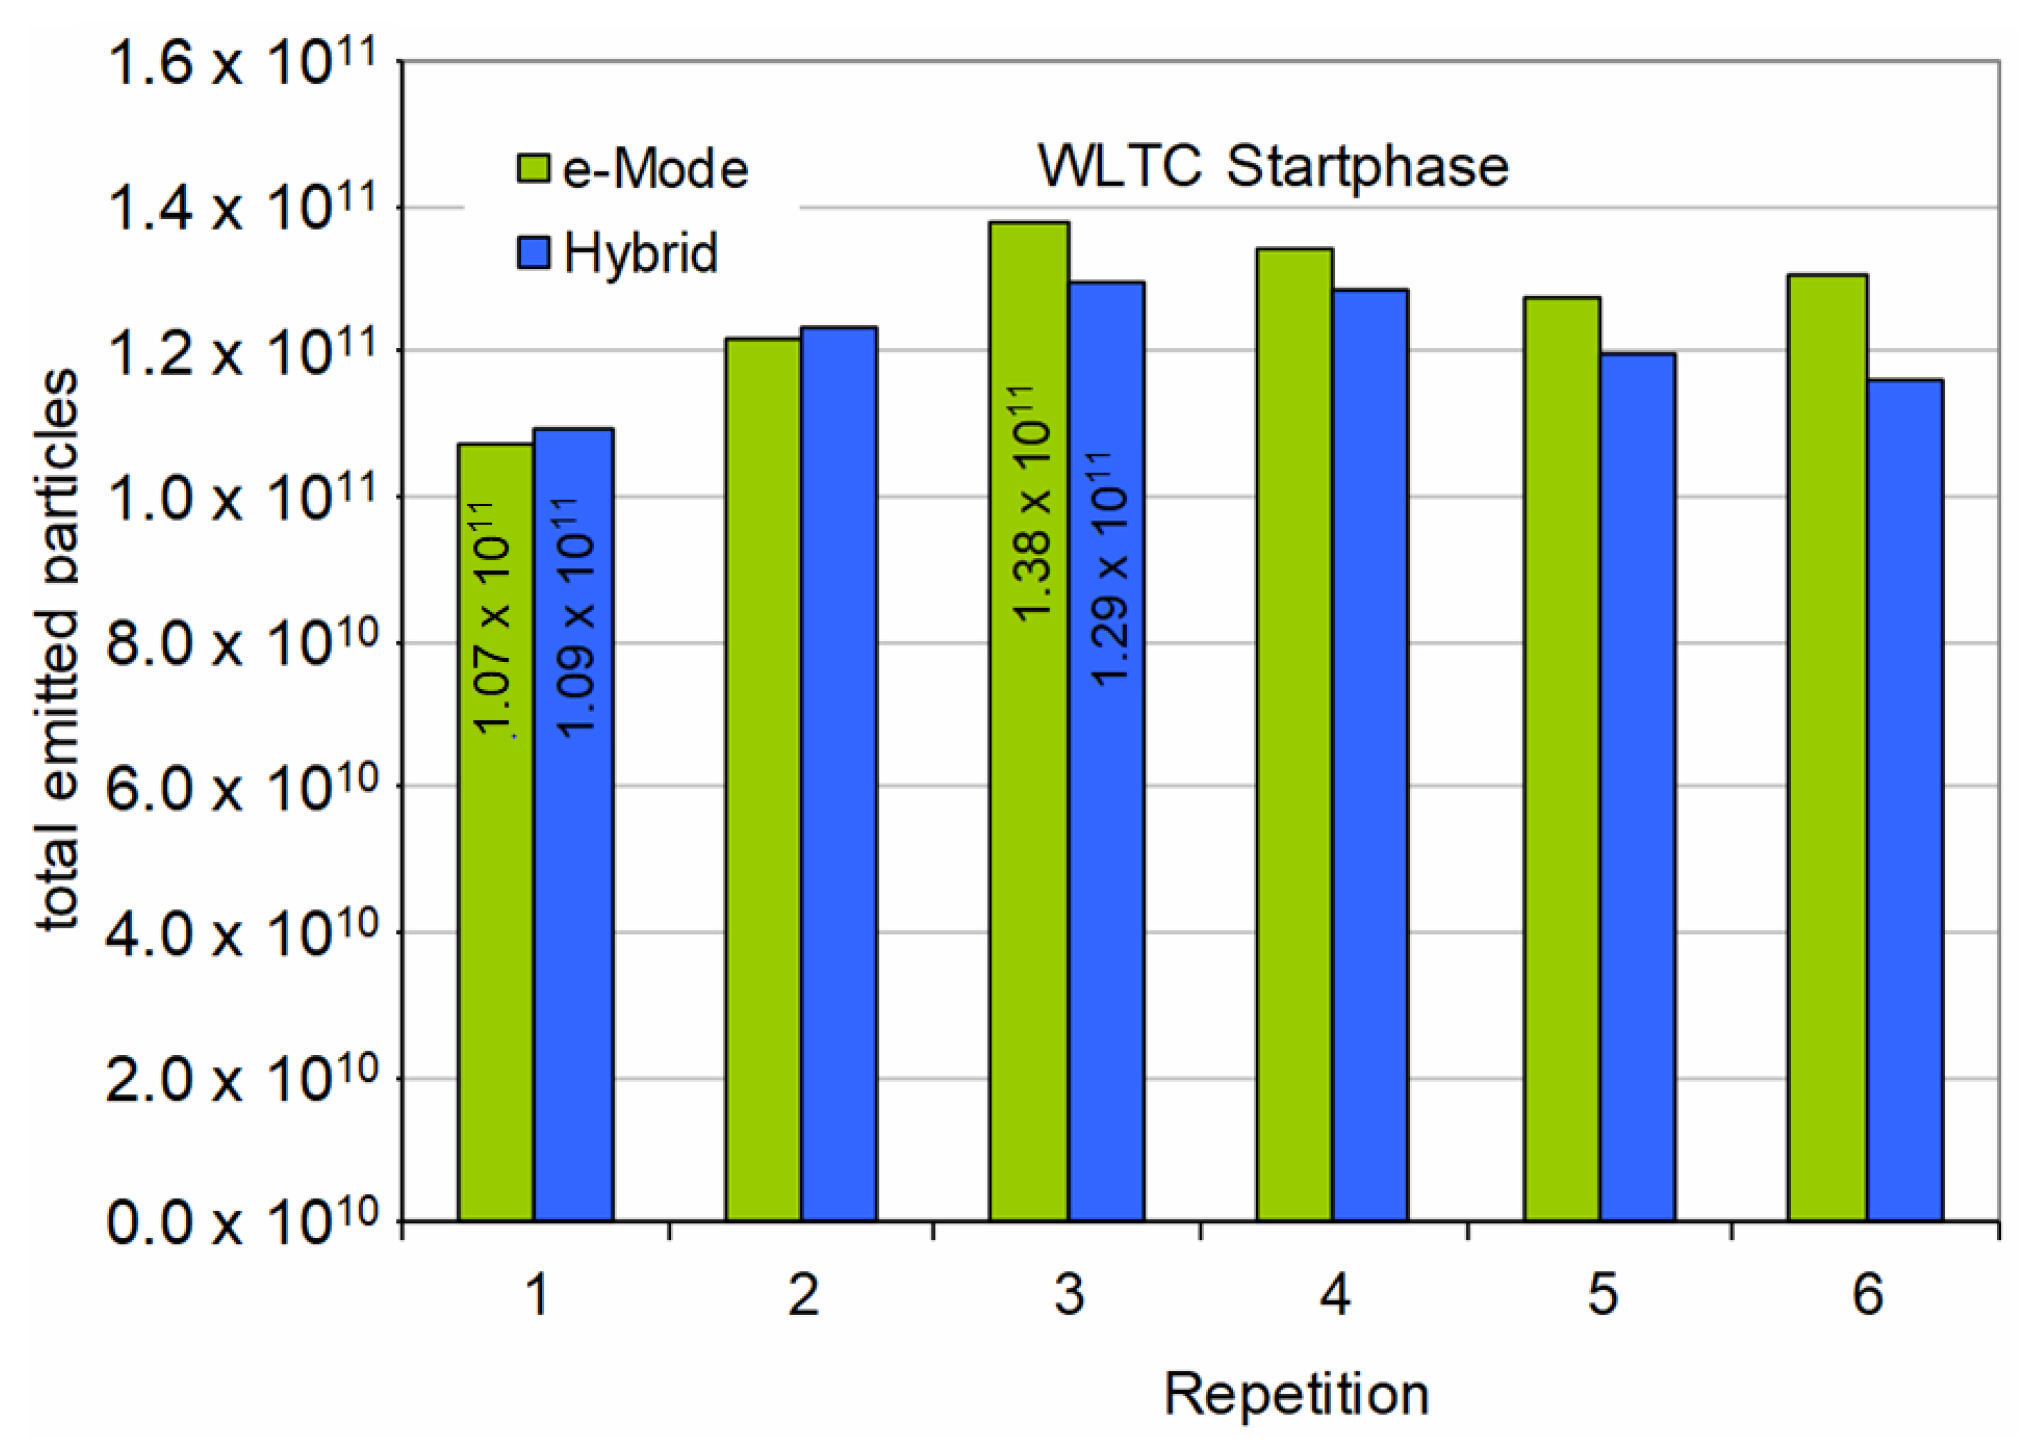
3.3. Differences of Brake PN-Emissions between All-Electric and Hybrid-Electric Vehicle Operation Modes

In both hybrid and all-electric operating modes, the braking process consists of a combination of mechanical and recuperative (electrical) braking. It can be assumed, that at the very beginning of braking, the mechanical brake is active because it engages more quickly. Moreover, as the speed difference between the friction partners of the brake decreases, the effect of the electric brake decreases considerably. Thus, towards the end of a braking process (especially if towards a standstill), only the mechanical brake is active [47]. However, it can be assumed that recuperative braking is used more in all-electric vehicle operation than in hybrid mode. In order to provide a preliminary assessment of the impact of the driving modes on PN emission, different experiments have been performed.

3.3.1. Comparison over the Initial Part of the WLTC Cycle

In all-electric mode, the tested vehicle reached a velocity of 70 km/h (providing a high state of charge of the battery). Moreover, it was only possible to perform all-electric driving during the first 285 s of the WLTC cycle, thereafter the vehicle switched to hybrid mode. The relatively low speeds also resulted in low emissions during braking. Hence, the filter loadings of the impactor were too low for a reliable measurement of PM emissions. Therefore, the comparison of the operating modes is solely based on PN emissions. Figure 13 shows the resulting PN-emissions of six successive WLTC initial phase repetitions in e-mode (green) and hybrid (blue).
Figure 13 shows, that the differences in the measured total brake particle numbers between hybrid and all-electric operations are small. Surprisingly, the all-electric operation mode of the vehicle did not always lead to lower brake particle emissions.

3.3.2. Comparison over Brake Force

A further comparison of brake particle PN emissions between all-electric and hybrid operation mode of the vehicle was attempted with a series of experiments braking to a standstill from different initial vehicle velocities keeping the brake force at a constant level during each experiment. The all-electric operation of the vehicle is limited to below 70 km/h. In this velocity domain, constant force braking could only be achieved at lower braking forces (<500 N). In contrast, the hybrid mode allowed for a larger range of initial velocities and thus a larger range assessed with constant braking forces for each experiment, as indicated in Figure 14.
Figure 14 shows the resulting emissions obtained during each braking process plotted against the applied, constant over each experiment, braking force (FB). The total emissions (sum Σ, red in hybrid mode, yellow in all-electric mode) and the peak values (dark blue in hybrid mode and light blue in all-electric mode) are compared.
The correlation of brake PN and brake force is good. The brake force accounts for some 85% of the brake PN in hybrid mode and over 95% in all-electric mode. The correlation holds also for the peaks in the PN. The slope of the emitted PN in hybrid mode is significantly higher than in all-electric mode.
Figure 14 demonstrates the potential of electric braking for lowering brake particle emissions. Assuming that similar electric braking patterns can be achieved with vehicles that allow full-electric driving at higher velocities, that is, assuming that an extrapolation of fully electric operation towards higher braking forces is eligible, a lowering of brake particle emissions by at least a factor of 2 can be expected.

4. Conclusions

In this study we propose a novel method for measuring brake particle emissions of a light-duty vehicle on the chassis dynamometer at conditions representative for real vehicle use. A customized housing was designed, manufactured, and used for enclosing the right front disc brake of a test vehicle. The experimental setup has been evaluated in regard to background noise, realistic brake disc temperatures, particle transport losses, and related, optimal scavenging airflow, as well as repeatability of brake events.
With this experimental setup, brake PN emissions of a hybrid light-duty vehicle have been measured during the WLTC cycle. Evaluation of the measurement results has shown:
  • Reproducible brake PN emissions, occurring mostly in discrete events during deceleration phases, that is, braking, as indicated by the forces on the wheels determined by the chassis dynamometer;
  • Occasional discrete brake PN emission events not associated with decelerations but with releases of accumulated brake PN matter from the friction partners;
  • Highest PN emission peaks during decelerations in the last WLTC part associated with the highest vehicle velocities and strongest decelerations;
  • Decreasing PN emissions at each measurement repetition, the so-called “bedding” effect, with stabilization tendencies after the fifth repetition;
  • The determined brake PN emission factor from the measurements at the one front wheel lies at 5 × 10¹⁰ 1/km;
  • The brake emission factor for the entire vehicle is estimated at 1.5 × 10¹¹ 1/km being in the same order of magnitude as exhaust PN of modern diesel and gasoline engines equipped with particulate filters (PF);
  • Entire PM emissions are estimated at 11.13 mg/km for PM < 12 µm and 4.74 mg/km for PM < 2.5µm.
Finally, measurements have been performed in order to assess the influence of full electric vehicle operation on brake particle emissions. The appraisal hints at a brake PN reduction potential of at least a factor of 2. The limited all-electric operation domain of the used hybrid-electric vehicle did not allow direct measurement comparisons. The correlations obtained with the measured braking forces hint at a brake PN reduction potential of at least a factor of 2 of the full-electric mode. Given the light hybridization concept of the vehicle used, allowing electric operation only at a very limited low-velocity domain, the impact on the total brake particle emissions is expected to be rather modest.

Author Contributions

Methodology, D.S. and P.D.E.; Software, D.S.; Formal analysis, P.D.E.; Investigation, D.S.; Resources, P.D.E.; Data curation, D.S.; Writing—original draft, J.H.; Writing—review & editing, P.D.E.; Supervision, P.D.E.; Project administration, P.D.E.; Funding acquisition, P.D.E. All authors have read and agreed to the published version of the manuscript.

Funding

The present work was carried out within the framework of a project funded by the Swiss Federal Office of Environment (BAFU) contract number 15.0002.PJ/S122-1365. The authors express their gratitude.

Institutional Review Board Statement

Not applicable.

Informed Consent Statement

Not applicable.

Data Availability Statement

All data presented in this study are available on request from the corresponding author. The data are not publicly available due to confidentiality agreement with the part providers.

Conflicts of Interest

The authors declare no conflict of interest. The funders had no role in the design of the study; in the collection, analyses, or interpretation of data; in the writing of the manuscript, or in the decision to publish the results.

References

  1. Meister, K.; Johansson, C.; Forsberg, B. Estimated short-term effects of coarse particles on daily mortality in Stockholm, Sweden. Environ. Health Perspect. 2012, 120, 431–436. [Google Scholar] [CrossRef] [PubMed]
  2. Pope, C.A.; Dockery, D.W. Health Effects of Fine Particulate Air Pollution: Lines that Connect. J. Air Waste Manag. Assoc. 2006, 56, 709–742. [Google Scholar] [CrossRef] [PubMed]
  3. Maynard, D.; Coull, B.A.; Gryparis, A.; Schwartz, J. Mortality risk associated with short-term exposure to traffic particles and sulfates. Environ. Health Perspect. 2007, 115, 751–755. [Google Scholar] [CrossRef]
  4. Pope, C.A.; Burnett, R.T.; Thun, M.J.; Calle, E.E.; Krewski, D.; Ito, K.; Thurston, G.D. Lung cancer, cardiopulmonary mortality, and long-term exposure to fine particulate air pollution. J. Am. Med. Assoc. 2002, 287, 1132–1141. [Google Scholar] [CrossRef] [PubMed]
  5. Hoffmann, B.; Moebus, S.; Möhlenkamp, S.; Stang, A.; Lehmann, N.; Dragano, N.; Schmermund, A.; Memmesheimer, M.; Mann, K.; Erbel, R.; et al. Residential exposure to traffic is associated with coronary atherosclerosis. Circulation 2007, 116, 489–496. [Google Scholar] [CrossRef]
  6. Kim, H.S.; Na, H.W.; Jang, Y.; Kim, S.J.; Kee, N.G.; Shin, D.Y.; Choi, H.; Kim, H.J.; Seo, Y.R. Integrative analysis to explore the biological association between environmental skin diseases and ambient particulate matter. Sci. Rep. 2022, 12, 9750. [Google Scholar] [CrossRef]
  7. Thorpe, A.; Harrison, R.M. Sources and properties of non-exhaust particulate matter from road traffic: A review. Sci. Total Environ. 2008, 400, 270–282. [Google Scholar] [CrossRef]
  8. Bukowiecki, N.; Lienemann, P.; Hill, M.; Furger, M.; Richard, A.; Amato, F.; Prévôt AS, H.; Baltensperger, U.; Buchmann, B.; Gehrig, R. PM10 emission factors for non-exhaust particles generated by road traffic in an urban street canyon and along a freeway in Switzerland. Atmos. Environ. 2010, 19, 2330–2340. [Google Scholar] [CrossRef]
  9. Grigoratos, T.; Martini, G. Brake wear particle emissions: A review. Environ. Sci. Pollut. Res. 2015, 22, 2491–2504. [Google Scholar] [CrossRef]
  10. Harrison, R.M.; Jones, A.M.; Gietl, J.; Yin, J.; Green, D.C. Estimation of the Contributions of Brake Dust, Tire Wear, and Resuspension to Nonexhaust Traffic Particles Derived from Atmospheric Measurements. Environ. Sci. Technol. 2012, 46, 6523–6529. [Google Scholar] [CrossRef]
  11. Lawrence, S.; Sokhi, R.; Ravindra, K.; Mao, H.; Prain, H.D.; Bull, I. Source apportionment of traffic emissions of particulate matter using tunnel measurements. Atmos. Environ. 2013, 77, 548–557. [Google Scholar] [CrossRef]
  12. Padoan, E.; Amato, F. Chapter 2—Vehicle non-exhaust emissions: Impact on air quality. In Non-Exhaust Emissions; Amato, F., Ed.; Academic Press: Cambridge, MA, USA, 2018; pp. 21–65. [Google Scholar]
  13. Kumar, P.; Pirjola, L.; Ketzel, M.; Harrison, R.M. Nanoparticle emissions from 11 non-vehicle exhaust sources—A review. Atmos. Environ. 2013, 67, 252–277. [Google Scholar] [CrossRef]
  14. Denier van der Gon, H.; Hulskotte, J.; Jozwicka, M.; Kranenburg, R.; Kuenen, J.; Visschedijk, A. European Emission Inventories and Projections for Road Transport Non-Exhaust Emissions: Analysis of Consistency and Gaps in Emission Inventories From EU Member States. Non-Exhaust Emiss. 2018, I, 101–121. [Google Scholar] [CrossRef]
  15. Kunze, M.; Feißel, T.; Ivanov, V.; Bachmann, T.; David Hesse, D.; Gramstat, S. Analysis of TRWP Particle Distribution in Urban and Suburban Landscapes, Connecting Real Road Measurements with Particle Distribution Simulation. Atmosphere 2022, 13, 1204. [Google Scholar] [CrossRef]
  16. Garg, B.D.; Cadle, S.H.; Mulawa, P.A.; Groblicki, P.J.; Laroo, C.; Parr, G.A. Brake wear particulate matter emissions. Environ. Sci. Technol. 2000, 34, 4463–4469. [Google Scholar] [CrossRef]
  17. Sanders, P.G.; Xu, N.; Dalka, T.M.; Maricq, M.M. Airborne brake wear debris: Size distributions, composition, and a comparison of dynamometer and vehicle tests. Environ. Sci. Technol. 2003, 37, 4060–4069. [Google Scholar] [CrossRef]
  18. Iijima, A.; Sato, K.; Yano, K.; Tago, H.; Kato, M.; Kimura, H.; Furuta, N. Particle size and composition distribution analysis of automotive brake abrasion dusts for the evaluation of antimony sources of airborne particulate matter. Atmos. Environ. 2007, 41, 4908–4919. [Google Scholar] [CrossRef]
  19. Iijima, A.; Sato, K.; Yano, K.; Kato, M.; Kozawa, K.; Furuta, N. Emission factor for antimony in brake abrasion dusts as one of the major atmospheric antimony sources. Environ. Sci. Technol. 2008, 42, 2937–2942. [Google Scholar] [CrossRef]
  20. Dall’Osto, M.; Querol, X.; Amato, F.; Karanasiou, A.; Lucarelli, F.; Nava, S.; Calzolai, G.; Chiari, M. Hourly elemental concentrations in PM2.5 aerosols sampled simultaneously at urban background and road site during SAPUSS -diurnal variations and PMF receptor modelling. Atmos. Chem. Phys. 2013, 13, 4375–4392. [Google Scholar] [CrossRef]
  21. Gietl, J.K.; Lawrence, R.; Thorpe, A.J.; Harrison, R.M. Identification of brake wear particles and derivation of a quantitative tracer for brake dust at a major road. Atmos. Environ. 2010, 44, 141–146. [Google Scholar] [CrossRef]
  22. Johansson, C.; Norman, M.; Burman, L. Road traffic emission factors for heavy metals. Atmos. Environ. 2009, 43, 4681–4688. [Google Scholar] [CrossRef]
  23. Querol, X.; Pey, J.; Minguillón, M.C.; Pérez, N.; Alastuey, A.; Viana, M.; Moreno, T.; Bernabé, R.M.; Blanco, S.; Cárdenas, B.; et al. PM speciation and sources in Mexico during the MILAGRO-2006 campaign. Atmos. Chem. Phys. 2008, 8, 111–128. [Google Scholar] [CrossRef]
  24. Sternbeck, J.; Sjödin, Å.; Andréasson, K. Metal emissions from road traffic and the influence of resuspension—Results from two tunnel studies. Atmos. Environ. 2002, 36, 4735–4744. [Google Scholar] [CrossRef]
  25. Zhao, J.; Lewinski, N.; Riediker, M. Physico-Chemical Characterization and Oxidative Reactivity Evaluation of Aged Brake Wear Particles. Aerosol Sci. Technol. 2015, 49, 65–74. [Google Scholar] [CrossRef]
  26. Liati, A.; Schreiber, D.; Lugovyy, D.; Gramstat, S.; Dimopoulos Eggenschwiler, P. Airborne particulate matter emissions from vehicle brakes in micro- and nano-scales: Morphology and chemistry by electron microscopy. Atmos. Environ. 2019, 212, 281–289. [Google Scholar] [CrossRef]
  27. Dimopoulos Eggenschwiler, P.; Schreiber, D.; Papetti, V.; Gramstat, S.; Lugovyy, D. Electron Microscopic Characterization of the Brake Assembly Components (Disc and Pads) from Passenger Vehicles. Atmosphere 2022, 13, 523. [Google Scholar] [CrossRef]
  28. Hinrichs, R.; Soares, M.R.F.; Lamb, R.G.; Soares, M.R.F.; Vasconcellos, M.A.Z. Phase characterization of debris generated in brake pad coefficient of friction tests. Wear 2011, 270, 515–519. [Google Scholar] [CrossRef]
  29. Hagino, H.; Oyama, M.; Sasaki, S. Laboratory testing of airborne brake wear particle emissions using a dynamometer system under urban city driving cycles. Atmos. Environ. 2016, 131, 269–278. [Google Scholar] [CrossRef]
  30. zum Hagen, F.H.F.; Mathissen, M.; Grabiec, T.; Hennicke, T.; Rettig, M.; Grochowicz, J.; Vogt, R.; Benter, T. Study of Brake Wear Particle Emissions: Impact of Braking and Cruising Conditions. Environ. Sci. Technol. 2019, 53, 5143–5150. [Google Scholar] [CrossRef]
  31. zum Hagen, F.H.F.; Mathissen, M.; Grabiec, T.; Hennicke, T.; Rettig, M.; Grochowicz, J.; Vogt, R.; Benter, T. On-road vehicle measurements of brake wear particle emissions. Atmos. Environ. 2019, 217, 116943. [Google Scholar] [CrossRef]
  32. Mathissen, M.; Grigoratos, T.; Lahde, T.; Vogt, R. Brake Wear Particle Emissions of a Passenger Car Measured on a Chassis Dynamometer. Atmosphere 2019, 10, 556. [Google Scholar] [CrossRef]
  33. Mamakos, A.; Arndt, M.; Hesse, D.; Augsburg, K. Physical Characterization of Brake-Wear Particles in a PM10 Dilution Tunnel. Atmosphere 2019, 10, 639. [Google Scholar] [CrossRef]
  34. Grigoratos, T.; Martini, G. Development of a commonized methodology for measuring brake wear particles–current status within the PMP IWG. In 8th International Munich Chassis Symposium; Pfeffer, P., Ed.; Springer: Berlin/Heidelberg, Germany, 2017; p. 627. [Google Scholar] [CrossRef]
  35. Mathissen, M.; Grochowicz, J.; Schmidt, C.; Vogt, R.; zum Hagen, F.H.F.; Grabiec, T.; Steven, H.; Grigoratos, T. A novel real-world braking cycle for studying brake wear particle emissions. Wear 2018, 414–415, 219–226. [Google Scholar] [CrossRef]
  36. Grigoratos, T.; Agudelo, C.; Grochowicz, J.; Gramstat, S.; Robere, M.; Perricone, G.; Sin, A.; Paulus, A.; Zessinger, M.; Hortet, A.; et al. Statistical assessment and temperature study from the interlaboratory application of the WLTP–brake cycle. Atmosphere 2020, 11, 1309. [Google Scholar] [CrossRef]
  37. Grigoratos, T.; Mamakos, A.; Arndt, M.; Lugovyy, D.; Anderson, R.; Hafenmayer, C.; Moisio, M.; Vanhanen, J.; Frazee, R.; Agudelo, C.; et al. Characterization of Particle Number Setups for Measuring Brake Particle Emissions and Comparison with Exhaust Setups. Atmosphere 2023, 14, 103. [Google Scholar] [CrossRef]
  38. Grigoratos, G.; Mathissen, M.; Vedula, R.; Mamakos, A.; Agudelo, C.; Gramstat, S.; Giechaskiel, B. Interlaboratory Study on Brake Particle Emissions—Part I: Particulate Matter Mass Emissions. Atmosphere 2023, 14, 498. [Google Scholar] [CrossRef]
  39. Mathissen, M.; Grigoratos, T.; Gramstat, S.; Mamakos, A.; Vedula, R.; Agudelo, C.; Grochowicz, J.; Giechaskiel, B. Interlaboratory Study on Brake Particle Emissions Part II: Particle Number Emissions. Atmosphere 2023, 14, 424. [Google Scholar] [CrossRef]
  40. Holman, J.P. Heat Transfer, 6th ed.; McGraw-Hill: New York, NY, USA, 1972. [Google Scholar]
  41. Friedlander, S.K. Smoke, Dust and Haze: Fundamentals of Aerosol Behavior; Wiley-Interscience: New York, NY, USA, 1977. [Google Scholar]
  42. Pui, D.H.; Romay-Novas, F.; Liu, B.Y.H. Experimental Study of Particle Deposition in Bends of Circular Cross Section. Aerosol Sci. Technol. 2007, 7, 301–315. [Google Scholar] [CrossRef]
  43. Fuchs, N.A. The Mechanics of Aerosols; Pergamon: Oxford, UK, 1964. [Google Scholar]
  44. Thomas, J.W. Gravity settling of particles in a horizontal tube. J. Air Pollut. Control. Assoc. 1958, 8, 32–34. [Google Scholar] [CrossRef]
  45. Gramstat, S.; Mertens, T.; Waninger, R.; Lugovyy, D. Impacts on brake particle emission testing. Atmosphere 2020, 11, 1132. [Google Scholar] [CrossRef]
  46. Dimopoulos Eggenschwiler, P.; Schreiber, D.; Schröter, K. Characterization of the emission of particles larger than 10 nm in the exhaust of modern gasoline and CNG light duty vehicles. Fuel 2021, 291, 120074. [Google Scholar] [CrossRef]
  47. Gramstat, S. Chapter 10–Technological Measures for Brake Wear Emission Reduction: Possible Improvement in Compositions and Technological Remediation: Cost Efficiency. In Non-Exhaust Emissions; Amato, F., Ed.; Academic Press: Cambridge, MA, USA, 2018; pp. 205–227. [Google Scholar]
Figure 1. Experimental setup for the measurement of brake particles (PN and PM) on a chassis dynamometer.
Atmosphere 14 00784 g001
Figure 2. (a) Brake housing, (b) Extended axle with the emergency wheel.
Atmosphere 14 00784 g002
Figure 3. Measurement setup on the chassis dynamometer.
Atmosphere 14 00784 g003
Figure 4. The driving profile (km/h) of the WLTC with its sub-cycles: low, medium, high, and extra high.
Atmosphere 14 00784 g004
Figure 5. Time-resolved background measurement of the PN-concentration (1/cm3).
Atmosphere 14 00784 g005
Figure 6. Measured temperatures of the right enclosed (blue) and left (red) brake disc after each of the five performed WLTC cycles (without extra high).
Atmosphere 14 00784 g006
Figure 7. Particle transport efficiency over the particle diameter (dp) for different particle densities.
Atmosphere 14 00784 g007
Figure 8. Measured brake PN emissions over the WLTC cycle, (a) full cycle, and (b) expanded view of the blue part from (a) for a more detailed insight into the occurrence of PN emission peaks.
Atmosphere 14 00784 g008
Figure 9. Measured dynamometer force (a), and PN emissions (b) of five consecutively performed WLTC cycles. The demanded WLTC velocity profile is given through the black line (v set) in both graphs.
Atmosphere 14 00784 g009
Figure 10. (a) Measured cumulated brake PN (on one of the front disc brakes) over each cycle part (low, medium, high) of the five consecutively performed WLTC cycles (without extra high). (b) PN emissions of each repetition in % of the first repetition.
Atmosphere 14 00784 g010
Figure 11. PN-emission factors (1/km) for all five performed WLTC cycles (without extra high sub cycle), as derived from measurements on one frontal disc brake. The rightmost bar shows the average value over all repetitions.
Atmosphere 14 00784 g011
Figure 12. Particle concentrations per size class for each of the two fully completed WLTC cycles.
Atmosphere 14 00784 g012
Figure 13. PN-emissions of six successively repeated WLTC initial phases (first 285 s) in all-electric (green) and hybrid (blue) vehicle operation mode.
Atmosphere 14 00784 g013
Figure 14. Total particle number (Σ) and peak values (peak) of PN-emissions as a function of the braking force (red and dark blue for hybrid mode, yellow and light blue for all-electric mode). Experiments performed by braking to standstill from an initial velocity with constant braking force.
Atmosphere 14 00784 g014
Disclaimer/Publisher’s Note: The statements, opinions and data contained in all publications are solely those of the individual author(s) and contributor(s) and not of MDPI and/or the editor(s). MDPI and/or the editor(s) disclaim responsibility for any injury to people or property resulting from any ideas, methods, instructions or products referred to in the content.

