Article

Extratropical Cyclone Response to Projected Reductions in Snow Extent over the Great Plains

1
Department of Atmospheric and Oceanic Sciences, University of Wisconsin-Madison, Madison, WI 53706, USA
2
Nelson Institute Center for Climatic Research, University of Wisconsin-Madison, Madison, WI 53706, USA
*
Author to whom correspondence should be addressed.
Atmosphere 2023, 14(5), 783; https://doi.org/10.3390/atmos14050783
Submission received: 10 March 2023 / Revised: 17 April 2023 / Accepted: 24 April 2023 / Published: 26 April 2023
(This article belongs to the Special Issue Land–Atmosphere Coupling under Climate Change)

Abstract

:
Extratropical cyclones develop in regions of enhanced baroclinicity and progress along climatological storm tracks. Numerous studies have noted an influence of terrestrial snow cover on atmospheric baroclinicity. However, these studies have less typically examined the role that continental snow cover extent and changes anticipated with anthropogenic climate change have on cyclones’ intensities, trajectories, and precipitation characteristics. Here, we examined how projected future poleward shifts in North American snow extent influence extratropical cyclones. We imposed 10th, 50th, and 90th percentile values of snow retreat between the late 20th and 21st centuries as projected by 14 Coupled Model Intercomparison Project Phase Five (CMIP5) models to alter snow extent underlying 15 historical cold-season cyclones that tracked over the North American Great Plains and were faithfully reproduced in control model cases, providing a comprehensive set of model runs to evaluate hypotheses. Simulations by the Advanced Research version of the Weather Research and Forecast Model (WRF-ARW) were initialized at four days prior to cyclogenesis. Cyclone trajectories moved on average poleward (μ = 27 +/− σ = 17 km) in response to reduced snow extent while the maximum sea-level pressure deepened (μ = −0.48 +/− σ = 0.8 hPa) with greater snow removed. A significant linear correlation was observed between the area of snow removed and mean trajectory deviation (r2 = 0.23), especially in mid-winter (r2 = 0.59), as well as a similar relationship for maximum change in sea-level pressure (r2 = 0.17). Across all simulations, 82% of the perturbed simulation cyclones decreased in average central sea-level pressure (SLP) compared to the corresponding control simulation. Near-surface wind speed increased, as did precipitation, in 86% of cases with a preferred phase change from the solid to liquid state due to warming, although the trends did not correlate with the snow retreat magnitude. Our results, consistent with prior studies noting some role for the enhanced baroclinity of the snow line in modulating storm track and intensity, provide a benchmark to evaluate future snow cover retreat impacts on mid-latitude weather systems.

1. Introduction

Northern hemisphere snow cover is, at its seasonal maximum, the largest component of the terrestrial cryosphere and exerts considerable influence on the mid-latitude atmospheric circulation through a diverse set of mechanisms [1,2]. Snow cover depresses near-surface air temperature due to increased albedo during the day and greater radiational cooling at night [3]. Its properties lead to an effective sink of sensible and latent heat [4], contributing to an increase in static stability [5,6] and a reduction in moisture flux into the atmosphere [7]. This inhibition of upward moisture flux may be responsible for the negative correlation between snow cover and precipitation observations [8] and models [9,10].
Studies have also shown that the total extent of continental snow cover is sometimes responsible for modulating upper-level circulation [9,10,11,12,13,14,15], and that accurately initializing snow cover can considerably improve sub-seasonal forecast skill [16,17]. It is because of this apparent relationship between snow cover and atmospheric circulation that the determination of the regional dependence and the temporal scales at which snow cover drives responses in the atmosphere is of fundamental importance to both short- and long-term forecasting.
Observations and hypotheses about the influence of established snow cover extent on the characteristics of ensuing synoptic weather systems may have begun with Lamb [18]. However, one of the first analyses of this relationship was provided by Namias [11], who hypothesized that the abnormally extensive North American snow cover of the winter of 1960 had contributed to the more frequent and intense cyclone development observed along the Atlantic coast by enhancing the baroclinicity between the continent and the much warmer ocean. Dickson and Namias [19] subsequently showed that periods of great continental warmth or cold in the American Southeast had a direct influence on the strength of the baroclinic zone near the coast and would affect the average frequency and positions of extratropical cyclones, drawing them further south when the region was colder. Likewise, Heim and Dewey [20] showed that extensive North American snow cover contributed to a greater frequency of cyclones in the southern Great Plains and Southeast and a reduction in the frequency of cyclones tracking further north due to displacement of storm track. From 1979–2010 in North America, cold-season mid-latitude cyclones were more frequently observed in a region 50–350 km south of the southern snow extent boundary (snow line) [21]. That study also noted a similar distribution of low-level baroclinicity around the snow line. Similarly, Carleton [22] noted a relationship between sea ice or snow cover and enhanced cyclogenesis from satellite infrared imagery.
Modeling studies have indicated a similar relationship between snow extent and extratropical cyclone statistics. Ross and Walsh [23] studied the influence of the snow line on 100 observed North American cyclone cases that progressed approximately parallel to the baroclinic zone within 500–600 km of the snow line. By measuring forecast error from a barotropic model, they determined that baroclinicity associated with the snow boundary was an important factor in cyclone steering and intensity. Wallace and Simmonds [9] performed global climate model (GCM) experiments with forced anomalously high and low extents of realistic snow cover distributions, ultimately finding a reduction in North American cyclone frequency when snow cover was more extensive with cyclones frequently occurring further south, similar to the observations of Heim and Dewey [20], owing to changes in baroclinicity induced by meridional temperature gradients. Alexander et al. [14] conducted GCM studies demonstrating that reduced snow cover led to greater absorbed solar radiation and increased latent, sensible, and longwave fluxes from the surface, leading to continental scale warming, especially in fall and spring.
The most extensive study to date is the one of Elguindi et al. [10], who used a 25 km-resolution nested domain over a portion of the Great Plains in the Penn State National Center for Atmospheric Research (NCAR) Mesoscale Model (MM5) and simulated eight well-developed cyclone cases with snow cover added throughout the domain, initializing 48 h prior to each cyclone’s arrival to the inner domain. All perturbed cyclone case simulations underwent an increase in central pressure and decrease in total precipitation with slight shifts in the cyclone trajectory that were highly variable and inconsistent but related to a reduction in surface temperature and moisture gradients at the surface and across fronts. However, this study was limited to one control and one perturbed run per case. Further, the perturbed cases were an extreme scenario of adding snow to the entirety of the inner domain rather than altering the position of continental snow cover extent, which we hypothesize here to have a larger impact on storm dynamics through changes in low-level baroclinicity in the storm track region. Here, we seek to address these deficiencies in prior studies with a focus on realistic snow cover retreat experiments across multiple perturbations and a larger number of cases.
Snow retreat is of relevance given the ongoing and projected changes in snow cover under anthropogenic climate change including over North America [24,25,26,27,28]. All studies point to reductions in North American persistent snow cover extent duration. However, there are also areas of increased snow cover and varying sensitivities depending on both temperature and precipitation trends.
Typically, simulations of projected future climate states are implemented with global climate models, which are limited by expansive resolutions over a global domain and large timesteps that do not allow the models to simulate phenomena such as cyclone-associated precipitation and its diurnal cycle as accurately as regional weather models. Harding et al. [29] demonstrated that dynamically downscaling Coupled Model Intercomparison Project Phase Five (CMIP5) simulations to 30 km resolution in the NCAR WRF model improved the simulation of precipitation, especially extreme precipitation events, in the central U.S. Many modeling studies have applied global and regional climate models to study the projected behavior of extratropical cyclones in the late 21st century [30,31], but few if any have examined the contribution made solely by the projected changes in snow cover extent.
In North America, the net effects of snow cover are nowhere more pronounced than the Great Plains region, which has the highest local maximum of snow albedo [32,33] and is where the strongest correlation between snow cover and negative temperature anomalies has been observed [20,34]. In the Great Plains region exists one of the largest disparities between local maximum snow albedo and background land surface albedo on the continent, suggesting the greatest albedo gradient across a snow line (Figure 1). The land surface is characterized by high inter- and intra-annual snow cover variability [35] and low surface roughness. Winter cyclones track over the Great Plains with high frequency due in part to areas of enhanced cyclogenesis in the lee of the Rocky Mountains [36,37,38]. The two most prolific cyclogenetic zones over the North American landmass account for the two types of cyclone tracks studied here: the Alberta Clipper track, which typically begins in Alberta, Canada and proceeds to the southeast [39], and the Colorado Low track, which starts near southeast Colorado and often proceeds northeastward towards the Great Lakes region [37]. Because of their spatial extent and frequency in the region, extratropical cyclones contribute substantially to the hydrology of the Great Plains, accounting for greater than 80% of the total winter (December through February) precipitation throughout much of the region [40].
Prior modeling studies relied on drastic reductions or increases in snow cover, limiting our ability to tease out the effect of the enhanced low-level baroclinicity within the storm track. While the pronounced effects of snow cover in the Great Plains have long been well understood and while regional modeling with snow forcing has been applied to the area [10], regional climate studies in the Great Plains focusing on projected snow extent retreat have not been performed. To address that gap, here we seek to determine whether the retreat in underlying snow cover across the Great Plains, in line with expected changes in anthropogenic climate change, results in a consistent, discernable influence on cyclone steering, intensity, and precipitation. We explored this question by conducting a broad survey of cyclone simulations with snow cover perturbed 4 days prior to cyclogenesis. Unlike prior studies, here snow cover was perturbed with multiple degrees of areal extent reductions to determine if there was any spatial or temporal relationship between snow cover perturbation and changes in cyclone intensity or track. The analysis attempted to broadly define what direct effect, if any, North American snow cover reductions due to future climate change will have on extratropical cyclone events. A greater in-depth investigation of mechanisms within two simulations from this study is presented in Breeden et al. [6].
We hypothesize that, because cyclones preferentially track along the margin of snow extent [21,22,23], cyclone trajectories in simulations with poleward-shifted snow lines will deviate poleward in kind. Because a significant proportion of moisture in extratropical cyclones can be obtained by surface evaporation, even in winter [41] and local precipitation recycling has been shown to be significant in the Great Plains [42], it is also expected that the removal of snow from the domain will alter hydrological cycling [43], leading to increases in cyclone-associated precipitation.

2. Materials and Methods

2.1. Experimental Design and Data

To test the effect of snow line position on extratropical cyclones, 20 cold-season North American cyclones (Figure 2) observed between 1986–2005 were simulated using the Advanced Research core of the NCAR Weather Research and Forecasting model (WRF-ARW) version 4.0.3 [44] with snow cover extent perturbations made consistent with future snow cover extents projected in climate models. To provide a sufficient number of cases well-distributed across seasons while balancing overall computational resource availability, four well-developed Colorado Low or Alberta clipper cyclone cases were selected from each of the months from November through March based on the observational evaluation of all mid-latitude cyclones identified by low-pressure centers through this period in daily surface and upper-level weather charts from National Oceanic and Atmospheric Administration (NOAA). The criteria of selected cases required storm trajectories over or adjacent to the Great Plains study area (bounded roughly by 35–50° N latitude, 95–105° W longitude) that resembled either the Alberta Clipper track or that of the Colorado Low with lifetimes of at least 2 days, determined by the presence of a well-defined central minimum pressure. Cases were chosen until a sufficient variety of differences in the lifetime minimum sea-level pressure (SLP) and magnitude of upper-level forcings in the form of 500 hPa vorticity advection by the thermal wind were found.
These 20 cases were then simulated with observed initial conditions and validated against sea-level pressure observations using the 32 km-spatial-resolution North American Regional Reanalysis (NARR) [45] to ensure that WRF could accurately simulate trajectory and intensity of each control case within a reasonable tolerance (trajectory of low-pressure center within ~200 km through the interior of Great Plains model domain). Of the original 20 selected cases, this qualitative validation criteria led us to select 15 of those cases (Table 1).
Alterations to the snow cover extent of each case were made by applying average poleward snow line retreat from the 20-year periods of 1986–2005 (historical) to 2080–2099 (projected) for each of the five months examined in this study at the start of the simulation (for cases analyzed in the results, four days prior to mid-latitude cyclone). Projected snow line retreat was determined by examining the grid cell snow mass change in 11 CMIP5 [46] models wherein daily snow mass data were available, and experiments were conducted with two Representative Concentration Pathway forcings: RCP4.5 and RCP8.5 [47] (Table 2). Grid cells were identified as snow-covered if their simulated snow mass was at least 5 kg m−2, which corresponds to typically 5 cm of snow depth (assuming a 10:1 snow to water ratio), sufficient to cover the surface. We did test other thresholds and did not find a strong sensitivity to this choice in the projected snow cover maps. The southernmost grid cells were considered to comprise the snow line if the 5-degree span to the north of a cell had an average snow mass exceeding that threshold. This threshold was employed in order to exclude outlying southern patches of snow. To limit artifacts that arose from small-scale variability in snow cover, a 600 km moving-window average was then applied to all derived southern extents of snow cover, hereafter referred to as the “snow line”.
Using these criteria, then for each month, the 20-year average snow line of the historical and projected periods was calculated, and the amount of projected snow line retreat was calculated from west to east in discreet bins across North America. As cases take place on a 30 km-horizontal-resolution model grid, each 30 km zonal coordinate was assigned values of poleward snow retreat from the averaged, derived values for each month and perturbation condition. Since each GCM experiment has differing numbers of realizations, initializations, and physics options, we combined these in a “one model, one vote” scheme for calculating snow retreat. With snow line retreat calculated for both RCP forcings for each of the 14 models, each month then contained 28 poleward snow line retreat values from which the 10th, 50th, and 90th percentiles were extracted (Table 3, Supplemental Figures S1–S3).
The modeling effort involved simulating each of the 15 validated mid-latitude cyclone cases with a control case (observed snow cover as initialized in North American Regional Reanalysis boundary condition) and three snow line perturbation boundary conditions (10th, 50th, and 90th percentile, P10, P50, P90), at four days prior to cyclogenesis, where liquid snow cover on the ground was reduced to zero. We also conducted simulations with initialization times from 0–3 days prior to cyclogenesis to evaluate consistency and internal variability, but here we focus on the results of four days prior to allow for atmospheric adjustment while still allowing for examples where the model realistically captures cyclone trajectory in the control cases (Supplemental Figure S4). An additional set of simulations with all snow removed was also performed as a test response case and archived in the model output repository, but not directly analyzed here (except in the tests of initialization times).
Control simulations were run for all 15 cases. The remaining runs imposed the three projected snow line changes to determine the degree to which the position of the snow line alone influences cyclone behavior. Snow lines for perturbed simulations were determined by applying values of snow line retreat to corresponding 30 km bins of the snow lines, as determined by the method above, for each case and removing all snow south of the new snow line except at altitudes greater than 2000 m, where snowpack may persist even in warmer climates, as concluded by Rhoades et al. [48]. It should be noted that the removal of all snow south of the assigned snow line creates a discontinuous step change in snow depth, a hard margin that is not necessarily characteristic of real snow extent boundaries.

2.2. WRF Model Configuration

WRF-ARW simulations were executed in a domain comprising the continental United States (CONUS), central and southern Canada, northern Mexico, and much of the surrounding oceans. The WRF-ARW has previously been shown to be reliable in simulating seasonal temperature and precipitation dynamics over the United States [49], with biases in line with other mesoscale numerical weather models [50]. We ran WRF-ARW with a 30 km horizontal resolution, a 150 km buffer zone on each side, and 45 vertical levels (Figure 3). Initial and lateral boundary conditions were derived from 3 h NARR data provided by NOAA at https://www.esrl.noaa.gov/psd/ (accessed on 10 April 2023). Version 4.0 of WRF offers a “CONUS” suite of physics options, which was used in this experiment and appears to accurately reproduce large-scale circulations [51]. The Noah Land Surface Model (Noah LSM) [52] was altered to reduce surface snow accumulation to zero during simulations in order to avoid new snow accumulation prior to the arrival of the cyclone of interest into the area without removing precipitation in the atmosphere. The Noah LSM uses a single-layer snow model and calculates snow albedo according to the method developed by Livneh et al. [53], which calculates the albedo of the snow-covered portion of a grid cell as
α s n o w = α m a x A t B
where αmax is the maximum albedo for fresh snow in the given grid cell (established by data from Robinson and Kukla [24]), t is the age of the snow in days, and A and B are coefficients which are, respectively, 0.94 and 0.58 for periods of accumulation and 0.82 and 0.46 for periods of ablation. Coefficients A and B were set to the accumulation phase for simulations in every month, except for March, when the snow was considered to be ablating, consistent with Livneh et al. [53].
We did not incorporate ensemble simulations as might be needed in global general circulation model experiments (e.g., Hawcroth et al. [54]), as natural variability in a regional climate model is partly constrained by nudging at lateral boundaries. We did not apply any spectral nudging to the large-scale fields aloft beyond the nudging along the lateral boundary conditions. This approach allows the model to fully generate atmospheric feedback responses to modified snow experiments without being nudged back to the reanalysis state. Our analysis of cases with earlier initialization times showed consistency in key statistics (e.g., cyclone trajectory deviation and maximum pressure change) after 2 days of initialization (Supplemental Figure S4), so we focused our results here on 4 days of initialization. We used a single physics parameterization, WRF CONUS convection-permitting physics suite, https://www2.mmm.ucar.edu/wrf/users/physics/ncar_convection_suite.php (accessed on 25 April 2023) that reasonably replicated the observed storm trajectory in each of the control cases. These are the same physics parameters as the National Weather Service (NWS) uses to create their United States national forecasts.

2.3. Analytical Methods

Several tracking methods have been proposed for cyclones, as reviewed in Rydzik and Desai [21]. Here, cyclones were tracked by defining the center as the local SLP minimum and following it as the cyclone proceeds. Recording changes in storm trajectory between two simulations of the same cyclone case was performed by calculating the mean meridional trajectory deviation (MTD), which is the sum of the absolute north–south deviation distance between the two storm centers (perturbed/control) at each corresponding time step divided by the number of time steps. Because each model time step was 3 h, the MTD was expressed in km 3 h−1.
The examination of precipitation amount and type involved isolating storm-associated precipitation using the method introduced by Hawcroft et al. [54]. For each time step, it is assumed that precipitation attributable to any cold-season cyclone simulation occurs within a 12° radial cap of the storm center, as indicated by Hawcroft et al. [54] for the cold season. Analyzing the precipitation quantity of a cyclone’s lifetime required determining precipitation amounts and types from within the radial cap at each time step and disregarding those values outside of it. Precipitation quantities per grid cell were then summed across the radius and all the time steps in terms of units of total meters of enhancement.
To study broad changes in wind speed, we determined the integrated kinetic energy of each simulated cyclone using a variant of the method first proposed by Powell and Reinhold [55]. Integrated Kinetic Energy (IKE) is determined by integration of volume (V) of the bottom model layer (approximately 900 hPa) based on wind speeds (U) and assuming a constant air density (ρ) of 1 kg m−3,
IKE = V 1 2 ρ U 2 d V  
As with storm-associated precipitation, IKE is only calculated within a 12° radius of the storms’ pressure minima. ΔIKE then represents the normalized ratio of control to corresponding perturbed simulations.

3. Results

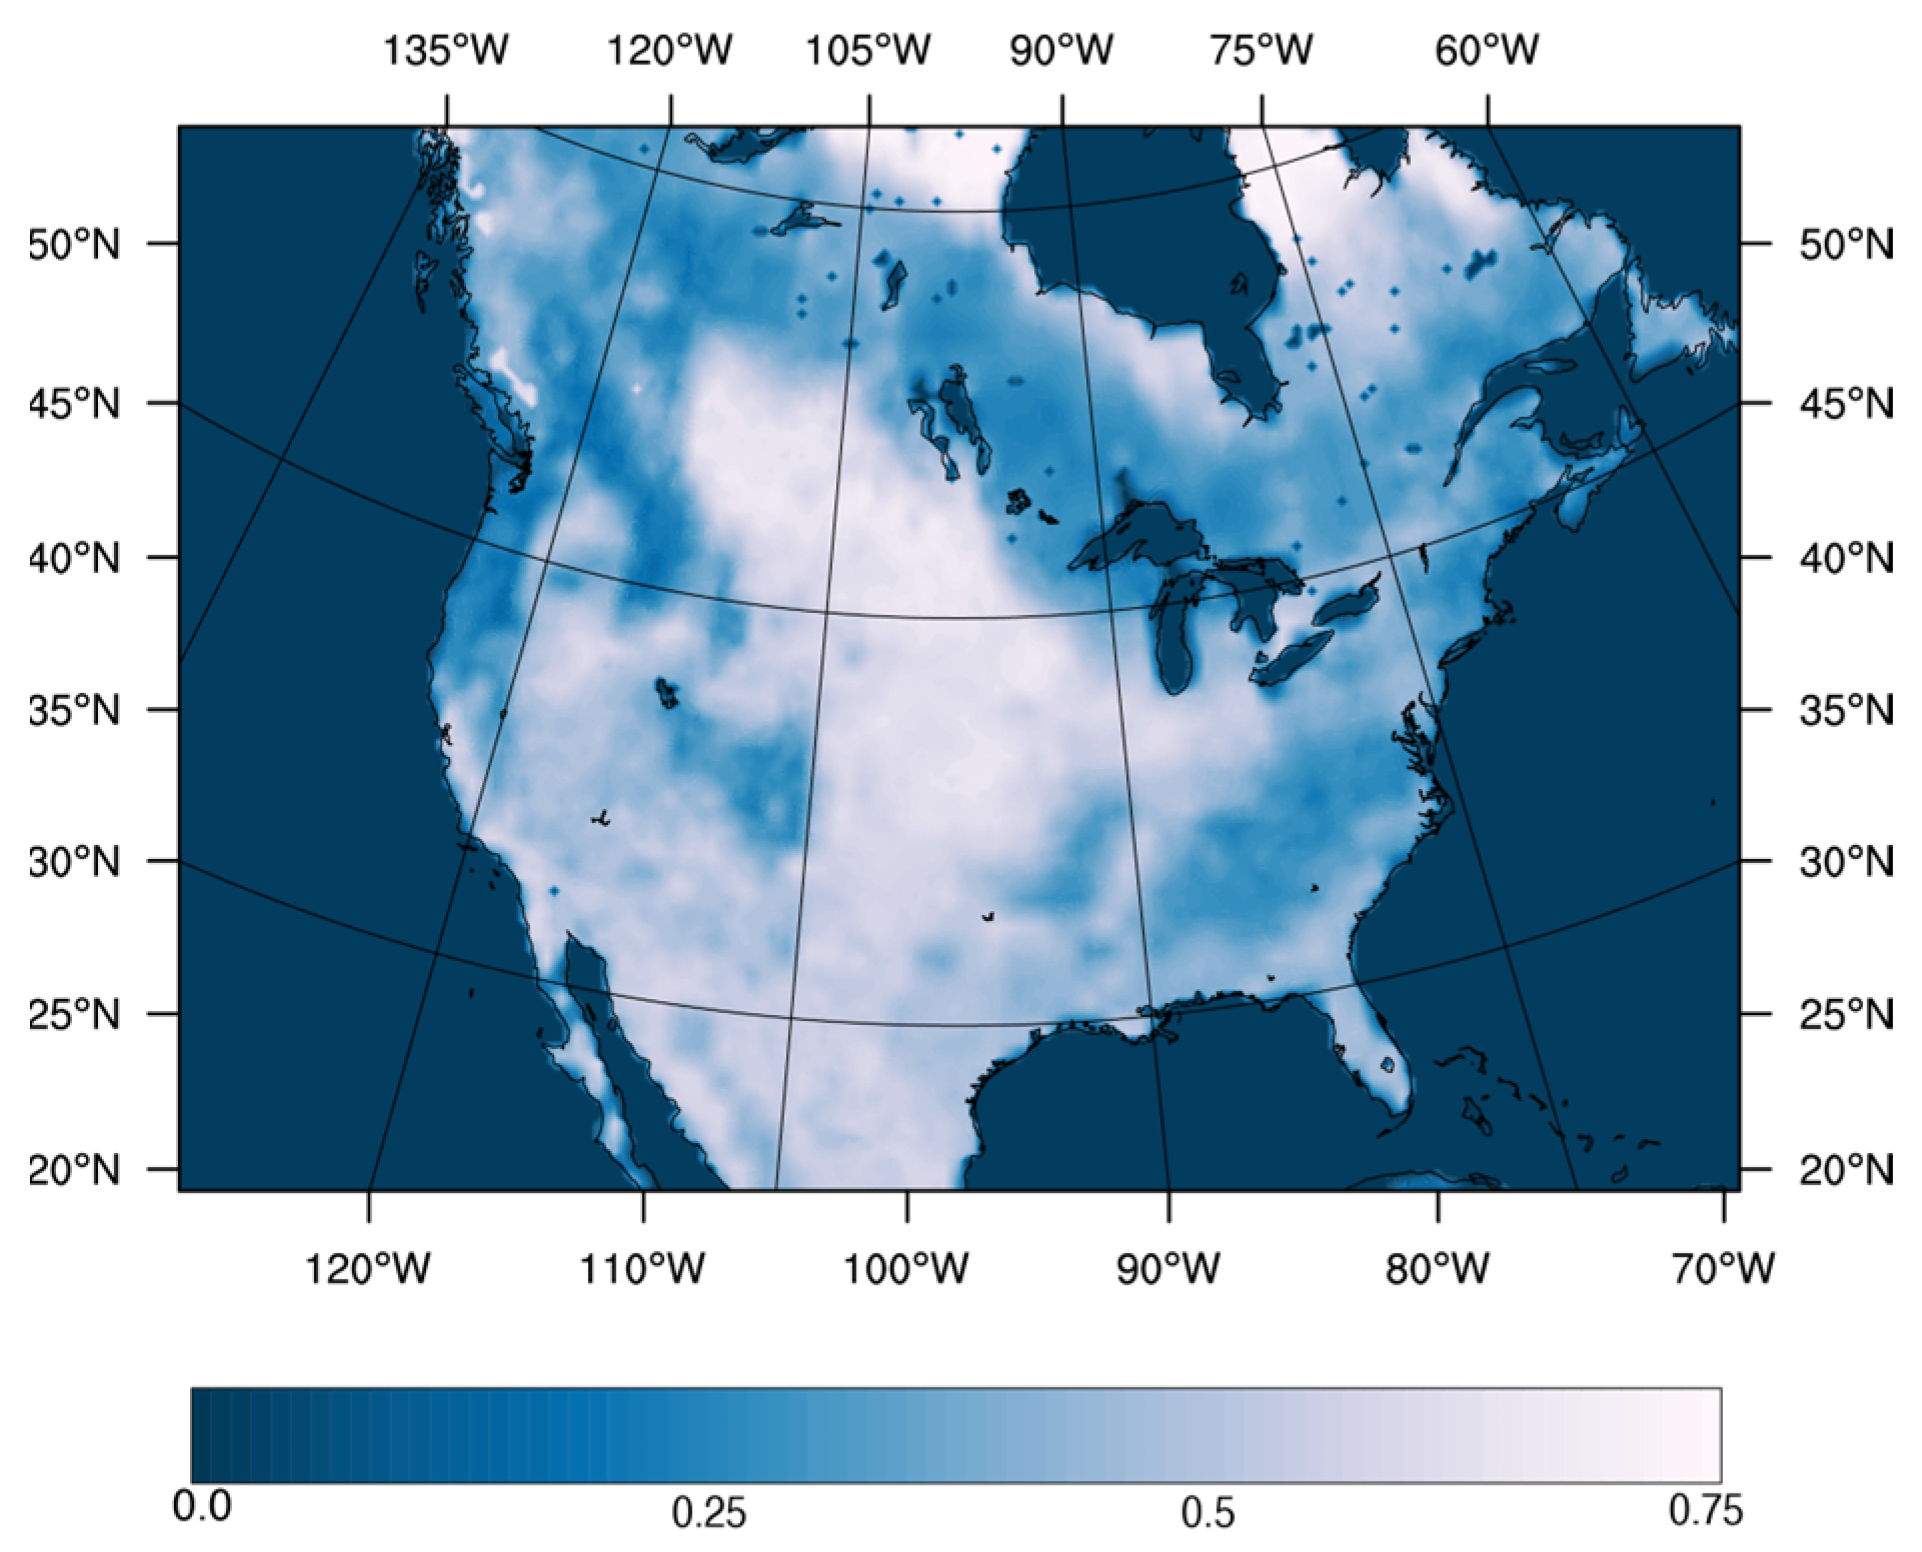
3.1. Snow Cover Trends

Before snow extent changes could be applied to the model initialization data for perturbation experiments, a survey was conducted of the selected CMIP5 models to determine the mean poleward snow line retreat from the 1986–2005 period to 2080–2099 in the span east of the Rocky Mountains and west of the Atlantic coast of North America (105° W to 55° W). The mean retreat of both RCP experiments for each of the models is shown for each of the cold-season months in Figure 3, with case-specific results in Supplemental Figures S1–S3. Snow retreat differences among the models were large, although some trends were clear. All models for both experiments in all months showed a projected poleward shift in snow cover extent, with a minimum average retreat in January of 51 km and a maximum in November of 1025 km. The models showed that the shoulder months of November, December and March experienced greater retreat than the mid-winter months of January and February.
Generally, simulations of the RCP8.5 experiment yielded significantly greater snow line retreat than RCP4.5 (p < 0.01). February had the lowest standard deviation of snow line retreat across the models over both RCP experiments at 175 km, which was comparable to January and March with 185 km and 183 km, respectively. The early winter months had higher across-model standard deviations at 219 km and 210 km for December and November, respectively, implying less consistent agreement among the models for snow line retreat in autumn over mid-winter.

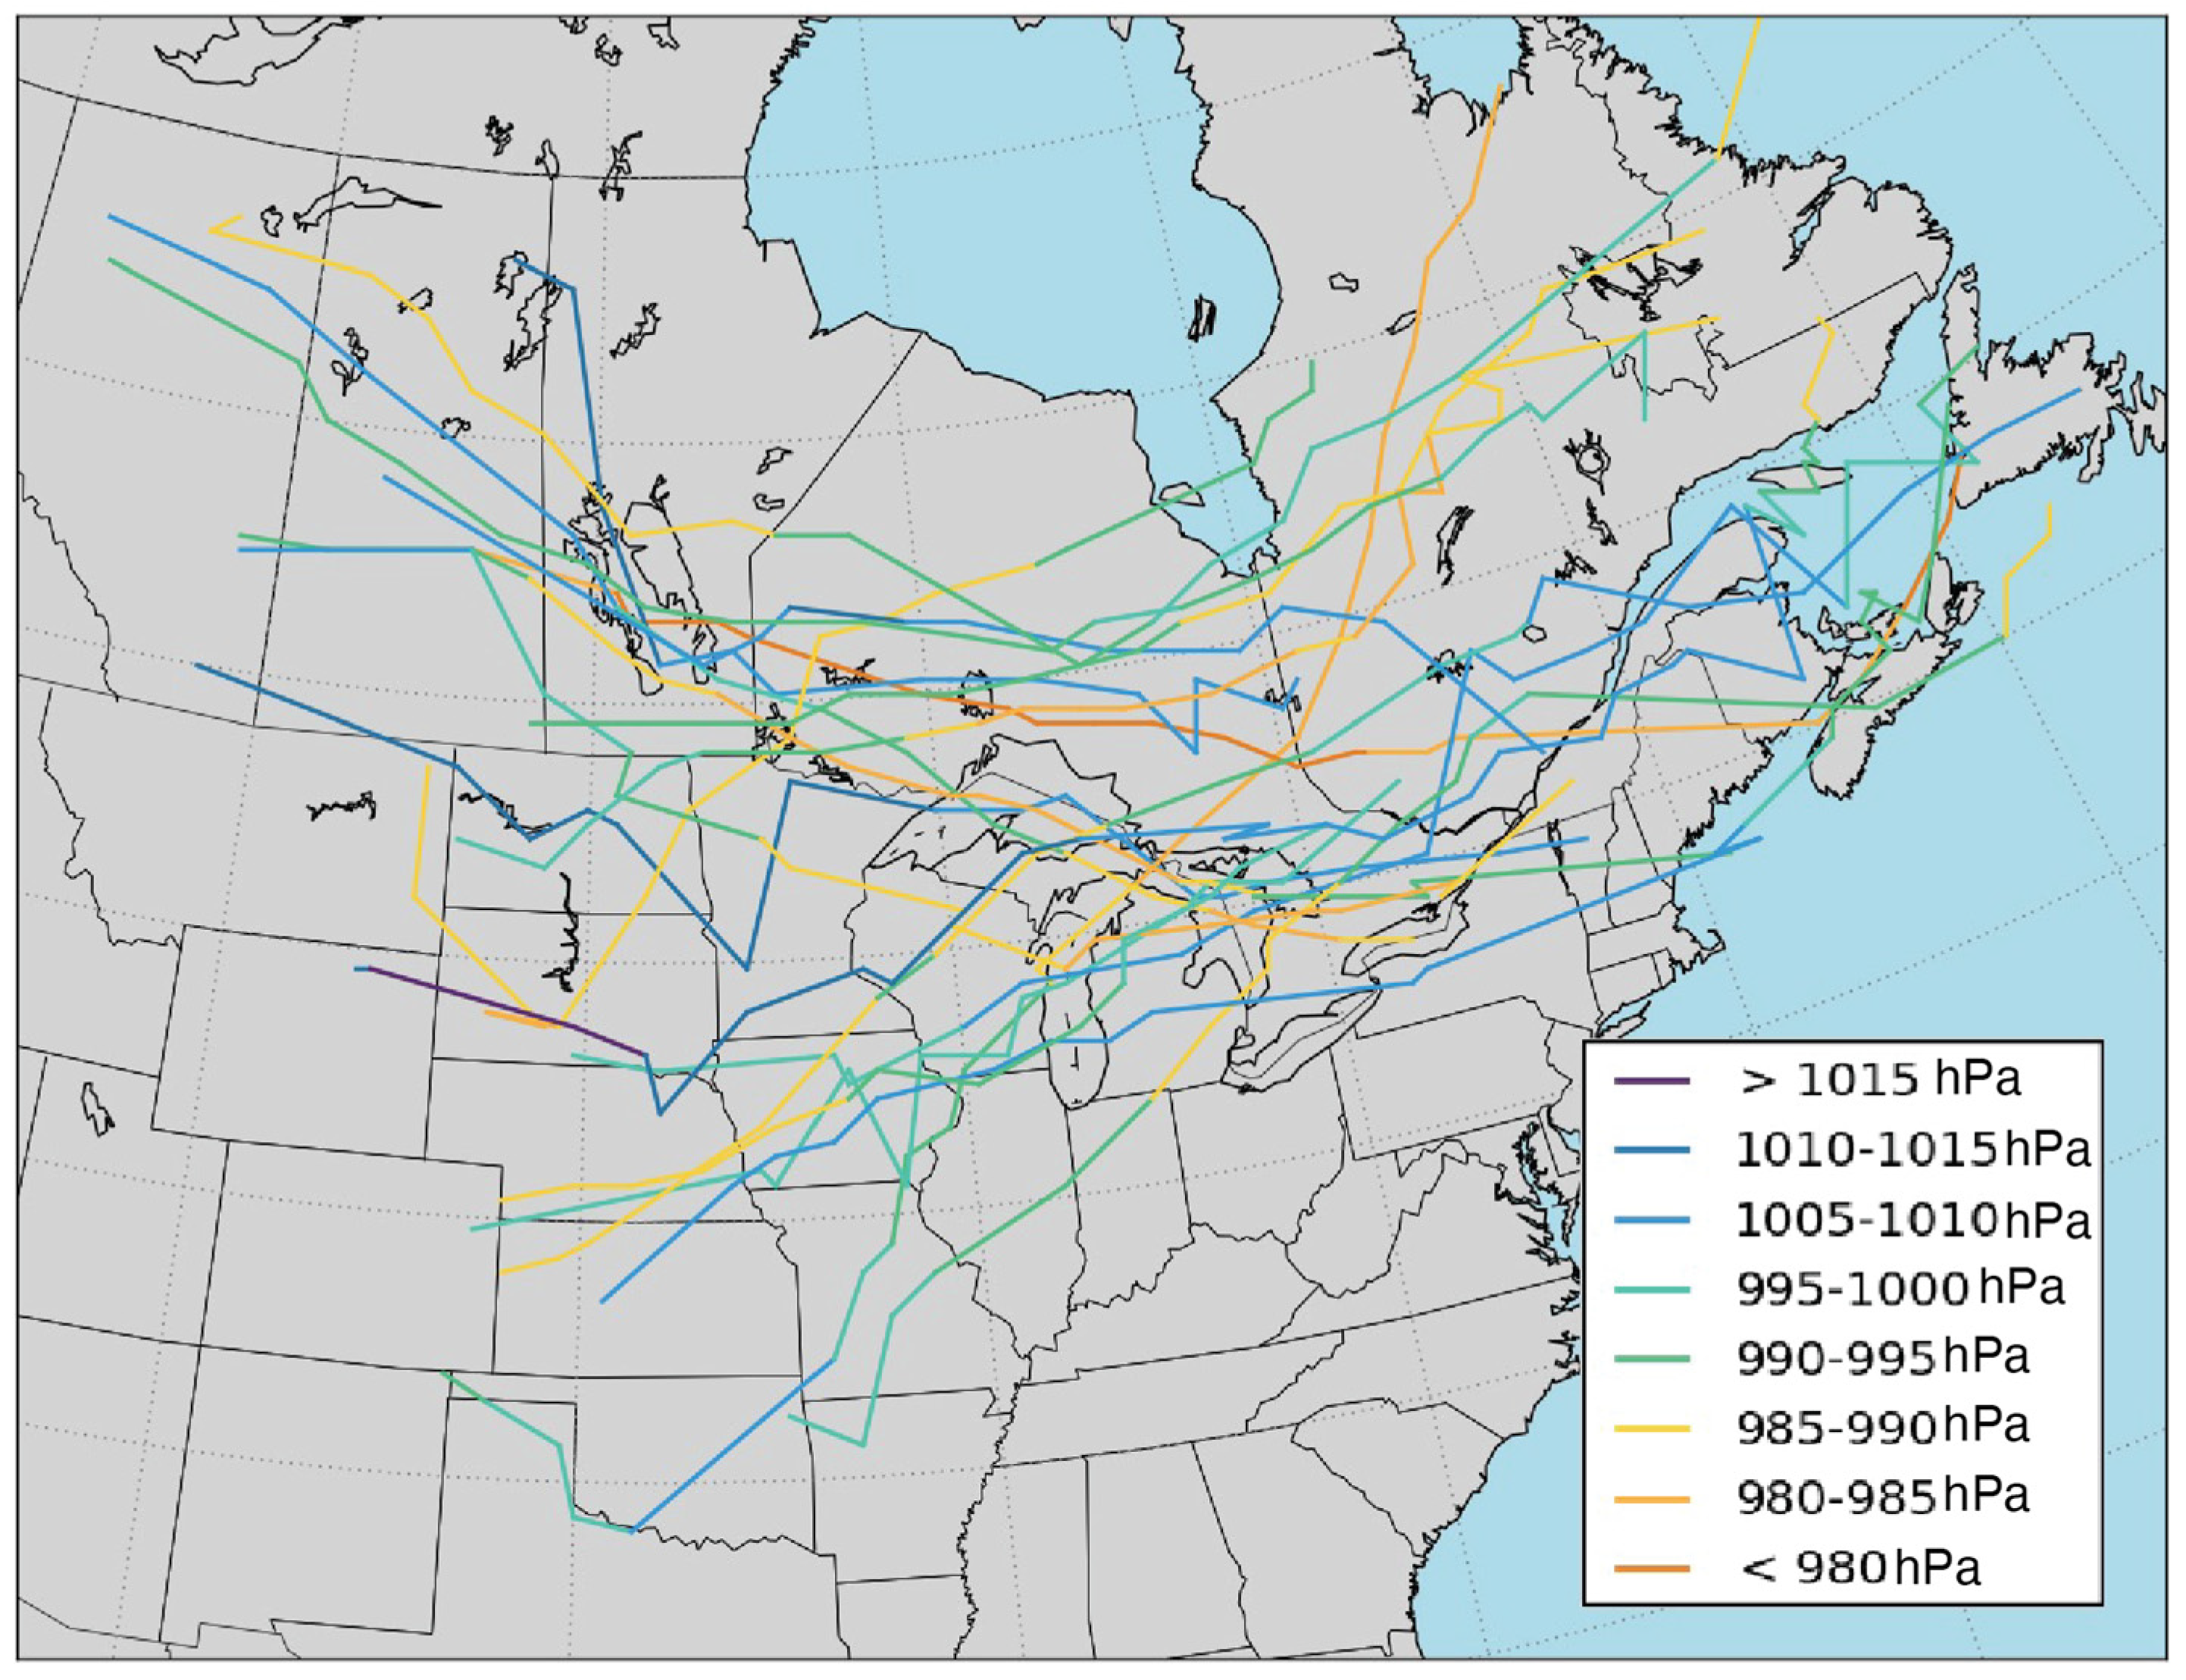
3.2. Cyclone Trajectory

As noted, in 15 of the 20 cases, the control run faithfully reproduced the observed cyclone trajectory, which is generally true for the more well-defined cyclones. The perturbation cases were then compared to these control runs (Figure 4, Figure 5 and Figure 6). Cyclone track shifts in response to imposed snow cover extent shifts, expressed as mean trajectory deviation (MTD), were quite small, often less than the domain grid spacing of 30 km (71% of the time), and only infrequently did they exceed two entire grid spaces, indicating that cyclones in the perturbed simulations faithfully followed their control counterparts with only minor exceptions (Figure 7). The MTD reflects an average deviation, but as the figures show, the actual track at any one time step may deviate much more. The difference in cyclone track was also not related to cyclone type (e.g., Alberta Clipper and Colorado Low cyclone). Although the simulated responses of these cyclones to reductions in snow extent may be regarded as small, they were not always devoid of significance. The largest trajectory deviations occurred in the late-season Clipper system (6 March 1987) case with 50th percentile snow removal (Figure 6b). Deepest pressure changes also occurred in the late-season Rocky Mountain Low (22 March 1994) but with 90th percentile snow removal (Figure 6f). This case had the greatest absolute pressure deepening among all the other cases for all levels of snow removal (Figure 7).
Plotted together according to total area of snow removed (Figure 8), the MTDs of each perturbed simulation cyclone presented a significant positive linear relationship (r2 = 0.23, p < 0.01, two-tailed t-test) with the area of snow removed. The strength and slope of the relationship increased when limited to simulations in mid-winter (r2 = 0.59, p < 0.01). Average MTDs were smallest in early winter (Nov-Dec, average MTD (μ) = 17.3 km 3 h−1), with larger MTDs in mid-winter (μ = 25.2), and the strongest changes in late winter (μ = 37.8). The relationships also increased in correlation with simulation lead time, although only marginally (Supplemental Table S1). Deviations from the snow line were nearly equally distributed poleward and equatorward.

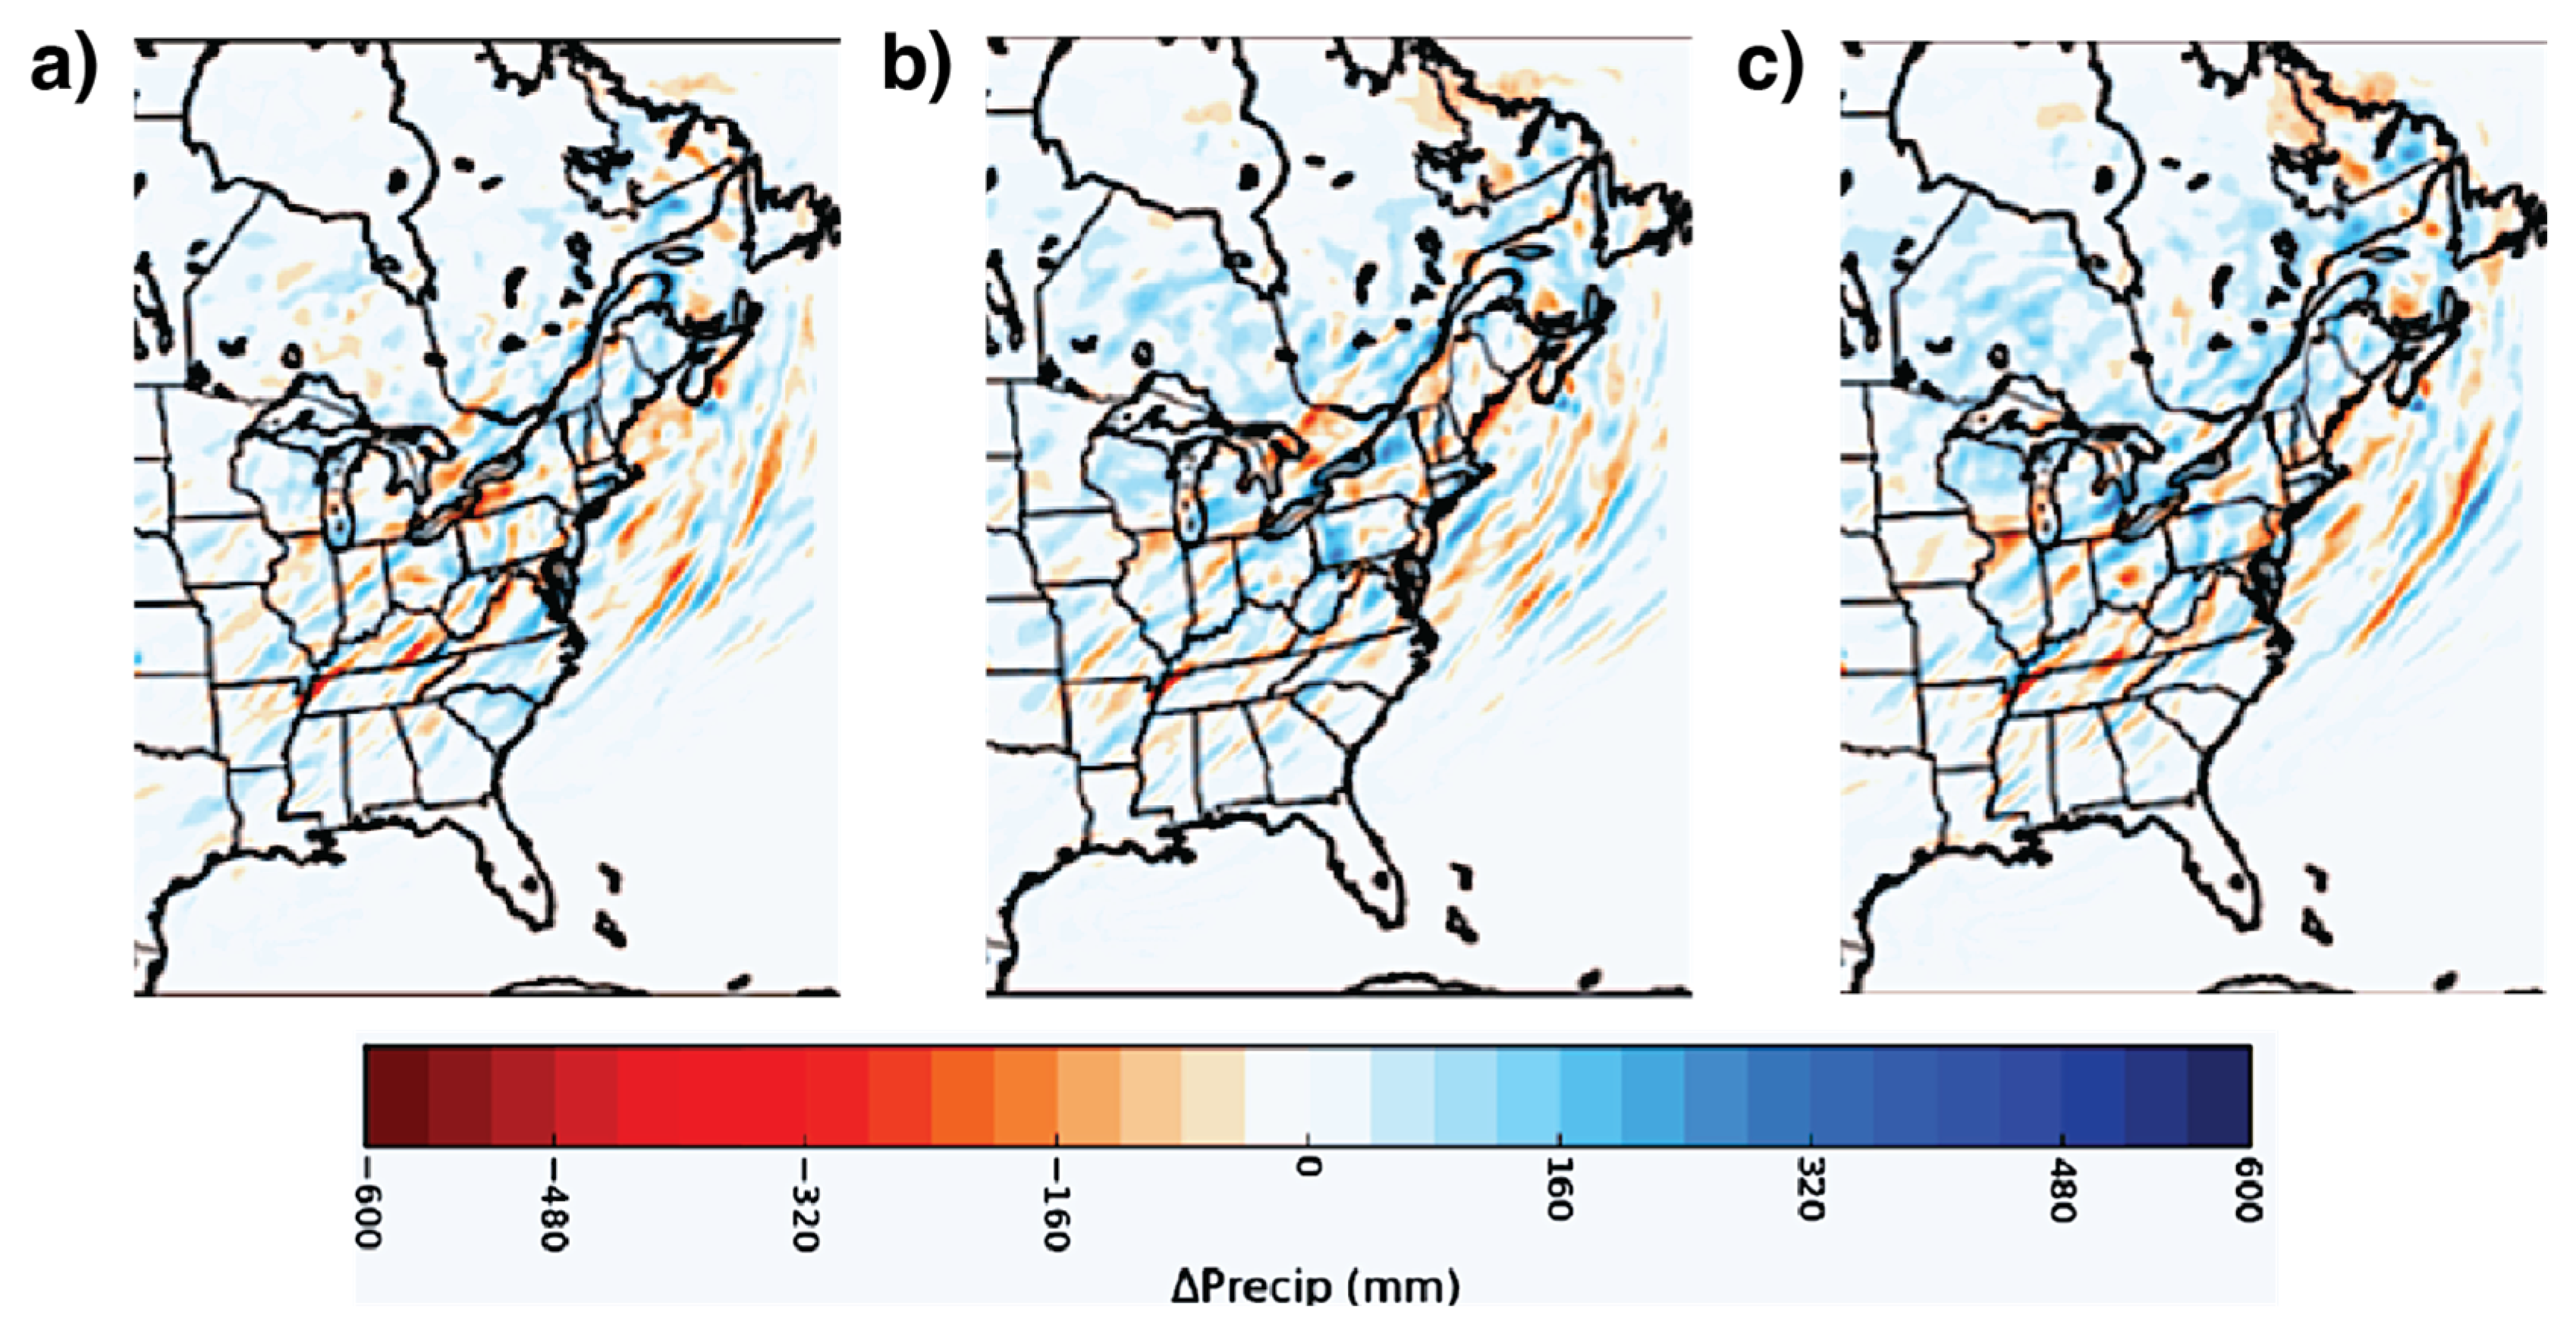
3.3. Cyclone Characteristics

Across all simulations, 82% of the perturbed simulation cyclones decreased in average central SLP compared to the corresponding control simulation, however slightly, and every perturbed simulation cyclone experienced a significant difference in central SLP compared to the control at some point in their lifetime (Supplemental Table S2). Most central SLP differences present in perturbed simulations, like those in the analysis of the MTDs, were small. The magnitude of the mean change in cyclone lifetime central SLP averaged −0.21 hPa and the average simulation maximum pressure change was −0.48 hPa, with only two cases where the pressure deepened by at least 2 hPa above the control (Figure 4b). There was a significant linear relationship between the decrease in minimum SLP and snow removal extent (r2 = 0.17, p < 0.01). No significant difference in slope was found by season, but the largest pressure changes were found in late winter. Cyclones in transit over the region where snow had been removed deepened, on average, 2.5 times as much as others and nearly 4 times as much as those that remained over snow (p < 0.01). The maximum pressure decrease was also correlated with the MTD (r2 = 0.395, p < 0.01).
Most perturbed simulations experienced a positive ΔIKE over their lifetime compared to the control runs. One exception was for IKE to decrease at the higher snow removal amounts, particularly in the early season. At the 90th percentile of snow cover reduction, almost all the early-season storms experienced a mean reduction in IKE of 1–3%. Simulations in every other season and snow removal scenario intensified by a similar amount.
Among the perturbed simulations, 86% of cases experienced an increase in cyclone-associated precipitation (Figure 9a). The mid-season cases had the weakest responses to the snow cover perturbations with the lowest mean change in domain-integrated precipitation. However, there was no significant relationship between snow removal extent and precipitation change. In many perturbed simulations, the phase of the precipitation changed from snow to rain in up to 2% of grid cells, in southern latitudes and often near the original snow line, linked to the increase in air temperature, but again no clear relationship with snow removal existed among the experiments (Figure 9b). More of the overall increase in precipitation across the domain fell as rain than as snow.
Changes in the volume of precipitation were regionally dependent. In response to a poleward retreating snow line, cyclone-associated precipitation increased substantially across regions where snow was removed and across northern latitude regions downstream of the Great Plains. Meanwhile, southern regions experienced decreases in total precipitation, and the intensity of overall precipitation changes increased with greater snow removal, even if the average change was unaffected (Figure 10). The locations and amounts of enhanced precipitation appeared to be largely dependent on whether snow had been removed in that area, but additional precipitation was also generated over snow near the perturbed snow line and not as commonly over areas continuing to remain snow-covered. The “all snow removed” cases were used to quantify the overall effect of snow removal on precipitation. In those cases, the average increase in precipitation per grid cell experiencing an increase was 1 mm, while the average decrease in grid cells experiencing a reduction was 0.05 mm.

4. Discussion

The projected poleward retreat of the southern margin of North American snow extent, calculated by comparing averages of historical (1986–2005) and late twenty-first century (2080–2099) snow lines, is substantial, but in some cases maintains the snow line close to the storm tracks in our case study. Surprisingly, unlike our observations in Rydzik and Desai [21], applying the storm retreat in an experimental simulation to historical cyclone cases often resulted in limited changes to cyclone trajectory or central minimum SLP. It is possible that our control case selection and validation criteria may have led us to exclude weaker cyclone cases where cyclone responses to surface forcing may be more pronounced [21]. However, there is evidence that this limited model response is typical and demonstrates how multiple processes interact to limit the influence of stability and baroclinity changes of the surface on mid-latitude cyclone dynamics.
The changes made to underlying snow cover did produce responses to the cyclones’ total kinetic energy and the storm-associated precipitation within a broad radius of the storm center. These effects are further explored in Breeden et al. [6], where two cases studied here are diagnosed in further detail. A potential vorticity budget analysis reveals that snow removal led to lower heights in the center of cyclones, which strengthened the circulation and potentially enhanced moisture advection, particularly from the Gulf of Mexico. However, the snow removal also led to an opposing effect in the responses of stability and relative vorticity, which muted the overall response of the mid-latitude cyclone deepening and precipitation enhancement. These competing physical mechanisms at least partly explain the modest responses of the examined extratropical cyclones in the current paper to imposed snow line retreat. The work here across multiple cases, seasons, and storm types suggests that this mechanism is likely common across many cases, requiring some level of imbalance in these competing mechanisms to allow for snow cover position to strongly influence cyclone characteristics, as has been observed.
Nonetheless, some common responses were observed across the simulations. Storm-associated precipitation had the most robust response to snow removal, with the highest percentage of perturbed simulations yielding greater amounts of either solid or liquid precipitation. This outcome agrees with many previous studies that found an increase in precipitation amount and intensity in the Northern hemisphere by the late 21st century (e.g., [31]). This result is not a reflection of the Clausius–Clapeyron relationship whereby a warming climate drives increases in evaporation and atmospheric water vapor, but rather it is due to the removal of snow from the surface and its effect on increasing the lower atmosphere temperature. This finding supports observations made by previous authors [10,11] that snow cover has a negative relationship with precipitation from overhead extratropical cyclones, and agrees with climate model simulations noting increases in precipitation extremes from extratropical cyclones because of thermodynamic responses to increased diabatic heating [54,56,57]. The presence of snow cover has been linked to a reduction in moisture flux [7,28] and an increase in static stability [5,6], thus its removal promotes evaporation and instability, an effect consistent with our results. This effect is also consistent with findings of the impact of the Great Lakes on surface turbulent flux enhancement and SLP decreases in winter [58]. We can therefore presume that the increases in precipitation shown here represent only a portion of the increased precipitation for which climate change will be responsible and that the poleward migration shown is likely to be more intense.
The cyclone-integrated kinetic energy (IKE), a measure of boundary-layer wind speed associated with the storm, also had noteworthy responses to snow removal in our simulations, an effect not previously evaluated in depth. While the relative magnitude is small, this effect represents a large total net increase in energy over the storm lifetime. A large majority of cyclones in the perturbed simulations intensified, related to changes in the surface energy budget that influence boundary-layer wind profiles. These results are a consequence of snow removal, but the effect may be mitigated in future climates by reduced baroclinicity arising from polar amplification [59,60], leading to overall reductions in extratropical cyclone wind speed by the late 21st century. We hypothesize that the kinetic energy increases in the absence of cyclone deepening in terms of central pressure are occurring because of increased anticyclonic development at the peripheries, although this hypothesis requires further exploration.
Our modeled mean trajectory deviations (MTD) were typically smaller than those found in observational studies [21]. The MTD measures the amount of deviation from the control in perturbed simulation cyclone trajectories and averages over the cyclones’ lifetimes. Because the majority of cyclones in perturbed simulations did not deviate from the control for most of their courses, most MTDs were measured as less than the length of the domain grid spacing of 30 km. However, that length does not preclude that during some portion of storm trajectory, significant deviations occurred. Rather, over the lifetime of the storm crossing our perturbation domain, the net deviations averaged to be small. Directional MTDs considering deflection toward the North Pole or the perturbed snow line were inconsistent, with few outliers.
The study by Elguindi et al. [10] wherein snow was added to a Great Plains nested domain two days prior to cyclone arrival generated similar trajectory outcomes, with deviations in perturbed cases only rarely exceeding 100 km. The trajectory deviations in these tests, like our own, varied substantially. It is reasonable to infer that those differences in trajectories between control and perturbed cyclones included both a forced response from the change in boundary condition, along with chaotic reactions to considerable energy disturbances caused by changes in surface conditions over extensive areas in advance of the cyclone, obscuring the functional responses to the specific positioning of snow cover, potentially requiring an ensemble model approach in future work. However, our approach of averaging across cases and examining sensitivity in multiple cases helps to distinguish the forced response from natural variability while also maintaining a snow line where we might expect enhanced low-level baroclinicity. The finding of limited trajectory changes stands in contrast to significant cyclone responses to snow anomalies found by multiple observational studies (e.g., [19,20,21] as well as modeling performed by Ross and Walsh [23] and Walland and Simmonds [9], perhaps owing to the misattribution of natural variability to a functional response.
Like MTDs, changes to cyclones’ central low SLP due to a retreating snow line were minimal but consistent in sign. This change, however, differed from the results of Elguindi et al. [10] who found an average positive difference of 4 hPa in response to expanded snow cover, a value which only two simulations in this whole study exceeded. Perhaps this can be attributed to the fact that they added snow as opposed to removing it, or to the physics of the MM5 model compared to that of WRF-ARW. Additional tests of physics parameterizations including of land surface model parameters, boundary-layer scheme, and radiation scheme may help to resolve differences and provide additional insight into the sensitivity of results to boundary-layer thermodynamics. Even with the disparity in the magnitude of pressure changes, their discovered trend of central pressure increasing when snow is added is complemented by the findings of this study where snow removal generally contributed to a decrease in central pressure, suggesting no hysteresis response. The deeper central low SLP while in transit over regions where snow had been removed corroborates the conclusion of Elguindi et al. [10], who noted that snow cover prevents the deepening of mid-latitude depressions by reducing warm-sector temperature and moisture gradients and weakening surface convergence and fronts. This finding is also consistent with climate model projections of increasing cyclone intensity and precipitation extremes in future warmer climates, especially over land [61,62].
Seasonal differences showed a stronger response in mid- and late season, although we recognize there were a limited number of cases (5) per season studied (early, mid, late) to make strong claims. Generally, the responses of most investigated variables were greatest in mid-season, weaker in late season (with the exception of mean MTD), and weakest in early season. This is counter-intuitive to the inspection of snow line retreat and inconsistent with the argument that albedo feedback is the dominant driver. If anything, there is an inverse relationship between the amount of mean retreat and the response of cyclones to the correspondingly shifted snow lines. However, it has been shown that the surface temperature effect of snow cover is strongest in late winter, likely a result of stronger solar radiation enhancing albedo effects [23]. These responses suggest a greater focus on seasonality, and net albedo change may help refine our understanding of snow extent on mid-latitude cyclones.

5. Conclusions

Fifteen cold-season extratropical cyclones over or near the North American Great Plains were examined in a series of simulations with varying percentiles of snow retreat consistent with 21st century climate model projections and differing model initialization lead times in order to gauge the dependence of their trajectories, intensities, and associated precipitation on underlying snow cover and experimental design. When a realistic retreat of snow cover consistent with climate-warming scenarios [63] was applied to these cases, with more than two days of lead time, a majority of cyclones experienced a small decrease in SLP (82%), consistent increases in precipitation (86%), modest increases in kinetic energy, and limited changes in overall trajectory (mean of <30 km). These results were muted compared to the expectations following observational studies such as that of Namias [11] and Rydzik and Desai [21] but reflect the results of modeling performed by Elguindi et al. [10], manifesting a continued disagreement among models and observations. Compared to earlier studies, our study confirmed that the model results are robust with respect to the assumptions about varying levels of snow cover retreat, initialization time, and type of mid-latitude cyclone.
It is yet unknown why the cyclone trajectories did not adhere more closely to the shifted snow lines, as the findings of observational studies suggest. Weaker responses to the removal of snow cover at the time of cyclogenesis suggest that the presence or absence of the snow margin had a minor or counteracting effect, or alternatively, modeled land-atmosphere feedbacks were weak or constrained by other processes. Trajectory deviation, pressure change, and precipitation intensified with greater lead time, stabilizing in most statistics after 2 days of lead time for model initialization and boundary forcing change, similar to Elgundi et al. [10]. The model fidelity for simulating snow albedo has also been called into question [64], and new approaches have been developed [65]. The full extent of the snow margin’s influence cannot be determined until longer case study simulations with more ensembles are executed across multiple boundary-layer and surface physics parameterizations.
Lingering questions remain regarding the mechanisms of snow cover SLP, differences among cases in surface energy balance and radiative properties, and their influence on cyclone dynamics and upper-level dynamics. Some of these, especially upper-level dynamics, are studied in individual cases in detail in a companion paper [6]. Given prior reported significant snow-atmosphere feedback hotspots in central North America, continued analysis of its impact on storm tracks is warranted, including over a larger number of cases [66,67]. The simulation model outputs here provide a rich data set for future evaluation and are provided at the archive below for public access [68].

Supplementary Materials

The following supporting information can be downloaded at: https://www.mdpi.com/article/10.3390/atmos14050783/s1, Figure S1: Observed snow extents, 10th percentile; Figure S2: Observed snow extents, 50th percentile; Figure S3: Observed snow extents, 90th percentile; Figure S4: Impact of model lead time; Table S1: Average MTD; Table S2: Pressure decrease.

Author Contributions

Conceptualization, A.R.D. and R.M.C.; methodology, R.M.C., A.R.D., M.N. and S.J.V.; data curation, A.R.D.; writing—original draft preparation, R.M.C.; writing—review and editing, A.R.D., J.E.M., S.J.V. and M.N.; funding acquisition, A.R.D. All authors have read and agreed to the published version of the manuscript.

Funding

This research was the University of Wisconsin Office of the Vice Chancellor for Research and Graduate Education Fall Research Competition and the National Science Foundation (NSF AGS-1640452).

Institutional Review Board Statement

Not applicable.

Informed Consent Statement

Not applicable.

Data Availability Statement

Model output from cyclone simulations is archived at the Environmental Data Initiative at doi:10.6073/pasta/62b867bfd53d3d87ba294564ca363bd4 [68].

Acknowledgments

Specialized computing resources have been provided by the University of Wisconsin Center for High Throughput Computing. We also thank contributions by and discussions with G. Bromley of Montana State University, M. Rydzik of Commodity Weather Group, and H. Miller of University of Kentucky.

Conflicts of Interest

The authors declare no conflict of interest.

References

  1. Leathers, D.J.; Ellis, A.W.; Robinson, D.A. Characteristics of temperature depressions associated with snow cover across the Northeast United States. J. App. Meteorol. Climatol. 1995, 34, 381–390. [Google Scholar] [CrossRef]
  2. Vavrus, S. The role of terrestrial snow cover in the climate system. Clim. Dyn. 2007, 29, 73–88. [Google Scholar] [CrossRef]
  3. Baker, D.G.; Ruschy, D.L.; Skaggs, R.H.; Wall, D.B. Air temperature and radiation depressions associated with a snow cover. J. Appl. Meteorol. Climatol. 1992, 31, 247–254. [Google Scholar] [CrossRef]
  4. Grundstein, A.J.; Leathers, D.J. A spatial analysis of snow–surface energy exchanges over the northern Great Plains of the United States in relation to synoptic scale forcing mechanisms. Int. J. Climatol. 1999, 19, 489–511. [Google Scholar] [CrossRef]
  5. Bengtsson, L. Evaporation from a snow cover: Review and discussion of measurements. Hydrol. Res. 1980, 11, 221–234. [Google Scholar] [CrossRef]
  6. Breeden, M.L.; Clare, R.M.; Martin, J.E.; Desai, A.R. Diagnosing the influence of a receding snow boundary on simulated midlatitude cyclones using piecewise potential vorticity inversion. Mon. Weather Rev. 2020, 148, 4479–4495. [Google Scholar] [CrossRef]
  7. Ellis, A.W.; Leathers, D.J. Analysis of cold airmass temperature modification across the US Great Plains as a consequence of snow depth and albedo. J. App. Meteorol. Climatol. 1999, 38, 696–711. [Google Scholar] [CrossRef]
  8. Namias, J. Some Empirical Evidence for the Influence of Snow Cover on Temperature and Precipitation. Mon. Weather Rev. 1985, 113, 1542–1553. [Google Scholar] [CrossRef]
  9. Walland, D.J.; Simmonds, I. Modelled atmospheric response to changes in Northern Hemisphere snow cover. Clim. Dyn. 1997, 13, 25–34. [Google Scholar] [CrossRef]
  10. Elguindi, N.; Hanson, B.; Leathers, D. The effects of snow cover on midlatitude cyclones in the Great Plains. J. Hydromet. 2005, 6, 263–279. [Google Scholar] [CrossRef]
  11. Namias, J. Influences of abnormal heat sources and sinks on atmospheric behavior. In Proceedings of the International Symposium on Numerical Weather Prediction, Tokyo, Japan, 7–13 November 1960; pp. 615–627. [Google Scholar]
  12. Cohen, J.; Entekhabi, D. Eurasian snow cover variability and northern hemisphere climate predictability. Geophys. Res. Lett. 1999, 26, 345–348. [Google Scholar] [CrossRef]
  13. Gutlzer, D.S.; Preston, J.W. Evidence for a relationship between spring snow cover in North America and summer rainfall in New Mexico. Geophys. Res. Lett. 1997, 24, 2207–2210. [Google Scholar] [CrossRef]
  14. Alexander, M.A.; Tomas, R.; Deser, C.; Lawrence, D.M. The Atmospheric Response to Projected Terrestrial Snow Changes in the Late 21st Century. J. Clim. 2010, 23, 6430–6437. [Google Scholar] [CrossRef]
  15. Notaro, M.; Zarrin, A. Sensitivity of the North American monsoon to antecedent Rocky Mountain snowpack. Geophys. Res. Lett. 2011, 38, L17403. [Google Scholar] [CrossRef]
  16. Jeong, J.; Linderholm, H.W.; Woo, S.; Folland, C.; Kim, B.; Kim, S.; Chen, D. Impacts of snow initialization on subseasonal forecasts of surface air temperature for the cold season. J. Clim. 2013, 26, 1956–1972. [Google Scholar] [CrossRef]
  17. Thomas, J.A.; Berg, A.A.; Merryfield, W.J. Influence of snow and soil moisture initialization on sub-seasonal predictability and forecast skill in boreal spring. Clim. Dyn. 2016, 47, 49–65. [Google Scholar] [CrossRef]
  18. Lamb, H.H. Two-way relationship between the snow or ice limit and the 1,000-500 mb thickness in the overlying atmosphere. Q. J. R. Meteorol. Soc. 1955, 81, 172–189. [Google Scholar] [CrossRef]
  19. Dickson, R.R.; Namias, J. North American Influences on the Circulation and Climate of the North Atlantic Sector. Mon. Weather Rev. 1976, 104, 1255–1265. [Google Scholar] [CrossRef]
  20. Heim, R.; Dewey, K.F. Circulation patterns and temperature fields associated with extensive snow cover on the North American continent. Phys. Geogr. 1984, 5, 66–85. [Google Scholar] [CrossRef]
  21. Rydzik, M.; Desai, A.R. Relationship between snow extent and midlatitude disturbance centers. J. Clim. 2014, 27, 2971–2982. [Google Scholar] [CrossRef]
  22. Carleton, A.M. Synoptic cryosphere—Atmosphere interactions in the Northern Hemisphere from DMSP image analysis. Int. J. Remote Sens. 1983, 6, 239–261. [Google Scholar] [CrossRef]
  23. Ross, B.; Walsh, J.E. Synoptic-scale influences of snow cover and sea ice. Mon. Weather Rev. 1986, 114, 1795–1810. [Google Scholar] [CrossRef]
  24. Brown, R.D. Northern Hemisphere snow cover variability and change, 1915-97. J. Clim. 2000, 13, 2339–2354. [Google Scholar] [CrossRef]
  25. Peacock, S. Projected Twent-First-Center Changes in Temperature, Precipitation, and Snow Cover over North America in CCSM4. J. Clim. 2012, 25, 4405–4429. [Google Scholar] [CrossRef]
  26. Notaro, M.; Lorenz, D.; Hoving, C.; Schummer, M. Twenty-first-century projections of snowfall and winter severity across Central-Eastern North America. J. Clim. 2014, 27, 6526–6550. [Google Scholar] [CrossRef]
  27. Kapnick, S.B.; Delworth, T.L. Controls of Global Snow under a Changed Climate. J. Clim. 2013, 26, 5537–5562. [Google Scholar] [CrossRef]
  28. Krasting, J.P.; Broccoli, A.J.; Dixon, K.W.; Lanzante, J.R. Future changes in Northern Hemisphere snowfall. J. Clim. 2013, 26, 7813–7828. [Google Scholar] [CrossRef]
  29. Harding, K.J.; Snyder, P.K.; Liess, S. Use of dynamical downscaling to improve the simulation of Central U.S. warm season precipitation in CMIP5 models. J. Geophys. Res. 2013, 118, 12522–12536. [Google Scholar] [CrossRef]
  30. Maloney, E.D.; Camargo, S.J.; Chang, E.; Colle, B.; Fu, R.; Geil, K.; Hu, Q.; Jiang, X.; Johnson, N.C.; Karnauskas, K.B.; et al. North American Climate in CMIP5 experiments: Part III: Assesment of twenty-first-century projections. J. Clim. 2014, 27, 2230–2270. [Google Scholar] [CrossRef]
  31. Catto, J.L.; Ackerley, D.; Booth, J.F.; Champion, A.J.; Colle, B.A.; Pfahl, S.; Pinto, J.G.; Quinting, J.F.; Seiler, C. The future of midlatitude cyclones. Curr. Clim. Chang. Rep. 2019, 5, 407–420. [Google Scholar] [CrossRef]
  32. Robinson, D.A.; Kukla, G. Maximum surface albedo of seasonally snow-covered lands in the northern hemisphere. J. App. Met. Clim. 1985, 24, 402–411. [Google Scholar] [CrossRef]
  33. Jin, Y.; Schaaf, C.; Gao, F.; Li, X.; Strahler, A.; Zeng, X.; Dickinson, R. How does snow impact the albedo of vegetated land surfaces as analyzed with MODIS data? Geophys. Res. Lett. 2002, 29, 12-1–12-4. [Google Scholar] [CrossRef]
  34. Robinson, D.A.; Hughes, M.G. Snow cover variability on the northern and central Great Plains. Great Plains Res. 1991, 1, 93–113. [Google Scholar]
  35. Robinson, D.A. Evaluating snow cover over Northern Hemisphere lands using satellite and in situ observations. In Proceedings of the 53rd Eastern Snow Conference, Williamsburg, VA, USA, 13–19 May 1996. [Google Scholar]
  36. Reitan, C.H. Frequencies of cyclones and cyclogenesis for North America, 1951–1970. Mon. Weather Rev. 1974, 102, 861–868. [Google Scholar] [CrossRef]
  37. Zishka, K.M.; Smith, P.J. The climatology of cyclones and anticyclones over North America and surrounding ocean environs for January and July, 1950–1977. Mon. Weather Rev. 1980, 108, 387–401. [Google Scholar] [CrossRef]
  38. Hoskins, B.J.; Hodges, K.I. New Perspectives on the Northern Hemisphere Winter Storm Tracks. J. Atmos. Sci. 2002, 59, 1041–1061. [Google Scholar] [CrossRef]
  39. Thomas, B.C.; Martin, J.E. A synoptic climatology and composite analysis of the Alberta Clipper. Weather Forecast. 2007, 22, 315–333. [Google Scholar] [CrossRef]
  40. Hawcroft, M.K.; Shaffrey, L.C.; Hodges, K.I.; Dacre, H.F. How much Northern Hemisphere precipitation is associated with extratropical cyclones? Geophys. Res. Lett. 2012, 39, 809–814. [Google Scholar] [CrossRef]
  41. Trenberth, K.E. Atmospheric moisture residence times and cycling: Implications for rainfall rates and climate change. Clim. Chang. 1998, 39, 667–694. [Google Scholar] [CrossRef]
  42. Bagley, J.E.; Desai, A.R.; Dirmeyer, P.; Foley, J.A. Effects of land cover change on precipitation and crop yield in the world’s breadbaskets. Environ. Res. Lett. 2012, 7, 014009. [Google Scholar] [CrossRef]
  43. Shaw, T.A.; Graham, R.J. Hydrological cycle changes explain weak Snowball Earth storm track despite increased surface baroclinicity. Geophys. Res. Lett. 2020, 47, e2020GL089866. [Google Scholar] [CrossRef]
  44. Skamarock, W.C.; Klemp, J.B.; Dudhia, J.; Gill, D.O.; Liu, Z.; Berner, J.; Wang, W.; Powers, J.G.; Duda, M.G.; Barker, D.M.; et al. A Description of the Advanced Research WRF Model Version 4; No. NCAR/TN-556+STR; NCAR: Boulder, CO, USA, 2019. [Google Scholar] [CrossRef]
  45. Mesinger, F.; DiMego, G.; Kalnay, E.; Mitchell, K.; Shafran, P.C.; Ebisuzaki, W.; Jović, D.; Woollen, J.; Rogers, E.; Berbery, E.H.; et al. North American Regional Reanalysis. Bull. Am. Meteorol. Soc. 2006, 87, 343–360. [Google Scholar] [CrossRef]
  46. Taylor, K.E.; Stouffer, R.J.; Meehl, G.A. An overview of CMIP5 and the experimental design. Bull. Am. Meteorol. Soc. 2012, 93, 485–498. [Google Scholar] [CrossRef]
  47. van Vuuren, D.P.; Edmonds, J.; Kainuma, M.; Riahi, K.; Thompson, A.; Hibbard, K.; Hurtt, G.C.; Kram, T.; Krey, V.; Lamarque, J.-F.; et al. The representative concentration pathways: An overview. Clim. Chang. 2011, 109, 5–31. [Google Scholar] [CrossRef]
  48. Rhoades, A.M.; Ullrich, P.A.; Zarzycki, C.M. Projecting 21st century snowpack trends in western USA mountains using variable-resolution CESM. Clim. Dyn. 2018, 50, 261–288. [Google Scholar] [CrossRef]
  49. Wang, J.; Kotamarthi, V.R. Downscaling with a nested regional climate model in near-surface fields over the contiguous United States. J. Geophys. Res. Atmos. 2014, 119, 8778–8797. [Google Scholar] [CrossRef]
  50. Mearns, L.O.; Arritt, R.; Biner, S.; Bukovsky, M.S.; McGinnis, S.; Sain, S.; Caya, D.; Correia, J.; Flory, D.; Gutowski, W.; et al. The North American Regional Climate Change Assessment Program: Overview of Phase 1 Results. Bull. Am. Meteorol. Soc. 2012, 93, 1337–1362. [Google Scholar] [CrossRef]
  51. Hu, X.-M.; Xue, M.; McPherson, R.A.; Martin, E.; Rosendahl, D.H.; Qiao, L. Precipitation dynamical downscaling over the Great Plains. J. Adv. Model. Earth Syst. 2018, 10, 421–447. [Google Scholar] [CrossRef]
  52. Mitchell, K.; Ek, M.; Wong, V.; Lohmann, D.; Koren, V.; Schaake, J.; Duan, Q.; Gayno, G.; Moore, B.; Grunmann, P.; et al. The Community Noah Land Surface Model (LSM) User’s Guide Public Release Version 2.7.1; NCAR: Boulder, CO, USA, 2005. [Google Scholar]
  53. Livneh, B.; Xia, Y.; Mitchell, K.E.; Ek, M.B.; Lettenmaier, D.P. Noah LSM snow model diagnostics and enhancements. J. Hydrometeorol. 2010, 11, 721–738. [Google Scholar] [CrossRef]
  54. Hawcroft, M.; Walsh, E.; Hodges, K.; Zappa, G. Significantly increased extreme precipitation expected in Europe and North America from extratropical cyclones. Environ. Res. Lett. 2018, 13, 124006. [Google Scholar] [CrossRef]
  55. Powell, M.D.; Reinhold, T.A. Tropical cyclone destructive potential by integrated kinetic energy. Bull. Am. Meteorol. Soc. 2007, 88, 513–526. [Google Scholar] [CrossRef]
  56. Lombardo, K.; Colle, B.A.; Zhang, Z. Evaluation of Historical and Future Cool Season Precipitation over the Eastern United States and Western Atlantic Storm Track Using CMIP5 Models. J. Clim. 2015, 28, 451–467. [Google Scholar] [CrossRef]
  57. Yettella, V.; Kay, J.E. How will precipitation change in extratropical cyclones as the planet warms? Insights from a large initial condition climate model ensemble. Clim. Dyn. 2017, 49, 1765–1781. [Google Scholar] [CrossRef]
  58. Notaro, M.; Holman, K.; Zarrin, A.; Fluck, E.; Vavrus, S.; Bennington, V. Influence of the Laurentian Great Lakes on Regional Climate. J. Clim. 2013, 26, 789–804. [Google Scholar] [CrossRef]
  59. Ulbrich, U.; Leckebusch, G.C.; Pinto, J.G. Extra-tropical cyclones in the present and future climate: A review. Theor. Appl. Climatol. 2009, 96, 117–131. [Google Scholar] [CrossRef]
  60. Zappa, G.; Shaffrey, L.C.; Hodges, K.I.; Sansom, P.G.; Stephenson, D.B. A Multimodel Assessment of Future Projections of North Atlantic and European Extratropical Cyclones in the CMIP5 Climate Models. J. Clim. 2013, 26, 5846–5862. [Google Scholar] [CrossRef]
  61. Zhang, Z.; Colle, B.A. Changes in Extratropical Cyclone Precipitation and Associated Processes during the Twenty-First Century over Eastern North America and the Western Atlantic Using a Cyclone-Relative Approach. J. Clim. 2017, 30, 8633–8656. [Google Scholar] [CrossRef]
  62. Zhang, Z.; Colle, B.A. Impact of Dynamically Downscaling Two CMIP5 Models on the Historical and Future Changes in Winter Extratropical Cyclones along the East Coast of North America. J. Clim. 2018, 31, 8499–8525. [Google Scholar] [CrossRef]
  63. Brown, R.D.; Mote, P.W. The response of Northern Hemisphere snow cover to a changing climate. J. Clim. 2009, 22, 2124–2145. [Google Scholar] [CrossRef]
  64. Wang, Z.; Zeng, X. Evaluation of Snow Albedo in Land Models for Weather and Climate Studies. J. Appl. Meteorol. Climatol. 2010, 49, 363–380. [Google Scholar] [CrossRef]
  65. Liu, L.; Menenti, M.; Ma, Y.; Ma, W. Improved Parameterization of Snow Albedo in WRF + Noah: Methodology Based on a Severe Snow Event on the Tibetan Plateau. Adv. Atmos. Sci. 2022, 39, 1079–1102. [Google Scholar] [CrossRef]
  66. Diro, G.T.; Sushama, L. Snow–precipitation coupling and related atmospheric feedbacks over North America. Atmos. Sci. Lett. 2018, 19, e831. [Google Scholar] [CrossRef]
  67. Diro, G.T.; Sushama, L. Contribution of snow cover decline to projected warming over North America. Geophys. Res. Lett. 2020, 47, e2019GL084414. [Google Scholar] [CrossRef]
  68. Clare, R.M.; Desai, A.R.; Notaro, M.; Martin, J.E.; Vavrus, S.J. Projected Snow Cover Reductions and Mid-latitude Cyclone Responses in the North American Great Plains, 1986–2005 ver 3. Environ. Data Initiat. 2020. [Google Scholar] [CrossRef]
Figure 1. Difference between grid point maximum snow albedo and background surface albedo calculated by the WRF Preprocessing System with input from the WRF vegetation parameter lookup table. In principle, these values represent the maximum albedo gradient across a hypothetical local snow line. The large region of enhanced albedo difference in the center of the continent represents the Great Plains study area. While large snow albedo gradients are also found in the desert Southwest and Mexico, it is rare for snow to persist in most locations there.
Atmosphere 14 00783 g001
Figure 2. Observed cyclone trajectories for the 15 cases tested in this study. Coloring refers to the mean central minimum sea-level pressure (SLP) value during each 3 h segment of the cyclone trajectory. Map is clipped to inner domain of WRF run.
Atmosphere 14 00783 g002
Figure 3. Distributions of average late twentieth to late twenty-first century poleward snow line retreat (in km) east of the Rocky Mountains for each month as determined by 14 CMIP5 models (Table 3). Values for RCP4.5 experiment are plotted in blue and RCP8.5 values are shown in red. Solid black horizontal bars indicate the median value, while dotted bars indicate the 10th and 90th percentile values. RCP4.5 and RCP8.5 retreat values are significantly distinct from each other in each month (p < 0.01).
Atmosphere 14 00783 g003
Figure 4. Maps comparing the control (blue) and perturbed (red) cyclone tracks as a function of percentile snow removal (10th for (a,d,g,j,m); 50th for (b,e,h,k,n); 90th for (c,f,i,l,o)) for the five early-season cases. Also shown is the original snow cover (solid black line) and perturbed snow cover (dashed black line).
Atmosphere 14 00783 g004
Figure 5. Maps comparing the control (blue) and perturbed (red) cyclone tracks as a function of percentile snow removal (10th for (a,d,g,j,m); 50th for (b,e,h,k,n); 90th for (c,f,i,l,o)) for the five mid-season cases. Also shown is the original snow cover (solid black line) and perturbed snow cover (dashed black line).
Atmosphere 14 00783 g005
Figure 6. Maps comparing the control (blue) and perturbed (red) cyclone tracks as a function of percentile snow removal (10th for (a,d,g,j,m); 50th for (b,e,h,k,n); 90th for (c,f,i,l,o)) for the five late-season cases. Also shown is the original snow cover (solid black line) and perturbed snow cover (dashed black line).
Atmosphere 14 00783 g006
Figure 7. (a) Mean trajectory deviation (MTD) in km and (b) maximum pressure deepening of perturbed minus control over entire track as a function of 10th, 50th, and 90th percentile snow removal for early- (purple), mid- (blue), and late-season (brown) cases. While impacts are limited, greater snow removal leads to greater MTD and pressure deepening, especially in late-season cases.
Atmosphere 14 00783 g007
Figure 8. Relationship of snow removed in each simulation against (a) MTD and (b) maximum change in center sea-level pressure, colored by season of the case. Significant (p < 0.01) linear correlation by season (line color) or all cases (black line) is shown by lines.
Atmosphere 14 00783 g008
Figure 9. Relationship of snow removal with (a) total storm-associated precipitation and (b) fraction of frozen precipitation, colored by season. Linear relationships were not significant.
Atmosphere 14 00783 g009
Figure 10. Sum total of precipitation difference (perturbation minus control) for all cyclone cases for (a) 10th, (b) 50th, and (c) 90th percentile snow cover retreat.
Atmosphere 14 00783 g010
Table 1. Dates of cyclone cases and assignment to season for analysis in this study. Date noted as first day of cyclone crossing study domain. Alberta clipper track systems noted with asterisk.
SeasonCase NumberDate of Cyclone Entering DomainClipper Storm?
Early115 November 1986Yes
27 December 1989No
317 December 1998No
411 December 2004Yes
58 November 2005No
Mid67 February 1987Yes
710 January 1990Yes
818 February 1994Yes
925 January 1996
1015 February 2000
Late116 March 1987Yes
1222 March 1994
1321 February 2001Yes
1412 March 2002Yes
156 March 2005Yes
Table 2. CMIP5 models used in this study and their attributes.
Modeling Center (or Group)Institute IDModel NameHorizonal Res.
(°lon × °lat)
No. Vertical Levels
Commonwealth Scientific and Industrial Research Organization (CSIRO) and Bureau of Meteorology (BOM), AustraliaCSIRO-BOMACCESS1.01.875 × 1.2538
National Center for Atmospheric ResearchNCARCCSM41.25 × 1.026
Centre National de Recherches Météorologique/Centre Européen de Recherche et Formation Avancée en Calcul ScientificCNRM-CERFACSCNRM-CM51.4 × 1.431
Commonwealth Scientific and Industrial Research Organization in collaboration with Queensland Climate Change Centre of ExcellenceCSIRO-QCCCECSIRO-Mk3.6.01.8 × 1.818
NASA Goddard Institute for Space StudiesNASA GISSGISS-E2-H, GISS-E2-R2.5 × 2.040
Met Office Hadley CentreMOHCHadGEM2-CC, HadGEM2-ES1.8 × 1.2560
Institute for Numerical MathematicsINMINM-CM42.0 × 1.521
Atmosphere and Ocean Research Institute (The University of Tokyo), National Institute for Environmental Studies, and Japan Agency for Marine-Earth Science and TechnologyMIROCMIROC51.4 × 1.440
Max Planck Institute for MeteorologyMPI-MMPI-ESM-LR1.9 × 1.947
Meteorological Research InstituteMRIMRI-CGCM31.1 × 1.148
Norwegian Climate CentreNCCNorESM1-M, NorESM1-ME2.5 × 1.926
Table 3. Models and RCP experiments that were used to determine 10th, 50th, and 90th percentile values for late twentieth to late twenty-first century snow line retreat in eastern North America.
MonthP10P50P90
NovGISS-E2-R, RCP4.5CNRM-CM5, RCP4.5ACCESS1.0, RCP8.5
DecINM-CM4, RCP4.5HadGEM2-ES, RCP4.5CSIRO-Mk3.6.0, RCP8.5
JanGISS-E2-R, RCP4.5MIROC5, RCP4.5MIROC5, RCP8.5
FebMRI-CGCM3, RCP8.5ACCESS1.0, RCP4.5ACCESS1.0, RCP8.5
MarMRI-CGCM3, RCP8.5CNRM-CM5, RCP8.5MIROC5, RCP8.5
Disclaimer/Publisher’s Note: The statements, opinions and data contained in all publications are solely those of the individual author(s) and contributor(s) and not of MDPI and/or the editor(s). MDPI and/or the editor(s) disclaim responsibility for any injury to people or property resulting from any ideas, methods, instructions or products referred to in the content.

