Simulation and Estimation of the Inter-Source Category and/or Inter-Pollutant Emission Offset Ratios for a Heavy Industry City
Abstract
1. Introduction
2. Materials and Methods
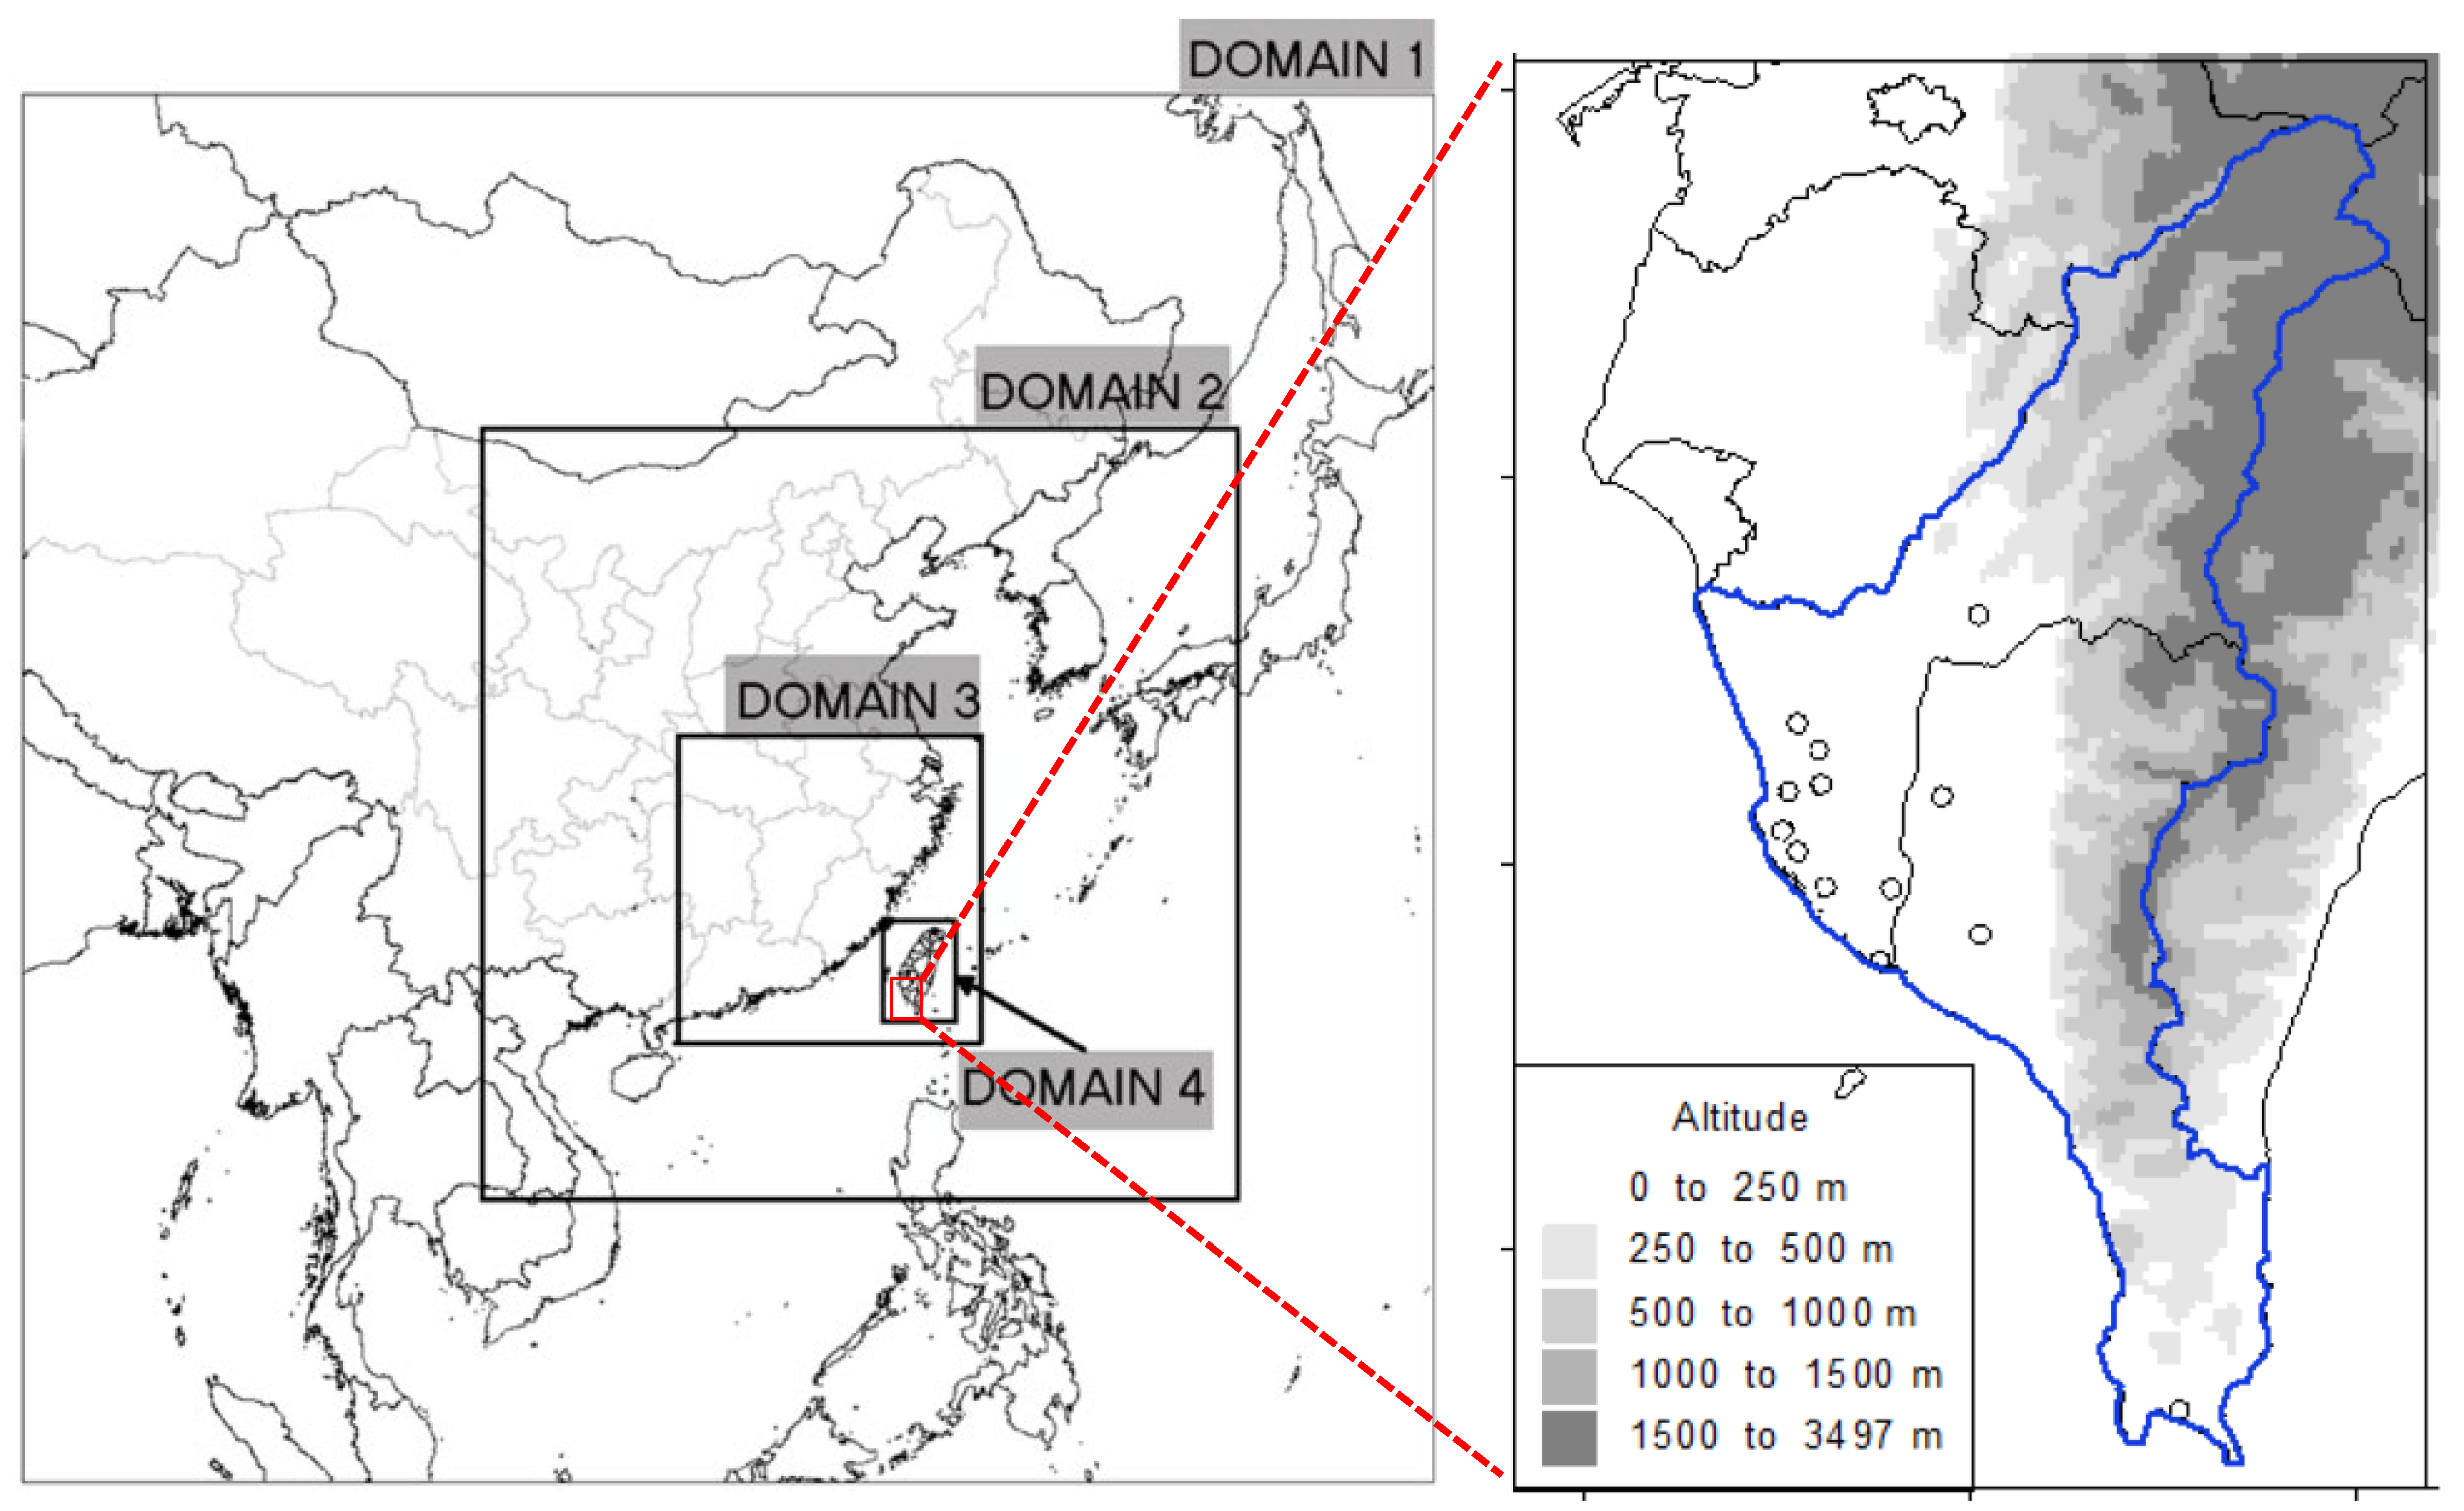
2.1. Air Quality Modeling System
2.2. Case Simulation and Offset Ratio Calculation
3. Results and Discussion
3.1. Base Case Simulation Results and Their Performance Evaluation Results
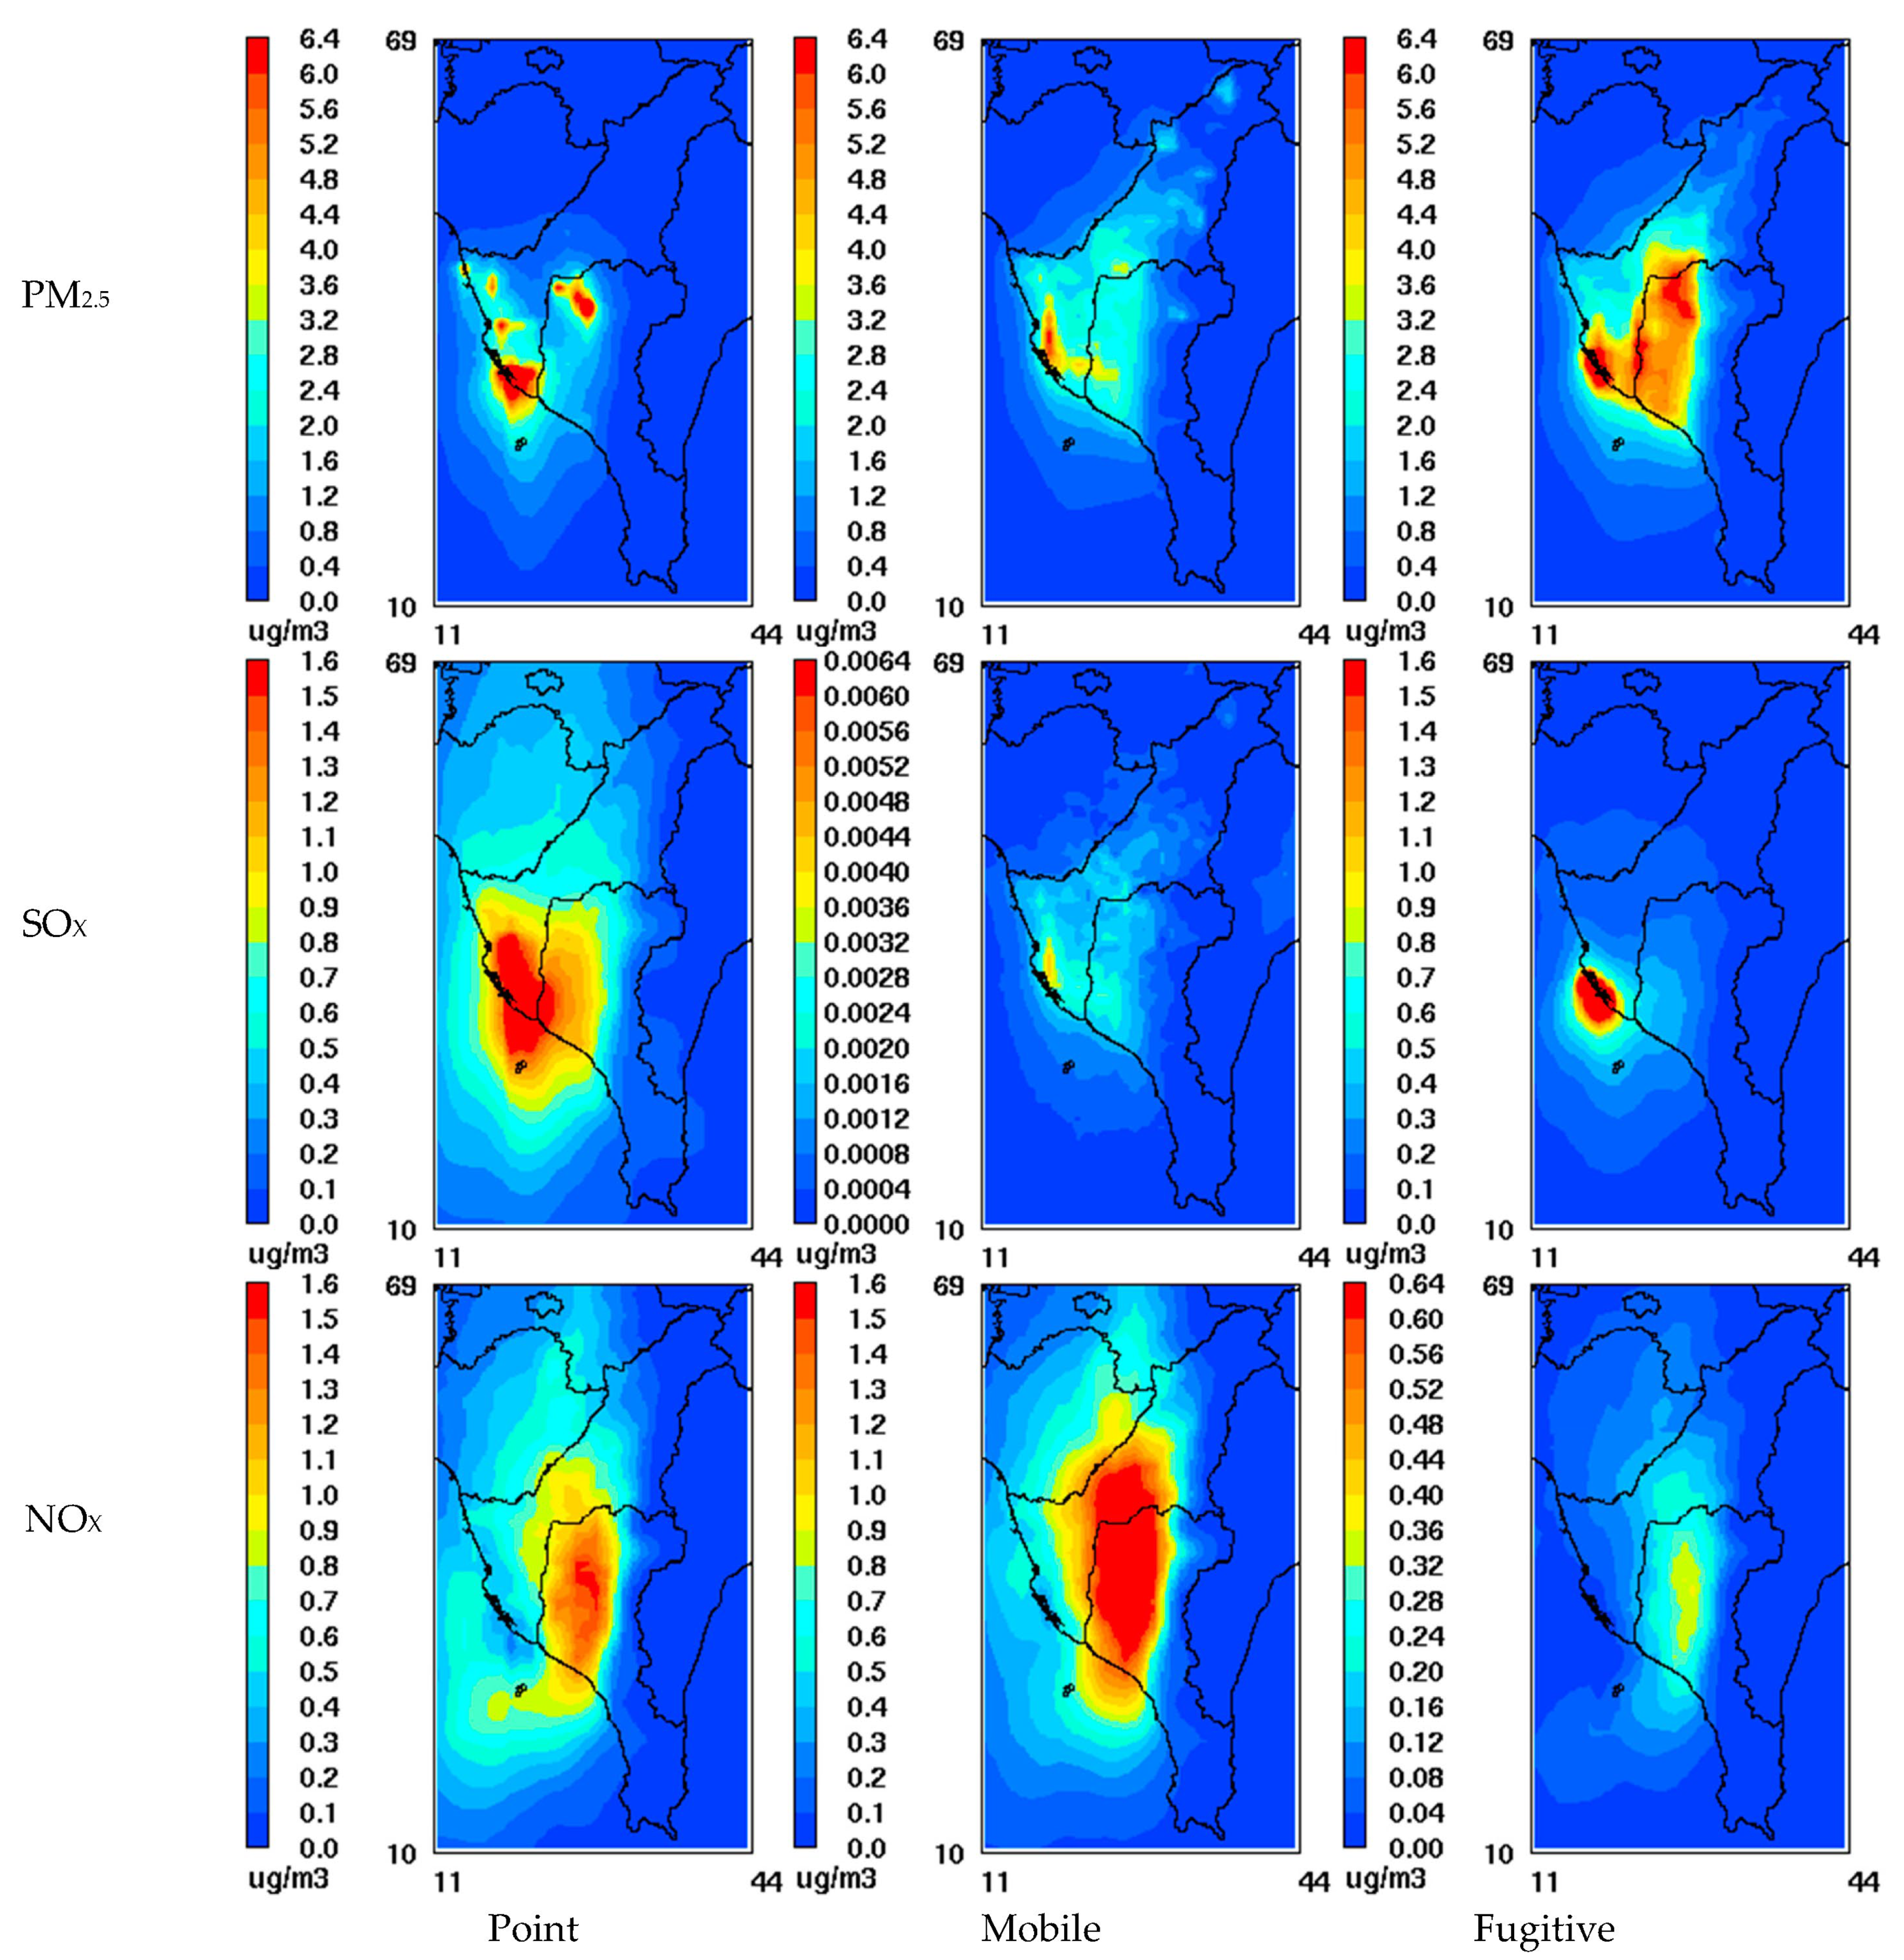
3.2. Sensitivity of PM2.5 Concentrations to the Emissions of Different Pollutants from Different Source Categories over KPAB
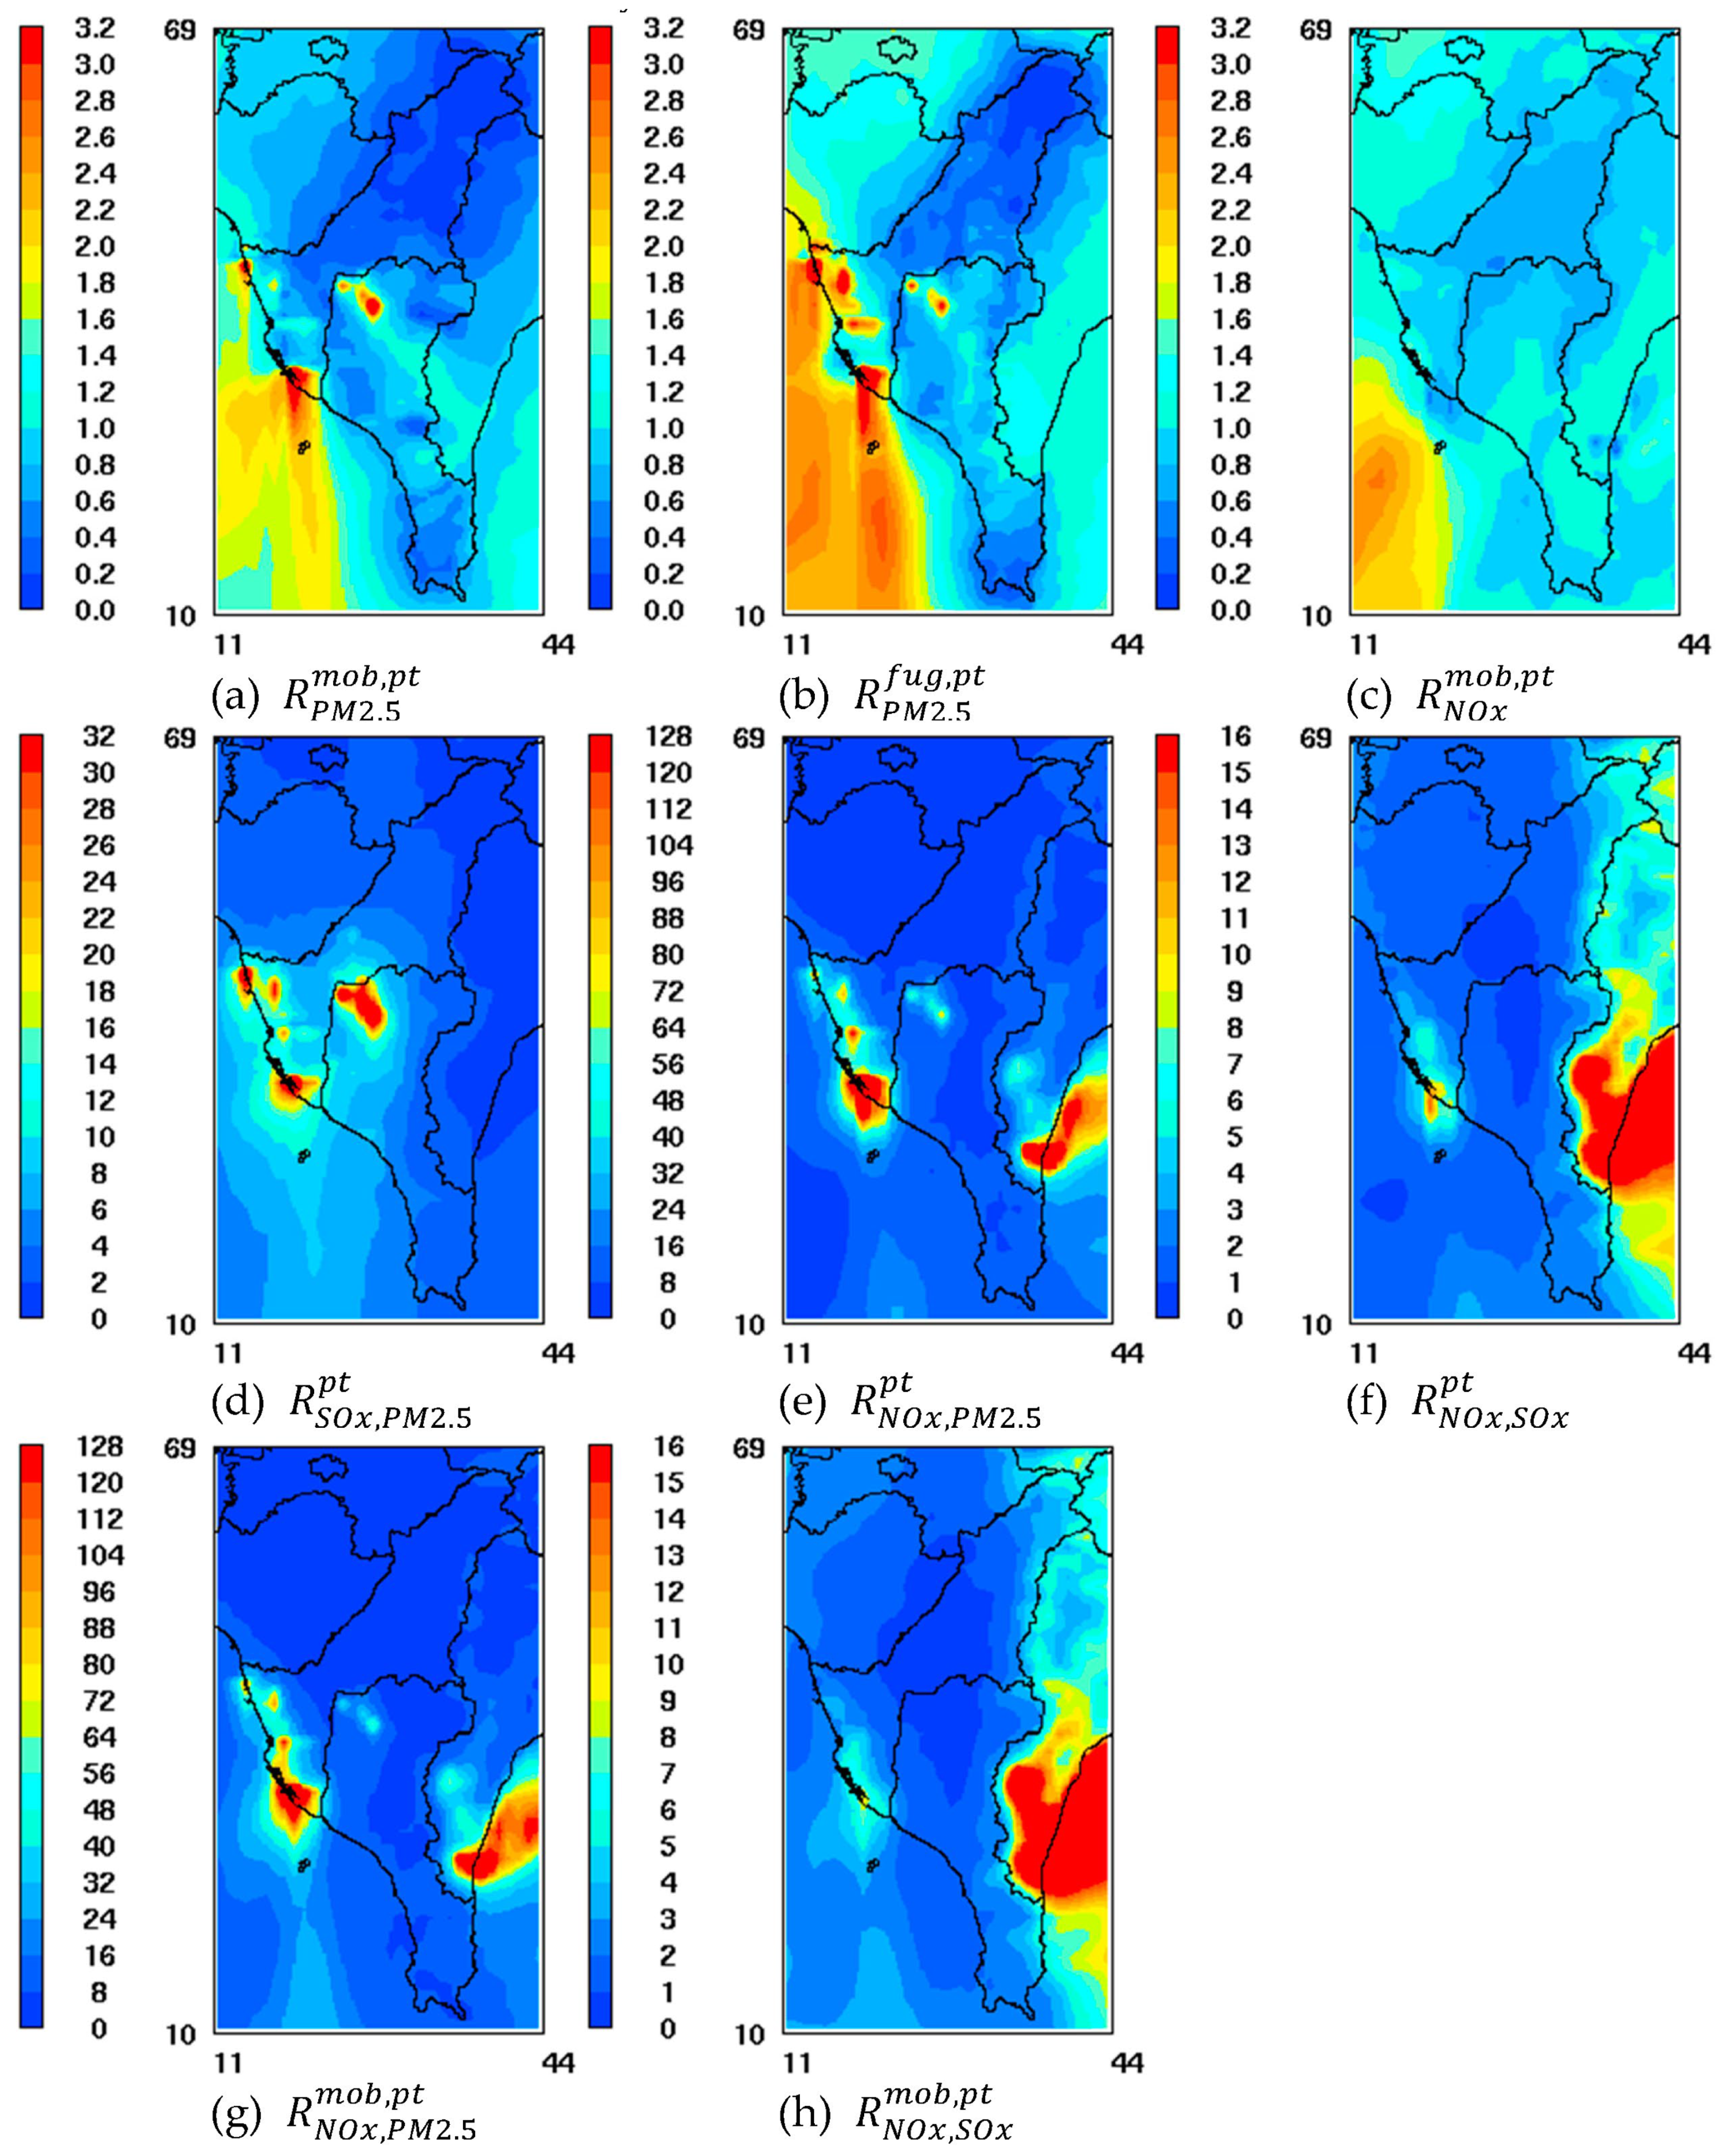
3.3. Calculation of Emission Offset Ratios for KPAB
4. Conclusions
Supplementary Materials
Author Contributions
Funding
Institutional Review Board Statement
Informed Consent Statement
Data Availability Statement
Acknowledgments
Conflicts of Interest
References
- TEPA. Total Air Pollutants Quantity Control Plans for Kaohsiung-Pingtung Area. In Executive Yuan Gazette; Taiwan Environmental Protection Administration: Taipei, Taiwan, 2015; Volume 21. (In Chinese) [Google Scholar]
- TEPA. Air Quality Annual Report of R.O.C. (Taiwan), 2021; Taiwan Environmental Protection Administration: Taipei, Taiwan, 2022. (In Chinese)
- TEPA. Air Pollution Control Act (Amendment). In Presidential Office Gazette; Taiwan Environmental Protection Administration: Taipei, Taiwan, 2018. (In Chinese) [Google Scholar]
- TEPA. Offset Principles for the Increased Air Pollutant Emissions Caused by Development Activities. In Executive Yuan Gazette; Taiwan Environmental Protection Administration: Taipei, Taiwan, 2009; Volume 28. (In Chinese) [Google Scholar]
- TEPA. Offset Principles for the Increased Air Pollutant Emissions Caused by Development Activities (Amendment). In Executive Yuan Gazette; Taiwan Environmental Protection Administration: Taipei, Taiwan, 2022; Volume 15. (In Chinese) [Google Scholar]
- USEPA. Implementation of the New Source Review (NSR) Program for Particulate Matter Less Than 2.5 Micrometers (PM2.5). In Federal Register; U.S. Environmental Protection Agency: Research Triangle Park, NC, USA, 2008; Volume 73, pp. 28321–28350. [Google Scholar]
- NACAA. PM2.5 Modeling Implementation for Projects Subject to National Ambient Air Quality Demonstration Requirements Pursuant to New Source Review: Report from NACAA PM2.5 Modeling Implementation Workgroup; National Association of Clean Air Agencies: Washington, DC, USA, 2011. [Google Scholar]
- Boylan, J.; Kim, B. Development of PM2 5 interpollutant trading ratios. In Proceedings of the 2012 Community Modeling & Analysis System (CMAS) Conference, Chapel Hill, NC, USA, 16 October 2012. [Google Scholar]
- USEPA. CMAQ Version 5.0.2. Available online: https://zenodo.org/record/1079898 (accessed on 2 June 2015).
- Skamarock, W.C.; Klemp, J.B.; Dudhia, J.; Gill, D.O.; Barker, D.M.; Duda, M.G.; Huang, X.Y.; Wang, W.; Powers, J.G. A Description of the Advanced Research WRF Version 3 NCAR/TN-475+STR; National Center for Atmospheric Research: Boulder, CO, USA, 2008. [Google Scholar]
- Zheng, B.; Tong, D.; Li, M.; Liu, F.; Hong, C.; Geng, G.; Li, H.; Li, X.; Peng, L.; Qi, J.; et al. Trends in China’s anthropogenic emissions since 2010 as the consequence of clean air actions. Atmos. Chem. Phys. 2018, 18, 14095–14111. [Google Scholar] [CrossRef]
- Li, M.; Zhang, Q.; Kurokawa, J.I.; Woo, J.H.; He, K.; Lu, Z.; Ohara, T.; Song, Y.; Streets, D.G.; Carmichael, G.R.; et al. MIX: A mosaic Asian anthropogenic emission inventory under the international collaboration framework of the MICS-Asia and HTAP. Atmos. Chem. Phys. 2017, 17, 935–963. [Google Scholar] [CrossRef]
- Chang, K.H.; Yu, J.Y.; Chen, T.F.; Lin, Y.P. Estimating Taiwan biogenic VOC emission: Leaf energy balance consideration. Atmos. Environ. 2009, 43, 5092–5100. [Google Scholar] [CrossRef]
- Chen, T.F.; Chen, C.H.; Yu, J.Y.; Lin, Y.B.; Chang, K.H. Estimation of biogenic VOC emissions in East Asia with new emission factors and leaf energy balance considerations. J. Innov. Technol. 2020, 2, 61–72. [Google Scholar]
- Streets, D.G.; Fu, J.S.; Jang, C.J.; Hao, J.; He, K.; Tang, X.; Zhang, Y.; Wang, Z.; Li, Z.; Zhang, Q.; et al. Air quality during the 2008 Beijing Olympic Games. Atmos. Environ. 2007, 41, 480–492. [Google Scholar] [CrossRef]
- Xing, J.; Zhang, Y.; Wang, S.; Liu, X.; Cheng, S.; Zhang, Q.; Chen, Y.; Streets, D.G.; Jang, C.; Hao, J.; et al. Modeling study on the air quality impacts from emission reductions and atypical meteorological conditions during the 2008 Beijing Olympics. Atmos. Environ. 2011, 45, 1786–1798. [Google Scholar] [CrossRef]
- Lee, D.; Choi, J.-Y.; Myoung, J.; Kim, O.; Park, J.; Shin, H.-J.; Ban, S.-J.; Park, H.-J.; Nam, K.-P. Analysis of a severe PM2.5 episode in the Seoul Metropolitan area in South Korea from 27 February to 7 March 2019: Focused on estimation of domestic and foreign contribution. Atmosphere 2019, 10, 756. [Google Scholar] [CrossRef]
- Cohan, D.S.; Hakami, A.; Hu, Y.; Russell, A.G. Nonlinear response of ozone to emissions: Source apportionment and sensitivity analysis. Environ. Sci. Technol. 2005, 39, 6739–6748. [Google Scholar] [CrossRef] [PubMed]
- Itahashi, S.; Uno, I.; Kim, S. Source contributions of sulfate aerosol over East Asia estimated by CMAQ-DDM. Environ. Sci. Technol. 2012, 46, 6733–6741. [Google Scholar] [CrossRef] [PubMed]
- Yu, S.; Su, F.; Yin, S.; Wang, S.; Xu, R.; He, B.; Fan, X.; Yuan, M.; Zhang, R. Characterization of ambient volatile organic compounds, source apportionment, and the ozone–NOx–VOC sensitivities in a heavily polluted megacity of central China: Effect of sporting events and emission reductions. Atmos. Chem. Phys. 2021, 21, 15239–15257. [Google Scholar] [CrossRef]
- Koo, B.; Wilson, G.M.; Morris, P.E.; Dunker, A.M.; Yarwood, G. Comparison of source apportionment and sensitivity analysis in a particulate matter air quality model. Environ. Sci. Technol. 2009, 43, 6669–6675. [Google Scholar] [CrossRef] [PubMed]
- Kwok, R.H.F.; Napelenok, S.L.; Baker, K.R. Implementation and evaluation of PM2.5 source contribution analysis in a photochemical model. Atmos. Environ. 2013, 80, 398–407. [Google Scholar] [CrossRef]
- Siouti, E.; Skyllakou, K.; Kioutsioukis, I.; Patoulias, D.; Fouskas, G.; Pandis, S.N. Development and application of the SmartAQ high-resolution air quality and source apportionment forecasting system for European urban areas. Atmosphere 2022, 13, 1693. [Google Scholar] [CrossRef]
- Cohan, D.S.; Napelenok, S.L. Air quality response modeling for decision support. Atmosphere 2011, 2, 407–425. [Google Scholar] [CrossRef]
- Boylan, J.W.; Russell, A.G. PM and light extinction model performance metrics, goals, and criteria for three-dimensional air quality models. Atmos. Environ. 2006, 40, 4946–4959. [Google Scholar] [CrossRef]
- Hurley, P.; Blockley, A.; Rayner, K. Verification of a prognostic meteorological and air pollution model for year-long predictions in the Kwinana region of Western Australia. Atmos. Environ. 2001, 35, 1871–1880. [Google Scholar] [CrossRef]
- Seinfeld, J.H.; Pandis, S.N. Atmospheric Chemistry and Physics: From Air Pollution to Climate Change, 3rd ed.; John Wiley & Sons: Hoboken, NJ, USA, 2016. [Google Scholar]


| t= | Point | Mobile | Fugitive | |
|---|---|---|---|---|
| s | ||||
| PM2.5 | 2.69 | 2.53 | 5.11 | |
| SOX | 16.4 | 0.02 | 0.33 | |
| NOX | 22.8 | 27.4 | 3.14 |
| a= | All Station Average (N = 13) | Region Average (N = 631) | |||||
|---|---|---|---|---|---|---|---|
| t= | Point | Mobile | Fugitive | Point | Mobile | Fugitive | |
(µg/m3) | 4.33 | 3.14 | 4.18 | 0.91 | 1.21 | 1.90 | |
(µg/m3/103 ton) | 1.61 | 1.24 | 0.82 | 0.34 | 0.48 | 0.37 | |
(µg/m3) | 1.38 | 0.0023 | 0.61 | 0.57 | 0.0009 | 0.18 | |
(µg/m3/103 ton) | 0.084 | 0.13 | 1.86 | 0.035 | 0.050 | 0.56 | |
(µg/m3) | 0.61 | 0.83 | 0.092 | 0.52 | 0.73 | 0.10 | |
(µg/m3/103 ton) | 0.027 | 0.030 | 0.029 | 0.023 | 0.027 | 0.033 | |
| Statistic (a=) | All Grid Cells (N = 631) | |||||
|---|---|---|---|---|---|---|
| Min | Median | 75th Percentile | 90th Percentile | Max | CAVE | |
| 0.01 | 0.53 | 0.80 | 1.06 | 8.51 | 0.71 | |
| 0.07 | 0.62 | 0.89 | 1.35 | 9.84 | 0.91 | |
| 0.57 | 0.86 | 0.98 | 1.07 | 1.79 | 0.86 | |
| 0.94 | 4.81 | 8.53 | 12.71 | 85.64 | 9.73 | |
| 2.72 | 8.48 | 11.87 | 29.67 | 719.08 | 14.81 | |
| 0.80 | 1.84 | 2.78 | 4.46 | 13.90 | 1.52 | |
| 2.16 | 7.72 | 10.86 | 28.79 | 673.13 | 12.71 | |
| 0.52 | 1.65 | 2.53 | 3.90 | 9.30 | 1.31 | |
| Statistic (a=) | All Stations (N = 13) | |||||
|---|---|---|---|---|---|---|
| Min | Median | 75th Percentile | 92nd Percentile | Max | CAVE | |
| 0.35 | 0.61 | 1.01 | 1.73 | 7.99 | 1.30 | |
| 0.38 | 1.04 | 1.55 | 2.53 | 9.09 | 1.97 | |
| 0.58 | 0.95 | 1.00 | 1.44 | 1.48 | 0.88 | |
| 3.05 | 10.07 | 11.65 | 18.76 | 72.65 | 19.17 | |
| 6.05 | 40.91 | 45.32 | 101.18 | 651.55 | 60.33 | |
| 0.85 | 4.00 | 4.54 | 7.76 | 8.97 | 3.15 | |
| 5.35 | 40.96 | 64.88 | 97.09 | 618.05 | 53.28 | |
| 0.52 | 4.24 | 5.17 | 6.69 | 8.51 | 2.78 | |
Disclaimer/Publisher’s Note: The statements, opinions and data contained in all publications are solely those of the individual author(s) and contributor(s) and not of MDPI and/or the editor(s). MDPI and/or the editor(s) disclaim responsibility for any injury to people or property resulting from any ideas, methods, instructions or products referred to in the content. |
© 2023 by the authors. Licensee MDPI, Basel, Switzerland. This article is an open access article distributed under the terms and conditions of the Creative Commons Attribution (CC BY) license (https://creativecommons.org/licenses/by/4.0/).
Share and Cite
Chen, T.-F.; Chen, B.-Y.; Chang, K.-H. Simulation and Estimation of the Inter-Source Category and/or Inter-Pollutant Emission Offset Ratios for a Heavy Industry City. Atmosphere 2023, 14, 748. https://doi.org/10.3390/atmos14040748
Chen T-F, Chen B-Y, Chang K-H. Simulation and Estimation of the Inter-Source Category and/or Inter-Pollutant Emission Offset Ratios for a Heavy Industry City. Atmosphere. 2023; 14(4):748. https://doi.org/10.3390/atmos14040748
Chicago/Turabian StyleChen, Tu-Fu, Bo-Yan Chen, and Ken-Hui Chang. 2023. "Simulation and Estimation of the Inter-Source Category and/or Inter-Pollutant Emission Offset Ratios for a Heavy Industry City" Atmosphere 14, no. 4: 748. https://doi.org/10.3390/atmos14040748
APA StyleChen, T.-F., Chen, B.-Y., & Chang, K.-H. (2023). Simulation and Estimation of the Inter-Source Category and/or Inter-Pollutant Emission Offset Ratios for a Heavy Industry City. Atmosphere, 14(4), 748. https://doi.org/10.3390/atmos14040748


