Article

Strong Nonideal Electric Fields and Energy Dissipation Observed by MMS within Field-Aligned Current Layers in the Plasma Sheet of the Earth’s Magnetotail

Space Research Institute of RAS, Moscow 117997, Russia
*
Author to whom correspondence should be addressed.
Atmosphere 2023, 14(4), 722; https://doi.org/10.3390/atmos14040722
Submission received: 27 March 2023 / Revised: 6 April 2023 / Accepted: 14 April 2023 / Published: 16 April 2023
(This article belongs to the Section Upper Atmosphere)

Abstract

:
We report the MMS observations of the intense spikes of field-aligned current (FAC) produced by magnetic reconnection at the plasma sheet (PS) field lines. The MMS was located tailward of a near-Earth X-line and the most intense spike of FAC with an electric current density of ∼70 nA/m2 was observed near the magnetic separatrix. The FAC structures located deeper in the PS were strongly filamented and consisted of several spikes with a thickness of ∼(1–2) ρ e ( ρ e is the gyroradius of thermal electrons). We found that the FAC in these structures was carried by unmagnetized thermal and suprathermal electron populations (≥ 1 keV), which were ∼(20–80)% of the entire electron population. Strong nonideal electric fields up to ∼100 mV/m were detected in the FAC spike near the magnetic separatrix. The generation of these fields was mainly due to the anomalous resistivity, possibly caused by the electrostatic fluctuations. As a result, a significant energy dissipation of up to 1.3 nW/m3 occurred within the electron-scale FAC structure, which caused an increase in the electron temperature by a factor of two compared with that outside the FAC. Thus, MMS observations demonstrate that during the interval of the active X-line, the outer part of the PS consists of multiple electron-scale FAC layers/filaments in which a significant energy exchange between electrons and fields occurs. To investigate the stability of these filaments and estimate their lifetime, additional observations and theoretical studies are needed.

1. Introduction

Magnetic reconnection is the most powerful process of energy conversion in space plasma. In the Earth’s magnetotail, it generates various dynamic phenomena: bursty bulk flows (BBFs), dipolarization fronts (DFs), flux ropes/magnetic islands, the perturbations in the cross-tail current sheet (CS), generation of field-aligned currents (FACs) and plasma acceleration (e.g., [1,2,3,4,5]). The magnetoplasma structures propagating from a reconnection site transfer the energy and momentum towards the Earth and may cause the local CS perturbations as well as affect local plasma distributions (e.g., [6,7] and references therein).
The multipoint cluster and THEMIS observations revealed the importance of energy conversion processes at ion kinetic scales. However, multipoint observations at electron kinetic scales were inaccessible until the launch of the Magnetospheric Multiscale Mission (MMS) [8]. The MMS spacecraft with its compact tetrahedron configuration opened a new era in “in situ” observations of electron-scale structures and plasma processes in the key regions of magnetic energy conversion in the terrestrial magnetosphere. Namely, the formation of electron-scale current layers embedded in the cross-tail CS and in the magnetopause CS were revealed (e.g., [9,10]). Such small-scale intense current structures may accumulate a significant amount of free energy, the dissipation of which may cause the energization of the local plasma population and affect its anisotropy.
FACs were also observed in the plasma sheet boundary layer (PSBL) (e.g., [11,12]). The PSBL has been known for decades as the near-separatrix region that separates open, not reconnected magnetic field lines and newly reconnected closed magnetic field lines. The PSBL, thus, is an important energy and mass transfer channel ([13,14,15] and references therein). The MMS observations near the PSBL reported the presence of electron-scale field-aligned current layers formed by the short-living field-aligned electron beams accelerated in the remote source. The spatial scale of these current layers was estimated to be about a few tens of kms [16]. The spatial distribution of FACs agreed with that typical for the near-separatrix region, with the earthward-directed current observed at the outer edge of the PSBL and the tailward FAC observed at the inner PSBL region. [16] reported a highly structured topology of the FAC system, consisting of spiky FACs on a time scale of a few seconds. The small thickness of FACs (∼a few electron inertial lengths) and their short life time caused a decoupling of ion and electron dynamics which, in turn, may lead to the generation of strong electric fields and affect the local particle distributions.
In this paper, we report the MMS observation of strong spiky FACs and the associated spiky electric fields in the outer part of the plasma sheet (PS), i.e., in the region of closed magnetic field lines tailward of a near-Earth X-line. This interval corresponds to the substorm growth phase [10]. Using the MMS observations in the burst mode, we resolve the spatial–temporal structure of FACs and the associated electric fields, and reveal the presence of strong nonideal electric fields generated due to ion–electron decoupling. In the near-separatrix region, strong energy dissipation followed by electron heating was observed. These observations highlight the importance of electron-scale current structures formed well outside the reconnection region as the sources of energy conversion contributing to the shaping of electron velocity distribution and its anisotropy in the PS.

2. Results

2.1. FACs Observation by the MMS Spacecraft in the Plasma Sheet

Figure 1 shows an overview of the magnetic and electric fields, ion bulk flow velocity and the electric current density observed by the MMS spacecraft on 6 July 2017 between 15:40:47 UT and 15:41:03 UT. The data shown are measured in the burst mode and are obtained in the barycenter of the MMS tetrahedron configuration. The geocentric solar ecliptic (GSE) coordinate system is used everywhere in the paper.
During the interval of interest, the MMS was moving from the neutral plane towards the southern lobe. This manifested in the increase in the absolute value of the negative component of the B x magnetic field (see Figure 1a). At this time, a high-velocity bulk flow directed tailward was detected (see Figure 1b). This means that the MMS spacecraft was located tailward of a near-Earth X-line (e.g., [3]).
Figure 1d shows three components of the electric current density calculated using the curlometer technique [17]. Between ∼15:40:51 UT and ∼15:40:56 UT, the strong spikes of electric currents with amplitudes up to ∼70 nA/m2 were observed. The electric currents were directed mainly along X and were observed in the southern part of the outer PS region, where the B x component of the magnetic field was strong (up to ∼−16 nT, see Figure 1a).
Figure 1c displays three components of the electric field (E) measured by the EDP instrument [18]. The strong spiky electric fields with amplitudes of up to ∼100 mV/m were detected simultaneously with the spikes of electric current density.
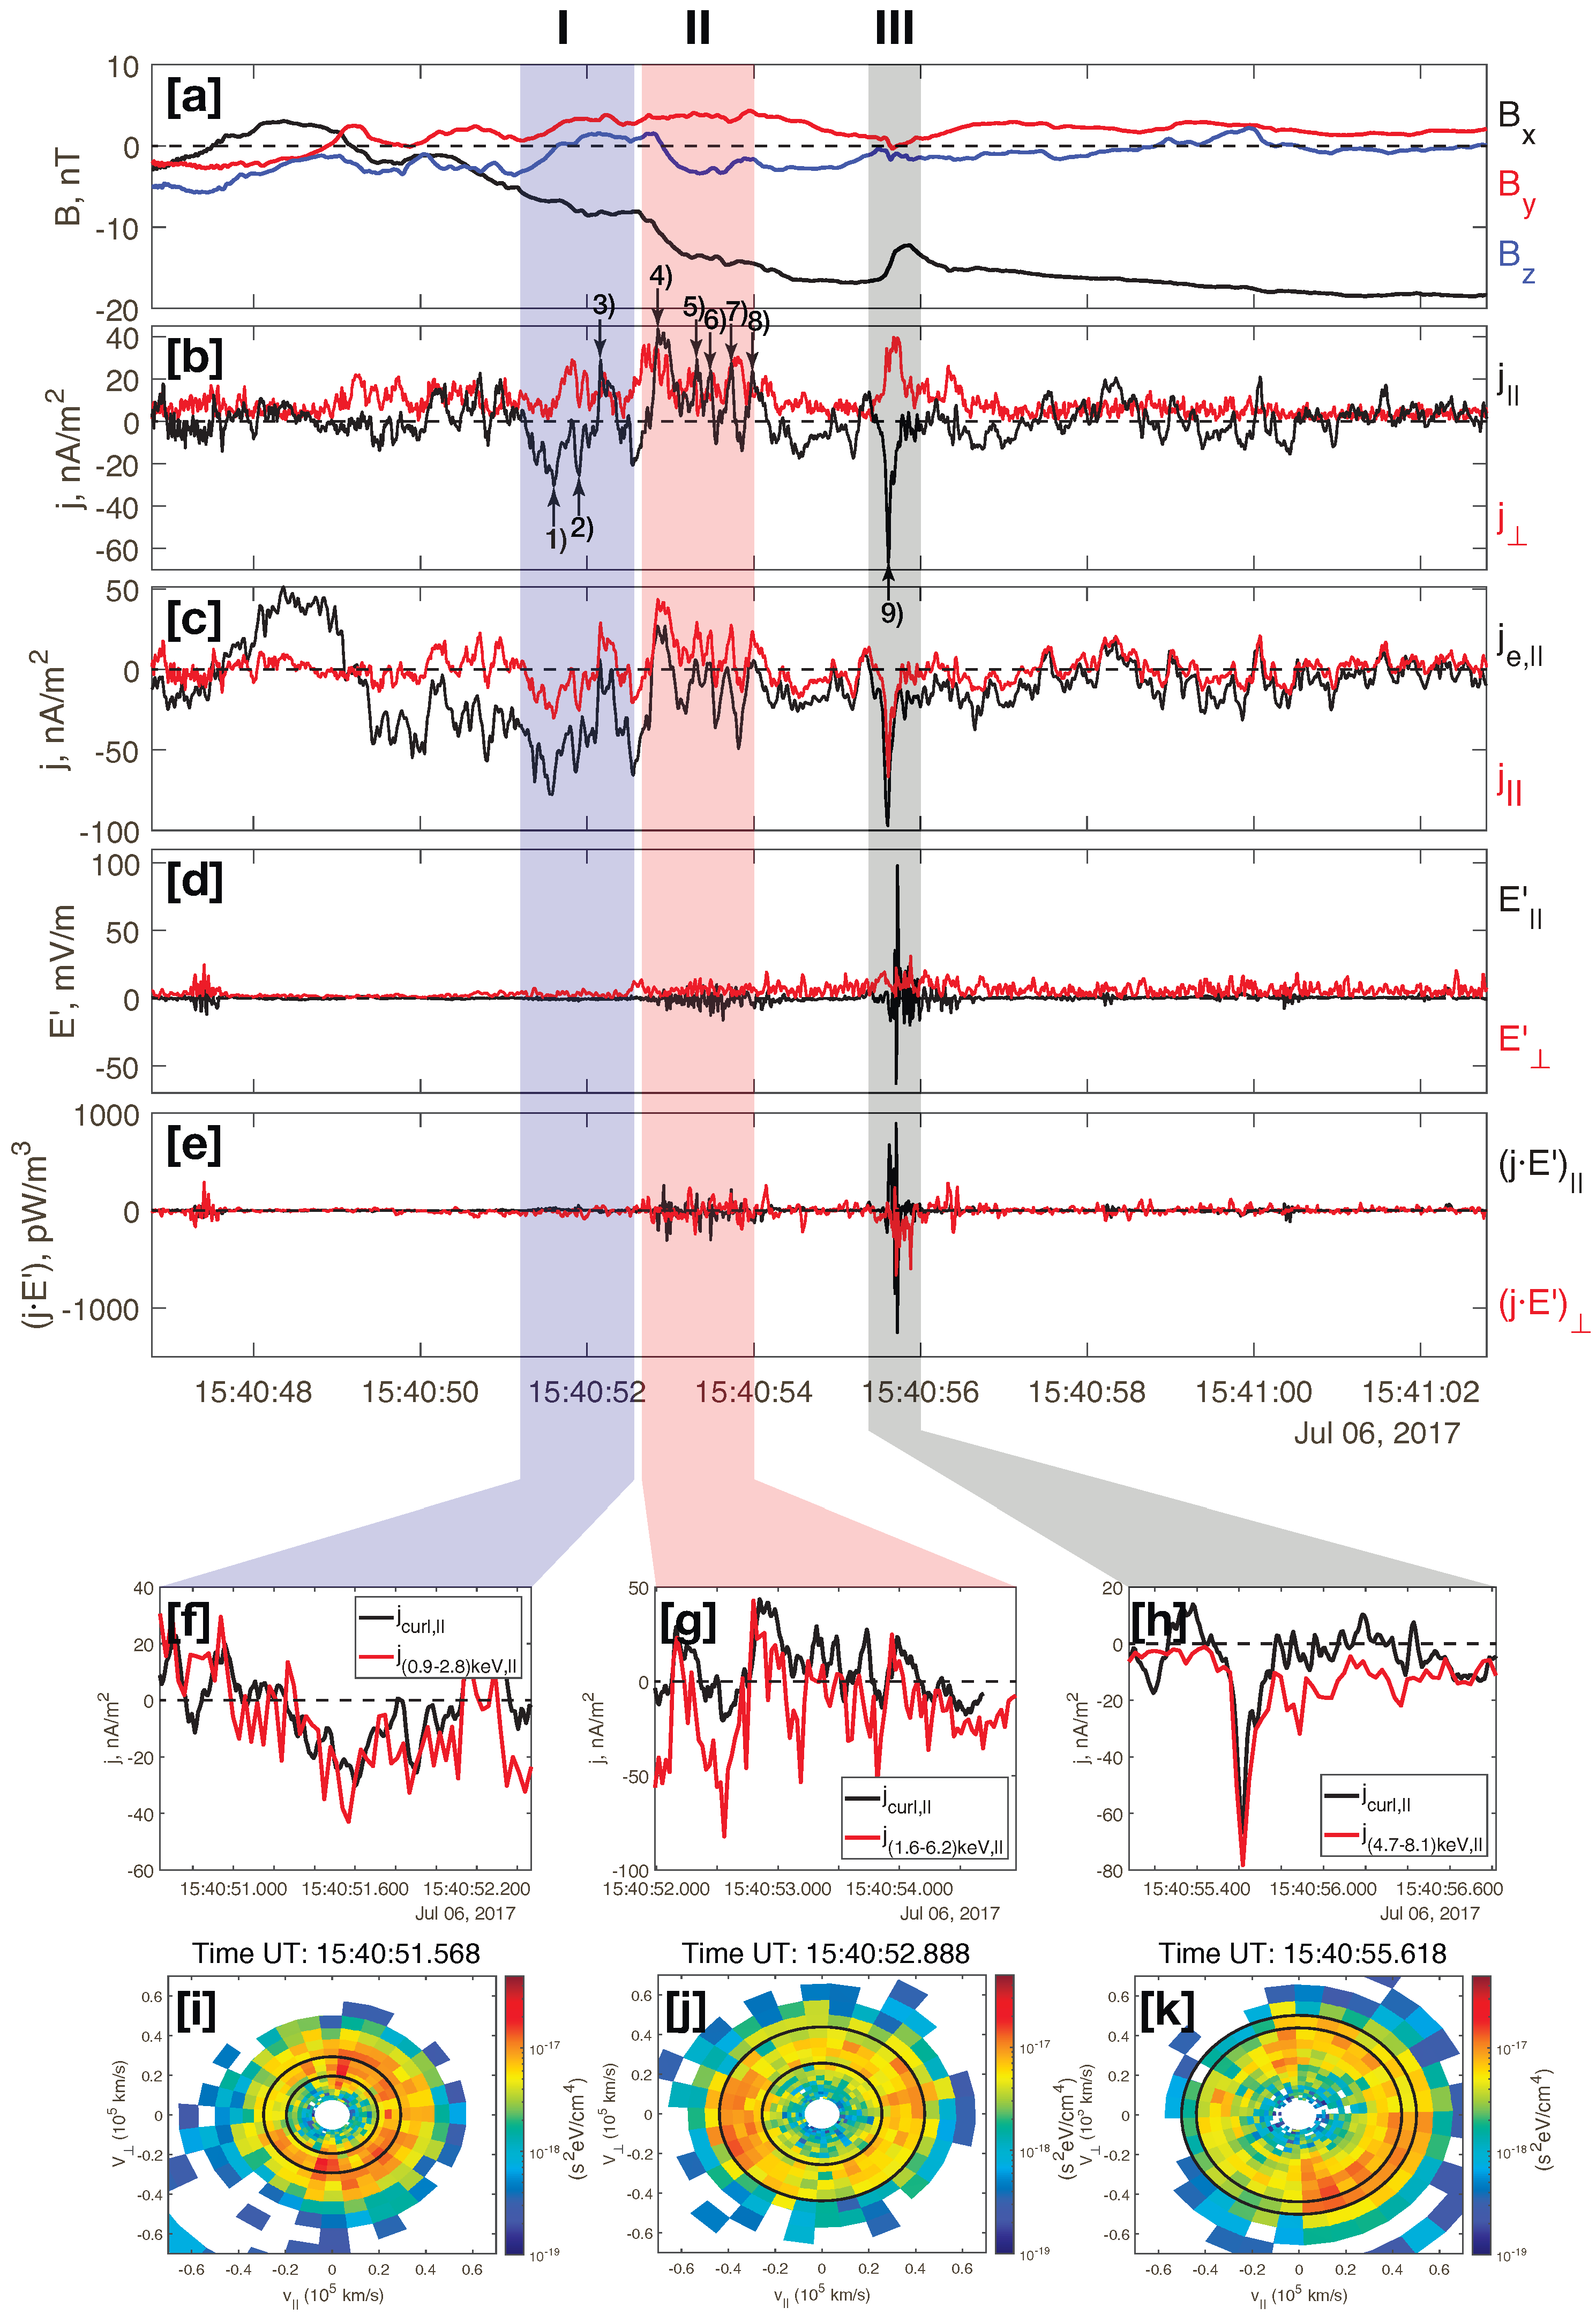
Figure 2b displays the parallel and perpendicular components of the electric current density, shown by the black and red lines, respectively. We identified three intervals of strong FACs and marked them as “I” (the blue shaded interval), “II” (the pink shaded interval) and “III” (the grey shaded interval). During the interval “I” (at 15:40:51.232–15:40:52.545 UT) the strong, mainly negative spikes of FAC with amplitudes of up to −30 nA/m2 were observed. The j | | -spikes are indicated by the black arrows and numbered as (1), (2) and (3) in Figure 2b. Since the MMS spacecraft was in the southern hemisphere the negative sign of the FACs indicates on its earthward direction, i.e., towards the X-line.
During the interval “II” (at 15:40:52.756–15:40:53.982 UT), five positive spikes of FAC with amplitudes of up to ∼40 nA/m2, directed tailward, i.e., outwards the X-line, were detected. The spikes are marked as (4), (5), (6), (7) and (8) in Figure 2b.
During the interval “III” (at 15:40:55.381–15:40:56.045 UT), a very strong negative spiky FAC directed towards the X-line was registered. This j | | -spike is marked as (9) in Figure 2b. The amplitude of this FAC spike was ∼70 nA/m2.
To estimate the spatial scale (a half-thickness) of the FACs, we used the timing analysis [19]. We applied it to the moments of four-point MMS observations of the maximum FAC density calculated by using ion and electron number density ( n e ) and parallel bulk velocities ( V | | , e ) measured by the FPI experiments onboard four MMS probes [20] in each FAC interval (“I”–“III”): j | | , α = e n ( V | | , i , α V | | , e , α ) (where α denotes a number of a particular MMS probe). For the interval “I” we determined that the FAC structure moved mostly along −Y: V/|V| = [0.48, −0.86, 0.18] and its propagation velocity was |V| ∼ 140 km/s. The FAC structure observed during the interval “II” moved also mostly along −Y: V/|V| = [0.38, −0.82, 0.42] with the propagation velocity |V| ∼ 130 km/s. For the interval “III” we determined that the FAC structure moved mostly along −Z: V/|V| = [−0.1, 0.59, −0.8] and its propagation velocity is |V| ∼ 390 km/s.
The half-thickness of each spike of FAC observed in a given time interval (“I”–“III”) can be calculated as L k = | V | · d t k , where |V| is the propagation velocity of FAC structure in the corresponding interval and d t k is the time between the moments of half-maximum current density observations in each k-th spike of the FAC in the given interval. The values of a half-thickness of each j | | -spike are presented in Table 1 along with the values of the gyroradius of thermal electrons ( ρ e ) calculated in a given current spike. The half-thickness of the j | | -spikes ranged from 0.3 ρ e to 1.4 ρ e . This means that the thickness of the j | | -spikes is ∼(1–2) ρ e .
To define the FAC carrying plasma component(s), we compared the field-aligned electric current density calculated from the four-point magnetic field observations by using the curlometer technique ( j | | ) with the field-aligned electron ( j | | , e ) parallel current density calculated from electron moments measured by the FPI and observed at the MMS barycenter. The electron current density at the MMS barycenter was calculated as j | | , e = e · ( n e 1 V | | , e 1 + n e 2 V | | , e 2 + n e 3 V | | , e 3 + n e 4 V | | , e 4 ) / 4 , where n e and V | | , e are the electron density and parallel bulk velocity measured by a given MMS probe.
Figure 2c shows the time profiles of j | | (shown by the red line), j | | , e (shown by the black line). It is seen that there are discrepancies between j | | and j | | , e in all FAC intervals. These discrepancies can be caused by ion contribution to j | | . Another cause is that the observed j | | is not carried by the entire electron population measured by the FPI, but a current-carrying electron population having energies in a finite energy range.
To ascertain a role of different electron populations in carrying the electric current in the FAC structures, we calculated the density ( n e ) and parallel bulk velocity ( V | | , e ) by integration of the 3D electron velocity distribution function in the finite energy range. Namely, we changed, step-by step, the low-energy boundary of the energy range used for the integration by excluding one low-energy channel in each step of integration procedure. Then, at each step we calculated n e , V e and j | | , e and compared j | | , e with j | | observed in each FAC interval (“I–III”). At that step, in which the discrepancy between j | | , e and j | | was minimal, we defined the energy range of the current-carrying electron population in a given FAC interval. We determined that electrons with energies (0.9–6.2) keV, (1.6–4.7) keV and (3.6–10.6) keV make the maximum contribution to the FAC observed during the intervals “I”, “II” and “III”, respectively. Figure 2f–h show the time profiles of j | | (black line) and j | | , e (red line), which was calculated by using the defined energy range of the electron population making the maximum contribution to j | | in each FAC interval.
Figure 2i–k show the 2D electron velocity distribution functions multiplied by energy corresponding to each bin plotted in the ( V | | , V , 1 ) plane at the moments of maximum j | | observed in each FAC interval (“I”–“III”), where V , 1 is directed along a unit vector v , 1 = [ E × V ] / | [ E × V ] | . The black circles in each distribution function mark the energy range of the electron current-carrying component. In the interval “I”, the field-aligned electrons moving with V | | > 0, i.e., tailward from the reconnection region, are observed in the selected energy range (Figure 2i). These electrons contribute to the earthward FAC observed during this interval. In the interval “II” the electron beam moving with V | | < 0, i.e., earthward and towards the X-line, is observed in the energy range of current-carrying electron component (Figure 2j). This beam can contribute to the tailward FAC observed during this interval. In the interval “III”, the field-aligned electrons moving with V | | > 0, i.e., tailward and from the X-line, are observed in the energy range of the current-carrying electrons (Figure 2k). In this interval the intense earthward FAC is mostly produced by these electrons.
The small thickness of the j | | -spikes causes a significant part of the electron population to become unmagnetized, so that the parameter of adiabaticity κ e for such population is less than 1 [21]. We calculated κ e for the current-carrying electron population in each j | | -spike as κ e , k = L k · Ω e k / V T k , where Ω e k and V T k are the electron gyrofrequency and thermal velocity in the k-th j | | -spike, respectively. We determined that in all j | | -spikes, κ e is less than 1 for the current-carrying electron population (see Table 1). Thus, the unmagnetized electrons make the major contribution to the observed intense j | | -spikes.
In the next section we discuss the energy dissipation associated with these strong, small-scale FACs and its influence on the electron populations.

2.2. Energy Dissipation and Electron Heating

Figure 2d shows the time profiles of the parallel (shown by the black line) and perpendicular (shown by the red line) components of the nonideal electric field. The nonideal electric field was calculated as E = E + [ V e × B ] , where V e is the electron bulk velocity. During the interval “II”, E′ variations with amplitudes ∼15 mV/m were observed both in the parallel and perpendicular components. During the interval “III”, the strong bipolar variations of the parallel E′ with amplitude up to ∼100 mV/m were registered near the edge of the j | | -spike. The amplitude of perpendicular E′ was much smaller. The non-zero value of the nonideal electric field denotes the violation of a frozen-in condition even for electrons.
To quantify the energy dissipation in FAC structures we use the ( j · E ) parameter, which is a scalar product of the electric current density and the electric field in the electron rest frame. The energy dissipation was enhanced in the intervals “II” and “III” (see Figure 2e). During the interval “II” ( j · E ) fluctuates with amplitude ∼0.3 nW/m3, which was almost similar for the parallel and perpendicular components of this parameter. During the interval “III”, the largest variations of ( j · E ) with amplitudes of up to ∼1.3 nW/m3 were observed within the FAC structure, and they were dominated by the parallel component of ( j · E ) (see Figure 2e). Thus, the strongest energy dissipation occurred in the near-separatrix region and it was associated with the most external intense FAC directed towards the reconnection region and produced by the filed-aligned accelerated electrons moving from the X-line.
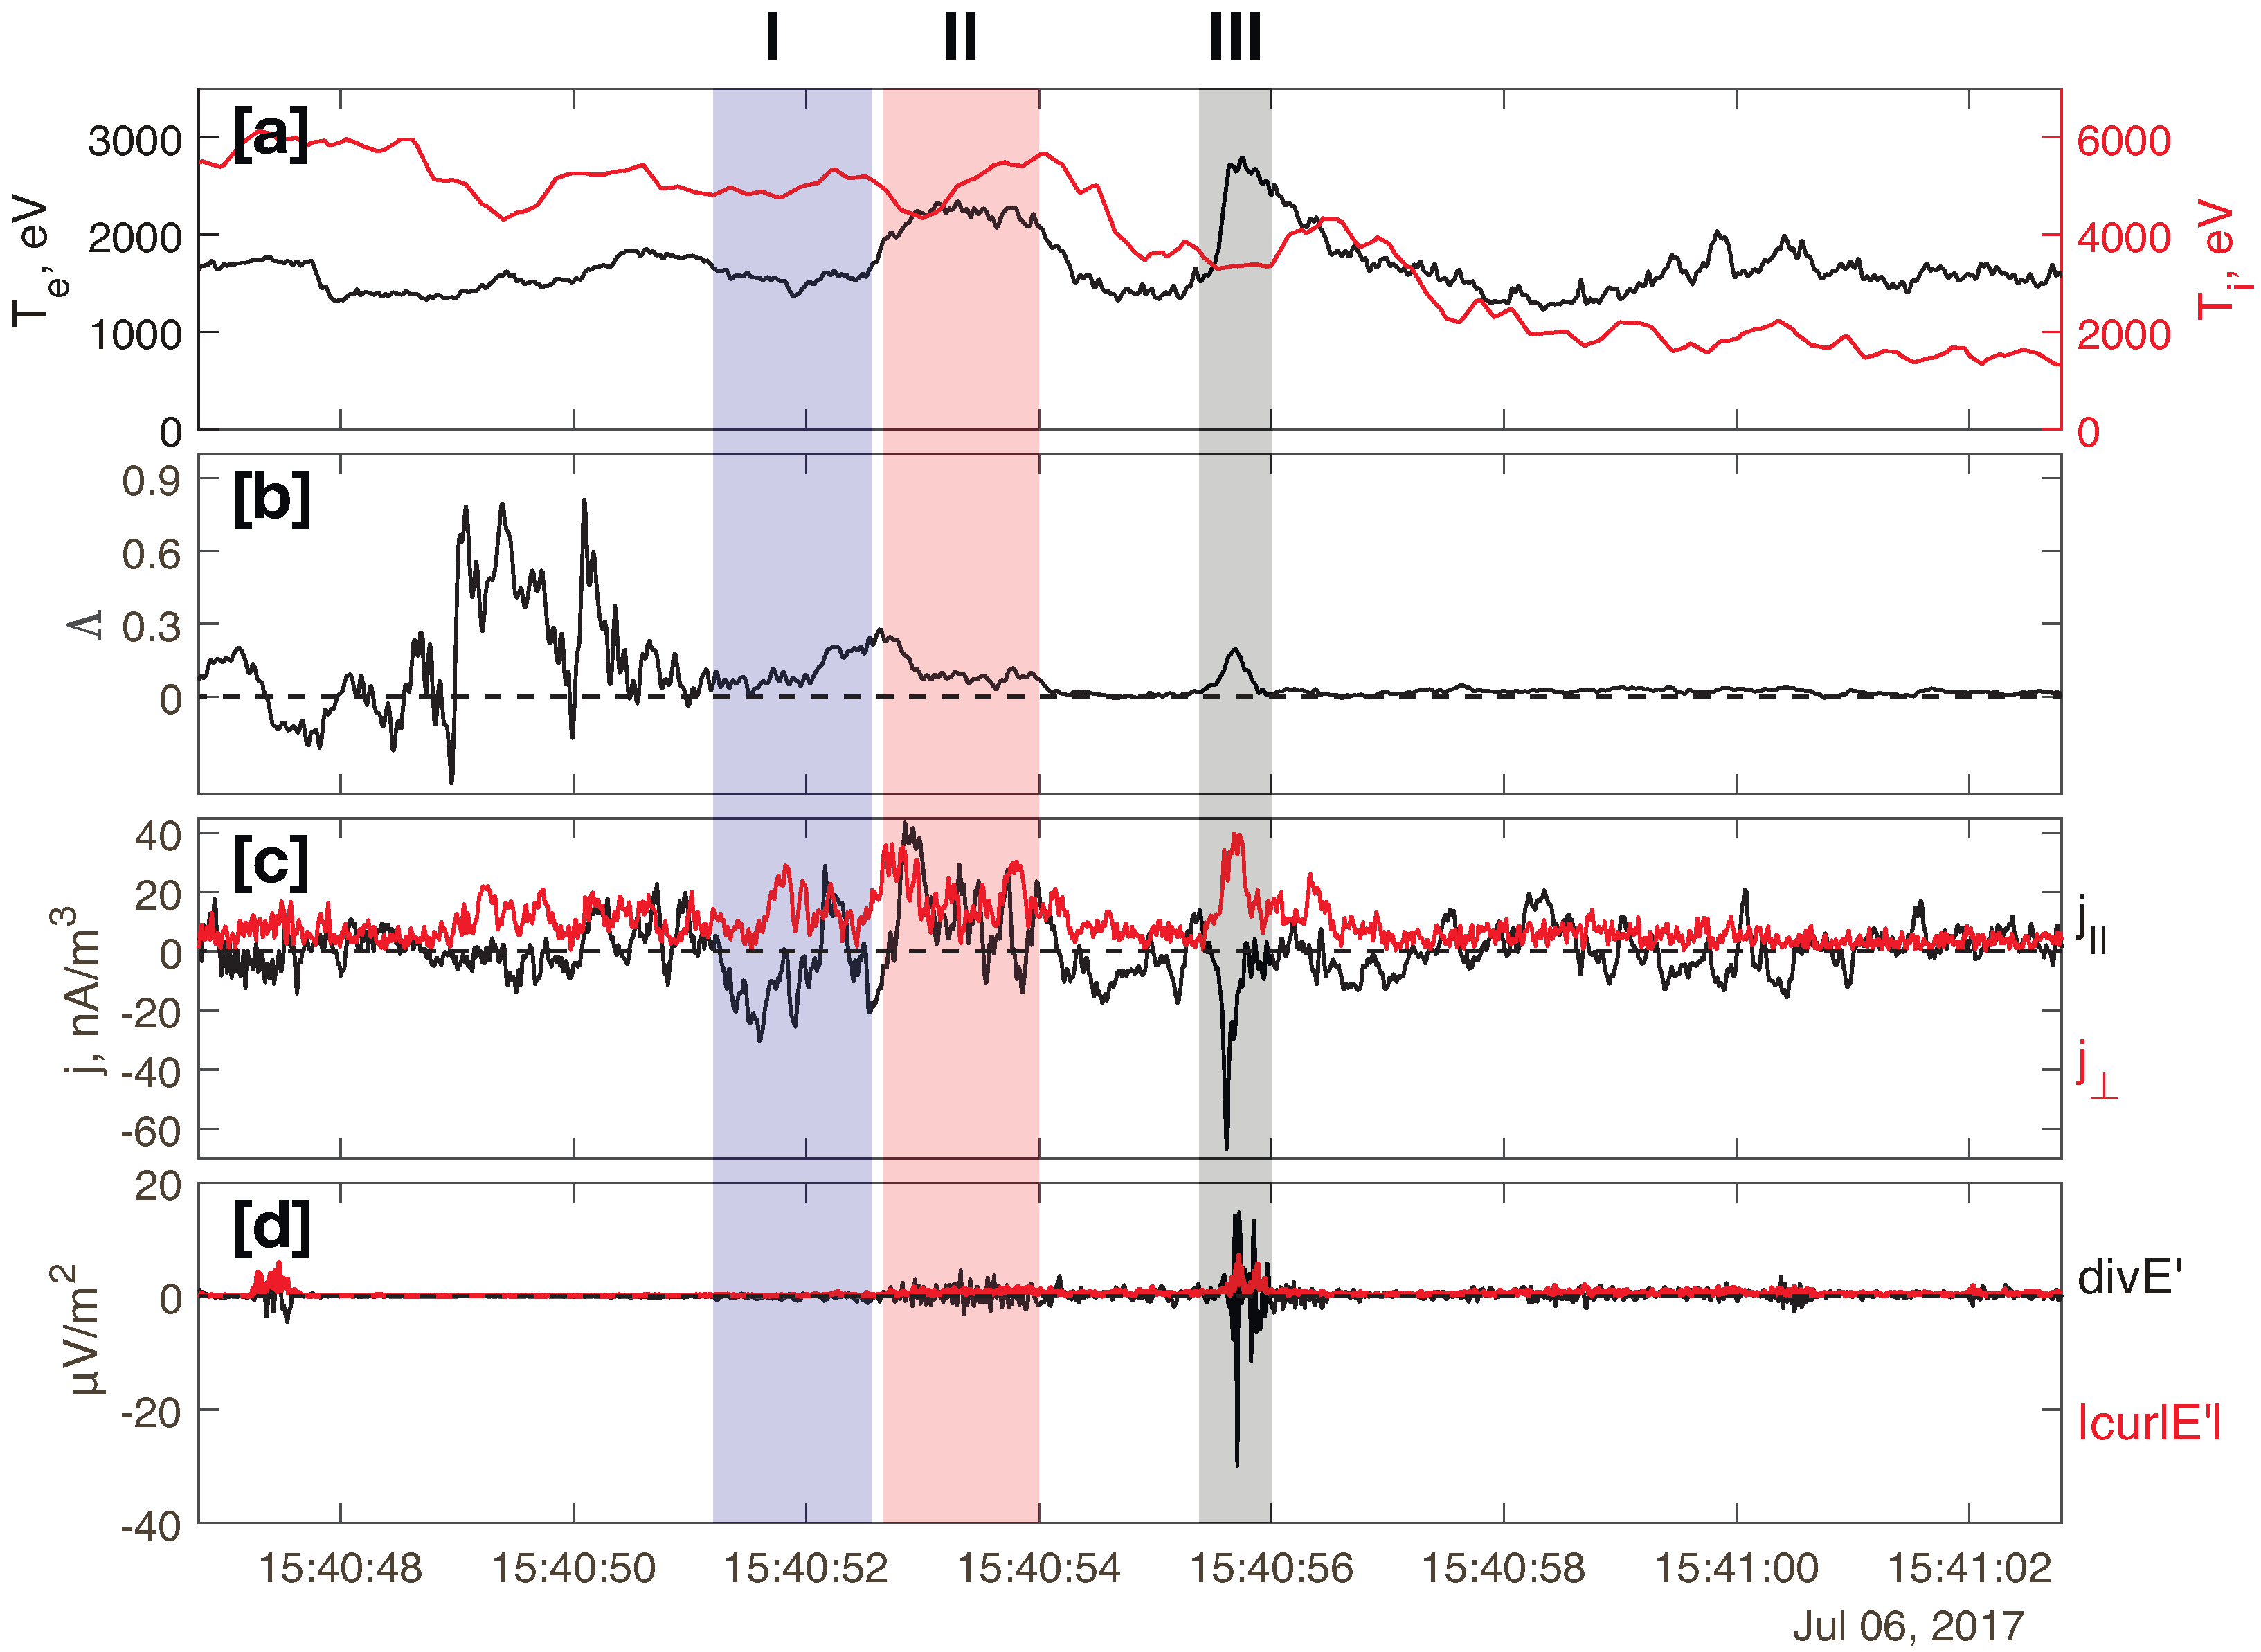
The energy dissipation processes should affect the ambient plasma population. Figure 3a presents the time profiles of electron ( T e ) and ion ( T i ) temperatures, shown by the black and red lines, respectively. During the interval “I”, both components of ( j · E ) were almost zero, and significant increases in ion and electron temperatures were not observed. During the interval “II”, the electron temperature increased from ∼1500 eV up to ∼2300 eV within the FAC structure. An increase in the ion temperature was also observed, but it was delayed relative to the increase in T e , so that the local maximum of T i was observed outside the FAC structure and, probably, was not caused by the energy dissipation at the electron scale within the FAC structure. The strongest increase in T e was detected within the earthward FAC during the interval “III”, when the largest value of ( j · E ) was registered. At this time T e increased from ∼1500 eV up to ∼2800 eV within the FAC structure. The ion temperature almost did not change at this time, so that ion-to-electron temperature ratio decreased to ∼1.2. Thus, within the FAC structures ‘II” and “III”, the energy dissipation processes caused significant electron heating and the increase in T e by a factor of (1.5–2) compared to that outside the FAC structures.
Figure 3b shows the time profile of electron anisotropy Λ calculated as
Λ = n ( T e , | | T e , ) B 2 / 4 π ,
where B is the absolute value of the local magnetic field. Some increase in parallel anisotropy ( Λ > 0 ) is observed between the FAC structures “I” and “II”. The increase in parallel anisotropy is also detected near the edge of the FAC structure “III” (see Figure 3b,c). However, in all these intervals the FAC structures are characterized by rather small values of parallel anisotropy Λ < 0.3.

2.3. Ion-Electron Decoupling and the Origin of Strong Electric Fields

The strong nonideal electric fields E′ observed within the FAC structures “II” and “III” denote the violation of a frozen-in condition even for electrons. To define whether these fields are either potential and generated due to electrostatic effects or they have a vortex nature, we calculated div(E′) and curl(E′) by using the curlometer technique applied to four-point MMS observations of E′. The increase in div(E′) means the generation of electrostatic electric fields, while the increase in curl(E′) denotes the generation of an induction electric field. Figure 3d presents the time profiles of div(E′) and curl(E′) shown by the black and red lines, respectively.
Inside the FAC structure “I”, no pronounced variations were observed either in div(E′) or in curl(E′). Inside the FAC structure “II”, div(E′) experienced variations with the amplitude several times larger than the background level of div(E′) (outside the FAC). The variations in curl(E′) were also observed, but their amplitude was generally smaller than that of div(E′). Inside the FAC structure “III” the strongest variations of div(E′) with the amplitude up to 30 μ V/m 2 were detected, while the amplitude of curl(E′) variations did not exceed ∼8 μ V/m 2 . Thus, in FAC structures “II” and “III”, the electrostatic fields dominated over the induction (vortex) electric fields.
The strong div(E′) may be caused by ion–electron decoupling and charge separation. In the FAC structure “III”, the observed electric field |E′| ∼ 100 mV/m directed along X with div(E′) ∼ 30 μ V/m 2 gives the scale of ion–electron decoupling: l | E | / d i v ( E ) 3 km.
To reveal the potential causes for the breakdown of the frozen-in condition, we calculated the terms of the generalized Ohm’s law for a collisionless plasma. This law in SI units from Maxwell’s and Vlasov’s equations can be written as [22,23]
E = E + u × B = m e ν e i n e 2 j + m e n e 2 j t Anomalous   resistivity + 1 n e j × B Hall s   term 1 n e · P e Pressure   term + m e n e 2 · u j + j u Inertia   term .
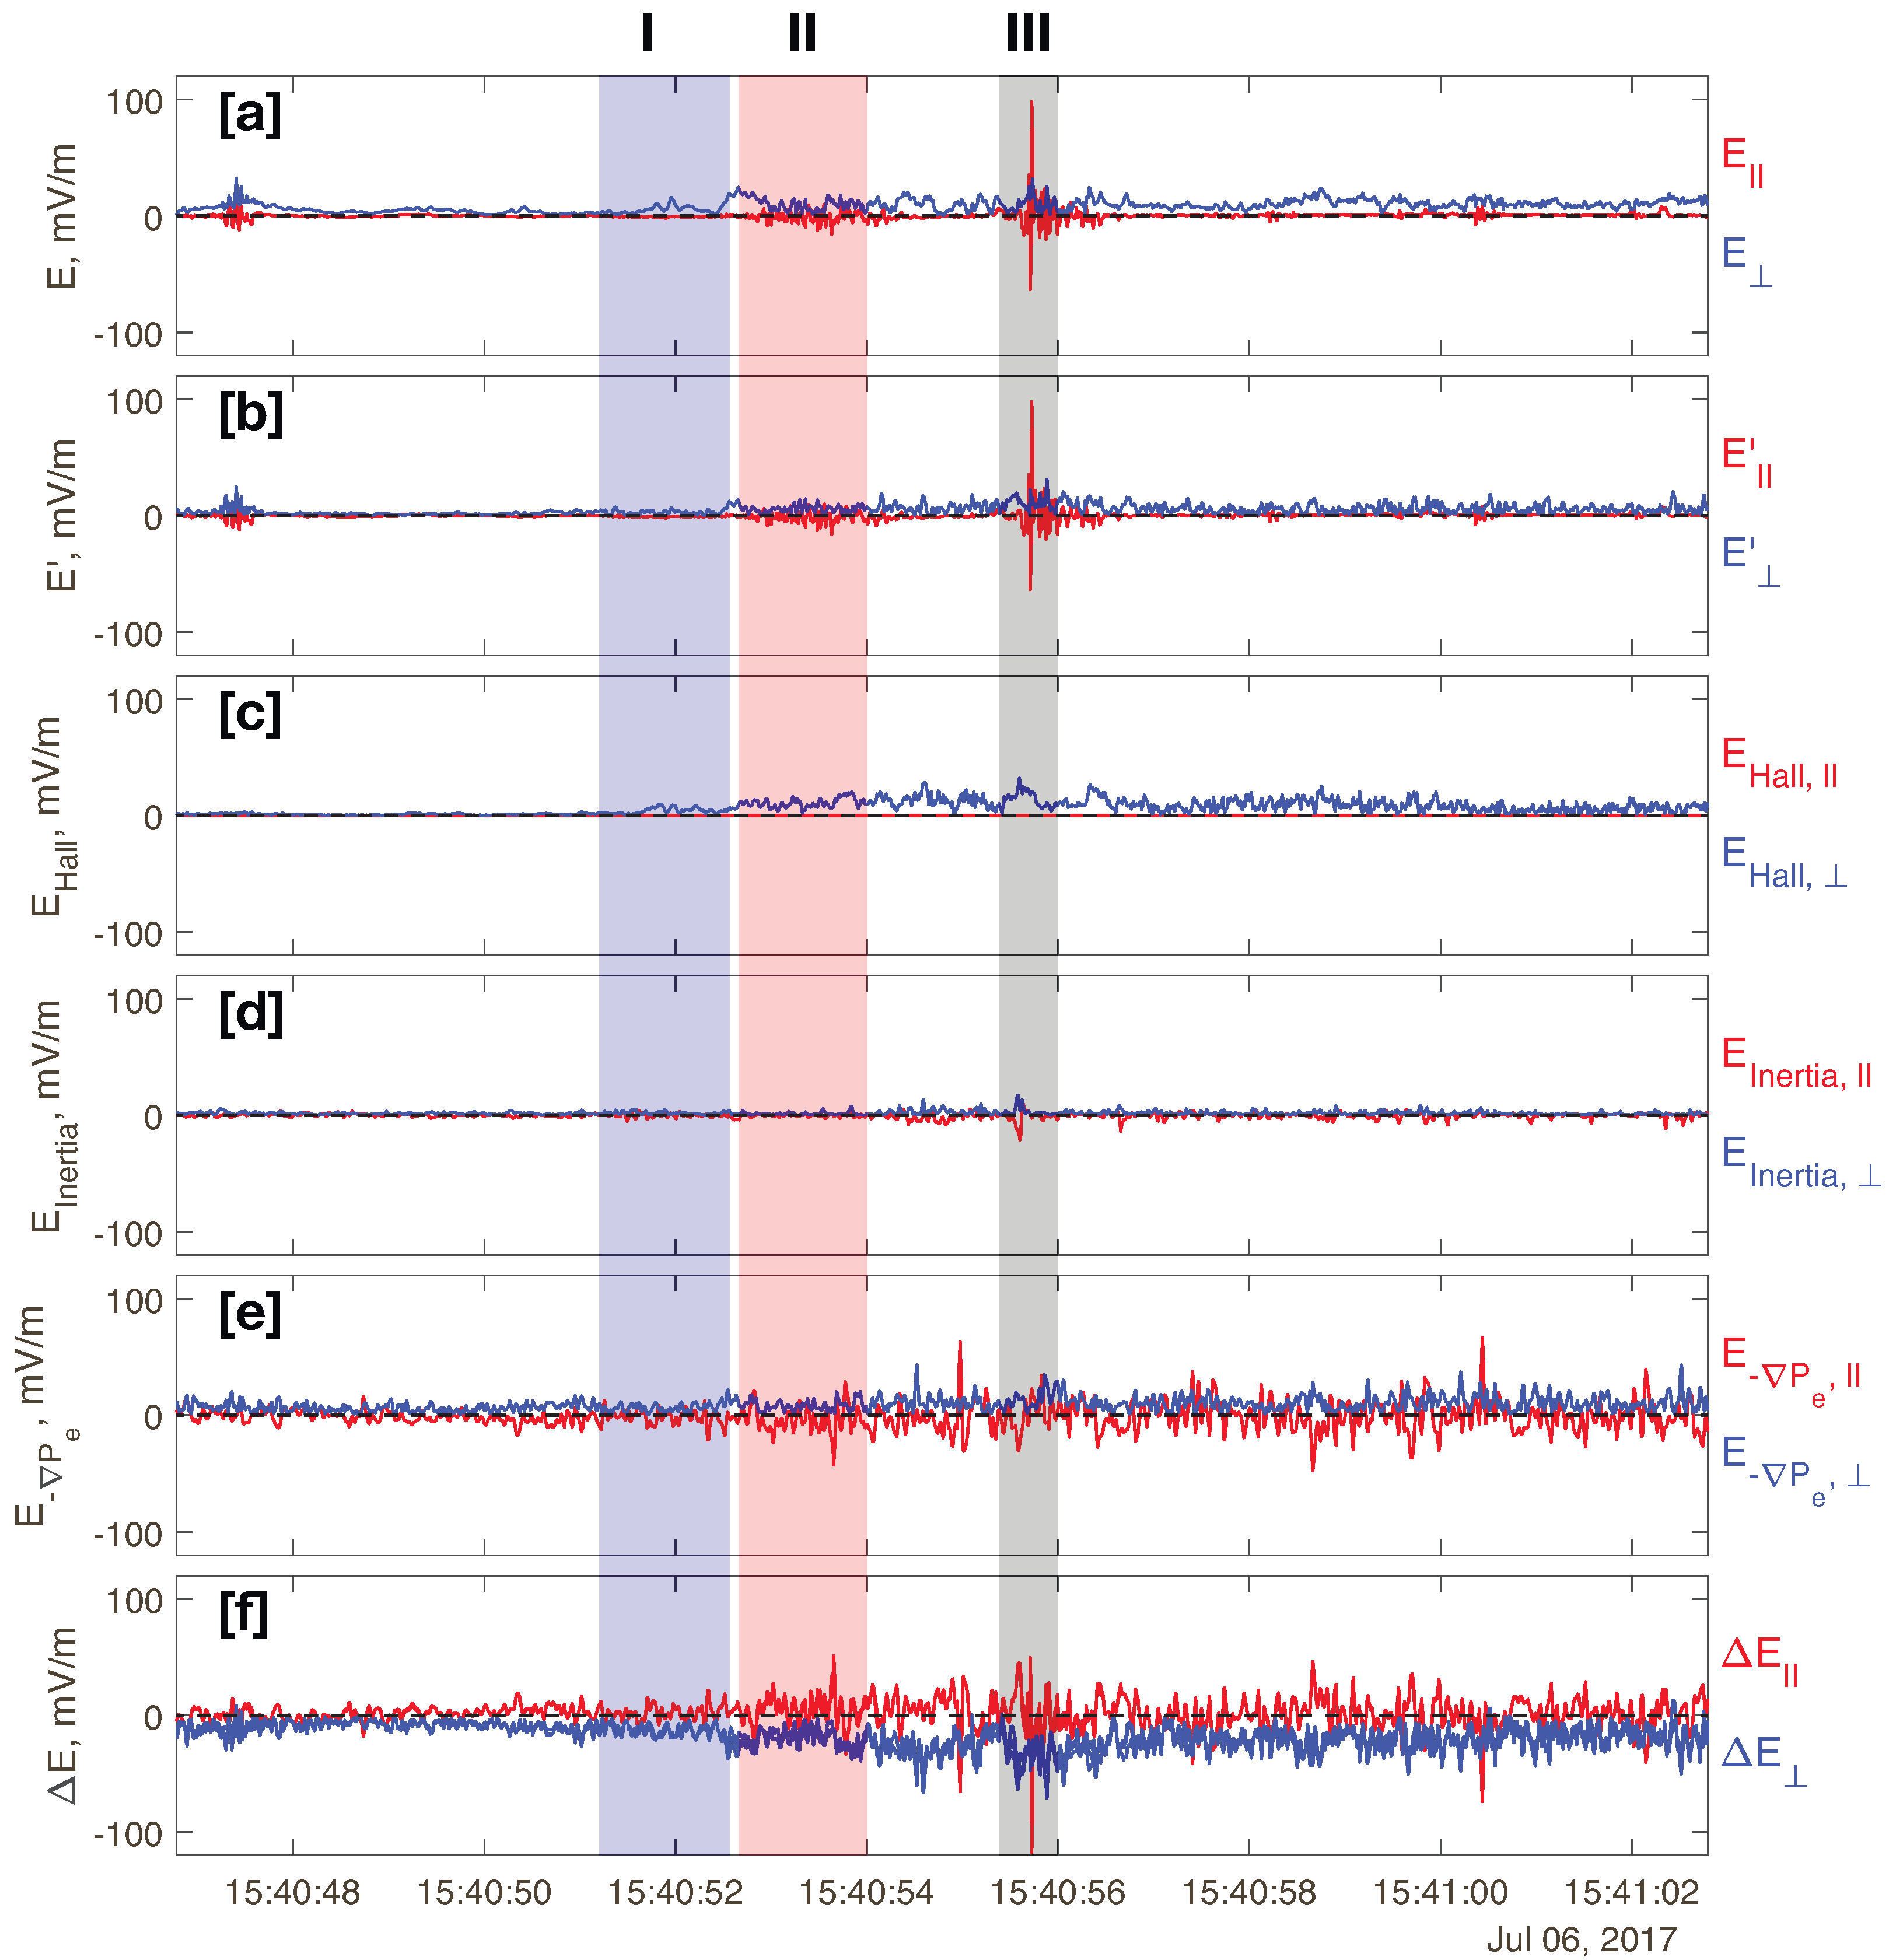
Figure 4c–e show the time profiles of the parallel (shown by the red lines) and perpendicular (shown by the blue lines) components of Hall, inertia and pressure gradient terms of Ohm’s law, respectively. Figure 4f presents the difference between |E′| and the sum of these three terms, Δ E, that corresponds to the anomalous resistivity term. For a better comparison, we use the same limits for the vertical axes in all panels of Figure 4.
The Hall’s term describes well the perpendicular component of the nonideal electric field (see Figure 4b,c). The pressure gradient term almost does not contribute to the observed nonideal electric fields and has a noise-like time profile (Figure 4e). The inertia term has a small peak-like structure with the amplitude of up to −20 mV/m inside the FAC structure “III”, and it can potentially contribute to the observed nonideal electric field. However, this peak does not coincide exactly with the E’-spike, possibly, due to the lower resolution of the FPI. The best correspondence is observed between the anomalous resistivity term, Δ E, and the observed E′, especially, for the FAC structure “III” (see Figure 4f). This means that anomalous resistivity can play a significant role in breaking the frozen-in condition in the FAC structure located near the magnetic separatrix.

3. Discussion

FACs and parallel electric fields are typical phenomena observed near the magnetic separatrix separated, non-reconnected and newly reconnected magnetic field lines. If reconnection occurs in the lobe field lines, then the FACs are observed near the high-latitude edge of the PSBL. In this case the structure of oppositely directed FACs is formed by the cold field-aligned electron beam of ionospheric origin directed towards the X-line and located near the lobeward edge of the PSBL and by the accelerated electron beam moving from the X-line (e.g., [11,12,15]). If magnetic reconnection occurs in the PS field lines, then the oppositely directed FACs observed near the magnetic separatrix are formed by the oppositely directed electron beams having the energies typical for the PS electron population or higher (e.g., [24]).
In this paper we report the electron-scale FAC structures formed by magnetic reconnection at the PS field lines. The MMS observed three FAC structures at the closed PS field lines. The first two structures (“I” and “II”) contained oppositely directed and highly filamented FACs. The third structure (“III”) contained the intense one-directional j | | -spike, mostly generated by electrons moving from the X-line. We suggest that this FAC marked the near-separatrix region, which separated the newly reconnected PS field lines containing the accelerated electrons and the magnetic field lines of the outer PS which were not connected to the near-Earth X-line. If the X-line is located at the PS magnetic field lines and magnetic field lines of the outer PS are not mapped to the reconnection region, then the outer PS does not contain the high-velocity bulk flow. This is confirmed by the | V x | decrease during the spacecraft motion towards the southern lobe (see Figure 1b). In this scenario the FACs “I” and “II” are formed by the electron beams reflected downtail and experiencing the bouncing motion at the closed plasmoid-like magnetic configuration (see the cartoon in Figure 5).
High-resolution observations provided by the MMS mission and its compact tetrahedron configuration allowed the study of the electron-scale structure of FACs. It was revealed that intense FACs transiently observed in the PSBL near the magnetic separatrix had a thickness ∼25 km ∼3 λ e ( λ e is electron inertia length) [16]. The authors suggested that spiky low-energy electron beams generating these FACs could be accelerated by kinetic Alfven waves or other wave disturbances associated with high-velocity ion bulk flow produced by near-Earth reconnection.
In this paper, we reported the FACs generated by more energetic (≥1 keV) field-aligned electron beams observed at the PS field lines. The FAC structures located deeper in the PS were highly structured and consisted of several j | | -spikes. The FAC located near the magnetic separatrix consisted of a single, very intense j | | -spike. The thickness of these spikes was ∼(1–2) ρ e ( ρ e is the gyroradius of thermal electrons). In such super thin current layers or filaments, the parameter of adiabaticity κ e for current-carrying electron component was less than 1, so that the electric current in the j | | -spikes was carried by the unmagnetized electrons. The electron-scale current layers generated by unmagnetized electrons were observed by MMS in the cross-tail current sheet [10]. According to our knowledge, the FACs generated by unmagnetized electrons outside the diffusion region are observed by MMS for the first time.
It is worth noting that the intense j | | -spikes had field-aligned current density >20 nA/m2 and were characterized by small parallel anisotropy: Λ < 0.3. The existing kinetic models consider the generation of strong electron-scale current layers by magnetized electrons [25]. These layers are characterized by strong parallel anisotropy: Λ > 0.7. Our observations showed that intense currents carried by unmagnetized electrons can exist even in the case of small parallel anisotropy. Electron temperature in FAC structures (“II” and “III”) was larger than in the background PS (∼a few keVs, see Figure 3a). As a result, a large fraction of the electron population was unmagnetized. The small values of parallel anisotropy could be because of the non-adiabatic electron scattering.
Strong nonideal electric fields, E′, dominated by the parallel component, were observed in FAC structures, especially, in the structure “III” located near the magnetic separatrix (see Figure 2d). These fields had a bipolar structure resembling the electrostatic solitary waves (ESWs) reported before in the PSBL and near reconnection region (e.g., [26,27,28]). Indeed, the significant enhancements of div(E′) well exceeding the curl(E′) were observed in the FAC structures “II” and “III”. This indicates the mostly electrostatic nature of E′. The electrostatic component of E′ could be generated due to ion–electron decoupling and charge separation at the electron-scale FACs.
The MMS observations of strong nonideal electric fields were reported at the magnetic separatrix before (e.g., [29]). The presence of these fields indicates the violations of the frozen-in condition. In the event analyzed by [29], the observed nonideal electric fields were generated partially by the electron convection term and partially by the pressure gradient term of the generalized Ohm’s law. The anomalous resistivity term was negligible. We also calculated the generalized Ohm’s law terms in order to reveal which term(s) contributes to the observed nonideal electric fields. We found that near the separatrix, the strong parallel component of the nonideal electric field is mainly contributed by the corresponding component of the anomalous resistivity term, while the Hall’s term contributes to the perpendicular component of E′ (see Figure 4). The anomalous resistivity can be caused by strong fluctuations of the electric field, e.g., by the ESWs observed in the FAC structures “II” and “III”.
The strong nonideal electric fields associated with the intense FACs cause the energy dissipation ( j · E 0 ) , especially near the magnetic separatrix (see FAC intervals “II” and “III” in Figure 2e). Closer to the separatrix, the parallel component of ( j · E ) dominated. The parallel component of ( j · E ) experienced bipolar variations with large amplitude, indicating the intense energy exchange between electrons and fields at electron scales. The maximal amplitude of these variations was observed near the separatrix (in the FAC structure “III”) and it was up to ∼1.3 nW/m3, which is comparable with the magnitude of energy dissipation observed in the tailward plasma jet [30], and it was larger than that observed at the dipolarization fronts (e.g., [31,32]). Since the FACs were carried mainly by suprathermal electrons, the parallel energy dissipation was driven by this electron population.
The positive value of the energy dissipation indicates the energy transfer from the electric fields to electrons. Indeed, a significant electron heating is observed within FAC structures “II” and “III”. Inside these structures, the electron temperature, T e , increased by almost two times compared to the background level (see Figure 3c). Wherein, the ion population was not affected, so that the electron heating caused the decrease in T i / T e to ∼1.2. The drop in T i / T e may further affect the plasma instability threshold in the magnetic flux tubes containing the FACs.
During the interval of interest, the MMS spacecraft was moving from the neutral line towards the southern lobe. Thus, according to the suggested magnetic configuration, the FAC structures “I” and “II” had a longer lifetime than the structure “III” (see the cartoon in Figure 5). In comparison to the structure “III”, the FAC structures “I” and “II” were strongly filamented and consisted of several j | | -spikes, but their electric fields, currents and the magnitudes of energy dissipation were significantly smaller than those observed in the structure ‘III”. We may suggest that the longer lifetime of the FAC structures “I” and “II” was sufficient for the development of plasma instabilities, which caused their filamentation, while in the structure “I” these processes were in progress, and caused the observations of strong electric fields and energy dissipation within a single j | | -spike. The investigation of potential plasma instability(ies) responsible for the FAC filamentation and self-consistent electric field generation requires further study.

4. Conclusions

FACs are important elements in transporting energy from the acceleration source (e.g., magnetic reconnection) to remote plasma regions. According to our knowledge, FACs with dimensions down to the electron gyroradius have not been detected before. We revealed that the electron-scale FACs were formed near a magnetic separatrix generated by the near-Earth reconnection in the PS field lines. MMS observations discovered that near the separatrix, the intense FACs are generated by the unmagnetized electrons with suprathermal energies (≥3 keV). In the j | | -spikes, a fraction of the current-carrying electron component was ∼(20–80)% of the entire electron population. Ion–electron decoupling at the electron-scale j | | -spikes caused the violation of the frozen-in condition and generation of strong parallel nonideal electric fields within the electron-scale layer(s), especially near the magnetic separatrix. The nonideal electric fields were mainly related to the anomalous resistivity, which may be caused by electrostatic fluctuations. The generation of nonideal electric fields, in turn, triggered the intense energy exchange between fields and suprathermal electrons, leading to significant electron heating and a decrease in T i / T e near the magnetic separatrix. The reported FAC event is such an important discovery that it could lead to a new direction in probing the dynamics of the PS, allowing new ideas on what energy exchange can take place outside the magnetic X-line. It raises the issue that near the magnetic separatrix, i.e., in the PSBL or in the outer PS, where FACs usually reside, the intense energy exchange between fields and particles can occur far from the reconnection region and significantly affect the local plasma population. To investigate the stability of intense electron-scale FACs and estimate their lifetime, additional observations and theoretical studies are needed.

Author Contributions

Conceptualization, E.E.G. and L.M.Z.; methodology, E.E.G.; software, M.V.L.; validation, E.E.G. and L.M.Z.; formal analysis, M.V.L.; investigation, M.V.L.; resources, M.V.L.; data curation, M.V.L.; writing—original draft preparation, M.V.L.; writing—review and editing, E.E.G.; visualization, M.V.L.; supervision, E.E.G. and L.M.Z.; project administration, E.E.G. All authors have read and agreed to the published version of the manuscript.

Funding

This research received no external funding.

Institutional Review Board Statement

Not applicable.

Informed Consent Statement

Not applicable.

Data Availability Statement

MMS data were obtained from the MMS Data Center https://lasp.colorado.edu/mms/sdc/public/, accessed on 10 April 2023.

Conflicts of Interest

The authors declare no conflict of interest.

Abbreviations

The following abbreviations are used in this manuscript:
FACField-aligned current
PSPlasma sheet
PSBLPlasma sheet boundaty layer
CSCurrent sheet
BBFBursty bulk flow
DFDipolization front

References

  1. Angelopoulos, V.; Baumjohann, W.; Kennel, C.F.; Coroniti, F.V.; Kivelson, M.G.; Pellat, R.; Walker, R.J.; Lühr, H.; Paschmann, G. Bursty bulk flows in the inner central plasma sheet. J. Geophys. Res. Space Phys. 1992, 97, 4027–4039. [Google Scholar] [CrossRef]
  2. Sergeev, V.; Runov, A.; Baumjohann, W.; Nakamura, R.; Zhang, T.L.; Volwerk, M.; Balogh, A.; Rème, H.; Sauvaud, J.A.; André, M.; et al. Current sheet flapping motion and structure observed by Cluster. Geophys. Res. Lett. 2003, 30. [Google Scholar] [CrossRef]
  3. Runov, A.; Nakamura, R.; Baumjohann, W.; Treumann, R.A.; Zhang, T.L.; Volwerk, M.; Vörös, Z.; Balogh, A.; Glaßmeier, K.H.; Klecker, B.; et al. Current sheet structure near magnetic X-line observed by Cluster. Geophys. Res. Lett. 2003, 30. [Google Scholar] [CrossRef]
  4. Runov, A.; Angelopoulos, V.; Sitnov, M.I.; Sergeev, V.A.; Bonnell, J.; McFadden, J.P.; Larson, D.; Glassmeier, K.H.; Auster, U. THEMIS observations of an earthward-propagating dipolarization front. Geophys. Res. Lett. 2009, 36. [Google Scholar] [CrossRef]
  5. Sharma, A.S.; Nakamura, R.; Runov, A.; Grigorenko, E.E.; Hasegawa, H.; Hoshino, M.; Louarn, P.; Owen, C.J.; Petrukovich, A.; Sauvaud, J.A.; et al. Transient and localized processes in the magnetotail: A review. Ann. Geophys. 2008, 26, 955–1006. [Google Scholar] [CrossRef]
  6. Grigorenko, E.E.; Sauvaud, J.A.; Palin, L.; Jacquey, C.; Zelenyi, L.M. THEMIS observations of the current sheet dynamics in response to the intrusion of the high-velocity plasma flow into the near-Earth magnetotail. J. Geophys. Res. Space Phys. 2014, 119, 6553–6568. [Google Scholar] [CrossRef]
  7. Fu, H.; Grigorenko, E.E.; Gabrielse, C.; Liu, C.; Lu, S.; Hwang, K.; Zhou, X.; Wang, Z.; Chen, F. Magnetotail dipolarization fronts and particle acceleration: A review. Sci. China Earth Sci. 2020, 63, 235–256. [Google Scholar] [CrossRef]
  8. Burch, J.; Moore, T.; Torbert, R.; Giles, B. Magnetospheric multiscale overview and science objectives. Space Sci. Rev. 2016, 199, 5–21. [Google Scholar] [CrossRef]
  9. Phan, T.D.; Eastwood, J.P.; Cassak, P.A.; Øieroset, M.; Gosling, J.T.; Gershman, D.J.; Mozer, F.S.; Shay, M.A.; Fujimoto, M.; Daughton, W.; et al. MMS observations of electron-scale filamentary currents in the reconnection exhaust and near the X line. Geophys. Res. Lett. 2016, 43, 6060–6069. [Google Scholar] [CrossRef]
  10. Leonenko, M.V.; Grigorenko, E.E.; Zelenyi, L.M.; Malova, H.V.; Malykhin, A.Y.; Popov, V.Y.; Büchner, J. MMS Observations of Super Thin Electron-Scale Current Sheets in the Earth’s Magnetotail. J. Geophys. Res. Space Phys. 2021, 126, e2021JA029641. [Google Scholar] [CrossRef]
  11. Fujimoto, M.; Nagai, T.; Yokokawa, N.; Yamade, Y.; Mukai, T.; Saito, Y.; Kokubun, S. Tailward electrons at the lobe-plasma sheet interface detected upon dipolarizations. J. Geophys. Res. Space Phys. 2001, 106, 21255–21262. [Google Scholar] [CrossRef]
  12. Nakamura, R.; Baumjohann, W.; Nagai, T.; Fujimoto, M.; Mukai, T.; Klecker, B.; Treumann, R.; Balogh, A.; Rème, H.; Sauvaud, J.A.; et al. Flow shear near the boundary of the plasma sheet observed by Cluster and Geotail. J. Geophys. Res. Space Phys. 2004, 109. [Google Scholar] [CrossRef]
  13. Eastman, T.E.; Frank, L.A.; Peterson, W.K.; Lennartsson, W. The plasma sheet boundary layer. J. Geophys. Res. Space Phys. 1984, 89, 1553–1572. [Google Scholar] [CrossRef]
  14. Frank, L.A. Hot plasmas in the earth’s magnetosphere. In Physics of Solar Planetary Environments, Proceedings of the International Symposium on Solar-Terrestrial Physics, Boulder, CO, USA, 7–18 June 1976; American Geophysical Union: Washington, DC, USA; Volume 2, pp. 685–700.
  15. Grigorenko, E.; Zelenyi, L.; Dolgonosov, M.; Artemiev, A.; Owen, C.; Sauvaud, J.A.; Hoshino, M.; Hirai, M. Non-adiabatic ion acceleration in the Earth magnetotail and its various manifestations in the plasma sheet boundary layer. Space Sci. Rev. 2011, 164, 133–181. [Google Scholar] [CrossRef]
  16. Nakamura, R.; Sergeev, V.A.; Baumjohann, W.; Plaschke, F.; Magnes, W.; Fischer, D.; Varsani, A.; Schmid, D.; Nakamura, T.K.M.; Russell, C.T.; et al. Transient, small-scale field-aligned currents in the plasma sheet boundary layer during storm time substorms. Geophys. Res. Lett. 2016, 43, 4841–4849. [Google Scholar] [CrossRef] [PubMed]
  17. Robert, P.; Dunlop, M.W.; Roux, A.; Chanteur, G. Chap. 16. Accuracy of Current Density Determination. In Analysis Methods for Multi-Spacecraft Data; Pashmann, G., Ed.; ISSI Scientific Report SR-001; University of California: Berkeley, CA, USA, 1998. [Google Scholar]
  18. Mauk, B.; Blake, J.; Baker, D.; Clemmons, J.; Reeves, G.; Spence, H.E.; Jaskulek, S.; Schlemm, C.; Brown, L.; Cooper, S.; et al. The energetic particle detector (EPD) investigation and the energetic ion spectrometer (EIS) for the magnetospheric multiscale (MMS) mission. Space Sci. Rev. 2016, 199, 471–514. [Google Scholar] [CrossRef]
  19. Harvey, C.C. Chap. 12. Spatial Gradients and the Volumetric Tensor. In Analysis Methods for Multi-Spacecraft Data; Pashmann, G., Ed.; ISSI Scientific Report SR-001; University of California: Berkeley, CA, USA, 1998. [Google Scholar]
  20. Pollock, C.; Moore, T.; Jacques, A.; Burch, J.; Gliese, U.; Saito, Y.; Omoto, T.; Avanov, L.; Barrie, A.; Coffey, V.; et al. Fast plasma investigation for magnetospheric multiscale. Space Sci. Rev. 2016, 199, 331–406. [Google Scholar] [CrossRef]
  21. Büchner, J.; Zelenyi, L.M. Regular and chaotic charged particle motion in magnetotaillike field reversals: 1. Basic theory of trapped motion. J. Geophys. Res. Space Phys. 1989, 94, 11821–11842. [Google Scholar] [CrossRef]
  22. Bittencourt, J.A. Macroscopic Transport Equations. In Fundamentals of Plasma Physics; Springer: New York, NY, USA, 2004; pp. 193–218. [Google Scholar] [CrossRef]
  23. Torbert, R.B.; Burch, J.L.; Giles, B.L.; Gershman, D.; Pollock, C.J.; Dorelli, J.; Avanov, L.; Argall, M.R.; Shuster, J.; Strangeway, R.J.; et al. Estimates of terms in Ohm’s law during an encounter with an electron diffusion region. Geophys. Res. Lett. 2016, 43, 5918–5925. [Google Scholar] [CrossRef]
  24. Grigorenko, E.E.; Runov, A.; Angelopoulos, V.; Zelenyi, L.M. Particle Beams in the Vicinity of Magnetic Separatrix According to Near-Lunar ARTEMIS Observations. J. Geophys. Res. Space Phys. 2019, 124, 1883–1903. [Google Scholar] [CrossRef]
  25. Zelenyi, L.M.; Malova, H.V.; Grigorenko, E.E.; Popov, V.Y.; Dubinin, E.M. Universal Scaling of Thin Current Sheets. Geophys. Res. Lett. 2020, 47, e2020GL088422. [Google Scholar] [CrossRef]
  26. Matsumoto, H.; Kojima, H.; Miyatake, T.; Omura, Y.; Okada, M.; Nagano, I.; Tsutsui, M. Electrostatic solitary waves (ESW) in the magnetotail: BEN wave forms observed by GEOTAIL. Geophys. Res. Lett. 1994, 21, 2915–2918. [Google Scholar] [CrossRef]
  27. Lakhina, G.S.; Singh, S.V.; Kakad, A.P.; Pickett, J.S. Generation of electrostatic solitary waves in the plasma sheet boundary layer. J. Geophys. Res. Space Phys. 2011, 116. [Google Scholar] [CrossRef]
  28. Li, S.; Zhang, S.; Cai, H.; Yu, S. Concentration of electrostatic solitary waves around magnetic nulls within magnetic reconnection diffusion region: Single-event-based statistics. Earth Planets Space 2014, 66, 1–13. [Google Scholar] [CrossRef]
  29. Yu, X.; Wang, R.; Lu, Q.; Russell, C.T.; Wang, S. Nonideal Electric Field Observed in the Separatrix Region of a Magnetotail Reconnection Event. Geophys. Res. Lett. 2019, 46, 10744–10753. [Google Scholar] [CrossRef]
  30. Chen, Z.Z.; Fu, H.S.; Liu, C.M.; Wang, T.Y.; Ergun, R.E.; Cozzani, G.; Huang, S.Y.; Khotyaintsev, Y.V.; Le Contel, O.; Giles, B.L.; et al. Electron-Driven Dissipation in a Tailward Flow Burst. Geophys. Res. Lett. 2019, 46, 5698–5706. [Google Scholar] [CrossRef]
  31. Huang, S.Y.; Fu, H.S.; Yuan, Z.G.; Zhou, M.; Fu, S.; Deng, X.H.; Sun, W.J.; Pang, Y.; Wang, D.D.; Li, H.M.; et al. Electromagnetic energy conversion at dipolarization fronts: Multispacecraft results. J. Geophys. Res. Space Phys. 2015, 120, 4496–4502. [Google Scholar] [CrossRef]
  32. Liu, C.M.; Fu, H.S.; Vaivads, A.; Khotyaintsev, Y.V.; Gershman, D.J.; Hwang, K.J.; Chen, Z.Z.; Cao, D.; Xu, Y.; Yang, J.; et al. Electron Jet Detected by MMS at Dipolarization Front. Geophys. Res. Lett. 2018, 45, 556–564. [Google Scholar] [CrossRef]
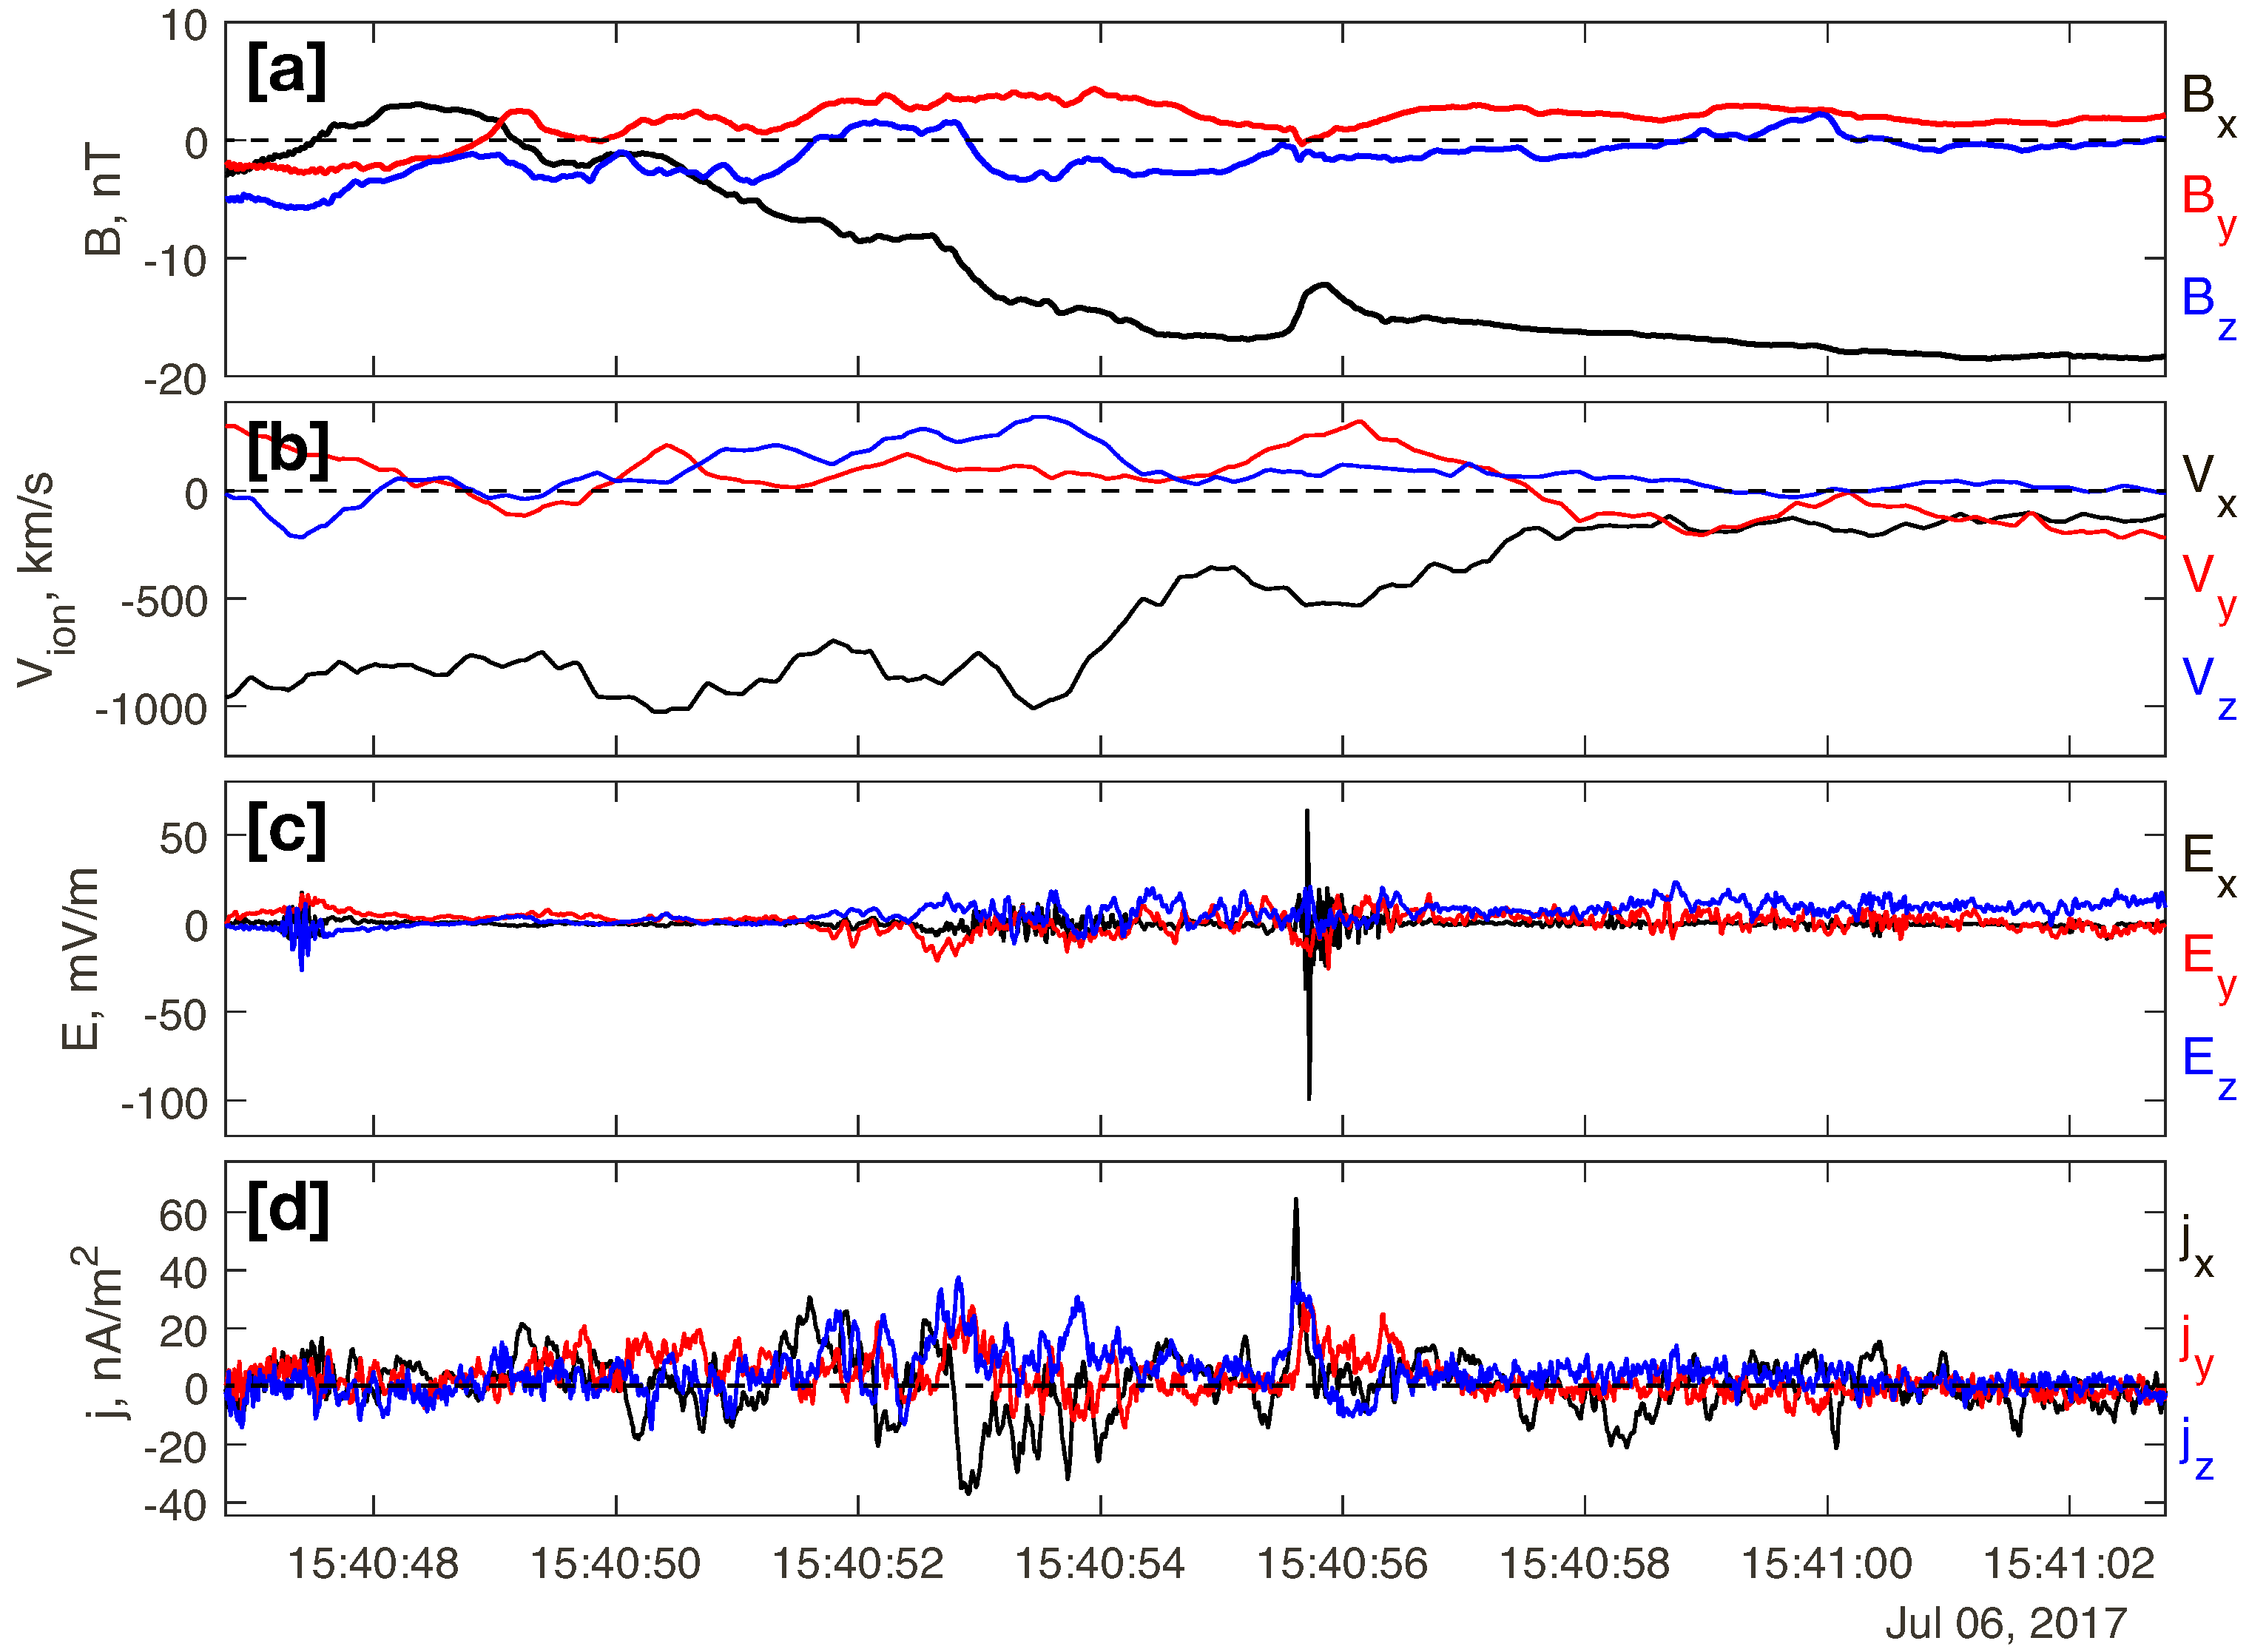
Figure 1. An overview of the MMS observations of FACs on July 6, 2017. From top to bottom: (a) three GSE-components of the magnetic field, (b) the ion bulk velocity, (c) the electric field and (d) the electric current density. The observations are shown in the MMS barycenter.
Atmosphere 14 00722 g001
Figure 2. From top to bottom: (a) Three components of the magnetic field; (b) the parallel and perpendicular components of electric current density calculated using the curlometer technique; (c) the parallel component of the electric current density calculated at the MMS barycenter using electron moments from the FPI experiment onboard four MMS probes ( j | | , e ) and the parallel current density calculated by using the curlometer technique ( j | | ); (d) the parallel and perpendicular components of the nonideal electric field, E’; (e) the parallel and perpendicular components of energy dissipation. Three intervals of FACs are shaded by blue, pink and grey colors and are marked as “I”,”II” and “III”, respectively. Panels (fh) present a comparison of j | | and j | | , e calculated by using electron moments deduced from 3D electron velocity distribution function in the selected energy range. The energy range used for the current density calculation in each FAC interval is presented in the legend of each panel. Panels (ik) show 2D cuts of electron velocity distribution functions in the ( V | | , V , 1 ) plane.
Atmosphere 14 00722 g002
Figure 3. From top to bottom: (a) The time profiles of electron ( T e ) and ion ( T i ) temperatures. The corresponding values of T e and T i are shown in the left and right vertical axis, respectively. (b) Electron anisotropy Λ . (c) Parallel and perpendicular electric current density. (d) div(E′) and |curl(E′)|.
Atmosphere 14 00722 g003
Figure 4. From top to bottom: the parallel and perpendicular components of the observed (a) E and (b) nonideal E′ electric fields; (c) Hall’s term, (d) inertia term and (e) pressure gradients term of the generalized Ohm’s law; (f) the difference between the nonideal electric field, E′ and the sum of three Ohm’s law terms.
Atmosphere 14 00722 g004
Figure 5. A cartoon of the large-scale magnetic configuration containing the observed FACs. The arrows show the direction of field-aligned electron beams producing the FACs, while the color of the arrows displays the FAC direction according to the legend in the right part of the figure. The magnetic field lines are shown by the solid black lines.
Atmosphere 14 00722 g005
Table 1. Parameters of the observed j | | -spikes.
Time UTTimingTiming
V, km/s
j | | -Spike
Number
j | | ,
nA/m2
L,
km
ρ e ,
km
L / ρ e κ e n j / n e ,
%
I15:40:51.232
15:40:52:545
[0.48,
−0.86,
0.18]
140(1)−3021230.90.364
(2)−266170.40.559
(3)2913180.70.347
II15:40:52.756
15:40:53:982
[0.38,
−0.82,
0.42]
130(4)4413160.80.379
(5)307140.50.272
(6)244130.30.164
(7)275130.40.269
(8)249120.80.267
III15:40:55.381
15:40:56:045
[−0.10,
0.59,
−0.80]
390(9)−6720141.40.322
Disclaimer/Publisher’s Note: The statements, opinions and data contained in all publications are solely those of the individual author(s) and contributor(s) and not of MDPI and/or the editor(s). MDPI and/or the editor(s) disclaim responsibility for any injury to people or property resulting from any ideas, methods, instructions or products referred to in the content.