
Numerical Study on the Impact of Large Air Purifiers, Physical Distancing, and Mask Wearing in Classrooms


Abstract
:1. Introduction
2. Materials and Methods
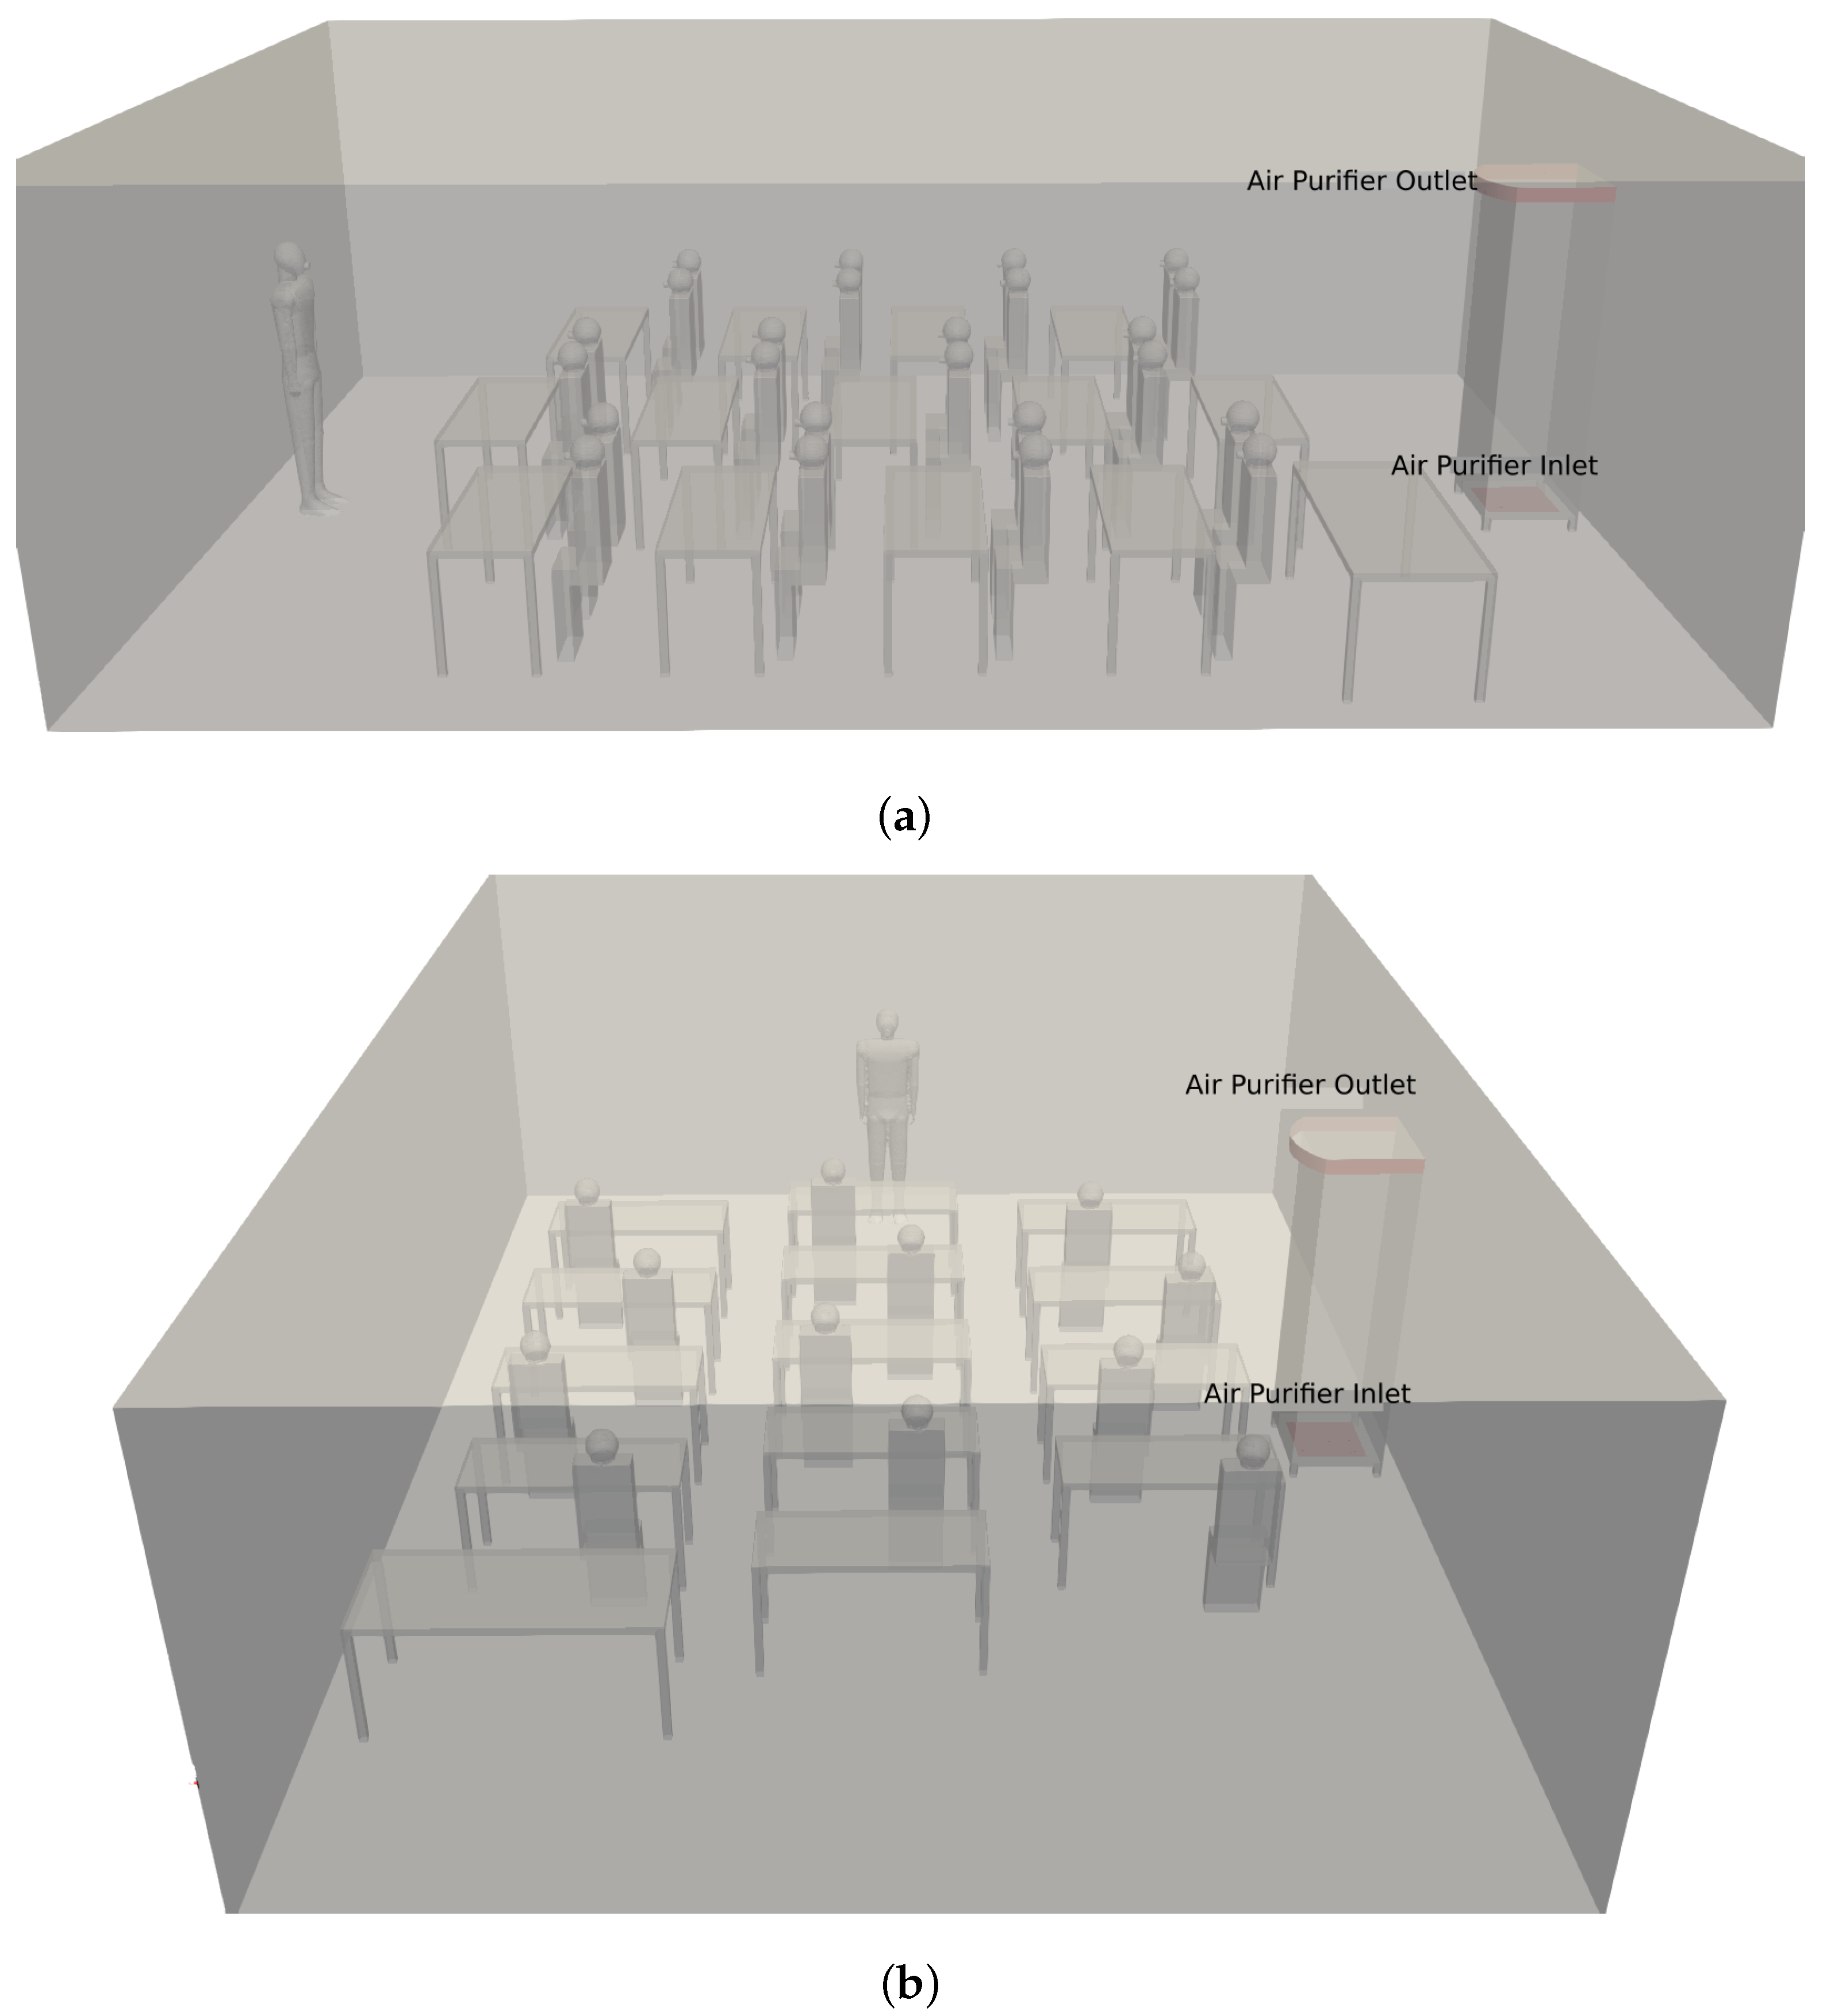
2.1. Simulation Model
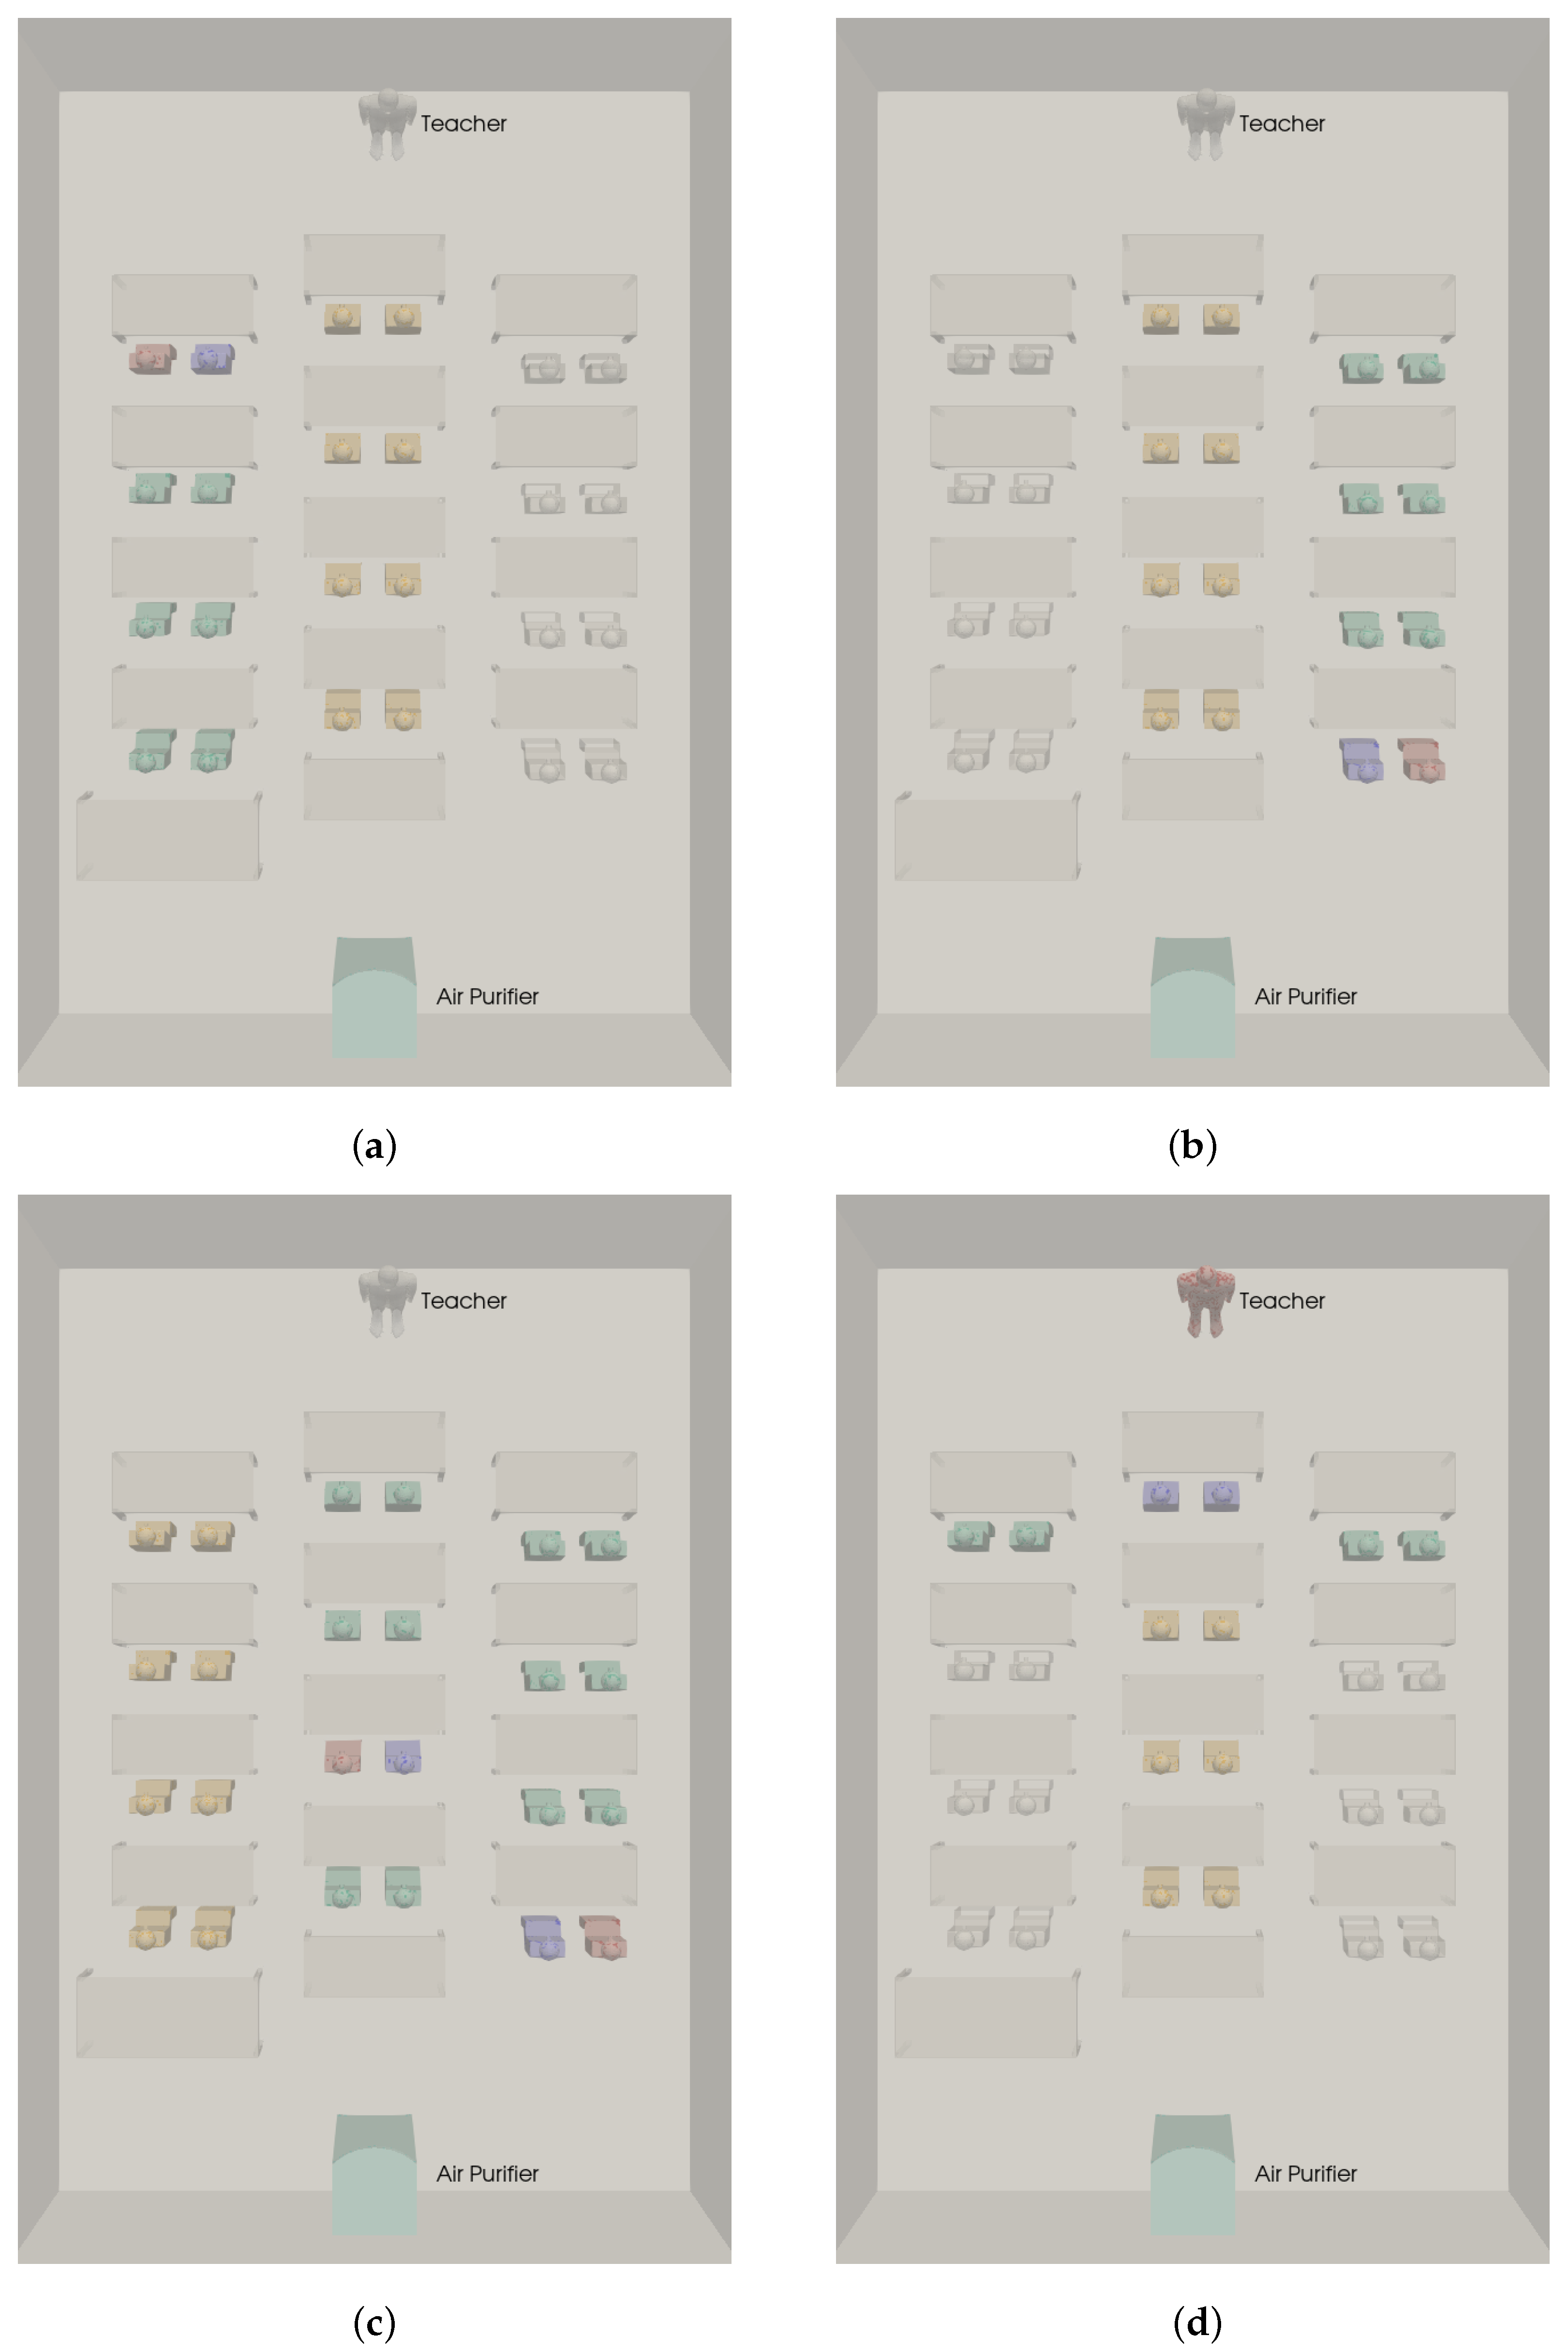
2.2. Cases Simulated
3. Results
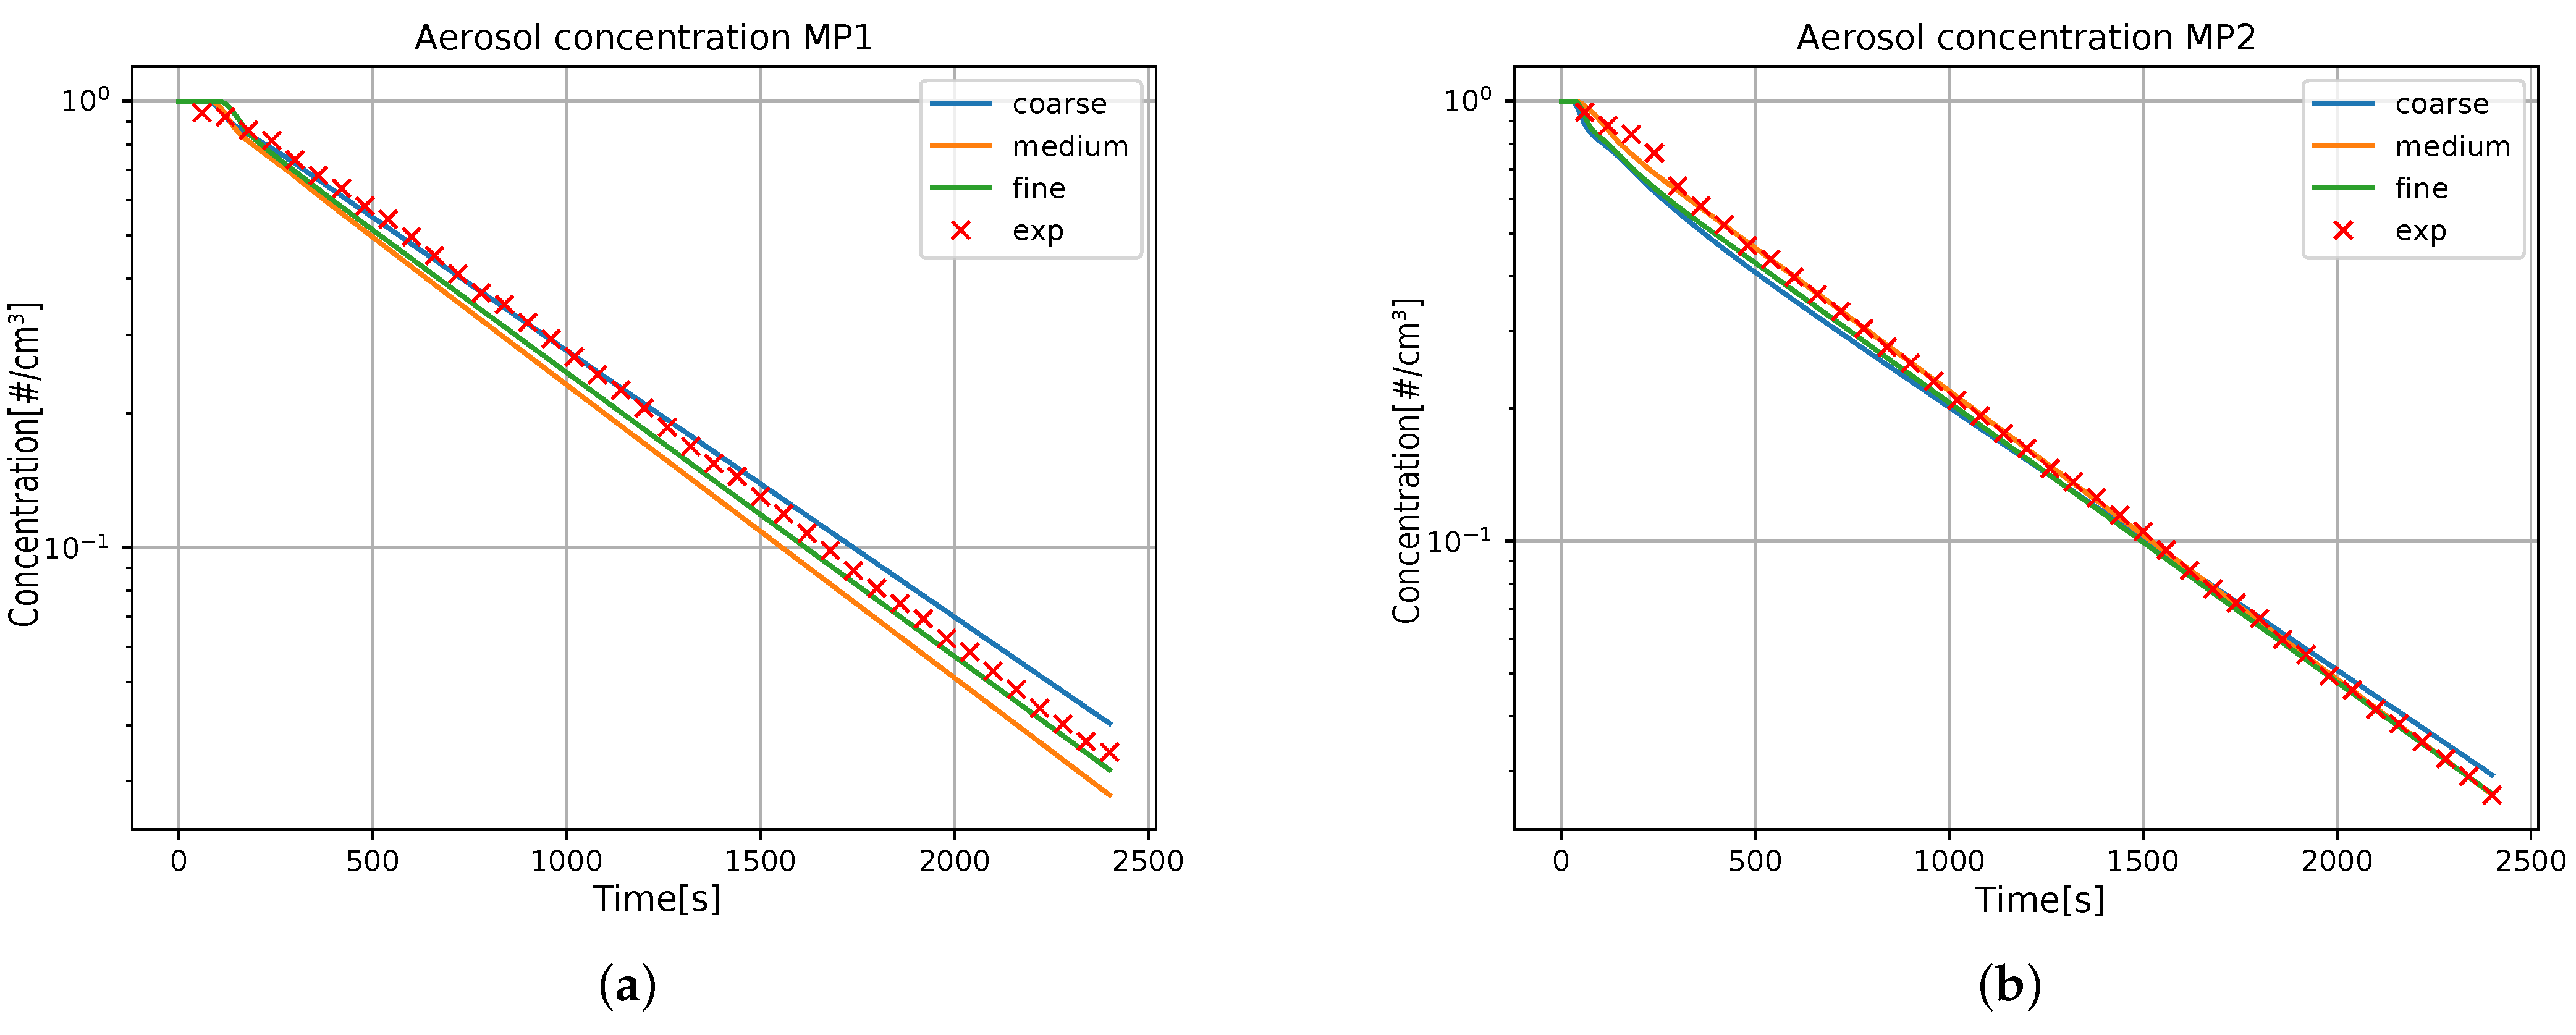
3.1. Validation
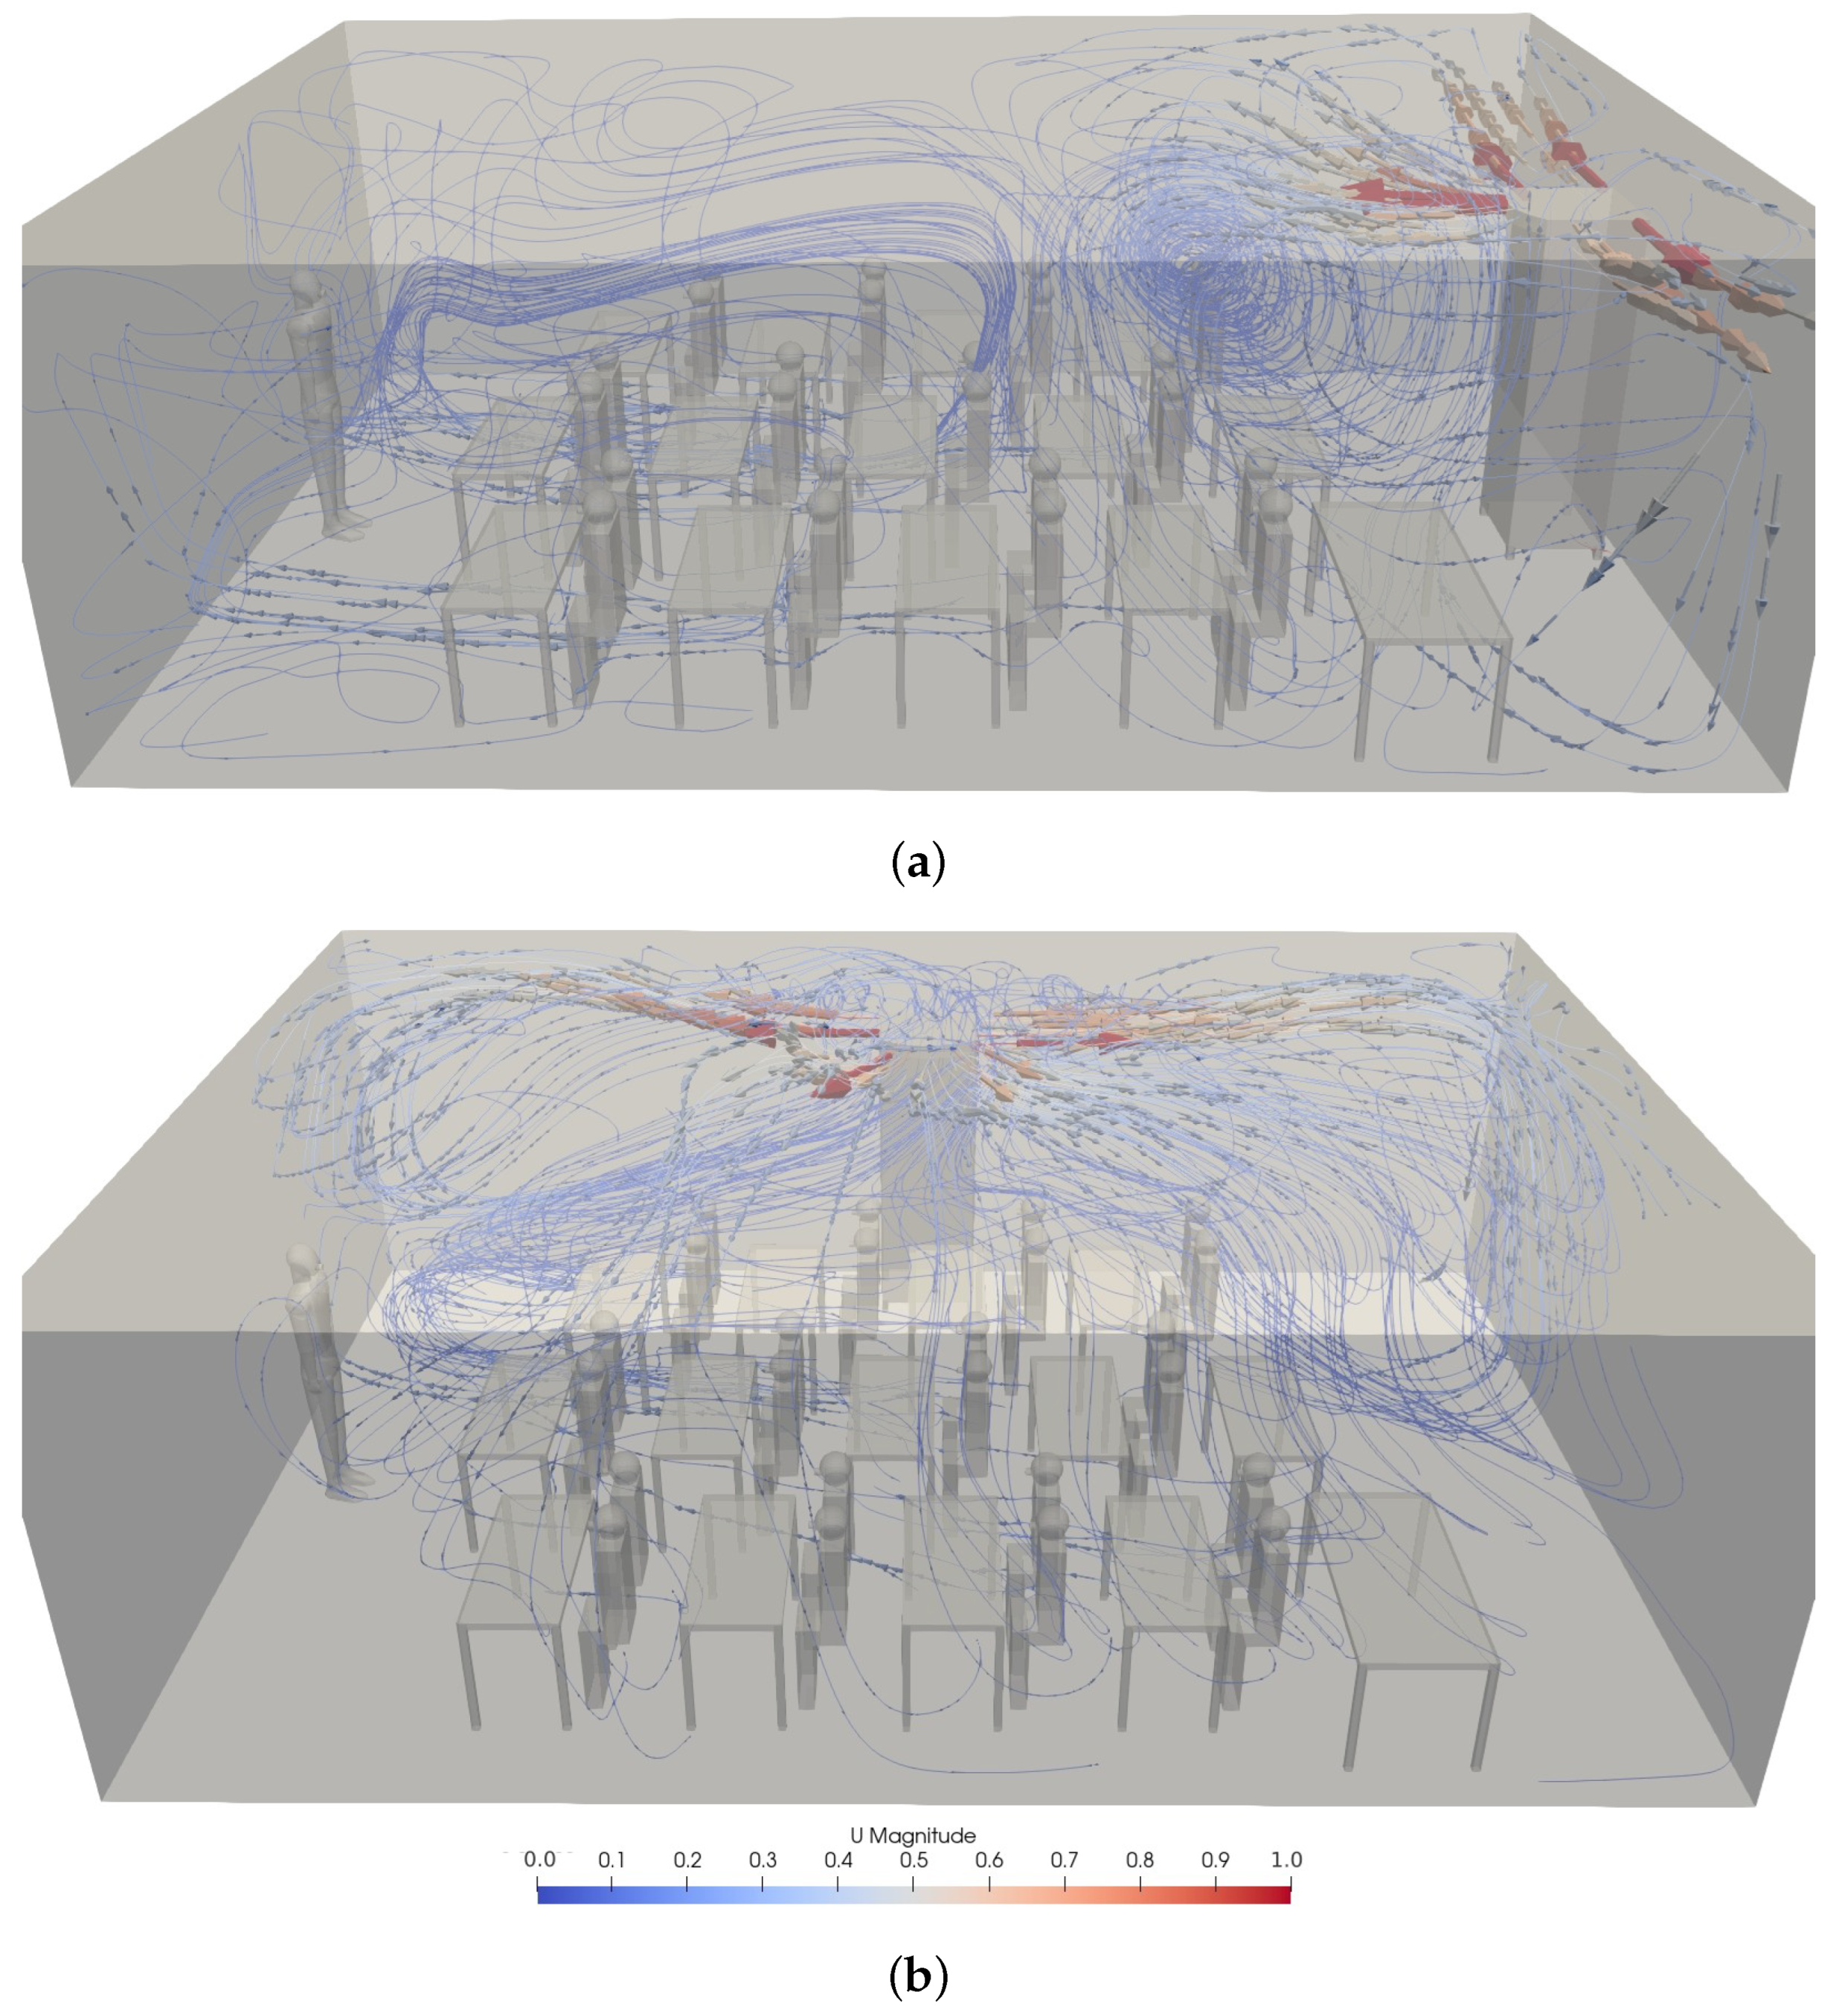
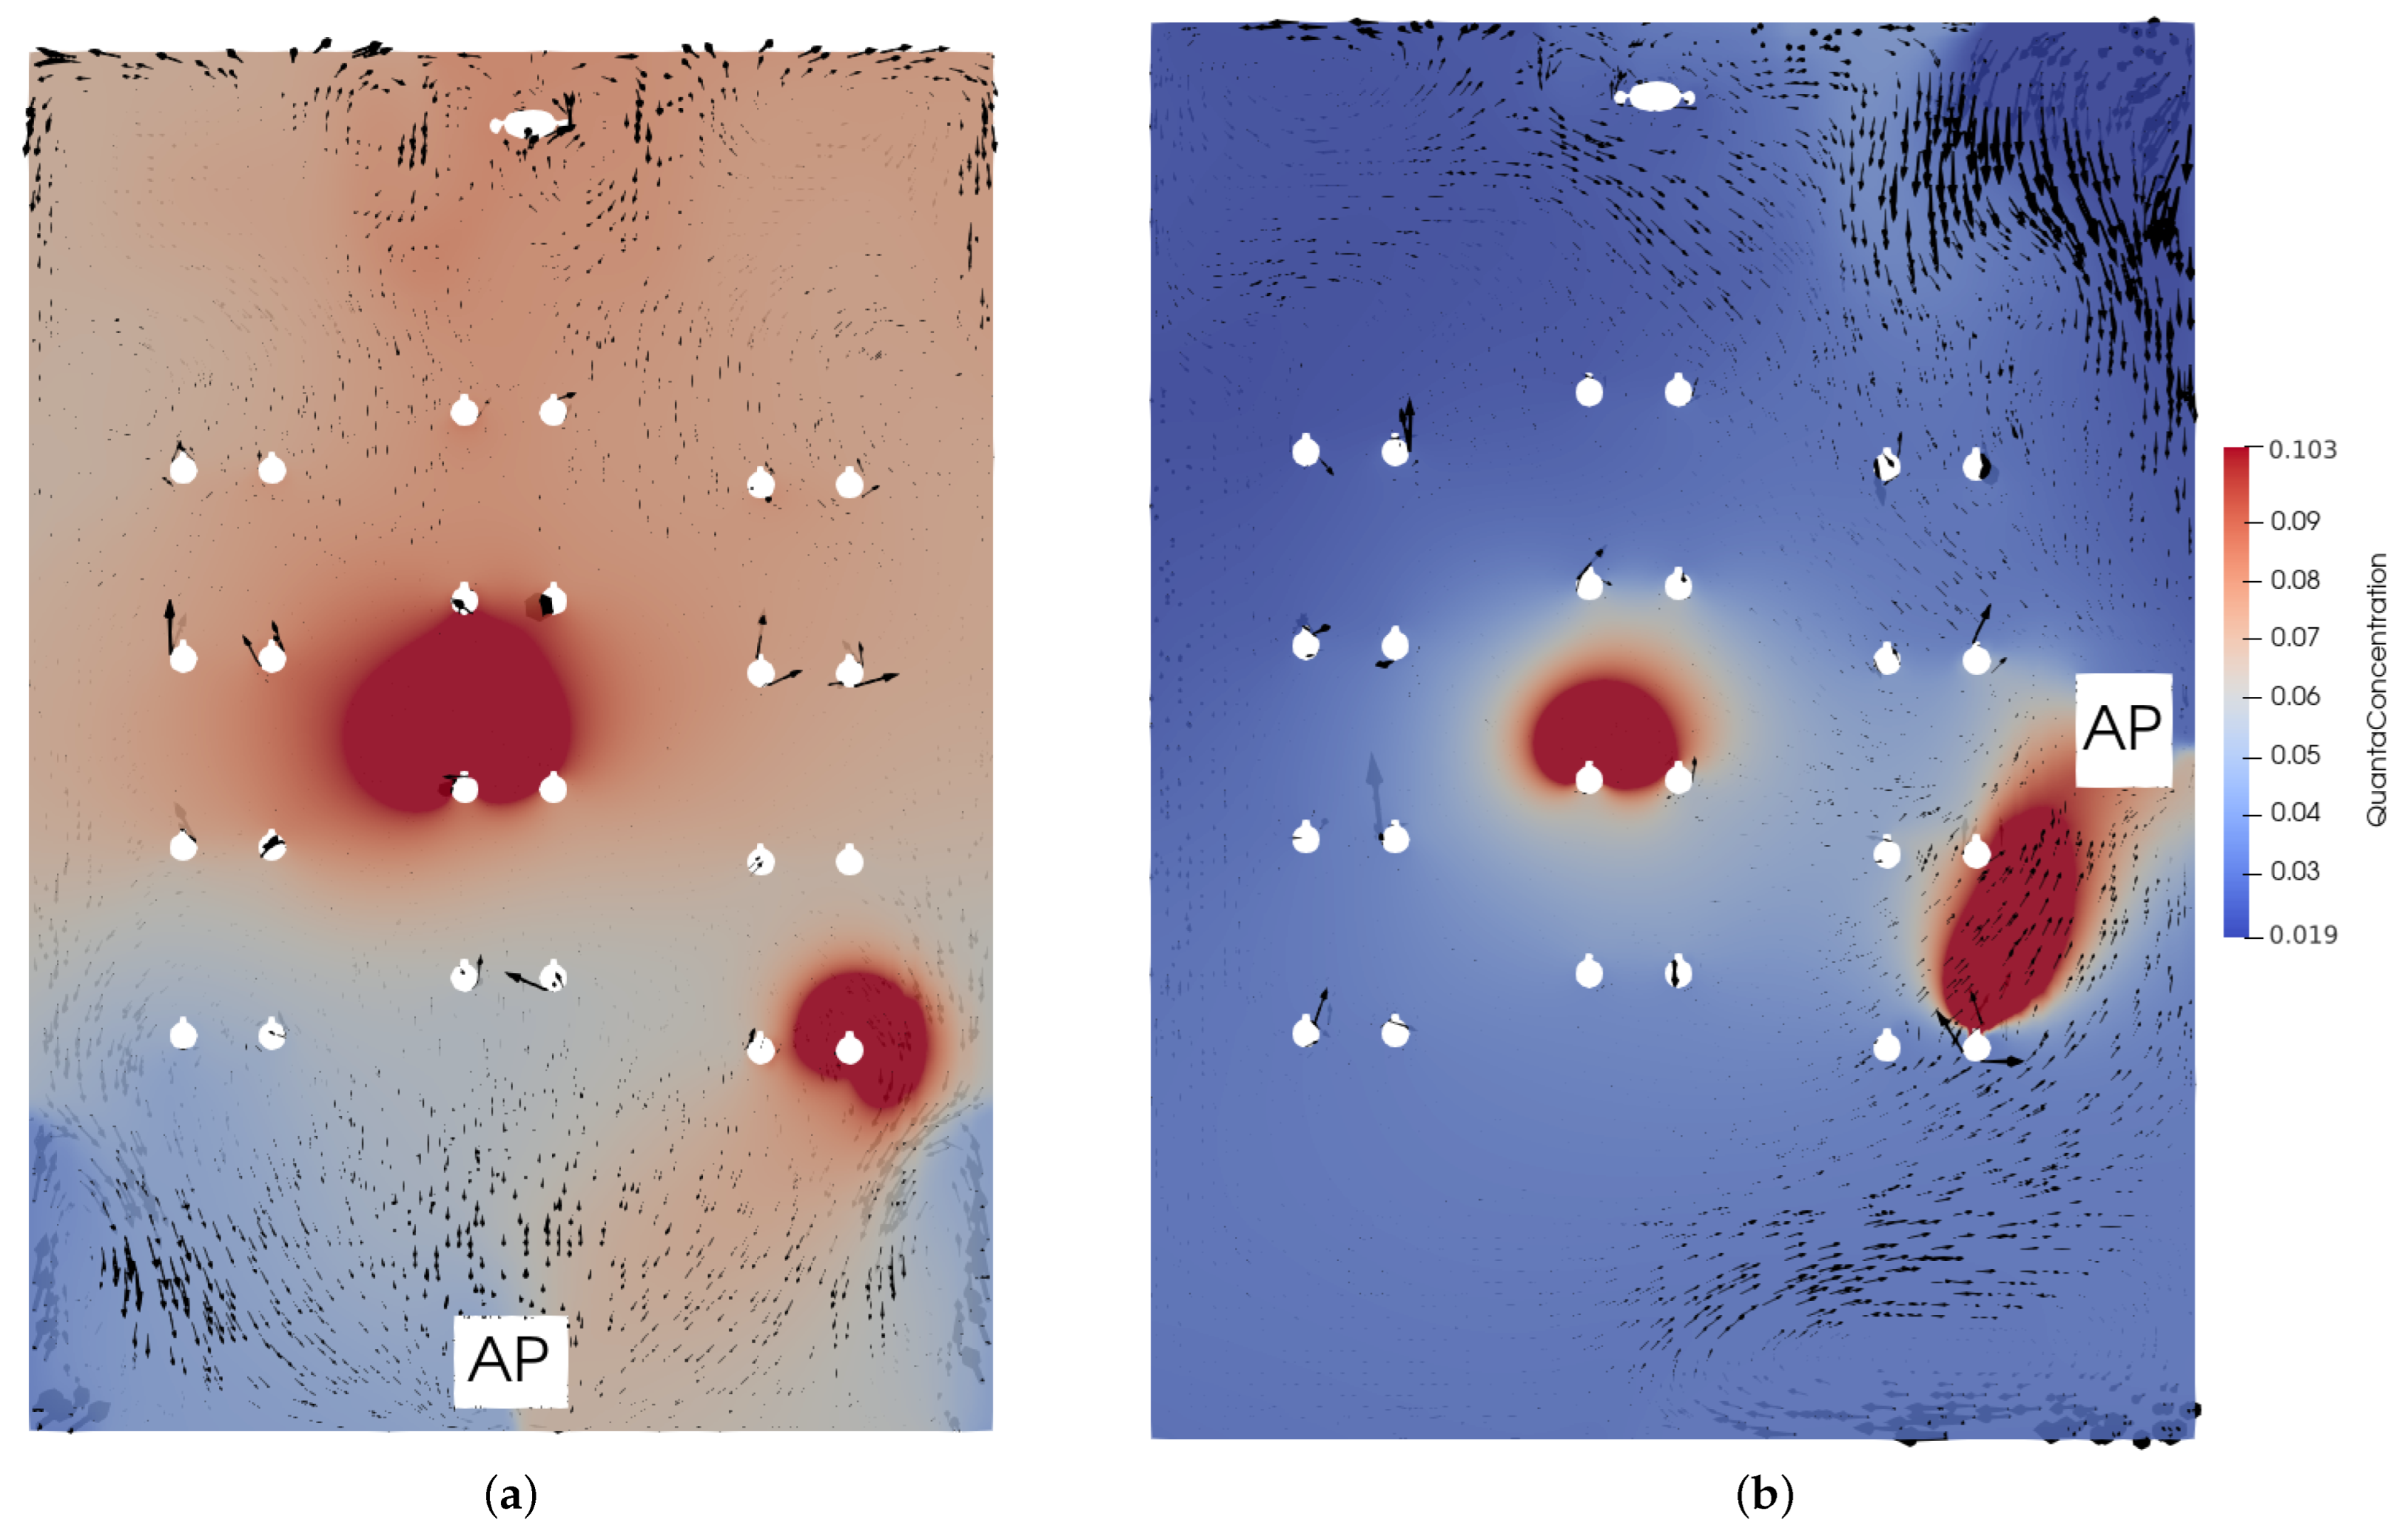
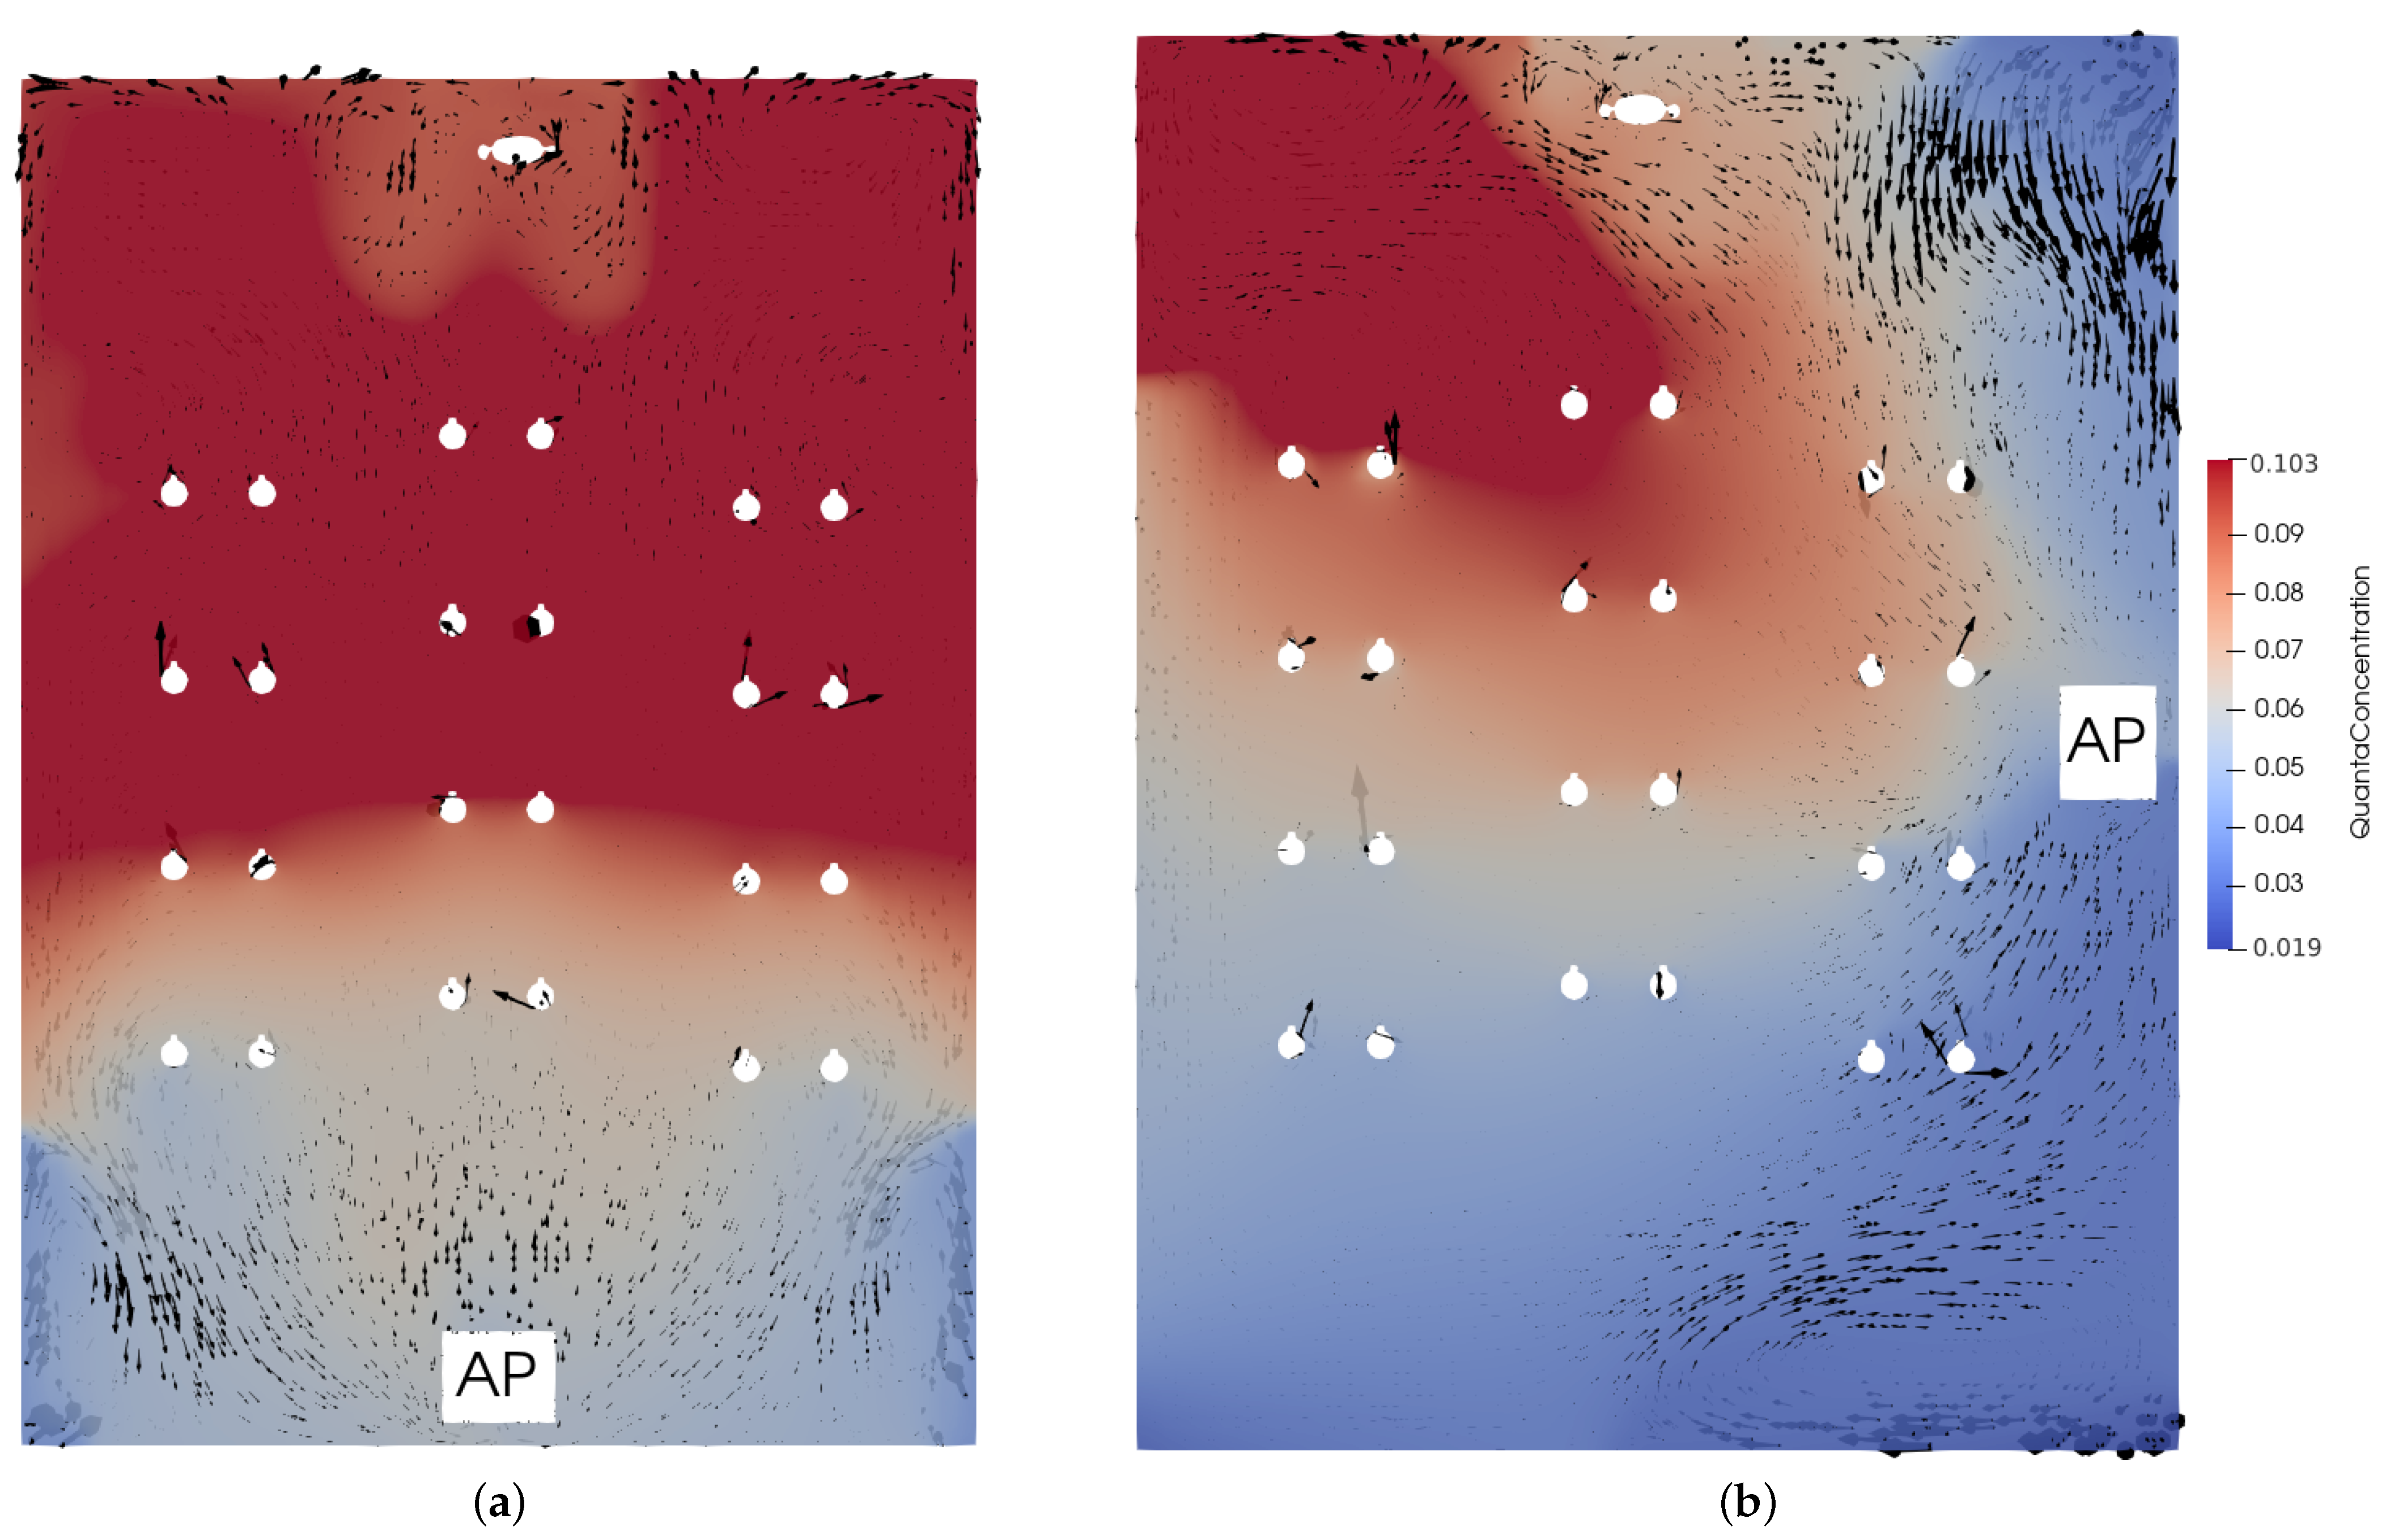
3.2. Airflow Pattern
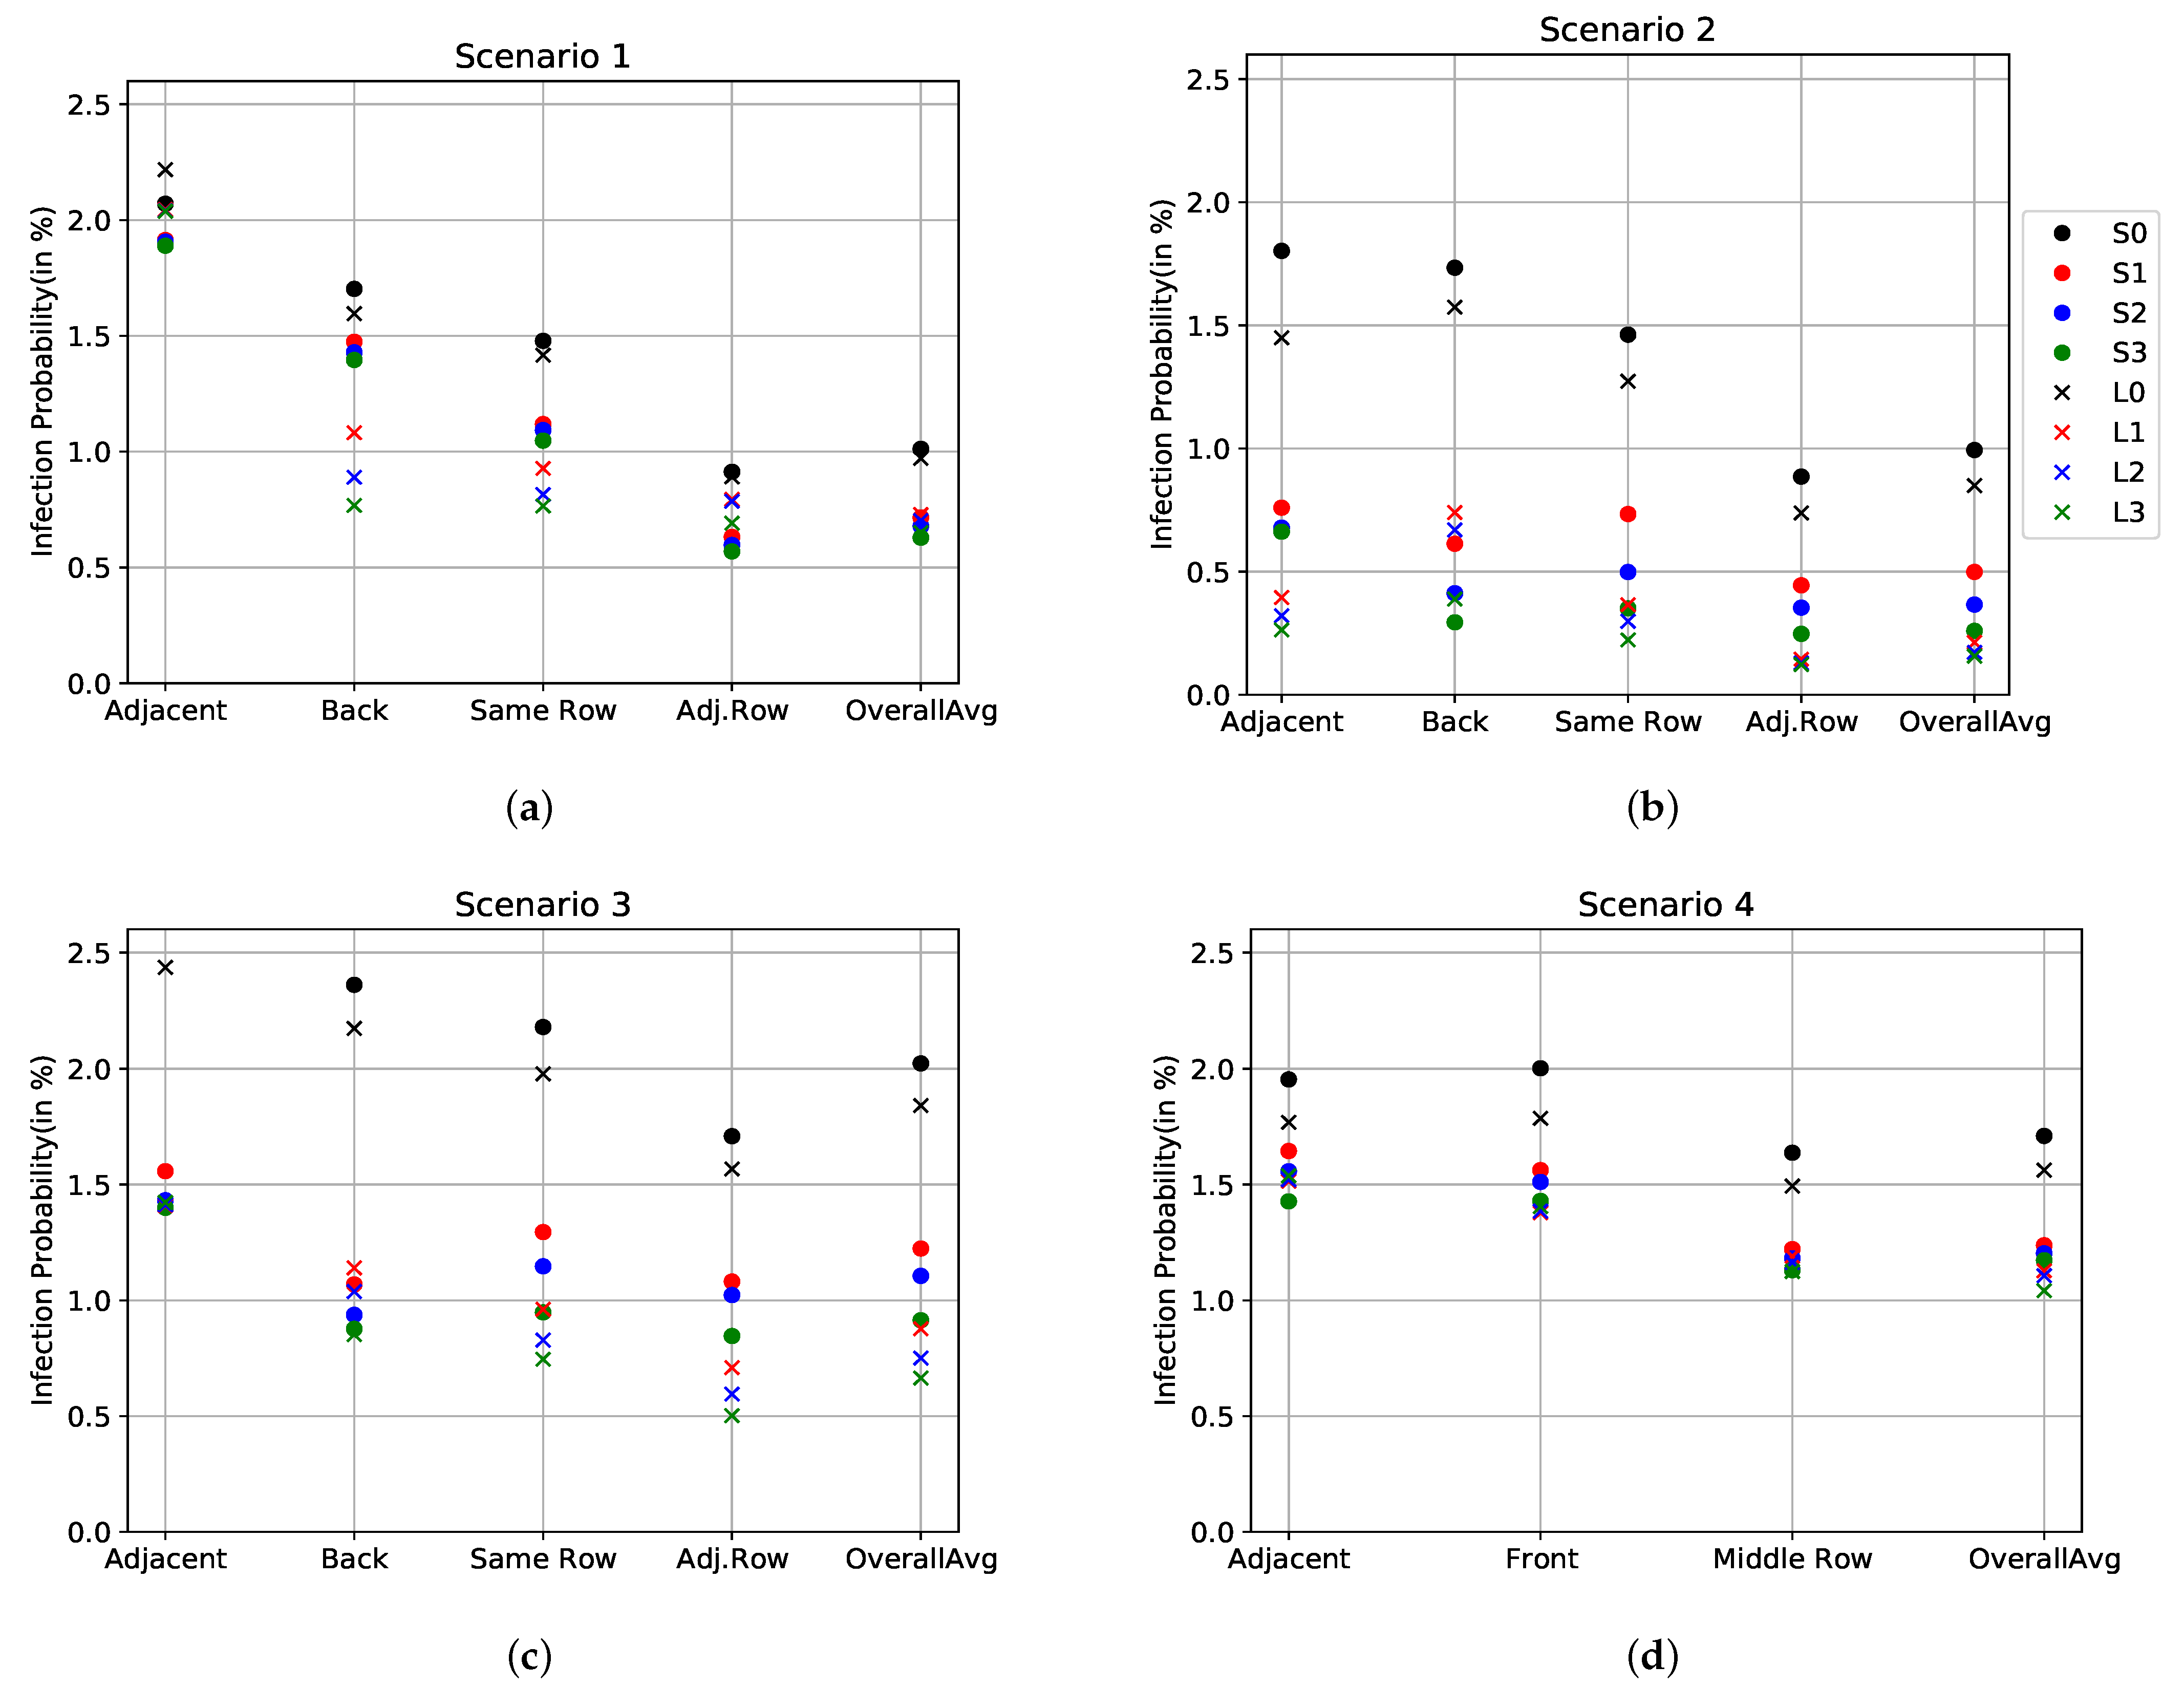
3.3. Effect of Using an Air Purifier
3.4. Effect of Location of an Air Purifier
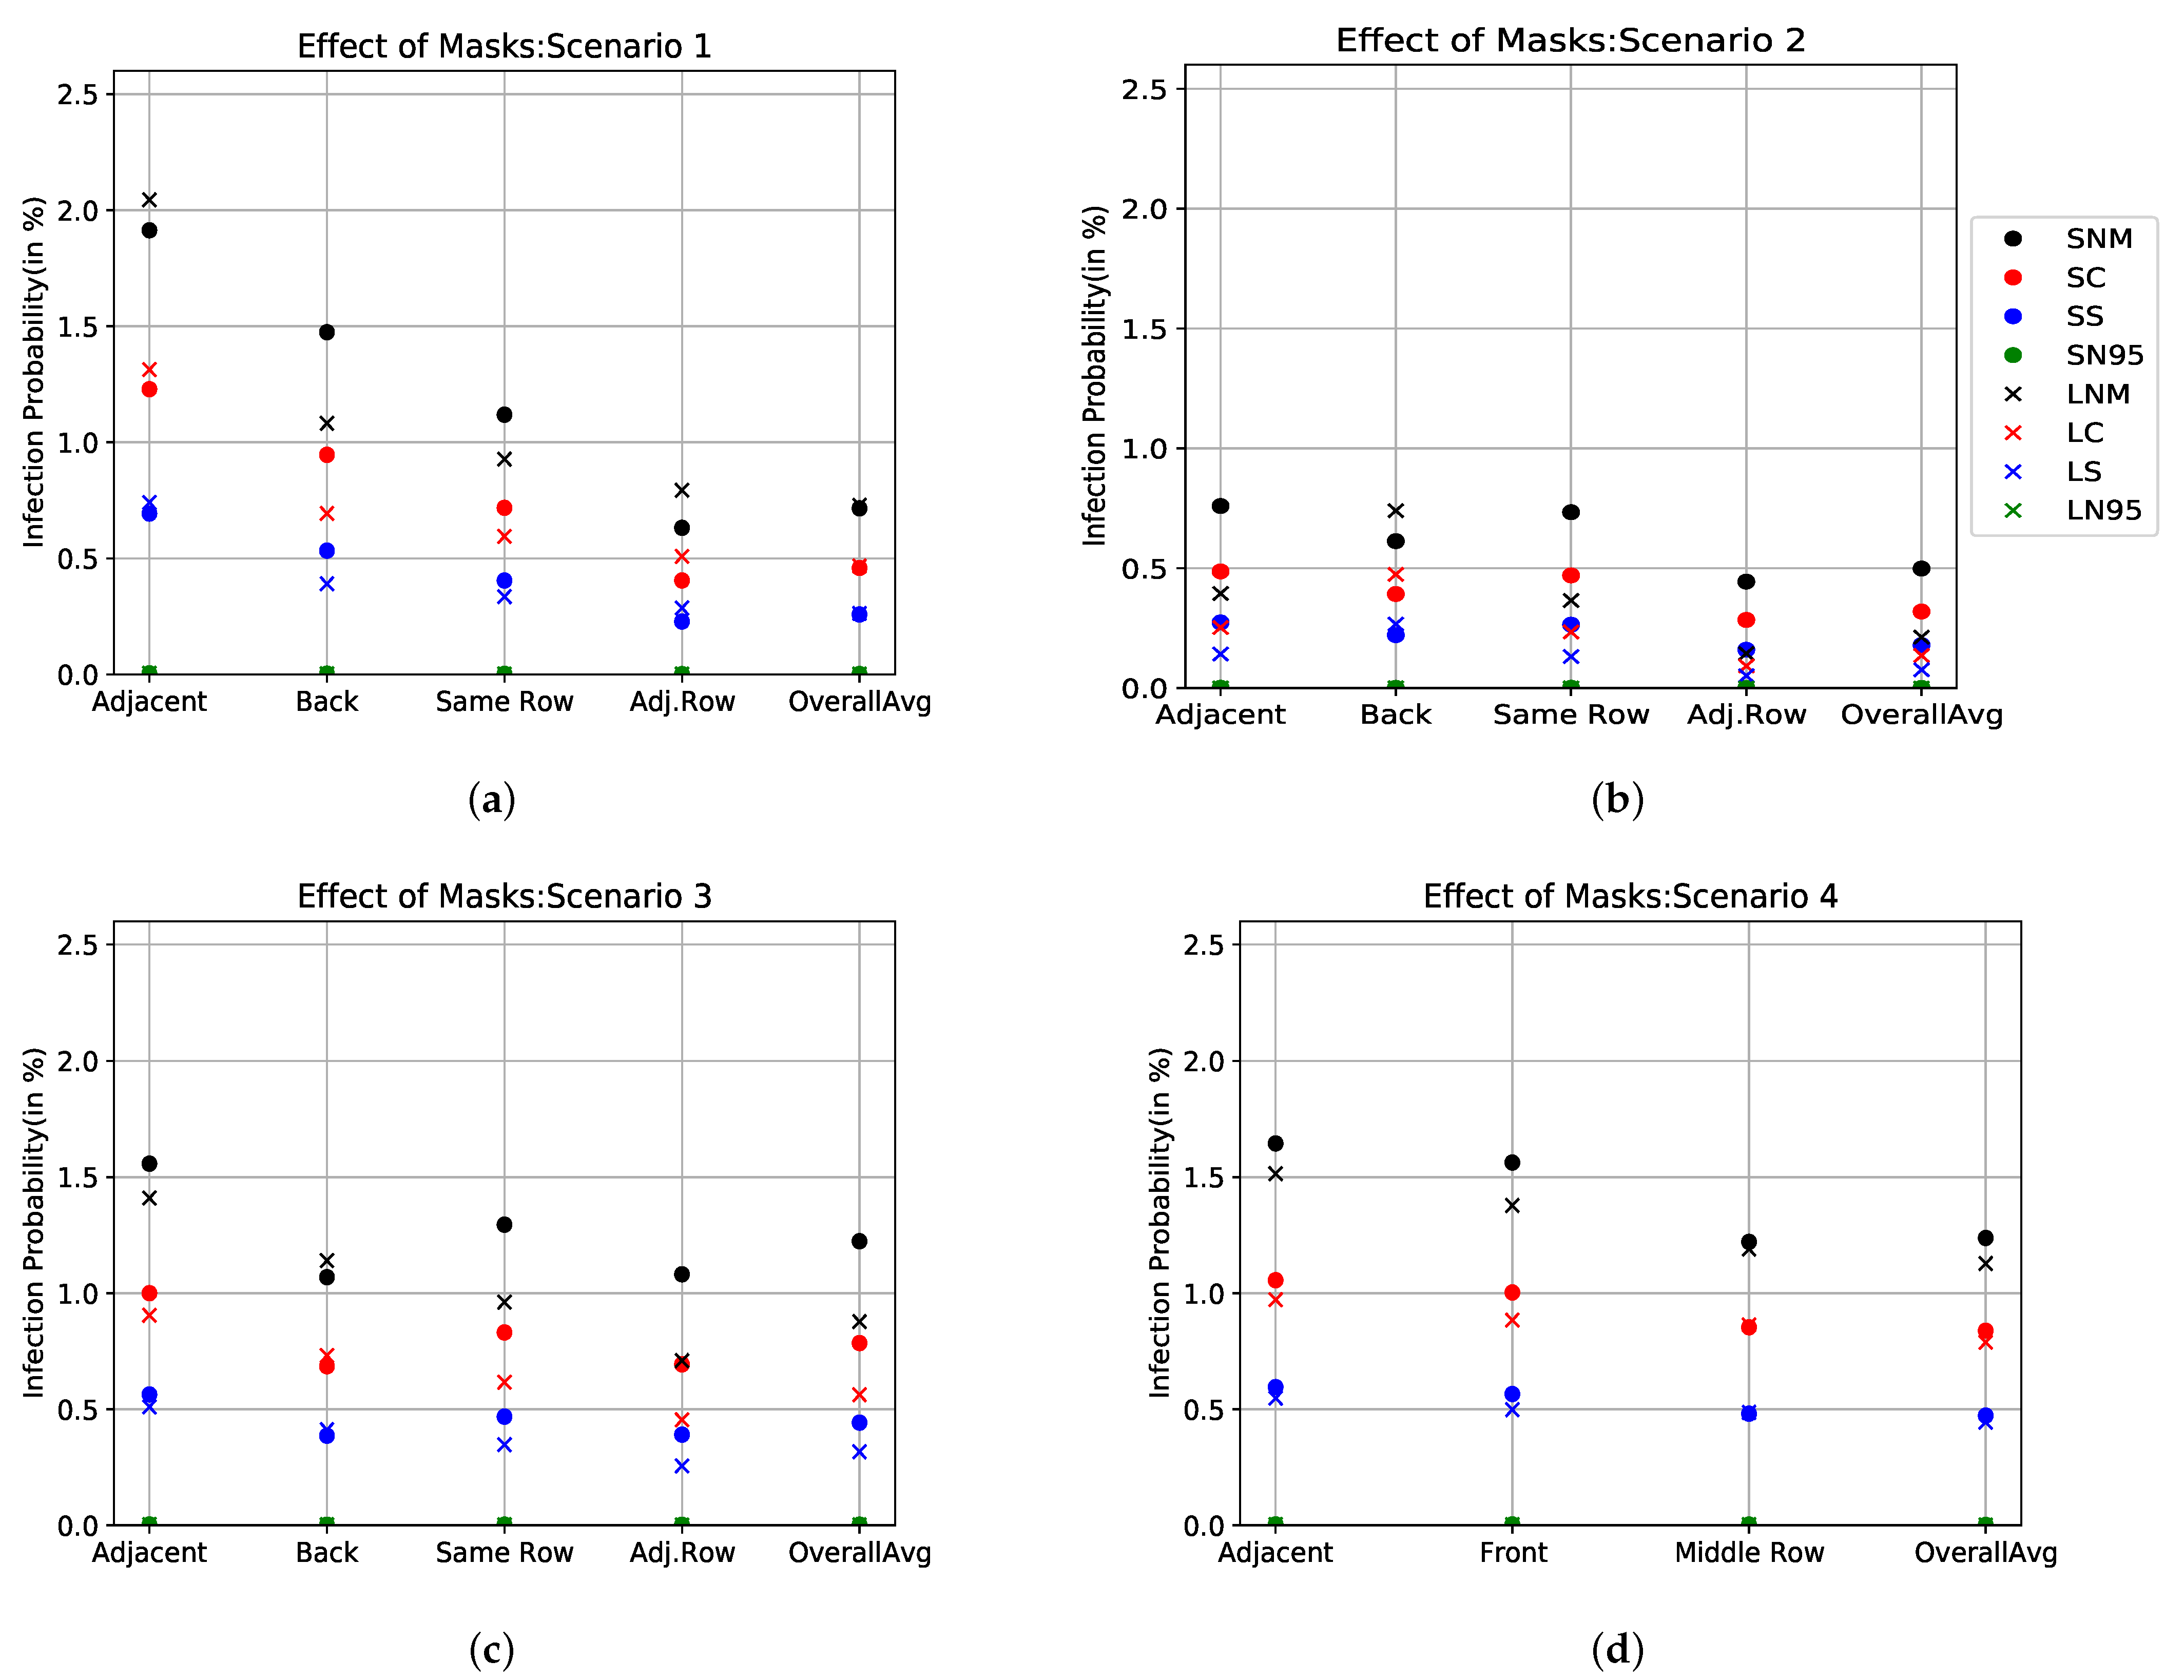
3.5. Effect of Wearing a Face Mask
3.6. Effect of Physical Distancing
4. Conclusions
Author Contributions
Funding
Institutional Review Board Statement
Informed Consent Statement
Data Availability Statement
Acknowledgments
Conflicts of Interest
Abbreviations
| CFD | Computational Fluid Dynamics |
| AP | Air Purifier |
| IP | Infection Probability |
| HVAC | Heating, Ventilation, and Air Conditioning) |
| WRM | Wells–Riley Model |
| HEPA | High-Efficiency Particle Arresting |
| DEHS | di-ethyl hexyl sebacate |
References
- Ferrari, S.; Blázquez, T.; Cardelli, R.; Puglisi, G.; Suárez, R.; Mazzarella, L. Ventilation Strategies to Reduce Airborne Transmission of Viruses in Classrooms: A Systematic Review of Scientific Literature. Build. Environ. 2022, 222, 109366. [Google Scholar] [CrossRef] [PubMed]
- Stabile, L.; Buonanno, G.; Frattolillo, A.; Dell’Isola, M. The Effect of the Ventilation Retrofit in a School on CO2, Airborne Particles, and Energy Consumptions. Build. Environ. 2019, 156, 1–11. [Google Scholar] [CrossRef]
- Dix, T. An Engineering Approach to Ventilation System Design. Indoor Built Environ. 2000, 9, 75–86. [Google Scholar] [CrossRef]
- Rawat, N.; Kumar, P. Interventions for Improving Indoor and Outdoor Air Quality in and around Schools. Sci. Total Environ. 2022, 858, 159813. [Google Scholar] [CrossRef] [PubMed]
- Zheng, W.; Hu, J.; Wang, Z.; Li, J.; Fu, Z.; Li, H.; Jurasz, J.; Chou, S.K.; Yan, J. COVID-19 Impact on Operation and Energy Consumption of Heating, Ventilation and Air-Conditioning (HVAC) Systems. Adv. Appl. Energy 2021, 3, 100040. [Google Scholar] [CrossRef]
- Shao, S.; Zhou, D.; He, R.; Li, J.; Zou, S.; Mallery, K.; Kumar, S.; Yang, S.; Hong, J. Risk Assessment of Airborne Transmission of COVID-19 by Asymptomatic Individuals under Different Practical Settings. J. Aerosol Sci. 2021, 151, 105661. [Google Scholar] [CrossRef]
- Ovando Chacon, G.; Rodríguez-León, A.; Ovando-Chacon, S.; Hernández-Ordoñez, M.; Díaz-González, M.; Pozos-Texon, F. Computational Study of Thermal Comfort and Reduction of CO2 Levels inside a Classroom. Int. J. Environ. Res. Public Health 2022, 19, 2956. [Google Scholar] [CrossRef] [PubMed]
- Duval, D.; Palmer, J.; Tudge, I.; Pearce-Smith, N.; O’Connell, E.; Bennett, A.; Clark, R. Long Distance Airborne Transmission of SARS-CoV-2: Rapid Systematic Review. BMJ 2022, 377, e068743. [Google Scholar] [CrossRef]
- Shinohara, N.; Tatsu, K.; Kagi, N.; Kim, H.; Sakaguchi, J.; Ogura, I.; Murashima, Y.; Sakurai, H.; Naito, W. Air Exchange Rates and Advection–Diffusion of CO2 and Aerosols in a Route Bus for Evaluation of Infection Risk. Indoor Air 2022, 32, e13019. [Google Scholar] [CrossRef]
- Zhang, Z.; Han, T.; Yoo, K.H.; Capecelatro, J.; Boehman, A.L.; Maki, K. Disease Transmission through Expiratory Aerosols on an Urban Bus. Phys. Fluids 2021, 33, 015116. [Google Scholar] [CrossRef]
- Wang, Z.; Galea, E.R.; Grandison, A.; Ewer, J.; Jia, F. A Coupled Computational Fluid Dynamics and Wells-Riley Model to Predict COVID-19 Infection Probability for Passengers on Long-Distance Trains. Saf. Sci. 2022, 147, 105572. [Google Scholar] [CrossRef] [PubMed]
- Armand, P.; Tâche, J. 3D Modelling and Simulation of the Dispersion of Droplets and Drops Carrying the SARS-CoV-2 Virus in a Railway Transport Coach. Sci. Rep. 2022, 12, 4025. [Google Scholar] [CrossRef] [PubMed]
- Wang, Z.; Galea, E.R.; Grandison, A.; Ewer, J.; Jia, F. Inflight Transmission of COVID-19 Based on Experimental Aerosol Dispersion Data. J. Travel Med. 2021, 28, taab023. [Google Scholar] [CrossRef]
- Srivastava, S.; Zhao, X.; Manay, A.; Chen, Q. Effective Ventilation and Air Disinfection System for Reducing Coronavirus Disease 2019 (COVID-19) Infection Risk in Office Buildings. Sustain. Cities Soc. 2021, 75, 103408. [Google Scholar] [CrossRef] [PubMed]
- Weiqi, G.; Fu, Y.; Jia, R.; Guo, Z.; Su, C.; Li, J.; Zhao, X.; Jin, Y.; Li, P.; Fan, J.; et al. Visualization of the Infection Risk Assessment of SARS-CoV-2 through Aerosol and Surface Transmission in a Negative-Pressure Ward. Environ. Int. 2022, 162, 107153. [Google Scholar] [CrossRef]
- Moeller, L.; Wallburg, F.; Kaule, F.; Schoenfelder, S. Numerical Flow Simulation on the Virus Spread of SARS-CoV-2 Due to Airborne Transmission in a Classroom. Int. J. Environ. Res. Public Health 2022, 19, 6279. [Google Scholar] [CrossRef]
- Duill, F.F.; Schulz, F.; Jain, A.; Krieger, L.; van Wachem, B.; Beyrau, F. The Impact of Large Mobile Air Purifiers on Aerosol Concentration in Classrooms and the Reduction of Airborne Transmission of SARS-CoV-2. Int. J. Environ. Res. Public Health 2021, 18, 11523. [Google Scholar] [CrossRef]
- Ren, C.; Cao, S.J.; Haghighat, F. A Practical Approach for Preventing Dispersion of Infection Disease in Naturally Ventilated Room. J. Build. Eng. 2022, 48, 103921. [Google Scholar] [CrossRef]
- Abuhegazy, M.; Talaat, K.; Anderoglu, O.; Poroseva, S.V. Numerical Investigation of Aerosol Transport in a Classroom with Relevance to COVID-19. Phys. Fluids 2020, 32, 103311. [Google Scholar] [CrossRef]
- Kumar, P.; Rawat, N.; Tiwari, A. Micro-Characteristics of a Naturally Ventilated Classroom Air Quality under Varying Air Purifier Placements. Environ. Res. 2022, 217, 114849. [Google Scholar] [CrossRef]
- Curtius, J.; Granzin, M.; Schrod, J. Testing Mobile Air Purifiers in a School Classroom: Reducing the Airborne Transmission Risk for SARS-CoV-2. Aerosol Sci. Technol. 2021, 55, 586–599. [Google Scholar] [CrossRef]
- Parhizkar, H.; Dietz, L.; Olsen-Martinez, A.; Horve, P.F.; Barnatan, L.; Northcutt, D.; Van Den Wymelenberg, K.G. Quantifying Environmental Mitigation of Aerosol Viral Load in a Controlled Chamber With Participants Diagnosed With Coronavirus Disease 2019. Clin. Infect. Dis. 2022, 75, ciac006. [Google Scholar] [CrossRef] [PubMed]
- Ferziger, J.H.; Perić, M.; Street, R.L. Computational Methods for Fluid Dynamics, 4th ed.; Springer: Cham, Switzerland, 2020. [Google Scholar]
- Burgmann, S.; Janoske, U. Transmission and Reduction of Aerosols in Classrooms Using Air Purifier Systems. Phys. Fluids 2021, 33, 033321. [Google Scholar] [CrossRef] [PubMed]
- Oksanen, L.M.; Virtanen, J.; Sanmark, E.; Rantanen, N.; Venkat, V.; Sofieva, S.; Aaltonen, K.; Kivistö, I.; Svirskaite, J.; Pérez, A.; et al. SARS-CoV-2 Air and Surface Contamination on a COVID-19 Ward and at Home; Research Square: Durham, NC, USA, 2021. [Google Scholar] [CrossRef]
- Riley, E.C.; Murphy, G.; Riley, R.L. Airborne Spread of Measles in a Suburban Elementary School. Am. J. Epidemiol. 1978, 107, 421–432. [Google Scholar] [CrossRef]
- Hu, M.; Lin, H.; Wang, J.; Xu, C.; Tatem, A.J.; Meng, B.; Zhang, X.; Liu, Y.; Wang, P.; Wu, G.; et al. Risk of Coronavirus Disease 2019 Transmission in Train Passengers: An Epidemiological and Modeling Study. Clin. Infect. Dis. 2021, 72, 604–610. [Google Scholar] [CrossRef]
- Buonanno, G.; Stabile, L.; Morawska, L. Estimation of Airborne Viral Emission: Quanta Emission Rate of SARS-CoV-2 for Infection Risk Assessment. Environ. Int. 2020, 141, 105794. [Google Scholar] [CrossRef]
- Dai, H.; Zhao, B. Association of the Infection Probability of COVID-19 with Ventilation Rates in Confined Spaces. Build. Simul. 2020, 13, 1321–1327. [Google Scholar] [CrossRef]
- Deng, Z.; Chen, Q. What Is Suitable Social Distancing for People Wearing Face Masks during the COVID-19 Pandemic? Indoor Air 2022, 32, 12935. [Google Scholar] [CrossRef]
- Tan, S.; Zhang, Z.; Maki, K.; Fidkowski, K.; Capecelatro, J. Beyond Well-mixed: A Simple Probabilistic Model of Airborne Disease Transmission in Indoor Spaces. Indoor Air 2022, 32, 13015. [Google Scholar] [CrossRef]
- Jonker, L.; Linde, K.J.; de Boer, A.R.; Ding, E.; Zhang, D.; de Hoog, M.L.A.; Herfst, S.; Heederik, D.J.J.; Fraaij, P.L.A.; Bluyssen, P.; et al. SARS-CoV-2 Incidence in Secondary Schools: The Role of National and School-Initiated COVID-19 Measures and Indoor Air Quality; SSRN: Rochester, NY, USA, 2022. [Google Scholar] [CrossRef]


| Parameters | Values |
|---|---|
| Scenarios | 1, 2, 3, 4 as shown in Figure 2 |
| Position of AP | Short side at the back of the room |
| Long side of the room | |
| Volumetric flow rate of AP | Level 0: 200 m (0% efficiency) |
| Level 1: 800 m (100% efficiency) | |
| Level 2: 1000 m (100% efficiency) | |
| Level 3: 1200 m (100% efficiency) | |
| Number of students | Half capacity: 12 students |
| Full capacity: 24 students | |
| Masks | No mask (0% efficiency) |
| Cloth mask (20% efficiciency) | |
| Surgical mask (40% efficiency) | |
| N95 mask (95% efficiency) |
Disclaimer/Publisher’s Note: The statements, opinions and data contained in all publications are solely those of the individual author(s) and contributor(s) and not of MDPI and/or the editor(s). MDPI and/or the editor(s) disclaim responsibility for any injury to people or property resulting from any ideas, methods, instructions or products referred to in the content. |
© 2023 by the authors. Licensee MDPI, Basel, Switzerland. This article is an open access article distributed under the terms and conditions of the Creative Commons Attribution (CC BY) license (https://creativecommons.org/licenses/by/4.0/).
Share and Cite
Jain, A.; Duill, F.F.; Schulz, F.; Beyrau, F.; van Wachem, B. Numerical Study on the Impact of Large Air Purifiers, Physical Distancing, and Mask Wearing in Classrooms. Atmosphere 2023, 14, 716. https://doi.org/10.3390/atmos14040716
Jain A, Duill FF, Schulz F, Beyrau F, van Wachem B. Numerical Study on the Impact of Large Air Purifiers, Physical Distancing, and Mask Wearing in Classrooms. Atmosphere. 2023; 14(4):716. https://doi.org/10.3390/atmos14040716
Chicago/Turabian StyleJain, Aman, Finn F. Duill, Florian Schulz, Frank Beyrau, and Berend van Wachem. 2023. "Numerical Study on the Impact of Large Air Purifiers, Physical Distancing, and Mask Wearing in Classrooms" Atmosphere 14, no. 4: 716. https://doi.org/10.3390/atmos14040716
APA StyleJain, A., Duill, F. F., Schulz, F., Beyrau, F., & van Wachem, B. (2023). Numerical Study on the Impact of Large Air Purifiers, Physical Distancing, and Mask Wearing in Classrooms. Atmosphere, 14(4), 716. https://doi.org/10.3390/atmos14040716