Article

Application of Radar Radial Velocity Data Assimilation in the Forecasts of Typhoon Linfa Based on Different Horizontal Length Scale Factors

1
Collaborative Innovation Center on Forecast and Evaluation of Meteorological Disasters, Nanjing University of Information Science & Technology, Nanjing 210044, China
2
Shanghai Typhoon Institute, China Meteorological Administration, Shanghai 200030, China
*
Author to whom correspondence should be addressed.
Atmosphere 2023, 14(3), 582; https://doi.org/10.3390/atmos14030582
Submission received: 20 February 2023 / Revised: 11 March 2023 / Accepted: 15 March 2023 / Published: 17 March 2023
(This article belongs to the Special Issue Data Assimilation for Predicting Hurricane, Typhoon and Storm)

Abstract

:
In order to explore the improvement of radar radial velocity data assimilation on the initial and forecast fields of typhoons, this study assimilates the quality-controlled radial velocity data in the case of Typhoon Linfa (2015) using the three-dimensional variational data assimilation system of the weather research and forecasting model (WRF-3DVAR), and then conducts several sensitivity experiments with different horizontal length scale factors. The results show that reducing the horizontal length scale factor of the background error covariance can effectively assimilate the micro- and meso-scale information from radar data and improve the forecasting effect of Linfa. Following the optimization of the horizontal length scale factor, the radial velocity data assimilation can improve the typhoon wind field structure, produce reasonable cyclonic wind field increments, and further improve the dynamic and thermal structure of the inner core area of the typhoon. Then, we can obtain a better initial field of model forecasting, and thus typhoon track and intensity forecasting are improved.

1. Introduction

A tropical cyclone (TC) is a powerful and deep vortex system generated over tropical and subtropical oceans, with high temperature and low pressure in its center. Typhoons are a type of tropical cyclone. They are generated in the western and northwestern Pacific Ocean and adjacent waters with wind speeds reaching 32.7 m s−1 and above. Typhoons have a great deal of unstable energy, and may cause incalculable damage and secondary disasters. According to the statistics, the annual average number of typhoon generations in the northwest Pacific Ocean is approximately 26, and nearly half of these typhoons will be active in the adjacent waters of China [1]. China is hit by at least seven typhoons per year on average, and is one of the countries with the highest number of landfall typhoons and these cause more severe damage here than anywhere else in the world. Therefore, the accurate monitoring and forecasting of typhoons is of great importance to protect people’s lives and properties, and to reduce socioeconomic losses in China.
At present, the numerical model has become a major tool in typhoon forecasting. There are many numerical models, but the weather research and forecasting (WRF) model serves as representative [2,3,4]. However, the quality of numerical weather prediction is still highly dependent on the accuracy of the model’s initial field. Past studies have shown that typhoon track, intensity and precipitation forecasting errors mainly originate from the initial field errors, and thus providing more accurate initial field data for the model is the best way to improve typhoon forecasting levels [5,6,7]. As typhoons form and mostly remain on the vast ocean surface, it is unreasonable to use land-based observations to reflect the atmospheric conditions at far distances. Meanwhile, the observations from buoys and stations at sea are few and have low spatiotemporal resolutions. As a consequence, remote sensing platforms, such as radars and satellites, are the most effective tools for observing typhoon structures. With the advancement of numerical models and the application of non-conventional observations, the accuracy of forecasting typhoon tracks has remarkably improved [8,9]. However, the forecasting of typhoon intensity is still difficult to determine through operational weather forecasts [10]. It is well known that the main difficulty in the current numerical forecasting model of typhoons is how to spin-up a typhoon vortex system with suitable thermodynamics and microphysical structure at the typhoon’s initial formation [11]. The main reason for this difficulty is the lack of high spatiotemporal resolution observations to describe the structure and intensity of the micro- and meso-scale vortexes inside the typhoon, which is also the reason for the relatively slow improvement in typhoon intensity forecasting [12,13,14].
In recent years, numerous scholars have conducted comprehensive and in-depth studies on the initialization of typhoons by assimilating radar data. Xiao et al. [15] showed that assimilating radar reflectivity can effectively improve the forecast of typhoon precipitation, and the assimilation of radar radial velocity can greatly improve typhoon track and intensity forecasting through the numerical simulation of Typhoon Rusa making landfall on the Korean peninsula. Through the use of a three-dimensional variational data assimilation system (3DVAR) and cloud analysis system provided by the Advanced Regional Prediction System (ARPS), Zhao et al. [16] were able to assimilate for the first time the radial velocity and reflectivity information from multiple radars. They showed that increasing the frequency and number of cyclic assimilation analyses of the radial velocity is beneficial to improve the typhoon forecasting results. Li et al. [17] conducted a numerical simulation of Typhoon Megi in 2010 using the ARPS model and its 3DVAR system, and their results showed that the combination of the radar data assimilation and conventional observation data assimilation can make the typhoon track and intensity forecasting more in line with the observations. Zhu et al. [18] found that the assimilation of radial wind observations at the strongest moment of the typhoon could quickly obtain the true warm kernel of the typhoon structure. Shen et al. [19] showed that the ensemble transform Kalman filter (ETKF) method can be used in the hybrid ensemble-variational (EnVar) assimilation system of WRF to obtain better analysis and forecasting results. Xiao et al. [20] found that the assimilation of radar reflectivity mainly affects water vapor, water condensate and temperature distributions of the model, and that reducing the errors in these variables and adjusting the equilibrium relationships of these variables are beneficial for improving the forecasting of typhoon precipitation intensity and fallout areas. These studies have all illustrated, with different approaches, the significance of radar data assimilation in the study of typhoons from a variety of aspects. Since typhoons are mesoscale weather systems with distinct dynamic characteristics, radar radial velocity data assimilation is more effective than reflectivity data assimilation in improving the forecasting of typhoon structure and intensity.
Despite the encouraging results of the above studies, the radar data assimilation applied in typhoon forecasts is still a challenging issue. It is well known that the background error covariance largely determines the error correlations between different analysis variables, so the setting of its scale factors needs to be considered [21]. In the assimilation of radar data with high spatiotemporal resolutions, the effect of the horizontal length scale factor is more significant than that of the variance scale factor. Shen et al. [8] used the dual Doppler radar data assimilation to analyze hurricanes, and found that the numerical model can provide more accurate and rich information of the micro- and meso-scale systems after the optimal adjustment of the scale factors, so that the initial field of the model is closer to the observation. Similar findings have been confirmed by Xu et al. [22]. In studying the impact of radar data assimilation on the analysis and forecasting of Typhoon Saomai, Shen et al. [23] found that reducing the horizontal length scale factor produces a more reasonable analysis field than using the default value. Overall, few studies have been conducted on the influence of background error covariance scale factors on typhoon intensity and track forecasting in the northwest Pacific. To this end, in this study, we select Typhoon Linfa (2015) as an example, and use WRF-3DVAR to assimilate the radar radial velocity data. Furthermore, we conduct several sensitivity experiments with different horizontal length scale factors.
In the following sections, this paper is organized in a logical manner. A description of the 3DVAR method and the radar radial wind observation operator is provided in Section 2. An overview of the typhoon case is presented in Section 3, as well as the data processing and experimental setup. In Section 4, we discuss the assimilation effects in greater detail. Finally, the main conclusions and discussion are presented in Section 5.

2. Methodologies

In the WRF data assimilation system developed by the National Center for Atmospheric Research (NCAR), three main methods are available: 3DVAR, four-dimensional variational data assimilation (4DVAR), and the hybrid method. This study uses the 3DVAR assimilation method to construct the cost function, and then the estimated value closest to the real atmospheric state is obtained by the minimum value of the cost function through numerical iterations during the analysis. The specific expression of the cost function is defined as follows:
J = ( x x b ) T B 1 ( x x b ) + [ y 0 H ( x ) ] T R 1 [ y 0 H ( x ) ]  
where x and x b denote the state vectors of the analysis and background field, respectively. y 0 is the state vector of the observation field. B and R represent the background error covariance matrix and the observation error covariance matrix, respectively. H is an observation operator that transforms the analysis variables of the model into the observation space to facilitate the comparison between observations and analysis fields.
We use the National Meteorological Center (NMC) method to calculate the covariance matrix of background error B [24]. The momentum control variable scheme used in this study are the zonal and meridional velocity components (U-V) [25,26]. The NMC method is used to obtain the statistics of climate background error by calculating the difference between two forecast fields at the same time with different forecast leading-times (e.g., 12-h and 24-h forecasts), and the difference is usually averaged over one month. To obtain matrix B , the forecast fields of the WRF model in July 2015 are selected for calculation in this study.

3. Case and Experiments

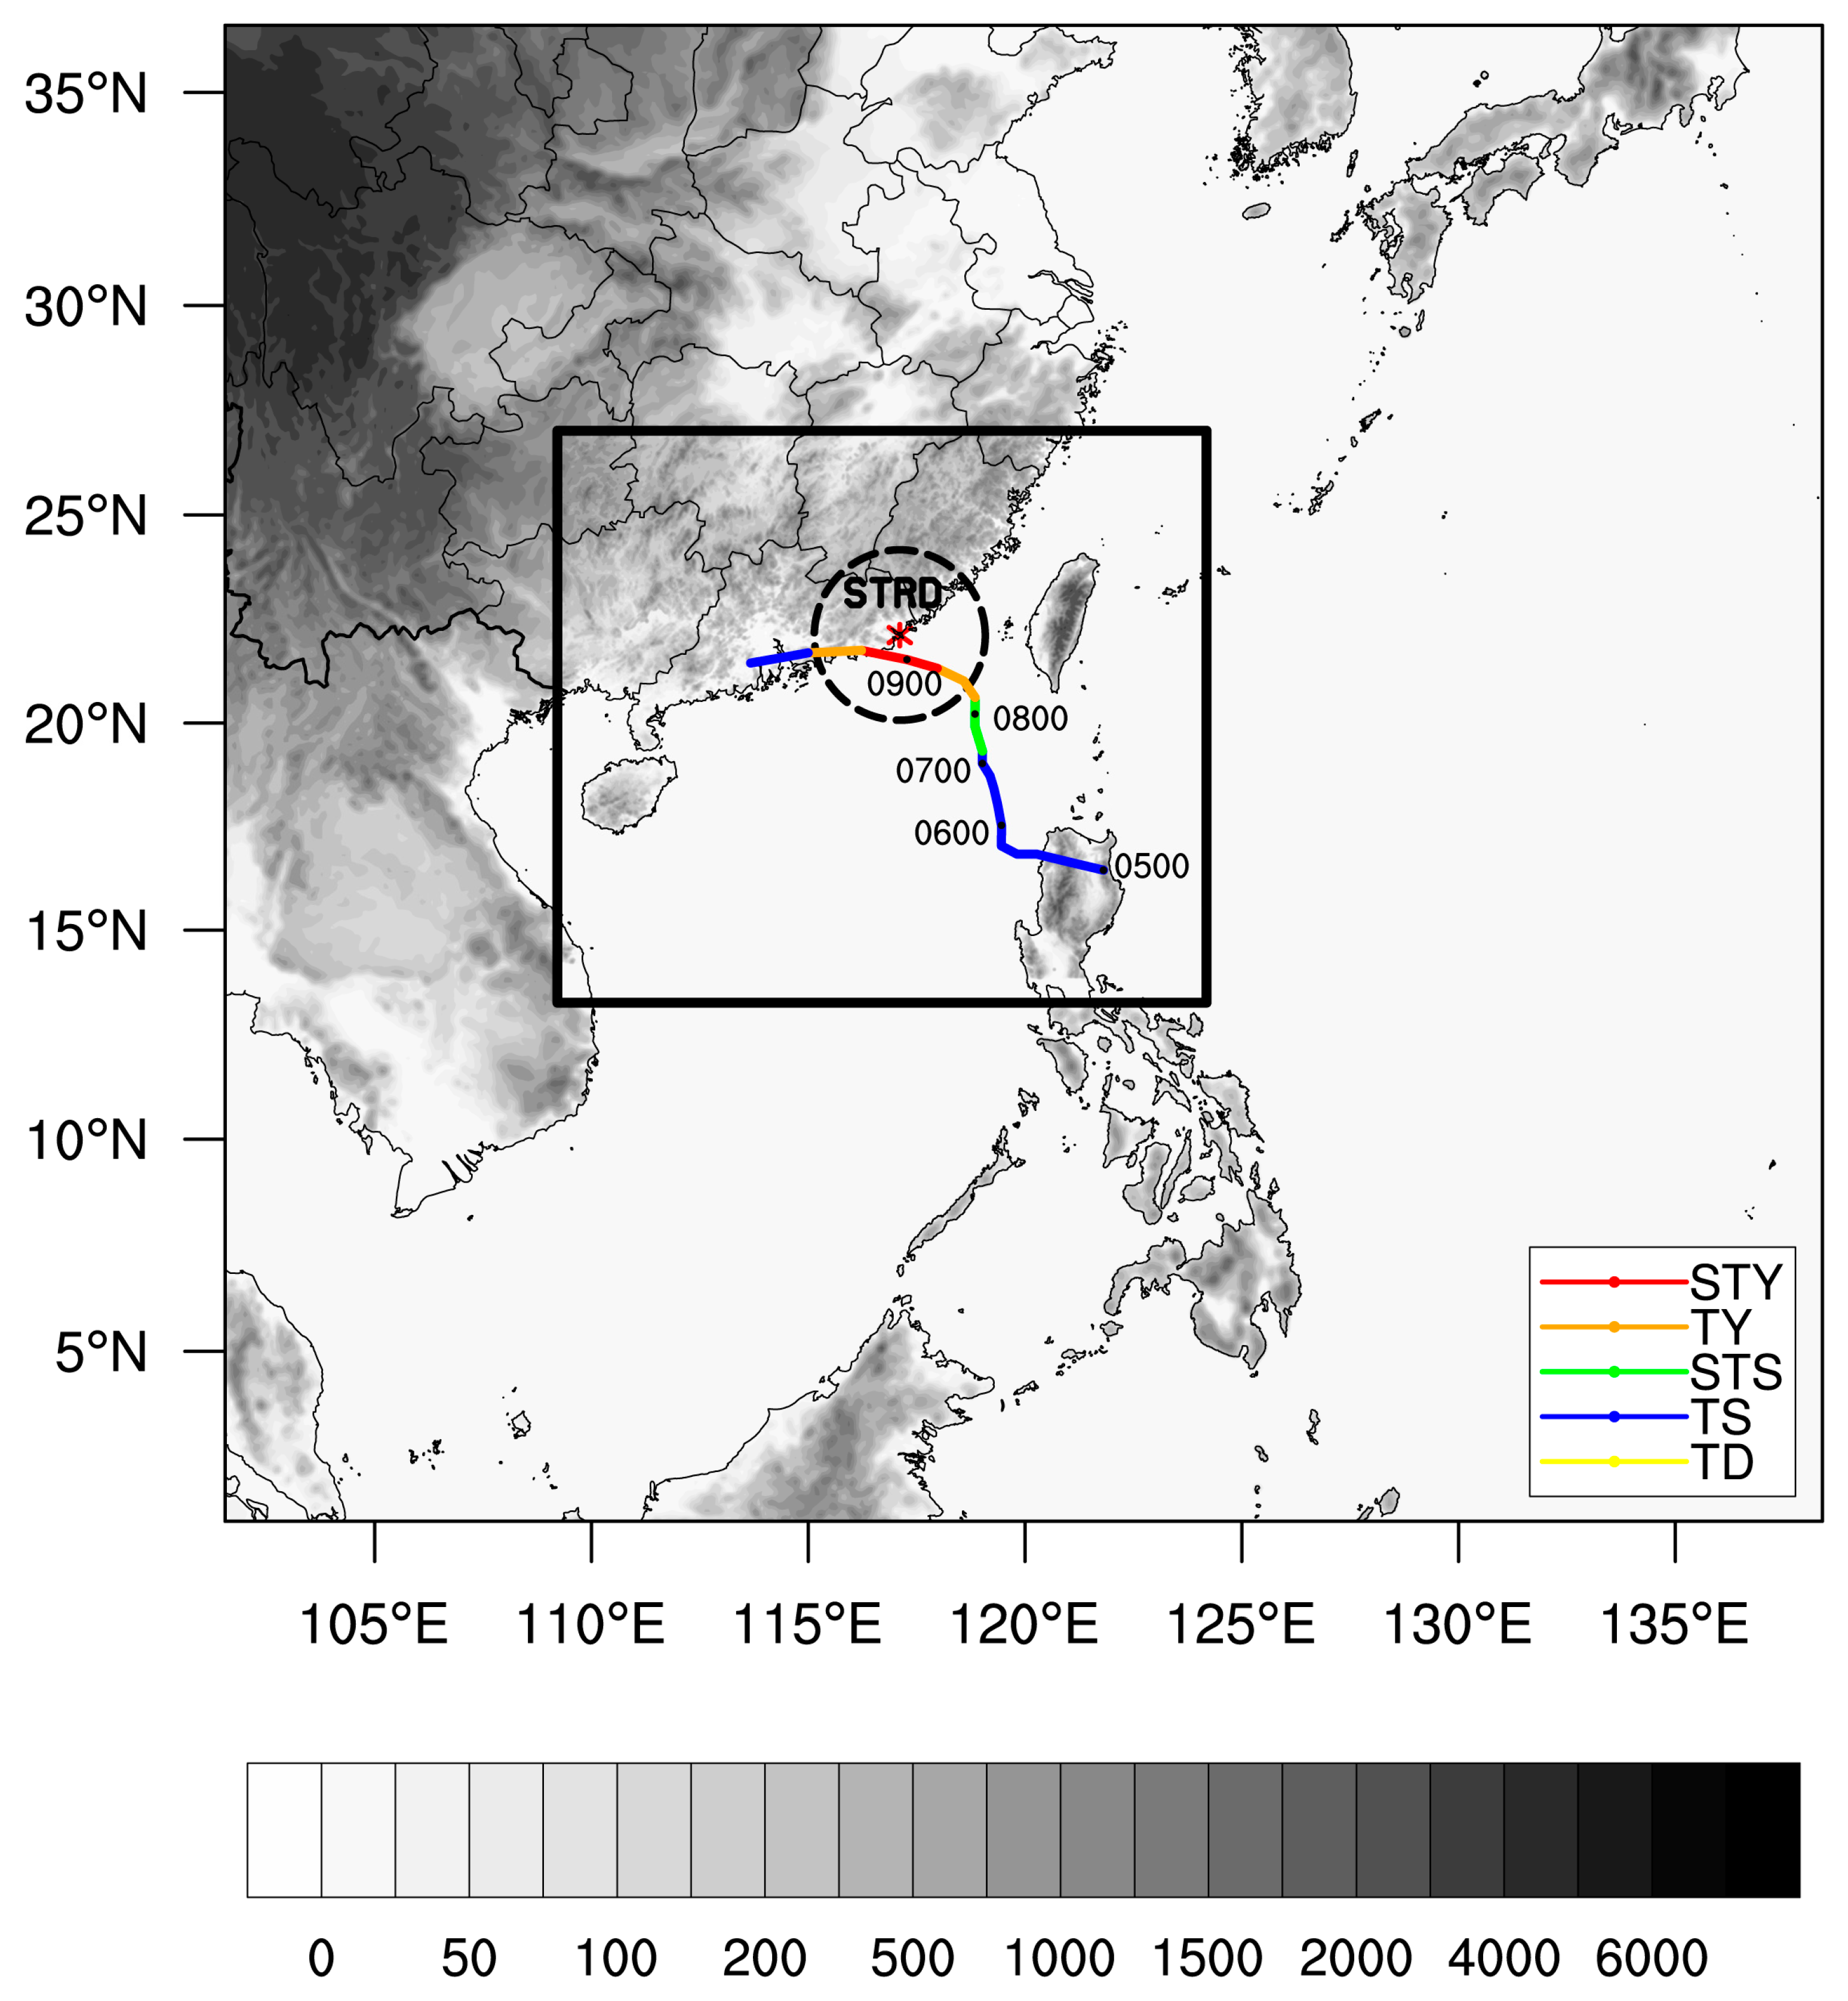
3.1. Overview of Typhoon Linfa (1510)

Typhoon Linfa was generated in the northwest Pacific Ocean east of the Philippines at 1200 UTC (Coordinated Universal Time) on 2 July 2015. At 1200 UTC on 3 July, Linfa turned northwest towards the northern part of Luzon Island and was upgraded to a severe tropical storm by the NMC of the China Meteorological Administration at 2100 UTC on the same day. At around 2000 UTC on 4 July, Linfa made landfall on the northeastern coast of Luzon Island in the Philippines, with a central wind speed of up to 25 m s−1. It was downgraded to a tropical storm at 0000 UTC on 5 July, and upgraded again to a severe tropical storm at 0900 UTC on the same day. Beginning on 6 July, Linfa moved steadily northwards with a speed of about 10 km h−1. On 8 July, Linfa began to turn westwards and gradually approached the eastern coast of Guangdong Province, China. It strengthened to typhoon level at 1200 UTC on 8 July, with its central wind speed increasing up to 35 m s−1. Subsequently, Linfa accelerated and turned toward the northwesterly direction. At 0400 UTC on 9 July, it made landfall in the coastal area of Jiadong Town, Lufeng City, Guangdong Province, with a maximum wind force of 12 and a central pressure of 970 hPa. Then, it weakened rapidly to a tropical depression. At 2100 UTC on 9 July, the NMC stopped tracking it.
Typhoon Linfa was characterized by a complex track, variable intensity and high storm impacts. Linfa’s track was not only influenced by the subtropical high and the monsoon, but also by Typhoon Chan-hom, whose track was sometimes westward and sometimes northward. The intensity of Linfa was also variable, having strengthened three times and weakened twice, frequently shifting between a tropical storm and a severe tropical storm. In addition, the strong winds, gustiness and heavy rainfall caused by Linfa affected a total of 2.118 million people in Guangdong Province, with direct economic losses of CNY 1.586 billion.

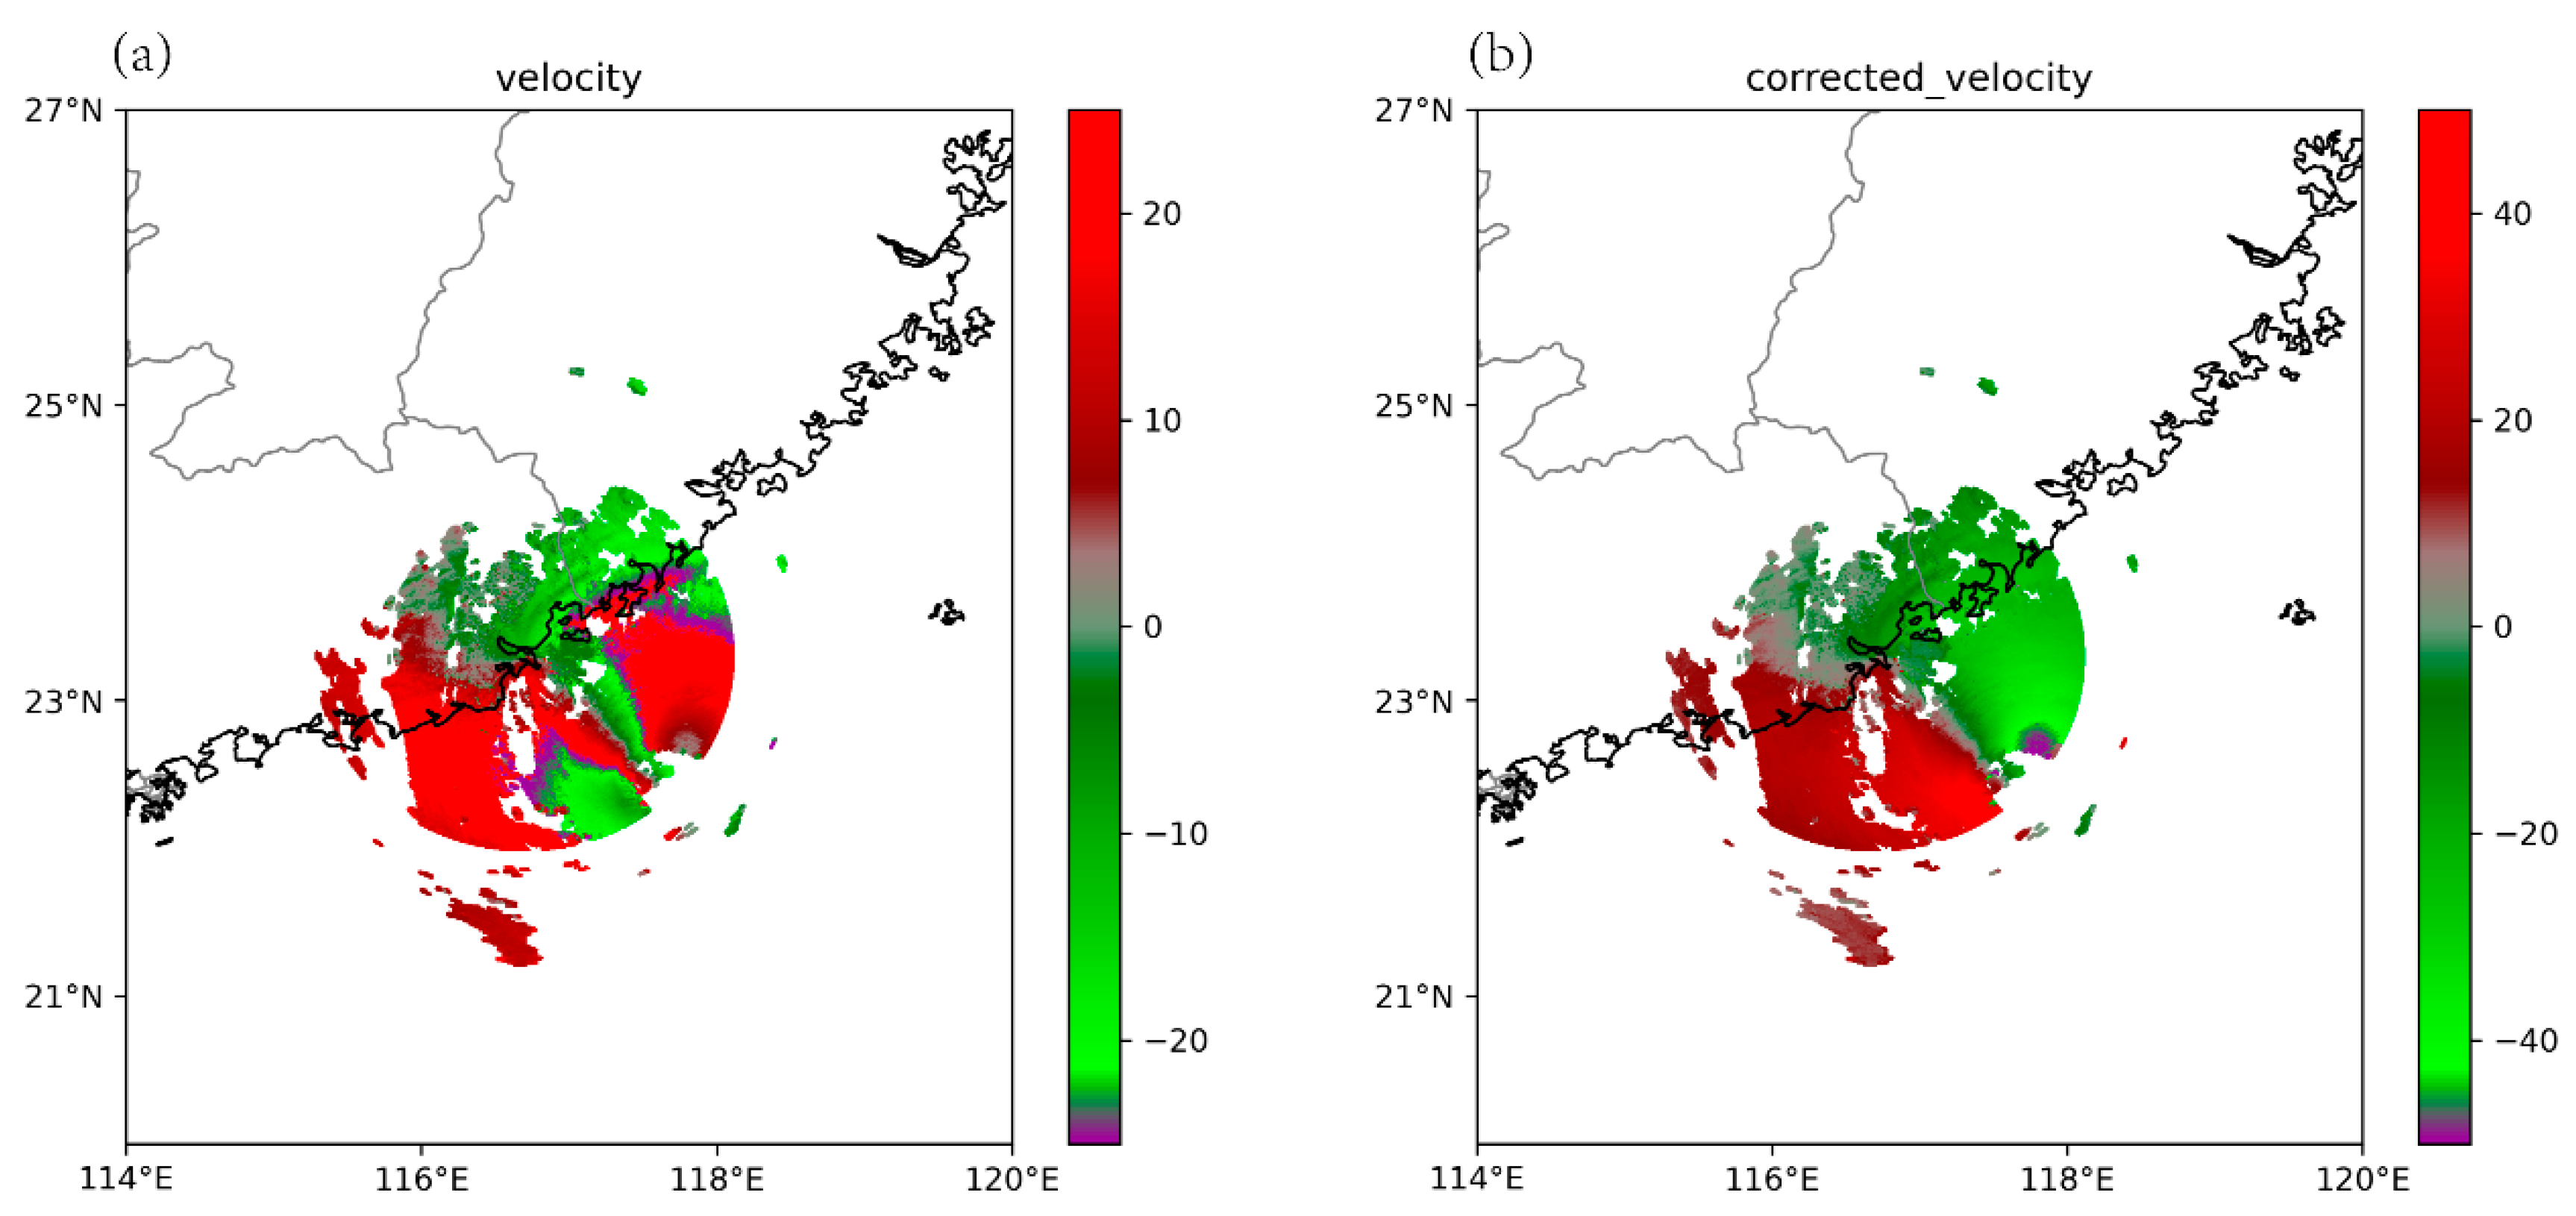
3.2. Quality Control of Radar Data

The radar observations used in this study were obtained from the new generation S-band Doppler weather radar deployed in Shantou, Guangdong Province (STRD). The STRD adopted the VCP21 observation mode for continuous volume scan observations, with a volume scan interval of 6 min and a total of 9 elevation angles (0.5°, 1.5°, 2.4°, 3.3°, 4.3°, 6.0°, 9.9°, 14.6°, 19.5°). The maximum observation radii were, respectively, 230 km and 460 km for the radial velocity and reflectivity echoes, with a corresponding gate length of 250 m and 1000 m. Prior to the radar data assimilation, the quality control procedure was used on the raw data to remove the ground clutter echoes and unfold the velocity fields. The Doppler velocity was unfolded using a region-based algorithm based on the Python library Pyart [27]. Finally, the radar observations after quality control were converted from the spherical coordinate system to the Cartesian coordinate system using the bilinear interpolation method. In this study, the radar radial wind observation error was set to 2 m s−1 [21]. When the deviation of the observation from the background field was greater than 10 m s−1, the radar observation was removed.
Figure 1a displays the radial velocity field at the elevation of 0.5° from the STRD before the quality control at 1800 UTC on 8 July 2015, when Typhoon Linfa was approaching landfall. Following the quality control, as shown in Figure 1b, the radial velocity became more continuous and formed a cyclonic vortex structure, and the maximum radial wind speed increased from 25 m s−1 to 50 m s−1, which was closer to the actual situation.

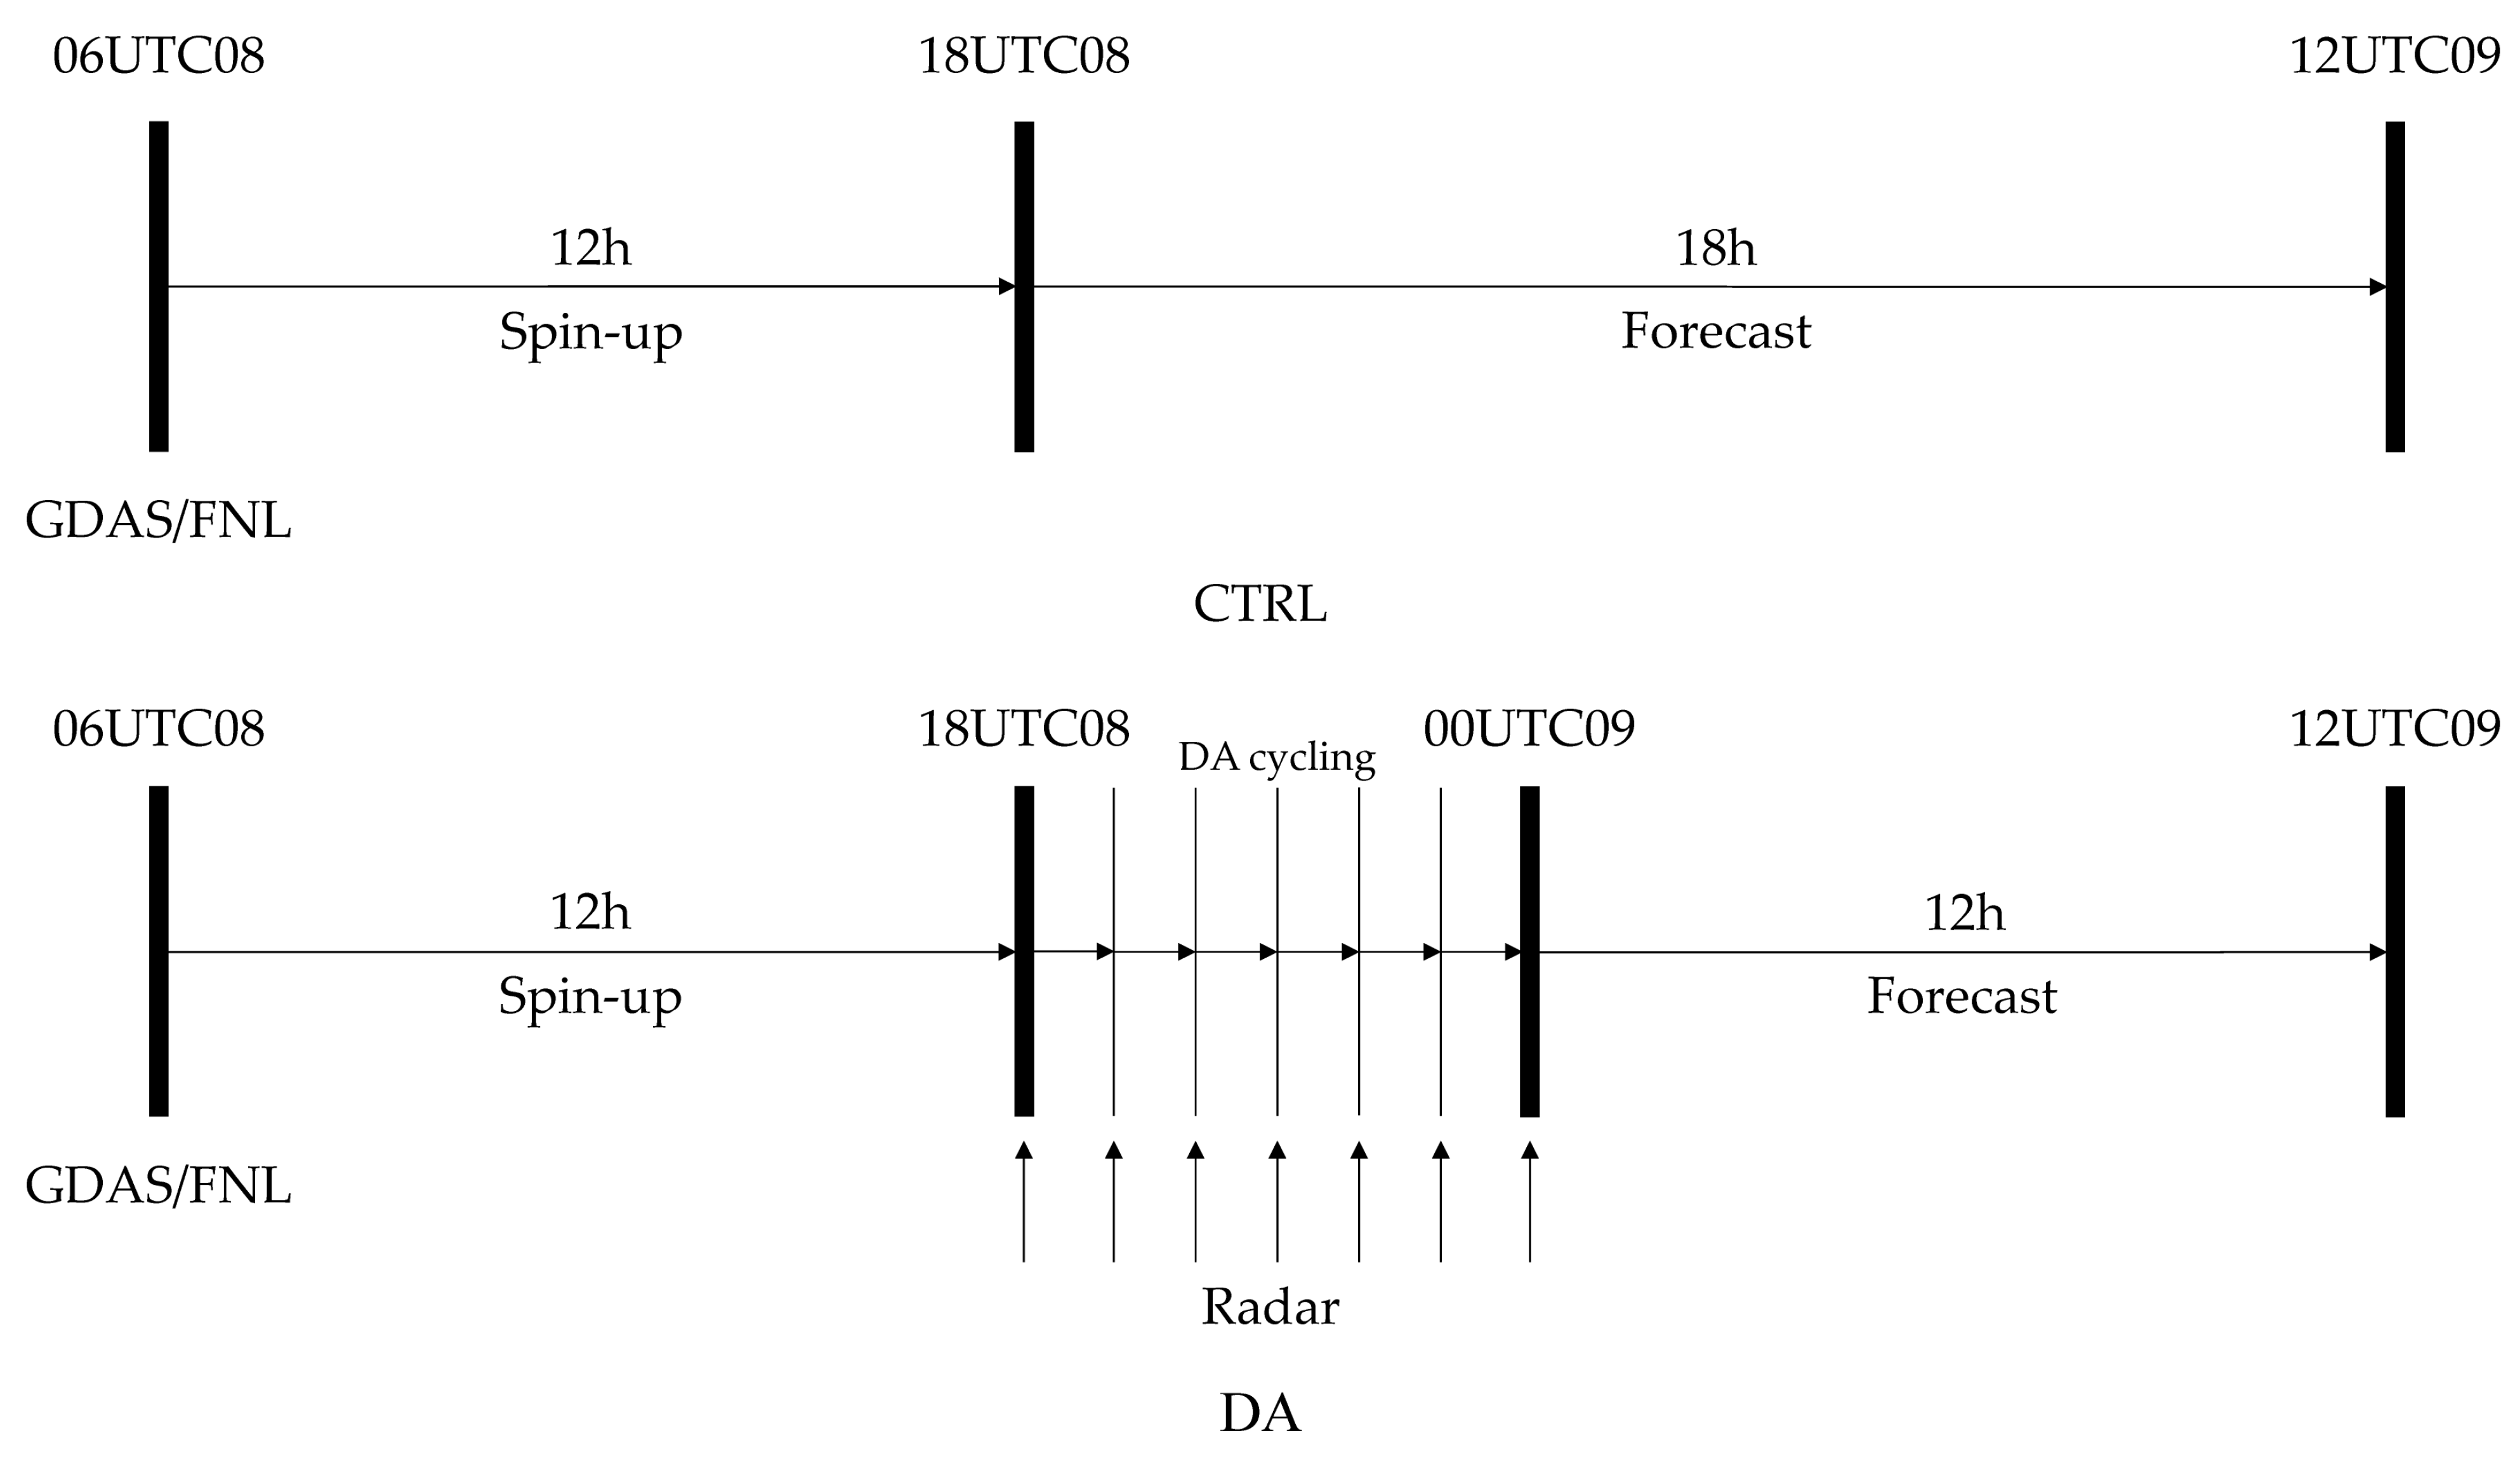
3.3. Model and Experimental Setup

The forecast model used in this study was the advanced research WRF version 4.3, and the assimilation system used was WRF-3DVAR. The initial fields and boundary conditions were obtained from the global data assimilation system (GDAS)/final analysis (FNL) data provided by the NCAR, with a spatial resolution of 0.25° × 0.25°. Figure 2 shows the experimental simulation area with the center point at 119.97° E and 19.96° N. There were two nested domains. The grid of the outer domain d01 was 481 × 451 with a spatial resolution of 9 km, and the grid of the inner domain d02 was 586 × 517 with a spatial resolution of 3 km. The model had a total of 51 layers in the vertical direction, and the pressure at the top layer was 10 hPa. The physical schemes used in the simulation included: WRF single-moment 6-class microphysical scheme [28], the rapid radiative transfer model for global climate models (RRTMG) longwave and shortwave radiation scheme [29], the fifth-generation Pennsylvania State University-NCAR mesoscale model (MM5) similarity scheme for the surface layer processes [30], the Noah land surface model scheme for the land surface processes [31], the Yonsei University scheme for the planetary boundary layer processes [32] and the New Tiedtke cumulus parameterization scheme [33].
In this study, five sets of experiments were designed (Table 1), and the flow chart of the experiments is shown in Figure 3. The control experiment (CTRL) was simulated from the data obtained from 0600 UTC on 8 July to 1200 UTC on 9 July 2015, 36 h in total. Four sets of assimilation experiments were initialized at 0600 UTC on 8 July, with a 12-h spin-up to generate the background field for the initial moment of assimilation. The radial velocity was assimilated every 1 h from 1800 UTC on 8 July to 0000 UTC on 9 July using the WRF-3DVAR system. The final forecast was from 0000 UTC to 1200 UTC on 9 July. In order to make the radar observations update the model background field reasonably and effectively, this study compared the effects of different horizontal length scale factors of the background error covariance on the typhoon simulation during the assimilation process. The length scale factor was set to 1.0, 0.75, 0.5 and 0.25 for experiments DA_len1.0, DA_len0.75, DA_len0.5 and DA_len0.25, respectively. For reasons of space constraints, we only present the detailed analysis of the two most representative sets of experiments, DA_len1.0 and DA_len0.25.

4. Analysis and Results

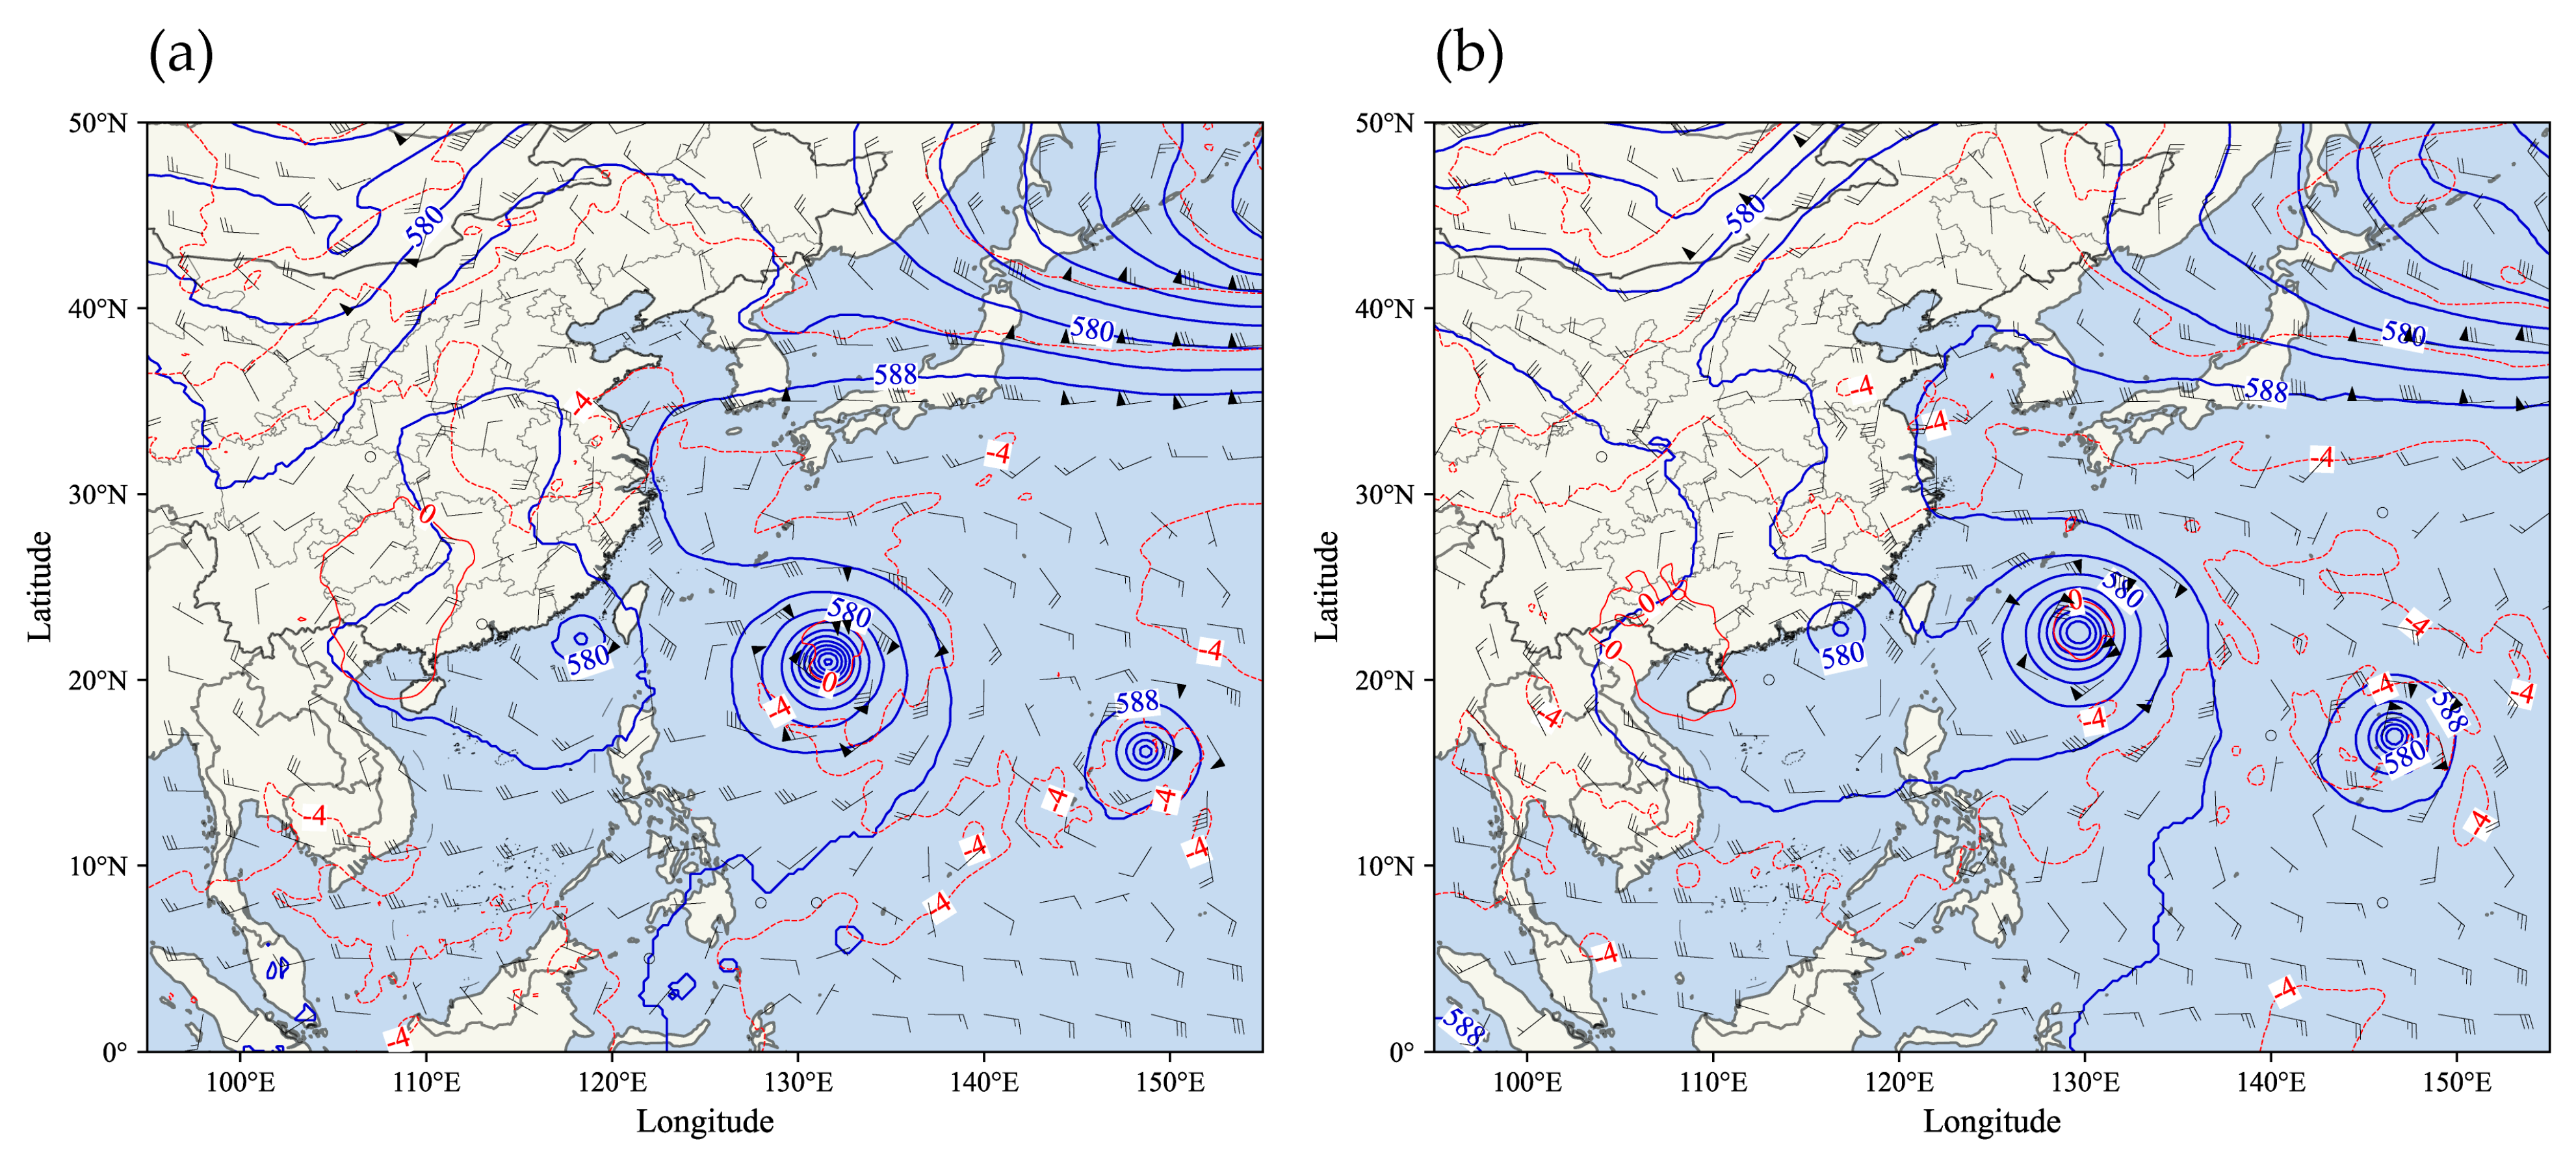
4.1. Analysis of the Circulation Situation

During the lifetime of Typhoon Linfa, Typhoon Chan-hom and Typhoon Nangka also existed in the northwest Pacific Ocean, which makes it much more difficult for the forecast of Linfa. Figure 4 shows the 500 hPa circulation analyzed by the ERA5 reanalysis data with a spatial resolution of 0.25° × 0.25°. It is evident that from 1200 UTC on 8 July to 0000 UTC on 9 July, Typhoon Chan-hom was steadily moving westward, steered by the easterly airflow on the south side of the subtropical high in the western Pacific Ocean and the equatorial westerly airflow, while Typhoon Linfa was moving northwestward, steered by the southeasterly airflow on the southwest of the subtropical high. At 0000 UTC on 9 July, the subtropical high extended westward and northward, and the continental warm high strengthened. They jointly caused a stable high pressure dam at the mid-latitudes. Typhoons Linfa and Chan-hom were mutually rotating during this period, and Linfa turned counterclockwise and moved away from Chan-hom, because Typhoon Chan-hom was stronger and played a dominant effect.

4.2. Analysis of the Wind Increments

Figure 5 displays the 700 hPa wind field at 1800 UTC on 8 July, when the assimilation analysis began. All the three sets of experiments show obvious cyclonic circulations, with clear typhoon eyes. From Figure 5a, it can be seen that the maximum wind speed in the CTRL does not exceed 40 m s−1, indicating a weak typhoon intensity. The typhoon eye, which is represented by the wind band with a wind speed of less than 8 m s−1, is large in the CTRL experiment. Following the first assimilation of radial velocity in DA_len1.0, the wind speed in the northern part of Linfa increases remarkably, and the areas with wind speed exceeding 40 m s−1 are observed on a larger scale, which forms an obvious asymmetric wind field (Figure 5b). In Figure 5c, the DA_len0.25 experiment also presents the enhanced wind speed (more than 40 m s−1) in the northern part of the typhoon, and the typhoon eye is contracted and the structure is more compact and reasonable.
In order to visually display the improvement of the radial wind assimilation, Figure 6 shows the analysis increments of 700 hPa wind fields at the first moment of assimilation for both DA_len1.0 and DA_len0.25. From Figure 6a, it can be found that a cyclonic wind field difference is generated in the area of large wind speed variation near the location of the observed typhoon center, which makes the typhoon stronger in DA_len1.0, while an anticyclonic difference is generated about 2° north of the typhoon center. Figure 6b shows the analysis increment field after the assimilation of DA_len0.25. When the horizontal length scale factor is reduced, a cyclonic difference also appears near the observed typhoon center, which makes the typhoon vortex structure more compact. The above results indicate that using the default horizontal length scale factor will make the rich micro- and meso-scale information contained in radar observations difficult to be assimilated effectively. This is because the background error covariance matrix calculated by the NMC method mainly reflects the characteristics of large-scale error structure, while the radar observations mainly reflect the micro- and meso-scale characteristics. Furthermore, the influence range of the background error covariance matrix will be unreasonably magnified, resulting in wind-pressure imbalance and causing unrealistic wind. By reducing the horizontal length scale factor of the background error covariance, the radar observations can be propagated in a more rationalized manner in the assimilation, which will make the analysis fit the observations better and improve the background fields in the model.

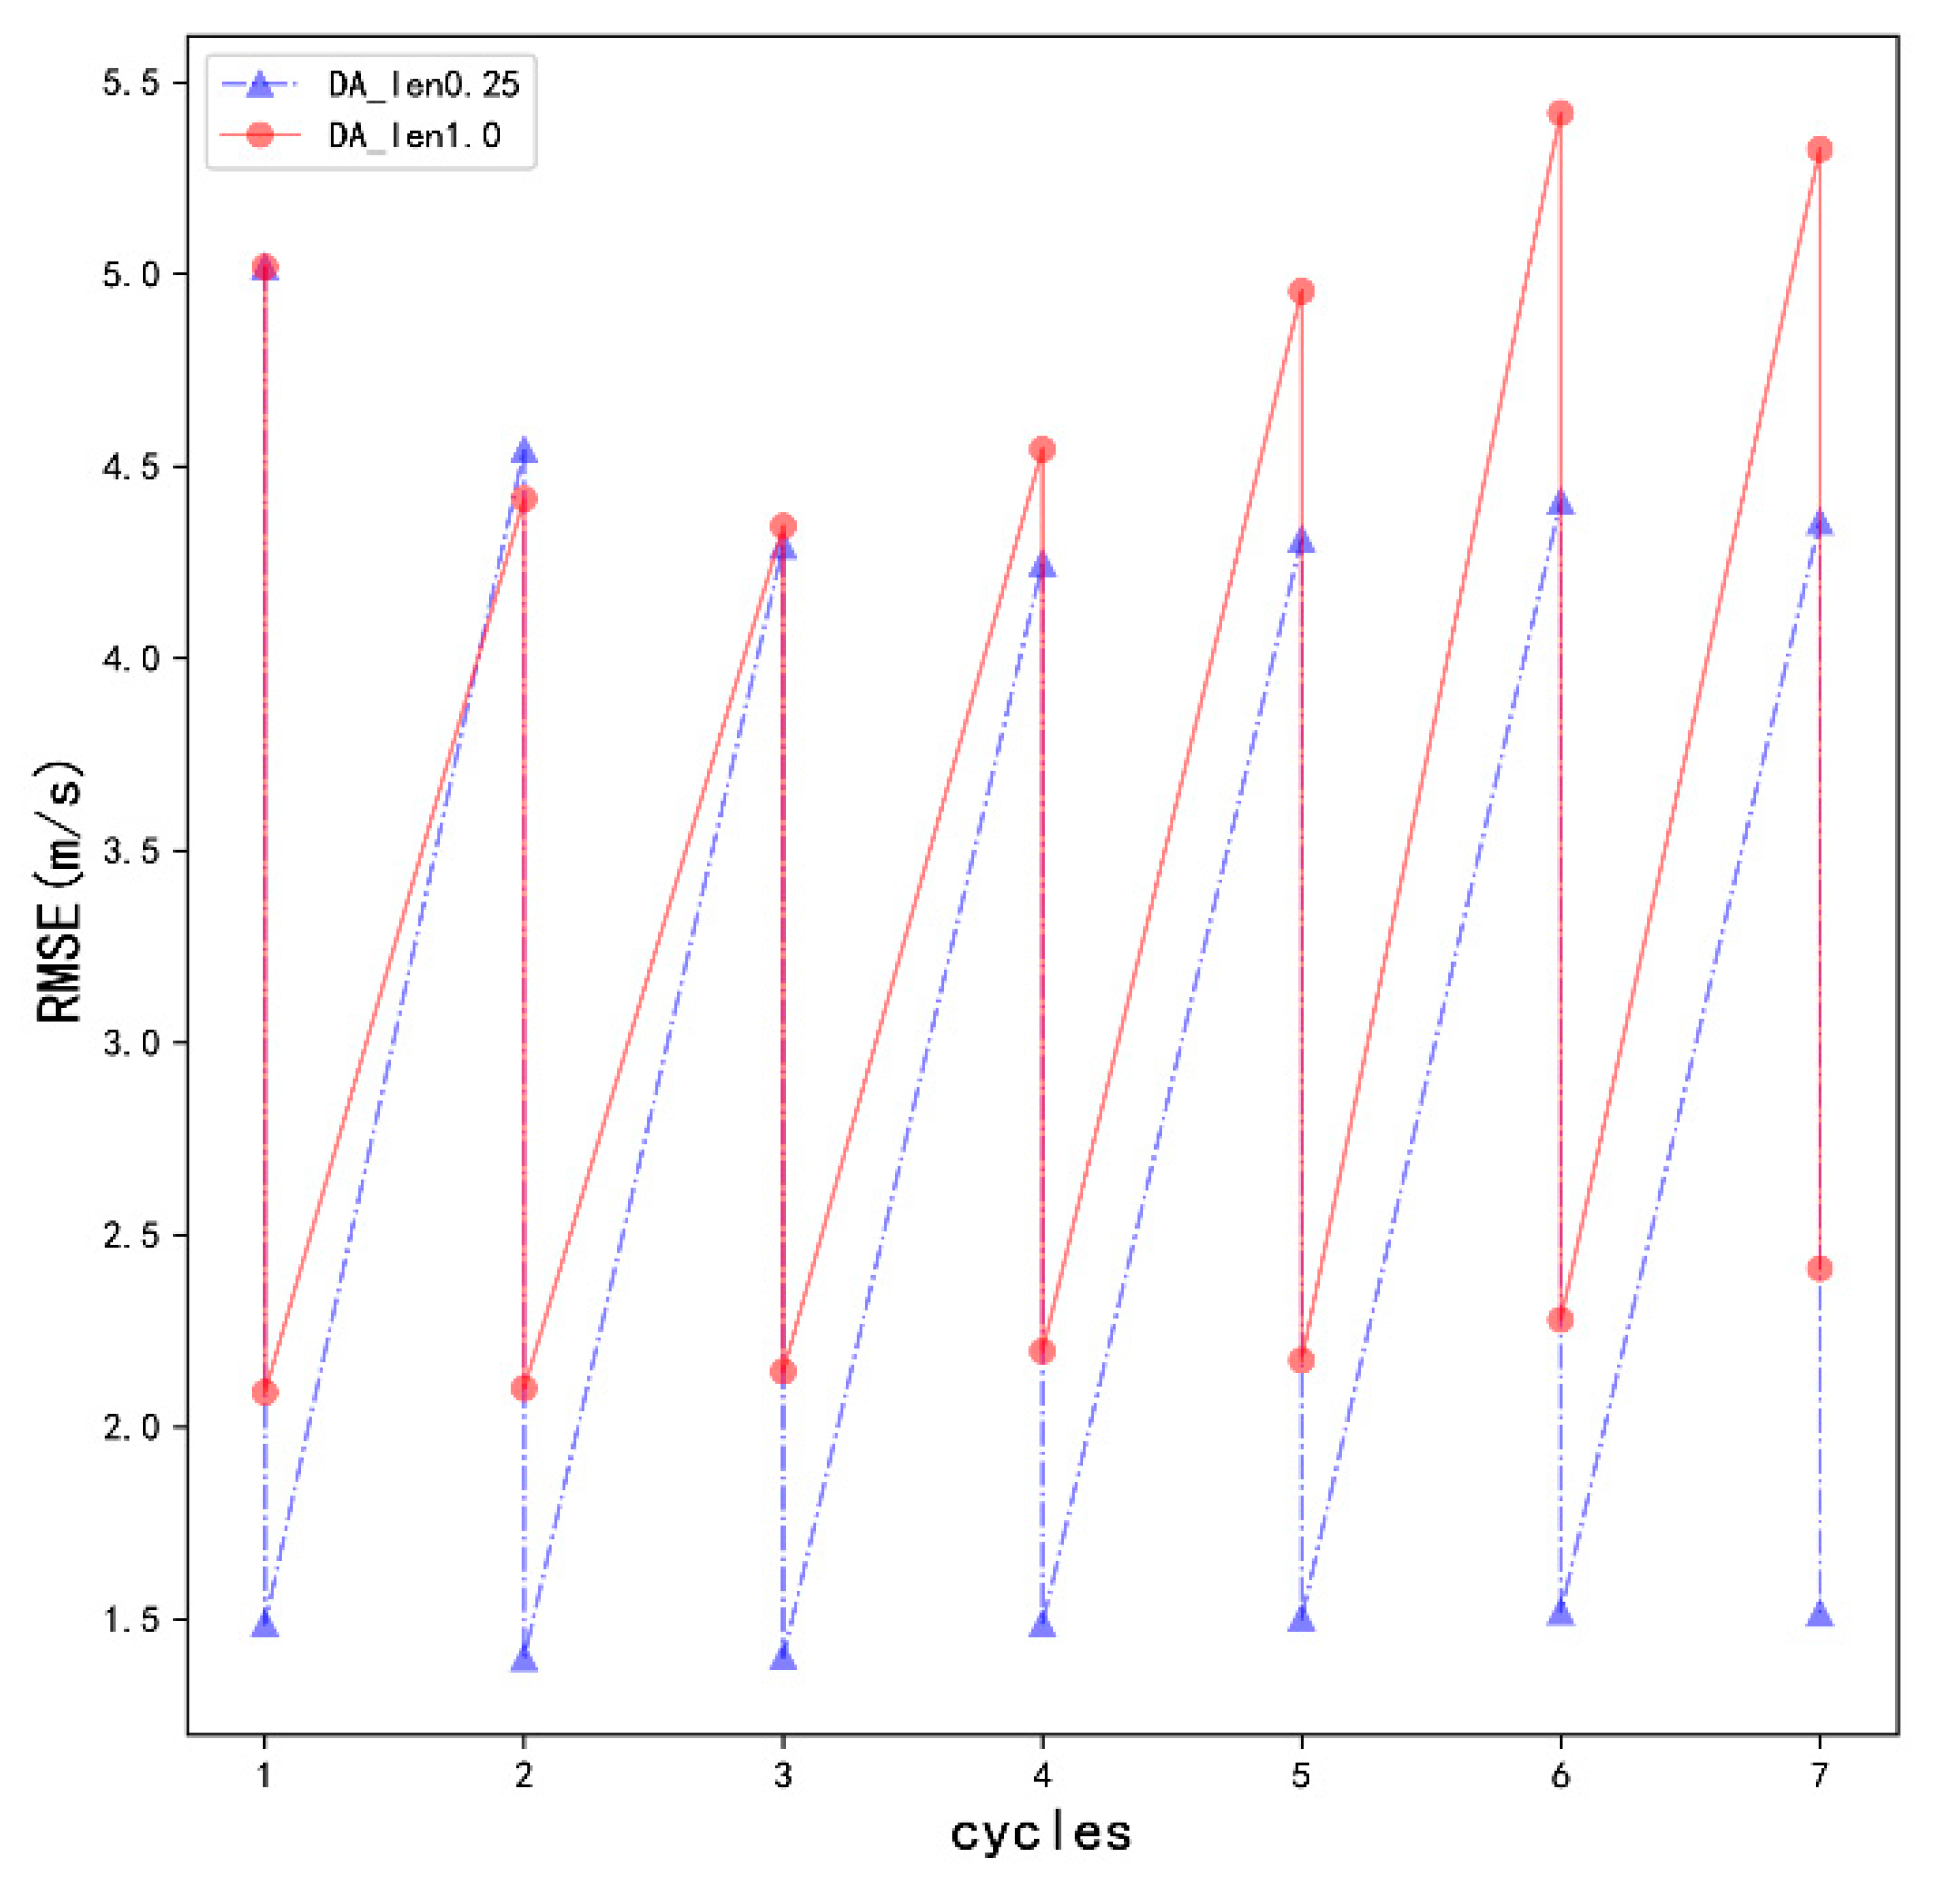
4.3. Qualitative Analysis of Radial Velocity Errors

To further evaluate the assimilation effect quantitatively, the RMSE between the analysis and observed radial velocity is calculated before and after each cycle of assimilation, and the results are illustrated in Figure 7. It is evident that the RMSE of the radial velocity decreases after assimilation, and the RMSE in the DA_len0.25 experiment has the most reduction after the first assimilation analysis, from 5.0 m s−1 to 1.5 m s−1, because the largest analysis increment is usually obtained in the initial background field. In each assimilation cycle, the 1-h forecast increases the RMSE, with the increments of 1.5–4.5 m s−1 for DA_len0.25 and 2.0–5.5 m s−1 for DA_len1.0. According to this result, the RMSE increases with short-term forecasts initiated from the analysis field, whereas it decreases with the assimilation analysis. Following each assimilation cycle, the RMSE of the DA_len0.25 analysis is smaller than that of the DA_len1.0 analysis, which implies that the wind field in DA_len0.25 is closer to the observation, and DA_len0.25 has a better assimilation effect than that in DA_len1.0.

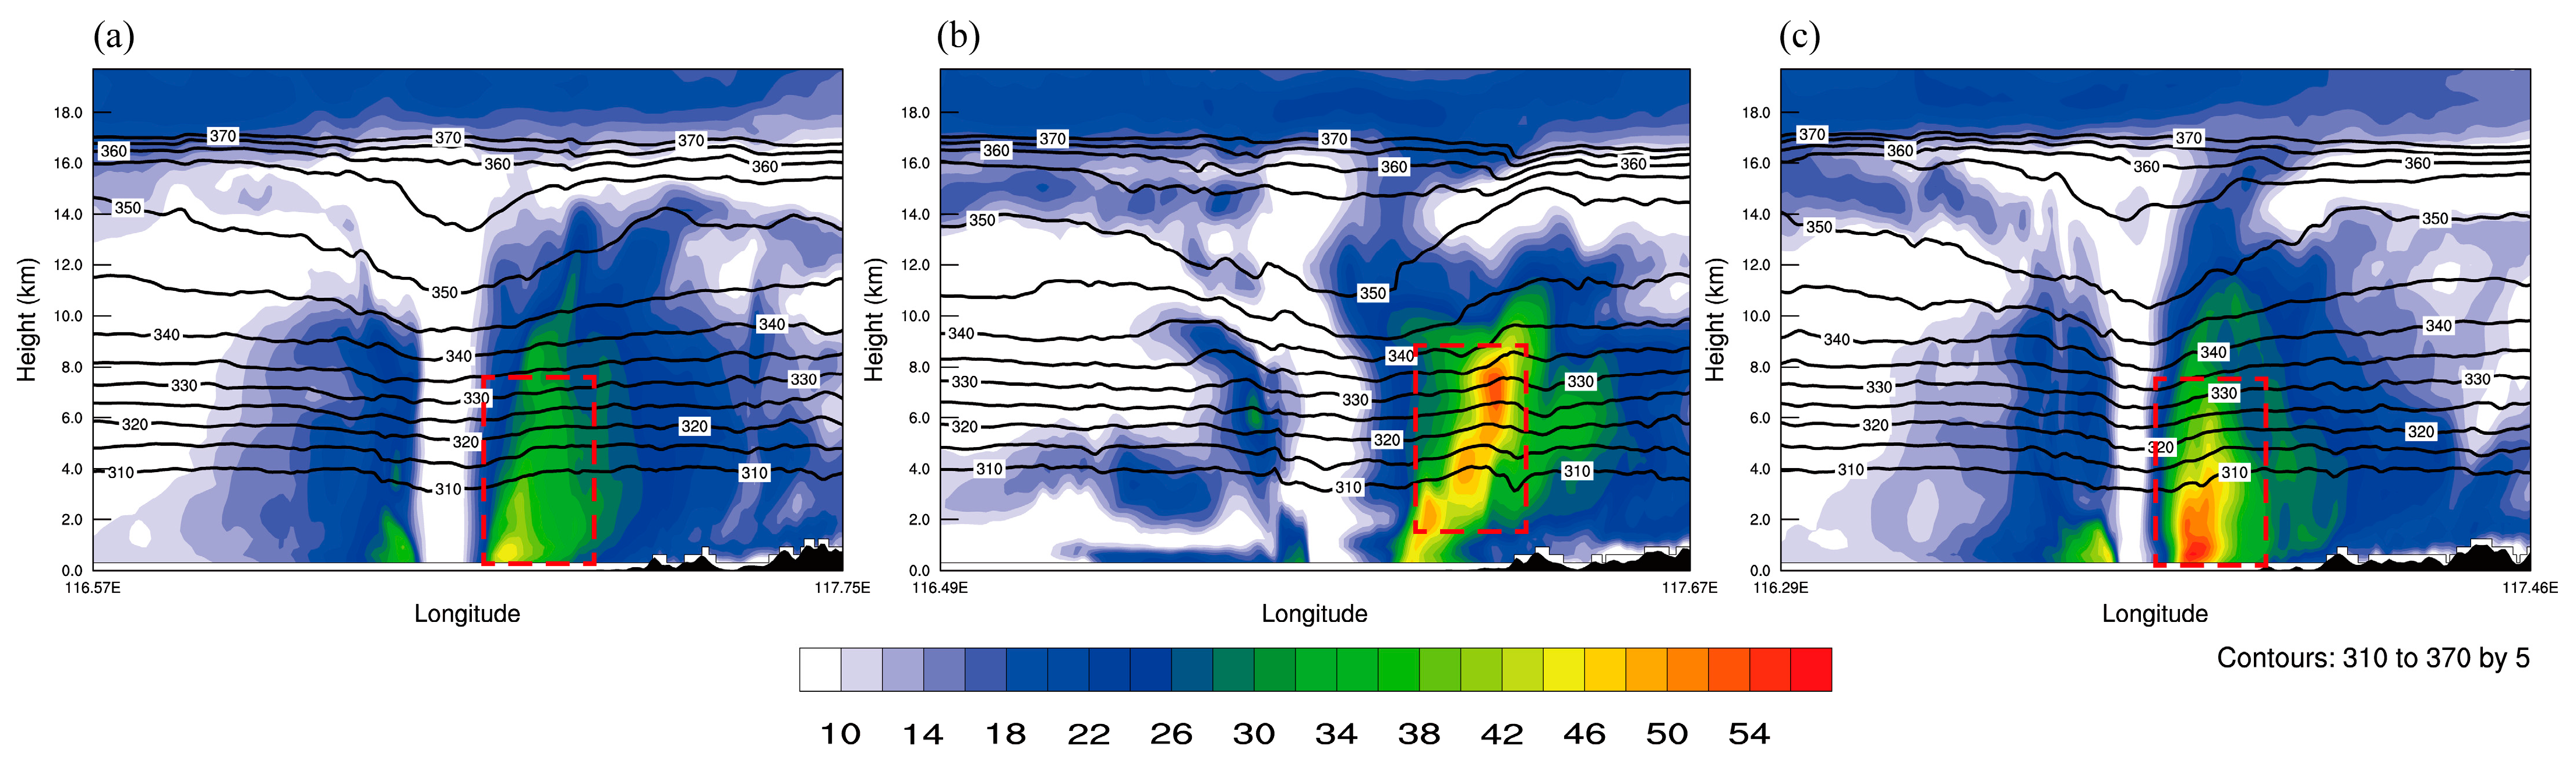
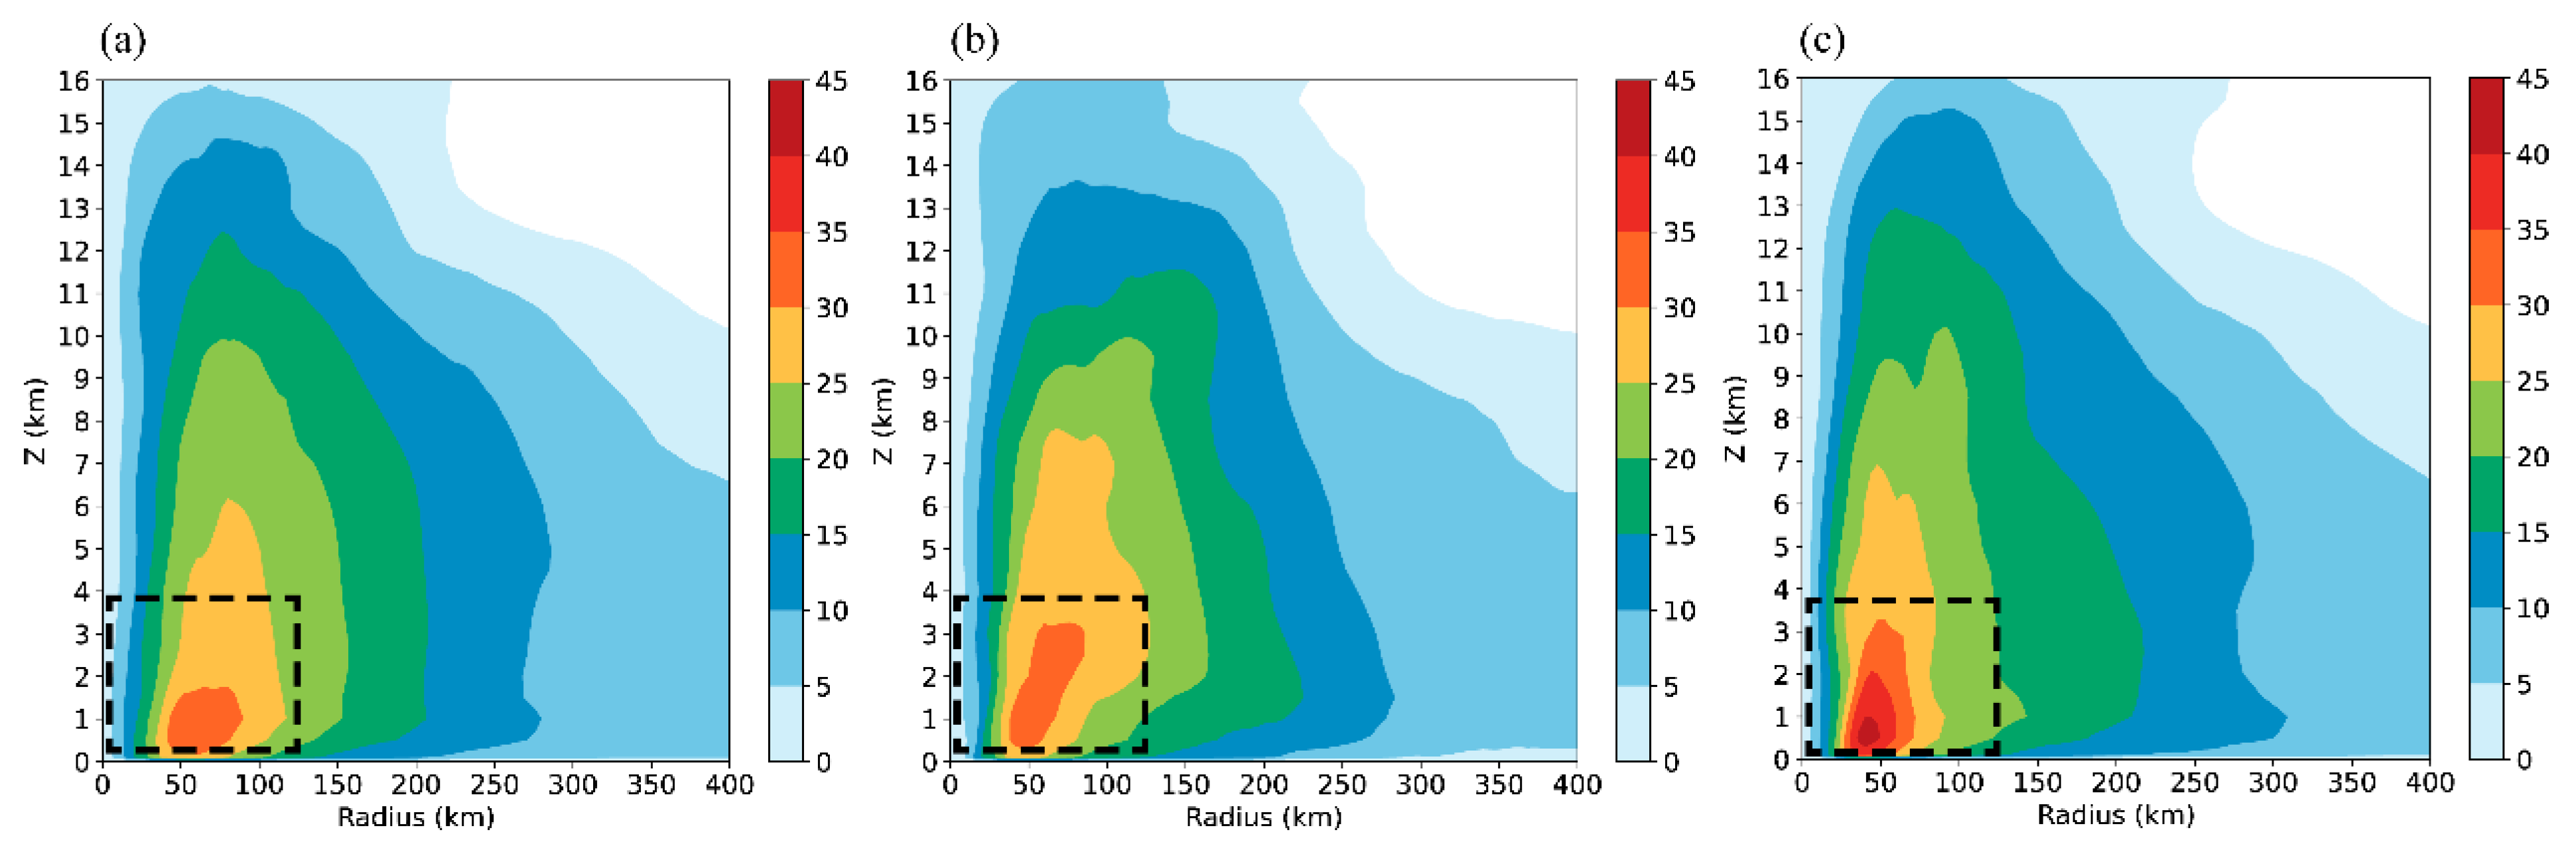
4.4. Analysis of the Typhoon Structure

The sea-level pressure and the near-surface 10-m wind are important indicators for assessing the typhoon intensity. In Figure 8, the sea-level pressure field and the 10-m wind field are depicted at the moment of the last assimilation analysis. The sea-level pressure is 970 hPa and the maximum wind speed is 35 m s−1 according to the China Meteorological Administration’s (CMA) best observation at that moment. From Figure 8a, we can see that the typhoon eye is larger in the CTRL, and the typhoon intensity is obviously weaker than the observation. The isobars near the typhoon center are sparse, the minimum pressure is 978 hPa, and the maximum wind speed is less than 34 m s−1. The intensity in the DA_len1.0 assimilation experiment has almost no improvement compared with the CTRL, and the shape of Typhoon Linfa has changed from a horizontal ellipse to a vertical ellipse (Figure 8b). It can be seen from Figure 8c that, after assimilating the radar radial wind observations with a smaller horizontal length scale factor, the typhoon intensity in the DA_len0.25 assimilation experiment is enhanced compared with the CTRL, and the wind speed is also adjusted. The lowest sea-level pressure at the typhoon center is 972 hPa and the maximum wind speed is over 34 m s−1, which are very close to the observations. At the same time, the radius of the typhoon eye is remarkably reduced, the isobars become dense, and there is an obvious enhancement of the vortex circulation structure in the core area of the typhoon. Overall, the correction effect of DA_len0.25 on the structure and intensity in the typhoon inner core region is apparently better than the other two experiments, which indicates that assimilating radar radial velocity can well capture the main circulation structure of the typhoon after the optimization adjustment of the horizontal length scale factor.
To study the variations of the typhoon’s vertical structure, the vertical profiles of the horizontal wind speed and potential temperature (PT) along the red dashed line in Figure 8 are displayed in Figure 9. All of the vertical profiles in the three experiments show distinct asymmetric structures, and successfully simulate the vortex circulation and eyewall structure extending from sea level to the height of about 10 km. The maximum horizontal wind speed of the CTRL is lower than 46 m s−1, which is located at the height of about 1 km, and the wind speed starts to decrease from 2 km. The boundary of the typhoon eye is obvious, and the horizontal wind speed within the eye area is less than 10 m s−1. The iso-PT contours in the eye area are flatter, which indicates that the warm-core structure is not obvious. In DA_len1.0, the vortex circulation is weaker, the radius of the typhoon eye is wider and irregular, and the warm-core structure is also not obvious. The maximum horizontal wind speed is lower than 54 m s−1 at the height of about 7 km. Such strong winds should not appear at that height, indicating that using the default horizontal length scale factor will lead to the unreasonable propagation of radar observation information in the vertical direction. The wind field of the DA_len0.25 experiment is clearly enhanced compared to the CTRL experiment. The maximum wind speed is more than 54 m s−1, and the strong wind area extends to a higher height. The range of the typhoon eye is obviously reduced, and the iso-PT contours start to bend downward around 10 km, indicating a more obvious warm-core structure. The assimilation of the radar radial wind observations after the optimization adjustment of the horizontal scale factor can well capture the main vertical structure of the typhoon.
To further analyze the typhoon structure, the azimuthally averaged tangential wind speed in the three experiments (CTRL, DA_len1.0 and DA_len0.25) at 0000 UTC on 9 July 2015 are shown in Figure 10. The maximum wind speed in the center in DA_len1.0 is higher than that in the CTRL experiment. This is consistent with previous findings that the default horizontal length scale factor leads to the unreasonable propagation of radar observations in the vertical direction. The azimuthally averaged horizontal wind speed in DA_len0.25 is obviously enhanced, with the maximum wind speed of 45 m s−1. The horizontal wind also shows a greater horizontal gradient in the typhoon eye area, which is relatively confined to a smaller area, with a range of about 50 km from the typhoon center. It is evident that after the optimization adjustment of the horizontal length scale factor, the assimilation of the radar radial wind can enhance the typhoon vortex structure and help to adjust the dynamical structure inside the typhoon effectively.

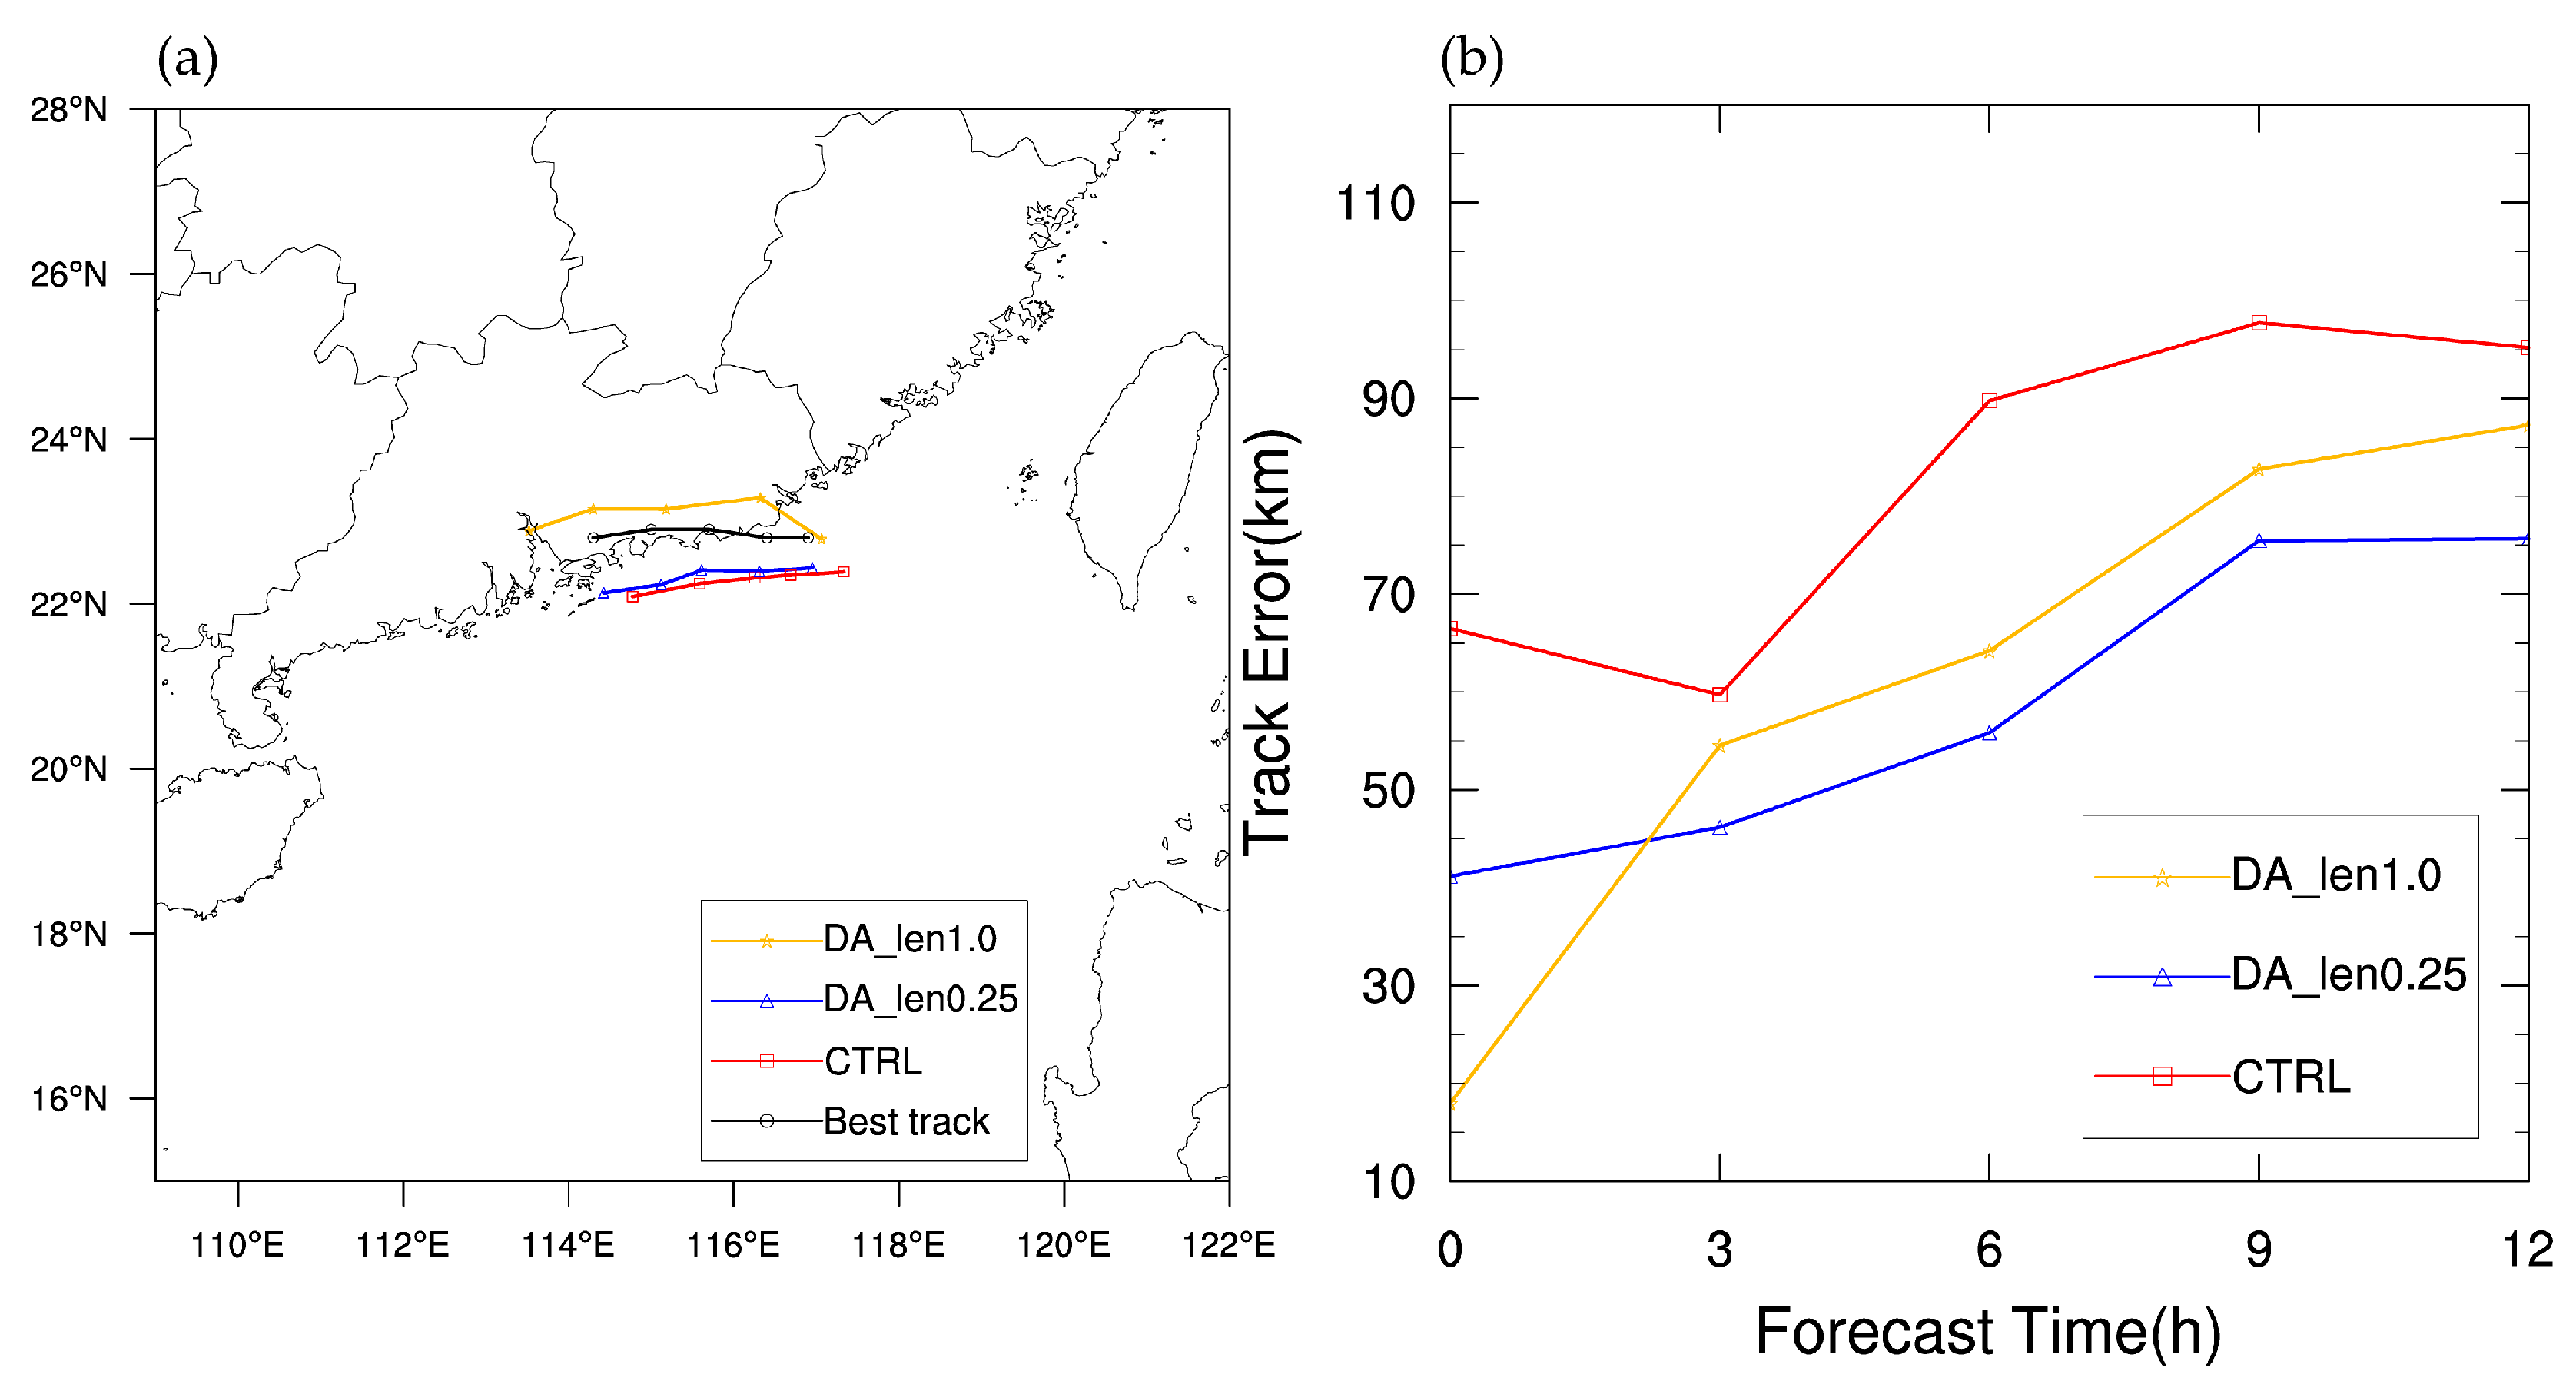
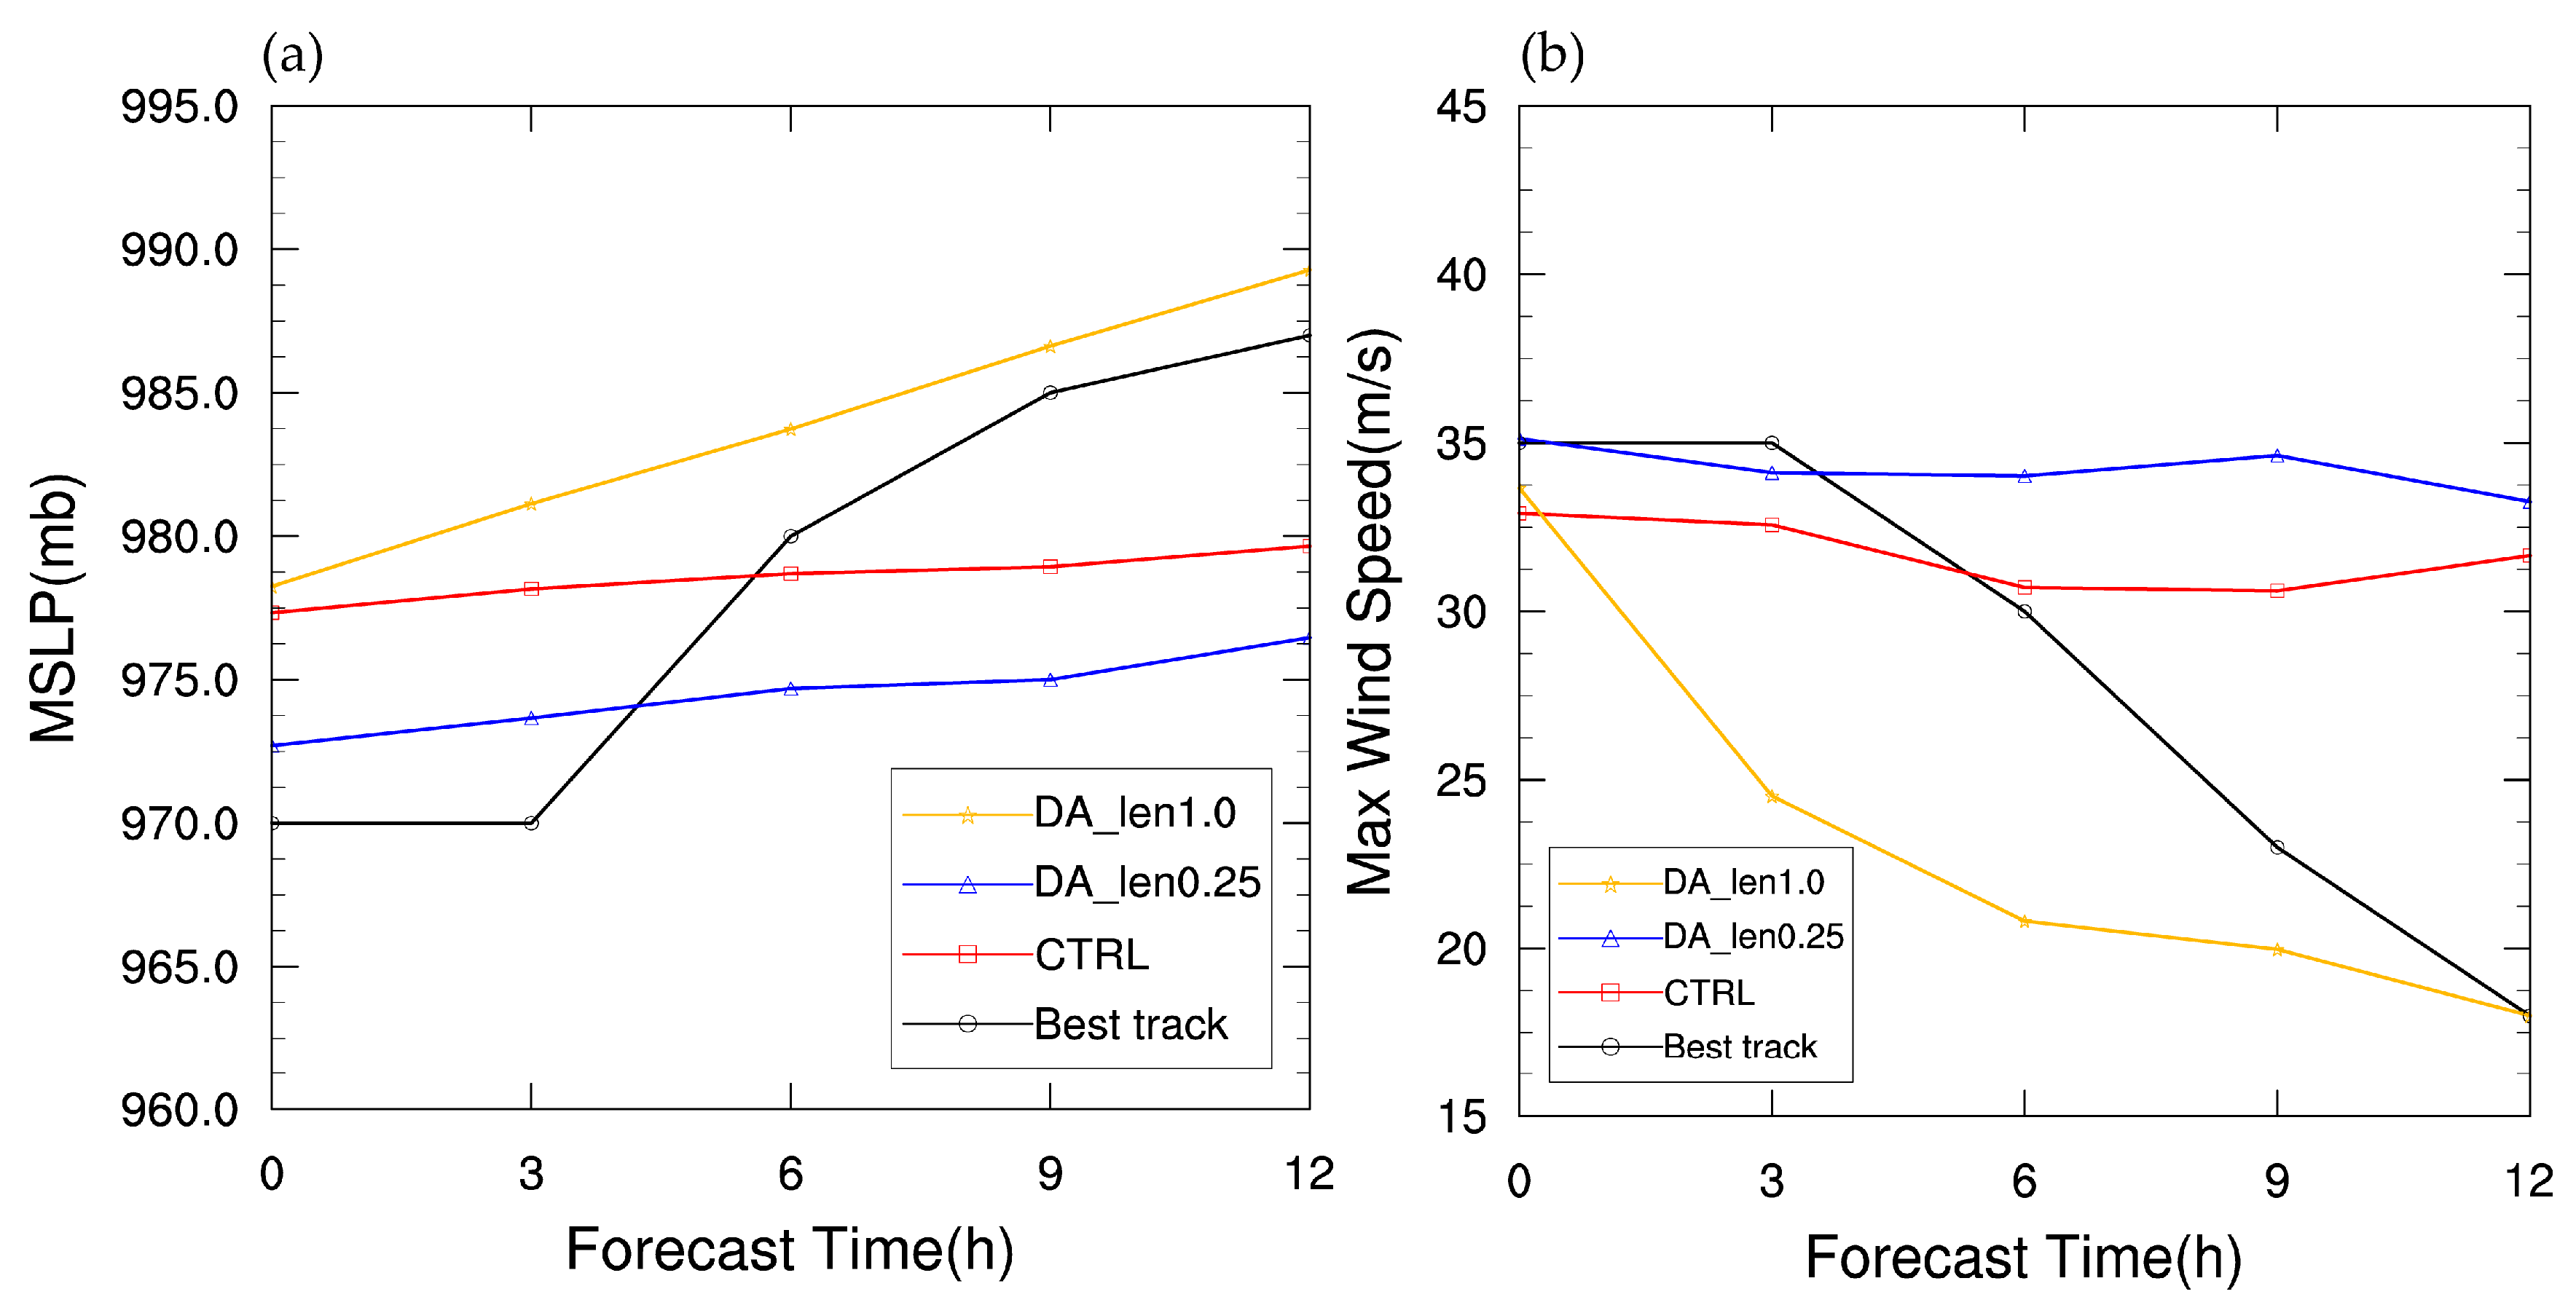
4.5. Analysis of the Forecasting Results

To further evaluate the effect of the radar radial wind assimilation, the 12-h deterministic forecasts from 0000 UTC to 1200 UTC on 9 July 2015 are analyzed. The track forecasting in the three sets of experiments and the CMA’s best track are shown in Figure 11a. The typhoon center in the three experiments is determined by the location of the minimum sea-level pressure. The errors of the track forecasts in the three experiments compared to the CMA’s best track during the forecast period are shown in Figure 11b. As can be seen, the tracks in both assimilation experiments have different degrees of improvement compared to the CTRL. In the last moment of assimilation analysis, the typhoon center in the CTRL is located to the southeast of the observation, with a track error as high as 66 km. Meanwhile, the typhoon center in the DA_len1.0 experiment is closer to the typhoon center of the CMA’s best track, with a track error of only 18 km. The typhoon center in DA_len0.25 is located to the south of the observation, with a track error of 40 km. The typhoon center in DA_len0.25 is more southerly than that in DA_len1.0, indicating a larger initial error. Following the 3-h forecast, the track error of the DA_len0.25 experiment is smaller than that of the DA_len1.0 experiment. The forecasted track direction in DA_len0.25 is consistent with the CMA’s best track and the moving speed is comparable, while the moving speed in DA_len1.0 is obviously too high, probably due to the weaker typhoon intensity. Overall, the track error of the DA_len1.0 assimilation experiment grows too fast, and the DA_len0.25 assimilation experiment has a more obvious improvement in typhoon track forecasting.
There are two crucial physical quantities that can be used to characterize the intensity of a typhoon: minimum sea-level pressure (MSLP) and maximum surface wind speed (MSW). Figure 12 demonstrates the MSLP and MSW of the three sets of experiments and the CMA observations. In the last moment of assimilation analysis, the MSLP of the CMA observation is 970 hPa and the MSW is 35 m s−1. Both the MSLP and MSW of DA_len0.25 are very close to the CMA observation in the first three hours of the forecast, which also reflects the remarkable assimilation effect of the DA_len0.25 experiment. The application of different horizontal length scale factors in the assimilation process has obvious effects on the forecasting of typhoon intensity. The MSLP of the typhoon in DA_len1.0 is always higher than the CMA observation and the DA_len0.25 experiment, which indicates that the typhoon vortex simulated by DA_len1.0 is weaker and the typhoon intensity is seriously underestimated. However, when the typhoon makes landfall, the intensity of the DA_len0.25 forecast is higher than the CMA observation. This is because the position of typhoon center in the DA_len0.25 forecast is more southward and still on the ocean surface, which has less frictional weakening effect compared to the best observation. Overall, DA_len0.25 improves the forecasting of typhoon intensity more remarkably, indicating that the smaller horizontal length scale factor has a more obvious effect on improving the typhoon intensity forecast.

5. Conclusions and Discussion

For the purpose of examining the effect of the direct assimilation of radar radial velocity on the forecast of typhoon landfalls, this study used the WRF model and WRF-3DVAR system to conduct the cyclic assimilation and forecasting experiments of Typhoon Linfa in 2015. The assimilation increment, typhoon structure, track and intensity in the representative experiments were analyzed, and the main conclusions are as follows.
The background error covariance matrix obtained by the NMC method mainly reflects the characteristics of a large-scale error structure, and using the default horizontal length scale factor during the radar radial velocity data assimilation will unreasonably expand the influence range of the background error covariance matrix, which indicates that the optimization adjustment of the horizontal length scale factor is necessary. In this study, the results of the sensitivity experiments show that, a reduced horizontal length scale factor enables the effective assimilation of the micro- and meso-scale information in the assimilation of high-resolution radar data, and thus improves the typhoon forecasting.
Following the optimization adjustment of the horizontal length scale factor, the WRF-3DVAR system can successfully improve the wind field structure of the typhoon with more reasonable cyclonic wind field increments by assimilating quality-controlled radar data. The improvement of the dynamics and thermal structure in the typhoon inner core region can provide a better initial field for model forecasting.
The assimilation experiment with the optimization adjustment of the horizontal length scale factor also makes some improvements on typhoon track and intensity forecasting compared to the CTRL. The track error is reduced, the typhoon moving speed is comparable to the observation, the MSLP is reduced, the MSW is increased, the typhoon intensity is enhanced and the overall performance of DA_len0.25 is the best among the five sets of experiments.
This study mainly investigates the effects of different horizontal length scale factors on the radial velocity data assimilation. However, only one typhoon case and several sets of experiments are not enough to fully support the conclusions. Further experiments are needed to examine whether the conclusions are valid for other cases and weather systems. In addition, the same horizontal length scale factor is used for all control variables in each experiment. Further investigation is required to determine whether the configuration of the scale factors needs to be refined according to the characteristics of different control variables.

Author Contributions

Conceptualization, H.B. and F.S.; Methodology, H.B.; Software, J.M.; Validation, H.B. and F.S.; Formal analysis, H.B.; Investigation, J.M.; Resources, J.M.; Data curation, H.B.; Writing—original draft preparation, H.B.; Writing—review and editing, J.M. and F.S.; Visualization, H.B.; Supervision, J.M.; Project administration, J.M.; Funding acquisition, J.M. All authors have read and agreed to the published version of the manuscript.

Funding

This research was funded by a grant from the National Natural Science Foundation of China, grant number 42192553. Program of Shanghai Academic/Technology Research Leader (21XD1404500), the Shanghai Typhoon Research Foundation (TFJJ202107), Innovation and Development Projects of China Meteorological Administration (CXFZ2021Z033), Open Research Fund Project on Drought and Flood in Plateau and Basin of Sichuan Provincial Key Laboratory (SZKT202002), Natural Science Foundation of China (U2242212).

Institutional Review Board Statement

Not applicable.

Data Availability Statement

Not applicable.

Conflicts of Interest

The authors declare no conflict of interest.

References

  1. Meng, Z.; Zhang, F.; Luo, D.; Tan, Z.; Fang, J.; Sun, J.; Shen, X.; Zhang, Y.; Wang, S.; Han, W.; et al. Review of Chinese atmospheric science research over the past 70 years: Synoptic meteorology. Sci. China Earth Sci. 2019, 62, 1946–1991. [Google Scholar] [CrossRef]
  2. Song, L.; Shen, F.; Shao, C.; Shu, A.; Zhu, L. Impacts of 3DEnVar-Based FY-3D MWHS-2 Radiance Assimilation on Numerical Simulations of Landfalling Typhoon Ampil (2018). Remote Sens. 2022, 14, 6037. [Google Scholar] [CrossRef]
  3. Zhang, X.; Xu, D.; Liu, R.; Shen, F. Impacts of FY-4A AGRI Radiance Data Assimilation on the Forecast of the Super Typhoon “In-Fa” (2021). Remote Sens. 2022, 14, 4718. [Google Scholar] [CrossRef]
  4. Shu, A.; Shen, F.; Jiang, L.; Zhang, T.; Xu, D. Assimilation of Clear-sky FY-4A AGRI radiances within the WRFDA system for the prediction of a landfalling Typhoon Hagupit (2020). Atmos. Res. 2023, 283, 106556. [Google Scholar] [CrossRef]
  5. Schwartz, C.S.; Liu, Z.; Huang, X.-Y.; Kuo, Y.-H.; Fong, C.-T. Comparing Limited-Area 3DVAR and Hybrid Variational-Ensemble Data Assimilation Methods for Typhoon Track Forecasts: Sensitivity to Outer Loops and Vortex Relocation. Mon. Weather Rev. 2013, 141, 4350–4372. [Google Scholar] [CrossRef]
  6. Zhang, F.; Weng, Y. Predicting Hurricane Intensity and Associated Hazards: A Five-Year Real-Time Forecast Experiment with Assimilation of Airborne Doppler Radar Observations. Bull. Am. Meteorol. Soc. 2015, 96, 25–33. [Google Scholar] [CrossRef] [Green Version]
  7. Zhang, J.A.; Kalina, E.A.; Biswas, M.K.; Rogers, R.F.; Zhu, P.; Marks, F.D. A Review and Evaluation of Planetary Boundary Layer Parameterizations in Hurricane Weather Research and Forecasting Model Using Idealized Simulations and Observations. Atmosphere 2020, 11, 1091. [Google Scholar] [CrossRef]
  8. Shen, F.; Min, J.; Xu, D.; Dai, Z.; Zhang, B.; Chen, Y. Application of assimilating dual Doppler radar data in forecast of hurricane Ike. Haiyang Xuebao 2016, 38, 60–72. [Google Scholar] [CrossRef]
  9. Yang, C.; Min, J.; Liu, Z. The Impact of AMSR2 Radiance Data Assimilation on the Analysis and Forecast of Typhoon Son-Tinh. Chin. J. Atmos. Sci. 2017, 41, 372–384. [Google Scholar] [CrossRef]
  10. Qin, H.; Zheng, F.; Wu, L. The interaction between intensity and rainfall of Typhoon Rammasun (1409). J. Appl. Meteorol. Sci. 2022, 33, 477–488. [Google Scholar] [CrossRef]
  11. Snyder, C.; Zhang, F. Assimilation of Simulated Doppler Radar Observations with an Ensemble Kalman Filter. Mon. Weather Rev. 2003, 131, 1663–1677. [Google Scholar] [CrossRef] [Green Version]
  12. Montgomery, M.T.; Nicholls, M.E.; Cram, T.A.; Saunders, A.B. A Vortical Hot Tower Route to Tropical Cyclogenesis. J. Atmos. Sci. 2006, 63, 355–386. [Google Scholar] [CrossRef] [Green Version]
  13. Zhang, F.; Weng, Y.; Sippel, J.A.; Meng, Z.; Bishop, C.H. Cloud-Resolving Hurricane Initialization and Prediction through Assimilation of Doppler Radar Observations with an Ensemble Kalman Filter. Mon. Weather Rev. 2009, 137, 2105–2125. [Google Scholar] [CrossRef] [Green Version]
  14. Fovell, R.G.; Corbosiero, K.L.; Seifert, A.; Liou, K.-N. Impact of cloud-radiative processes on hurricane track. Geophys. Res. Lett. 2010, 37, L07808. [Google Scholar] [CrossRef] [Green Version]
  15. Xiao, Q.; Kuo, Y.-H.; Sun, J.; Lee, W.-C.; Barker, D.M.; Lim, E. An Approach of Radar Reflectivity Data Assimilation and Its Assessment with the Inland QPF of Typhoon Rusa (2002) at Landfall. J. Appl. Meteorol. Climatol. 2007, 46, 14–22. [Google Scholar] [CrossRef] [Green Version]
  16. Zhao, K.; Li, X.; Xue, M.; Jou, B.J.-D.; Lee, W.-C. Short-term forecasting through intermittent assimilation of data from Taiwan and mainland China coastal radars for Typhoon Meranti (2010) at landfall. J. Geophys. Res. Atmos. 2012, 117, D06108. [Google Scholar] [CrossRef] [Green Version]
  17. Li, X.; Zhao, K.; Wang, M.; Ming, J. Short-term forecasting of super typhoon Megi at landfall through cycling assimilation of China coastal radar data. J. Meteorol. Sci. 2013, 33, 255–263. [Google Scholar]
  18. Zhu, L.; Wan, Q.L.; Liu, L.K.; Shen, X.Y.; Gao, Y.D. Impacts of the Ensemble Assimilation of Radar Radial Velocity on the Intensity Evolution of Landfalling Typhoon Vicente (2012). J. Trop. Meteorol. 2017, 33, 345–356. [Google Scholar]
  19. Shen, F.; Xu, D.; Xue, M.; Min, J. A comparison between EDA-EnVar and ETKF-EnVar data assimilation techniques using radar observations at convective scales through a case study of Hurricane Ike (2008). Meteorol. Atmos. Phys. 2018, 130, 649–666. [Google Scholar] [CrossRef]
  20. Xiao, H.; Wan, Q.L.; Liu, X.T.; Chen, S.D.; Wang, H.; Zheng, T.F.; Feng, L.; Xia, F. The Impact of Radar Reflectivity on Numerical Forecast of Typhoon Hato (1713) Based on Wrf-Enkf System. J. Trop. Meteorol. 2019, 35, 433–445. [Google Scholar]
  21. Shen, F.; Min, J.; Xu, D. Assimilation of radar radial velocity data with the WRF Hybrid ETKF-3DVAR system for the prediction of Hurricane Ike (2008). Atmos. Res. 2016, 169, 127–138. [Google Scholar] [CrossRef]
  22. Xu, D.; Shen, F.; Min, J. Effect of background error tuning on assimilating radar radial velocity observations for the forecast of hurricane tracks and intensities. Meteorol. Appl. 2020, 27, e1820. [Google Scholar] [CrossRef] [Green Version]
  23. Shen, F.; Xue, M.; Min, J. A comparison of limited-area 3DVAR and ETKF-En3DVAR data assimilation using radar observations at convective scale for the prediction of Typhoon Saomai (2006). Meteorol. Appl. 2017, 24, 628–641. [Google Scholar] [CrossRef] [Green Version]
  24. Parrish, D.F.; Derber, J.C. The National Meteorological Center’s Spectral Statistical-Interpolation Analysis System. Mon. Weather Rev. 1992, 120, 1747–1763. [Google Scholar] [CrossRef]
  25. Shen, F.; Xu, D.; Min, J. Effect of momentum control variables on assimilating radar observations for the analysis and forecast for Typhoon Chanthu (2010). Atmos. Res. 2019, 230, 104622. [Google Scholar] [CrossRef]
  26. Shen, F.; Song, L.; Li, H.; He, Z.; Xu, D. Effects of different momentum control variables in radar data assimilation on the analysis and forecast of strong convective systems under the background of northeast cold vortex. Atmos. Res. 2022, 280, 106415. [Google Scholar] [CrossRef]
  27. Helmus, J.J.; Collis, S.M. The Python ARM Radar Toolkit (Py-ART), a Library for Working with Weather Radar Data in the Python Programming Language. J. Open Res. Softw. 2016, 4, e25. [Google Scholar] [CrossRef] [Green Version]
  28. Hong, S.Y.; Lim, J.-O.J. The WRF Single-Moment 6-Class Microphysics Scheme (WSM6). Asia-Pac. J. Atmos. Sci. 2006, 42, 129–151. [Google Scholar]
  29. Iacono, M.J.; Delamere, J.S.; Mlawer, E.J.; Shephard, M.W.; Clough, S.A.; Collins, W.D. Radiative forcing by long-lived greenhouse gases: Calculations with the AER radiative transfer models. J. Geophys. Res. Atmos. 2008, 113, D13103. [Google Scholar] [CrossRef]
  30. Zhang, D.; Anthes, R.A. A High-Resolution Model of the Planetary Boundary Layer—Sensitivity Tests and Comparisons with SESAME-79 Data. J. Appl. Meteorol. Climatol. 1982, 21, 1594–1609. [Google Scholar] [CrossRef]
  31. Tewari, M.; Chen, F.; Wang, W.; Dudhia, J.; LeMone, M.A.; Mitchell, K.; Ek, M.; Gayno, G.; Wegiel, J.; Cuenca, R.H. Implementation and Verification of the Unified Noah Land Surface Model in the WRF Model (Conference Paper); NCAR Mesa Laboratory: Boulder, CO, USA; Environmental Modeling Center (EMC): Camp Springs, MD, USA; Air Force Weather Agency: Offutt AFB, NE, USA, 2004; pp. 2165–2170. [Google Scholar]
  32. Hong, S.Y.; Noh, Y.; Dudhia, J. A New Vertical Diffusion Package with an Explicit Treatment of Entrainment Processes. Mon. Weather Rev. 2006, 134, 2318–2341. [Google Scholar] [CrossRef] [Green Version]
  33. Zhang, C.; Wang, Y.; Hamilton, K. Improved Representation of Boundary Layer Clouds over the Southeast Pacific in ARW-WRF Using a Modified Tiedtke Cumulus Parameterization Scheme. Mon. Weather Rev. 2011, 139, 3489–3513. [Google Scholar] [CrossRef] [Green Version]
Figure 1. Comparison of the radial velocity (unit: m s−1) from the Shantou Doppler radar (STRD) (a) before and (b) after the quality control at 1800 UTC on 8 July 2015.
Atmosphere 14 00582 g001
Figure 2. The weather research and forecasting (WRF) model domains with the China Meteorological Administration’s (CMA) best tracking of Typhoon Linfa from 0000 UTC on July 5 to 1800 UTC on 9 July 2015. The location of the STRD is indicated by asterisks. The maximum detection range of the STRD is circled at 230 km. Tropical cyclones are distinguished by their color: tropical depression (TD), tropical storm (TS), severe tropical storm (STS), typhoon (TY), and severe typhoon (STY). The shading indicates the terrain height (unit: m).
Atmosphere 14 00582 g002
Figure 3. Flow chart of the experiments.
Atmosphere 14 00582 g003
Figure 4. 500 hPa geopotential height (solid blue line, unit: dagpm), wind field (wind bar, long line = 4 m s−1, short line = 2 m s−1, wind triangle = 20 m s−1) and isotherm (red line, unit: °C) at (a) 1200 UTC on 8 July and (b) 0000 UTC on 9 July 2015.
Atmosphere 14 00582 g004
Figure 5. 700 hPa wind speed (shaded, unit: m s−1) and wind vector (arrow, reference vector = 20 m s−1) of the (a) CTRL, (b) DA_len1.0 and (c) DA_len0.25 experiments at 1800 UTC on 8 July 2015.
Atmosphere 14 00582 g005
Figure 6. The analysis increments of the wind speed (shaded, unit: m s−1) and wind vector (arrow, reference vector = 20 m s−1) at 700 hPa of (a) DA_len1.0 and (b) DA_len0.25 at 1800 UTC on 8 July 2015. The observed typhoon center (red asterisk) is also indicated.
Atmosphere 14 00582 g006
Figure 7. Root mean square errors (unit: m s−1) of the radial wind speed between DA_len1.0 (red), DA_len0.25 (blue) and the observation during the cyclic assimilation.
Atmosphere 14 00582 g007
Figure 8. Sea-level pressure field (black contour), 10-m wind speed (shaded, unit: m s−1) and wind vector (arrow, reference vector = 20 m s−1) of the (a) CTRL, (b) DA_len1.0 and (c) DA_len0.25 experiments at 0000 UTC on 9 July 2015.
Atmosphere 14 00582 g008
Figure 9. Vertical profiles of the horizontal wind speed (shaded, unit: m s−1) and potential temperature (black contours, unit: K) in the (a) CTRL, (b) DA_len1.0 and (c) DA_len0.25 experiments at 0000 UTC on 9 July 2015.
Atmosphere 14 00582 g009
Figure 10. Azimuthally averaged tangential wind speed (unit: m s−1) of the (a) CTRL, (b) DA_len1.0 and (c) DA_len0.25 experiments at 0000 UTC on 9 July 2015.
Atmosphere 14 00582 g010
Figure 11. (a) Forecast tracks in the three experiments and the CMA’s best track; (b) track errors (unit: km) of the three experiments compared to the CMA’s best track during the forecast period.
Atmosphere 14 00582 g011
Figure 12. (a) Minimum sea-level pressure (unit: mb) and (b) maximum surface wind speed (unit: m s−1) given by the three sets of experiments and the CMA observations.
Atmosphere 14 00582 g012
Table 1. Experimental schemes.
NumberNameSchemes
1CTRLNo data assimilation
2DA_len1.0radial velocity assimilation with len_scaling = 1.0
3DA_len0.75radial velocity assimilation with len_scaling = 0.75
4DA_len0.5radial velocity assimilation with len_scaling = 0.5
5DA_len0.25radial velocity assimilation with len_scaling = 0.25
Disclaimer/Publisher’s Note: The statements, opinions and data contained in all publications are solely those of the individual author(s) and contributor(s) and not of MDPI and/or the editor(s). MDPI and/or the editor(s) disclaim responsibility for any injury to people or property resulting from any ideas, methods, instructions or products referred to in the content.

