Communication

Association between the Rail Breakage Frequency in Beijing–Tianjin–Hebei High-Speed Railway and the Eurasian Atmospheric Circulation Anomaly

1
Key Laboratory of Meteorological Disaster, Ministry of Education (KLME)/Joint International Research Laboratory of Climate and Environment Change (ILCEC)/Collaborative Innovation Center on Forecast and Evaluation of Meteorological Disasters (CIC-FEMD), Nanjing University of Information Science & Technology, Nanjing 210044, China
2
Beijing Regional Climate Center, Beijing 100089, China
3
College of Meteorology and Oceanography, National University of Defense Technology, Changsha 410003, China
4
College of Atmosphere and Remote Sensing, Wuxi University, Wuxi 214105, China
*
Author to whom correspondence should be addressed.
Atmosphere 2023, 14(3), 561; https://doi.org/10.3390/atmos14030561
Submission received: 14 December 2022 / Revised: 28 February 2023 / Accepted: 11 March 2023 / Published: 15 March 2023
(This article belongs to the Special Issue Advances in Transportation Meteorology)

Abstract

:
The spatiotemporal variations in the frequency of rail breakage (FRB) in the high-speed railway of the Beijing–Tianjin–Hebei (BTH) region and its relationship with atmospheric circulation anomalies and surface temperature are analyzed in this study, based on the monthly FRB data of BTH region and the ERA5 reanalysis data from 2010 to 2020. The frequency of rail breaking in the BTH region varies significantly depending on the season, with winter having the highest incidence. In fact, more than 60% of the total FRB in the BTH region occur during the winter season. Both the annual total and winter FRB in BTH region are very unevenly distributed in time and space, and both are relatively similar in spatial distribution patterns. The FRB in Beijing railway section is the most frequent, followed by Tianjin, and the lowest frequency is observed in Chengde. It is found that the increasing winter FRB in BTH region and the intensified Siberian high are related. When the Siberian high is strong, the East Asian winter monsoon and the East Asian Trough in the middle troposphere could be enhanced through atmospheric teleconnection, which is conducive to the cold air advection from northern high latitudes to the BTH region, resulting in an abnormally cold winter in BTH region, thus providing low temperatures for broken rails on high-speed railways, and vice versa. The research results might provide a scientific basis for monitoring and predicting the broken rails in BTH high-speed railway during winter, thereby providing a guarantee for the safe operation of the high-speed railway.

1. Introduction

The Beijing–Tianjin–Hebei (BTH) region is China’s capital economic circle, which includes the capital city of China, Beijing, and the municipality of Tianjin, and is densely populated. High-speed railway plays an important role in the coordinated development of the Beijing–Tianjin–Hebei region. For example, the Beijing-Zhangjiakou high-speed railway provided a strong foundation for the transportation service guarantee of the 2022 Beijing Winter Olympics.
Railway transportation has become the main mode of modern transportation due to its advantages of low climate impact, strong transportation capacity, and energy saving [1]. In recent years, China’s economy has been booming, and with the implementation of “the Belt and Road initiative”, the construction of public infrastructure has played a significant role in rapid economic development, and railway development is one of the top priorities [2].
Railways with a speed of 250 km/h or more are called high-speed railways [3]. At present, high-speed railway has become one of the main ways to travel in China, so the safety of high-speed railway is related to the safety of passengers’ lives and property. The rails are exposed to the open air for a long time and are prone to break under the repeatedly exerted axle loads [4]. Broken rail accidents have always been a serious hazard to a train’s operation safety, even causing train derailing and overturning, bringing a large number of casualties and property damage.
Generally speaking, the fracture of rail is directly related to the internal defects. Some of these defects are formed in the process of rail production, such as micro-cracks formed in the steel rolling [5]; some are produced during the installation and connection of rails, such as cracks generated during welding and cooling [6]. During the use of steel rails, the initial crack expands under the dynamic load of the train until fracture occurs, especially at low temperatures when the possibility of fracture increases greatly [6]. The main reason is the large seasonal temperature difference. The locked rail temperature is high in track laying construction, when the stress desperation is higher than the locked temperature due to high temperature, whereas winter cooling increases the tensile stress of track temperature. Moreover, there are stress peaks during cooling process, and thus rails cannot withstand the temperature pull generated by cooling, leading to their breakage.
For example, in the early morning of 19 December 2004, the rails at the Fata Temple crossing in Beijing were frozen and cracked, causing 10 trains to be delayed. The main reason for the rail freezing and cracking this time is that the temperature difference between day and night on the 18th is too large. Coupled with the sleet during the day, the rain on the rails freezes after a sudden drop in temperature at night, causing the rails to freeze and crack.
There are many factors influencing winter temperature anomalies in the BTH region. The East Asian winter monsoon, for instance, has a significant impact on temperature anomalies in BTH region [7,8]. The Arctic Oscillation (AO) is one of the major teleconnection patterns in the northern hemisphere [9,10]. AO is characterized by the phenomenon of a zonal band-like seesaw structure in the sea level pressure field at northern mid- and high latitudes. AO can affect winter temperature anomalies in North China by regulating atmospheric circulation [11]. The Eurasian telecorrelation [12] is an important telecorrelation pattern in the Northern Hemisphere winter, and the Eurasian telecorrelation pattern is negatively correlated with winter temperature anomalies in the BTH region [13]. Ural blocking activity in the Urals can also influence winter temperature anomalies in the BTH by modulating atmospheric circulation anomalies in Eurasia [14,15]. There is also a link between the circumglobal teleconnection [16] and winter temperature anomalies in eastern China [17].
The Siberian high also plays an important role in winter temperature anomalies in Eurasia [18,19,20]. Could the Siberian high influence the winter temperature anomalies in the BTH region, thereby affecting the frequency of rail breakage (FRB) in high-speed railway? To clarify this problem might provide scientific basis for monitoring and predicting the frequency of broken rails and guarantee the safe operation of high-speed railway in the BTH region.

2. Data and Methods

The monthly FRB in high-speed railway of BTH region from 2010 to 2020 is used in present study. In order to reveal the relationship between the FRB and atmospheric circulation anomalies affecting the BTH region in winter, the monthly ERA5 reanalysis data from the European Centre for Medium-Range Forecasting (ECMWF) with a horizontal resolution of 1.25° × 1.25° for 2010–2020 are also selected, including surface pressure, 2 m air temperature, and isobaric wind and geopotential height fields with a vertical resolution of 25 hPa at 1000–100 hPa [21]. CN05.1 average temperature data [22] are also utilized. The winter season referred to in this article is from November to February of the following year.
Considering the limited the length of monthly FRB data in BTH region, referring to the method applied by Huo et al. [23], November, December, January, and February are all regarded as different samples instead of adopting seasonal average. In this way, there are 40 months in a total of 10 winters from 2010 to 2020, and a relatively long time series can be constructed. Pearson correlation analysis, linear regression methods, and Student’s t test are adopted in the statistical analysis of this work.

3. Spatio-Temporal Variability of FRB in BTH Region during Winter

The spatial distribution of FRB in BTH high-speed railway from 2010 to 2020 (Figure 1a) shows that the FRB is very unevenly distributed. The maximum of rail breaking occurs 51 times in Beijing, and the second maximum occurs 20 times in Tianjin. The minimum of rail breaking is only once in Chengde, and the sub-minimum is five times in Baoding. In addition to the uneven spatial distribution, there are significant seasonal differences in the FRB of the BTH region. From the time series of monthly FRB in BTH region (Figure 1b), it can be found that the rail breakage of high-speed railway mostly occurs in winter, and the FRB in each month of winter exceeds 20. The FRB in spring (March, April, and May) and autumn (September and October) is second. Except for the FRB in September of 4, the FRB in other months is between 5 and 10. The lowest FRB occurs in summer (June, July, and August). During the 11-year period from 2010 to 2020, the FRB in summer is only 5, including 2 in June, 1 in July, and 2 in August.
Since winter is the season with the highest FRB in BTH high-speed railway. The average FRB during winter is obtained to further analyze its spatial and temporal distribution pattern. The spatial distribution of winter FRB in BTH region is also very uneven (Figure 2a), with the maximum and sub-maximum values still occurring in Beijing and Tianjin with 32 and 16 breaks, respectively, while the minimum and sub-minimum values are still located in Chengde and Baoding with one and two breakages, respectively.
In the BTH region, the percentage of FRB in winter accounts for more than 60% of the total annual FRB (Figure 2b). In Chengde and Baoding, the percentages of winter FRB accounts for 100% of the total FRB, i.e., the rail breaks in these two areas all occur in winter. The winter FRB in Qinhuangdao and Hengshui both exceeds 90% of the total FRB. The percentages of the winter FRB in Beijing and Tianjin are 63% and 80% of the total frequency, respectively. The average temperature in the BTH region during 2010–2020 is less than 0 °C in December, January, and February, except for 3.1 °C in November, which might be the reason for the higher FRB in winter.
The interannual variation in the winter FRB of BTH region is also great (Figure 2c). The winter of 2011/2012 has the highest FRB, with 15, accounting for 17% of the total. The FRB in winter of 2015/2016 and 2016/2017 is the least, with two rail breaks in both years, each accounting for 2% of the total rail breakage, respectively. The FRB also varies considerably in the remaining years.

4. Relationship between the FRB in BTH Region and the Siberian High Anomaly

In order to reveal the influencing factors of the winter FRB in BTH region, the spatial distribution of correlation coefficient between the FRB and the surface air pressure was calculated (Figure 3a). It can be found that there is a significant positive correlation between the winter FRB in BTH region and the surface pressure in the region (44–53° N, 60–95° E) adjacent to Balkhash Lake, where the significantly correlated region is located in the southern part of the West Siberian Plain, indicating that the winter FRB in BTH region is closely related to the Siberian high anomaly. Indeed, there are some differences between the above-mentioned significantly correlated region and the region selected for the Siberian high intensity index defined by previous studies [24]. Therefore, the average surface pressure in the region [44–53° N, 60–95° E] is defined as the index of Siberian high (ISH) in present study. The correlation coefficient between the ISH and the FRB is calculated to be 0.46, which can pass the 95% significance test. In other words, when the Siberian high strengthens, the winter FRB in BTH high-speed rail increases, and vice versa. It is also noted that there is a certain positive correlation between the winter FRB in BTH region and the surface air pressure in Mongolia Plateau, Hetao region, and the middle and lower reaches of the Yangtze River.
The winter spatial distribution of correlation coefficients between ISH and 2 m temperature (as shown in Figure 3b) reveals that 2 m temperatures in the Siberian Plain, Mongolian Plateau, and most regions of China, except the Tibetan Plateau, are significantly and negatively correlated with the ISH. In other words, when the Siberian high is strong (weak), temperatures in the aforementioned regions become abnormally low (high). Consequently, a strengthened Siberian high causes winter temperatures in the BTH region to drop abnormally, resulting in external temperature conditions that are favorable for the occurrence of rail breakage. The spatial distribution of correlation coefficients between CN05.1 surface temperature observations and ISH in the Chinese region is consistent with the reanalysis data (Figure is omitted).
To elucidate how the Siberian high affects the FRB in BTH high-speed railway, the potential height and wind fields are regressed using the ISH (Figure 4). It can be seen that that when the Siberian high anomaly is positive, significant positive potential height anomalies and anomalous anticyclonic circulation are observed over the Siberian plain in the lower (Figure 4a), middle (Figure 4b) and upper troposphere (Figure 4c). On the contrary, negative potential height anomalies and anomalous cyclonic circulation are found over the northeastern Asian region. The above anomalous circulation shows a “seesaw oscillation” in the geopotential anomaly field over the Siberian plain and northeastern Asia. Note that the northwest-southeast tilting dipole in 500 hPa potential height anomaly is similar to that of the Eurasian-Pacific (EUP) teleconnection [12] over Asian continental and Pacific regions. During the positive phase of EUP teleconnection, the equivalent barotropic Rossby wave can be transmitted from Europe along the great circle route into Asia-Pacific region [25], and enhance the Siberian high and the East Asian winter monsoon [26,27] (Takaya and Nakamura, 2005; Maeda et al., 2021). Our results also indicate that when the Siberian high is anomalously strong, on the one hand, anomalous northwesterly winds exist at the middle and high latitudes and anomalous northeasterly winds at low latitudes over East Asia in the lower troposphere (Figure 4a), which could enhance the East Asian winter monsoon [7,8]. On the other hand, the negative anomalies of potential height and anomalous cyclonic circulation in the middle troposphere of Northeast Asia (Figure 4b) strengthen the East Asian trough, thus favoring the cold air advection into BTH region from northern high latitudes. The regressed whole-layer integrated temperature advection field by ISH (Figure 5) shows that when the Siberian high is strong, cold air advection exists in the Siberian plain and the Northeast Asian region including the BTH region. The above reasons together lead to the abnormally low temperature in the BTH region, which provides favorable conditions for the occurrence of broken rails.

5. Discussion and Conclusions

Based on monthly TBF data of high-speed railway in BTH region from 2010 to 2020 and ERA5 atmospheric reanalysis data, the spatiotemporal variations of the winter FRB in BTH region and its relationship with Siberian high anomaly are analyzed. The main conclusions are as follows:
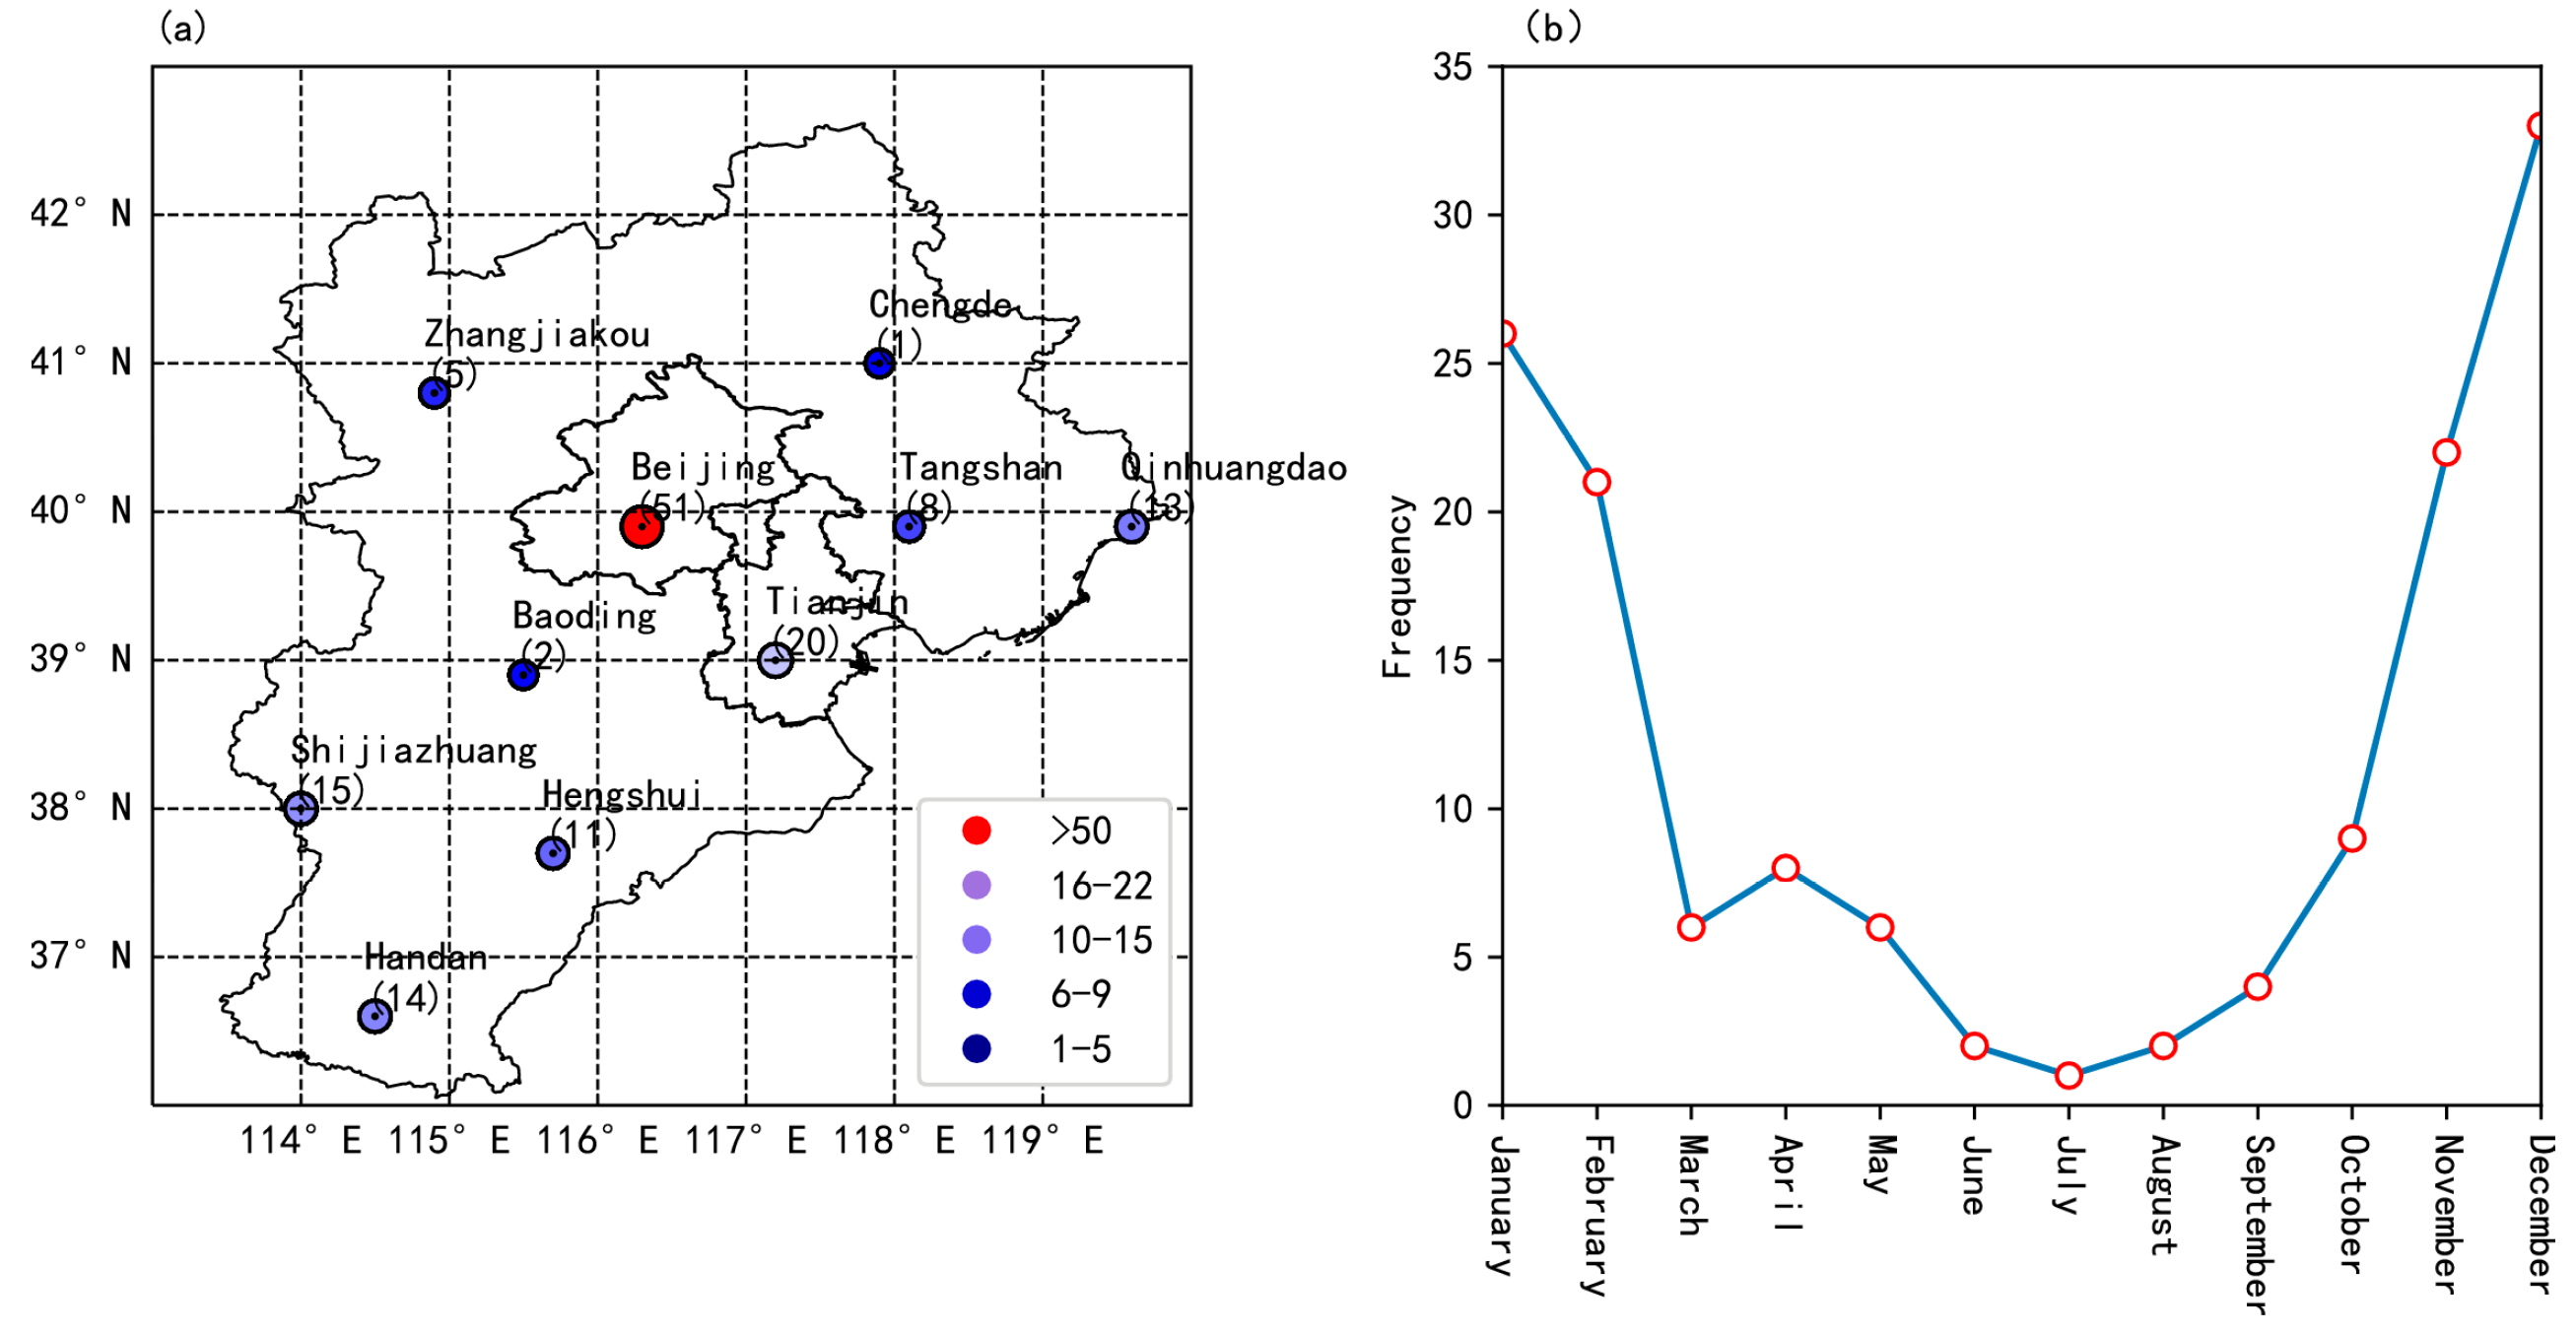
  • The spatial and temporal distribution of the total FRB in BTH is very uneven. The maximum FRB in Beijing is 51, and the minimum FRB in Chengde is 1. There are obvious seasonal differences in FRB, with the most frequent rail breaks in winter, followed by spring and autumn, and the least in summer.
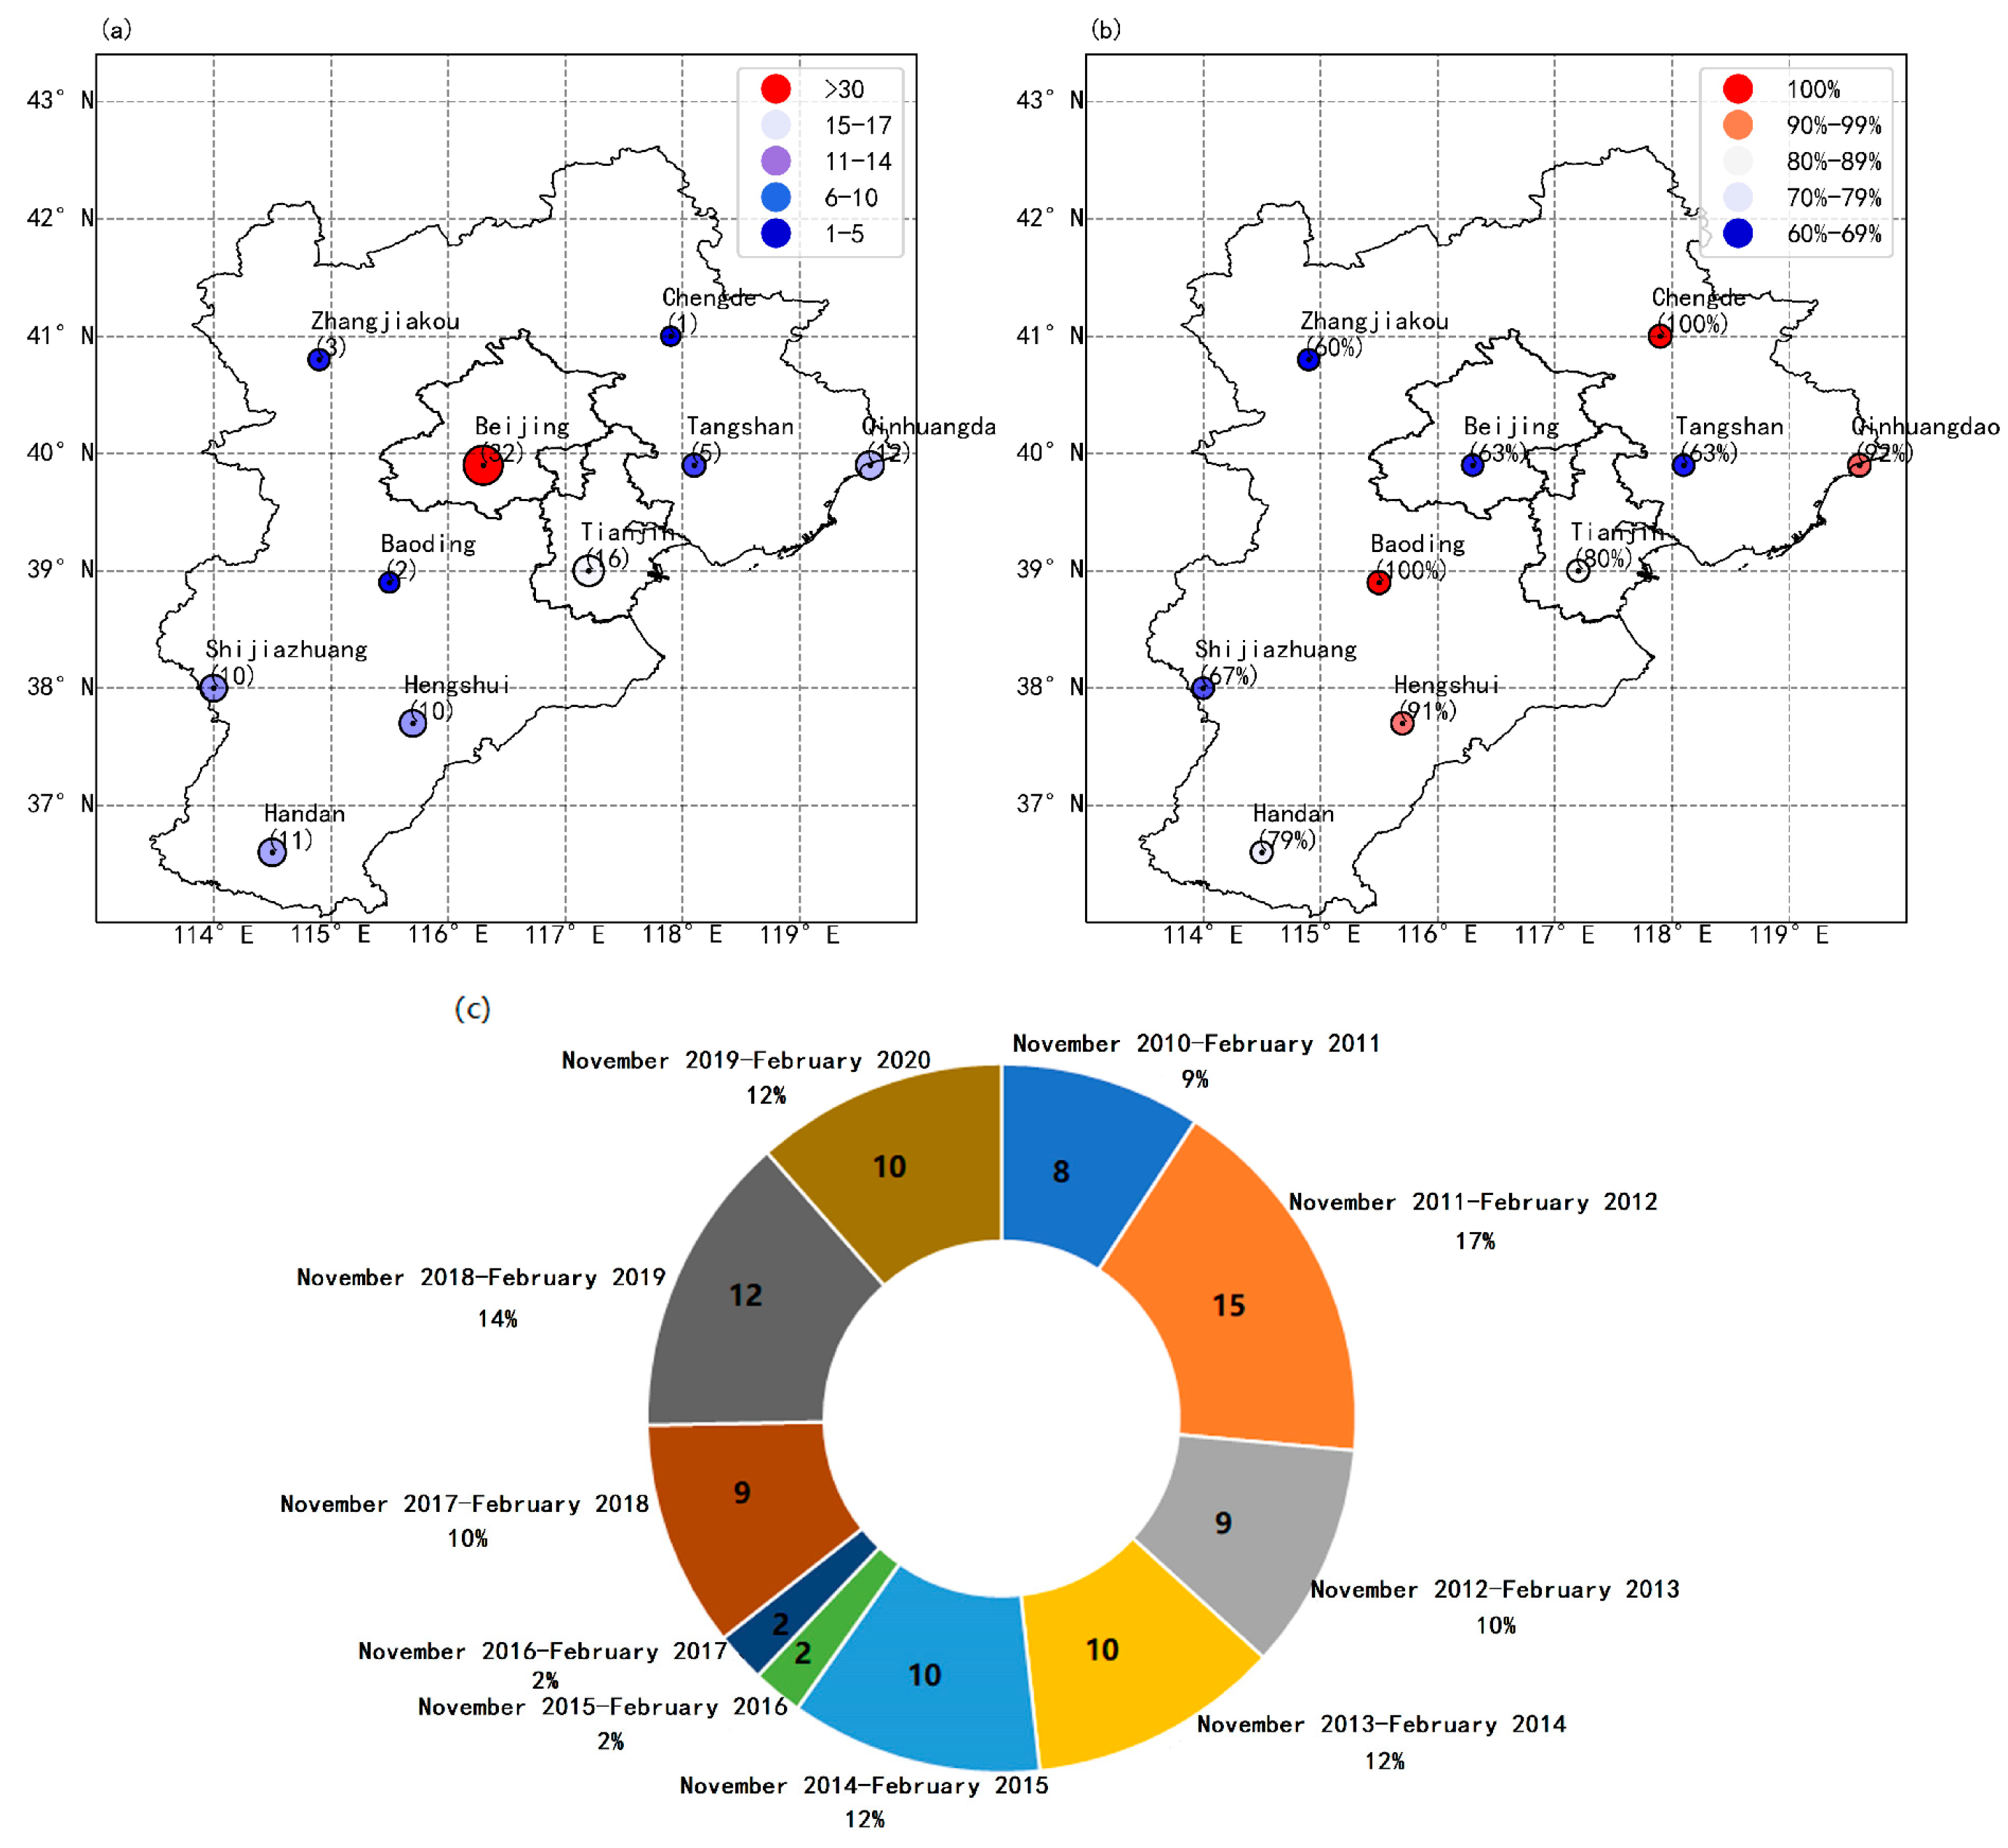
  • The spatial and temporal variability in winter FRB of BTH region is also obvious, and its spatial distribution is similar to that of the annual total FRB. The highest and lowest winter FRB are located in Beijing and Chengde respectively, with 32 and 1 broken rails respectively. The percentage of winter FRB in all regions exceeds 60% of the total annual FRB, and some regions, such as Baoding and Chengde, have 100% of the total FRB in winter. There is also a very obvious interannual variation in the winter FRB.
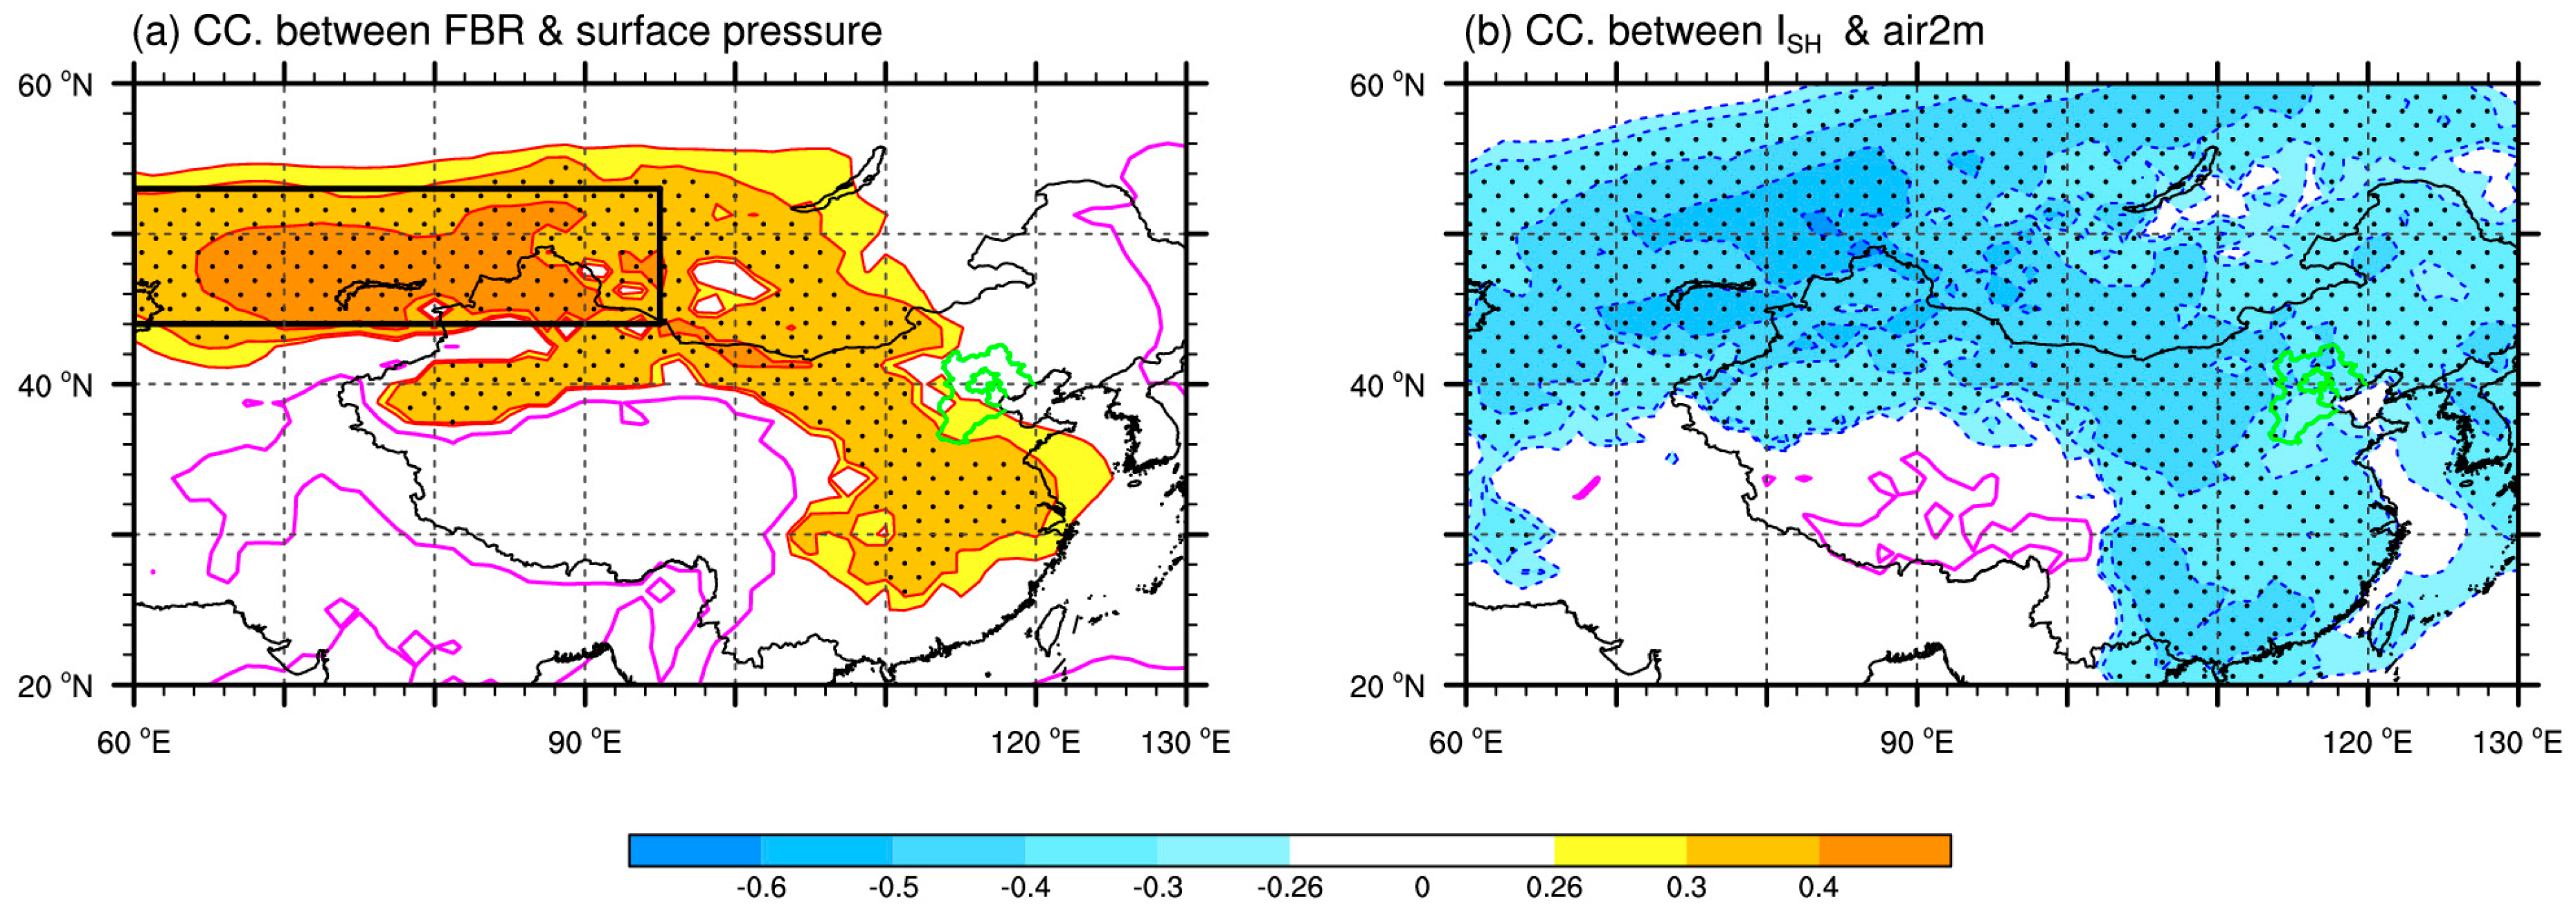
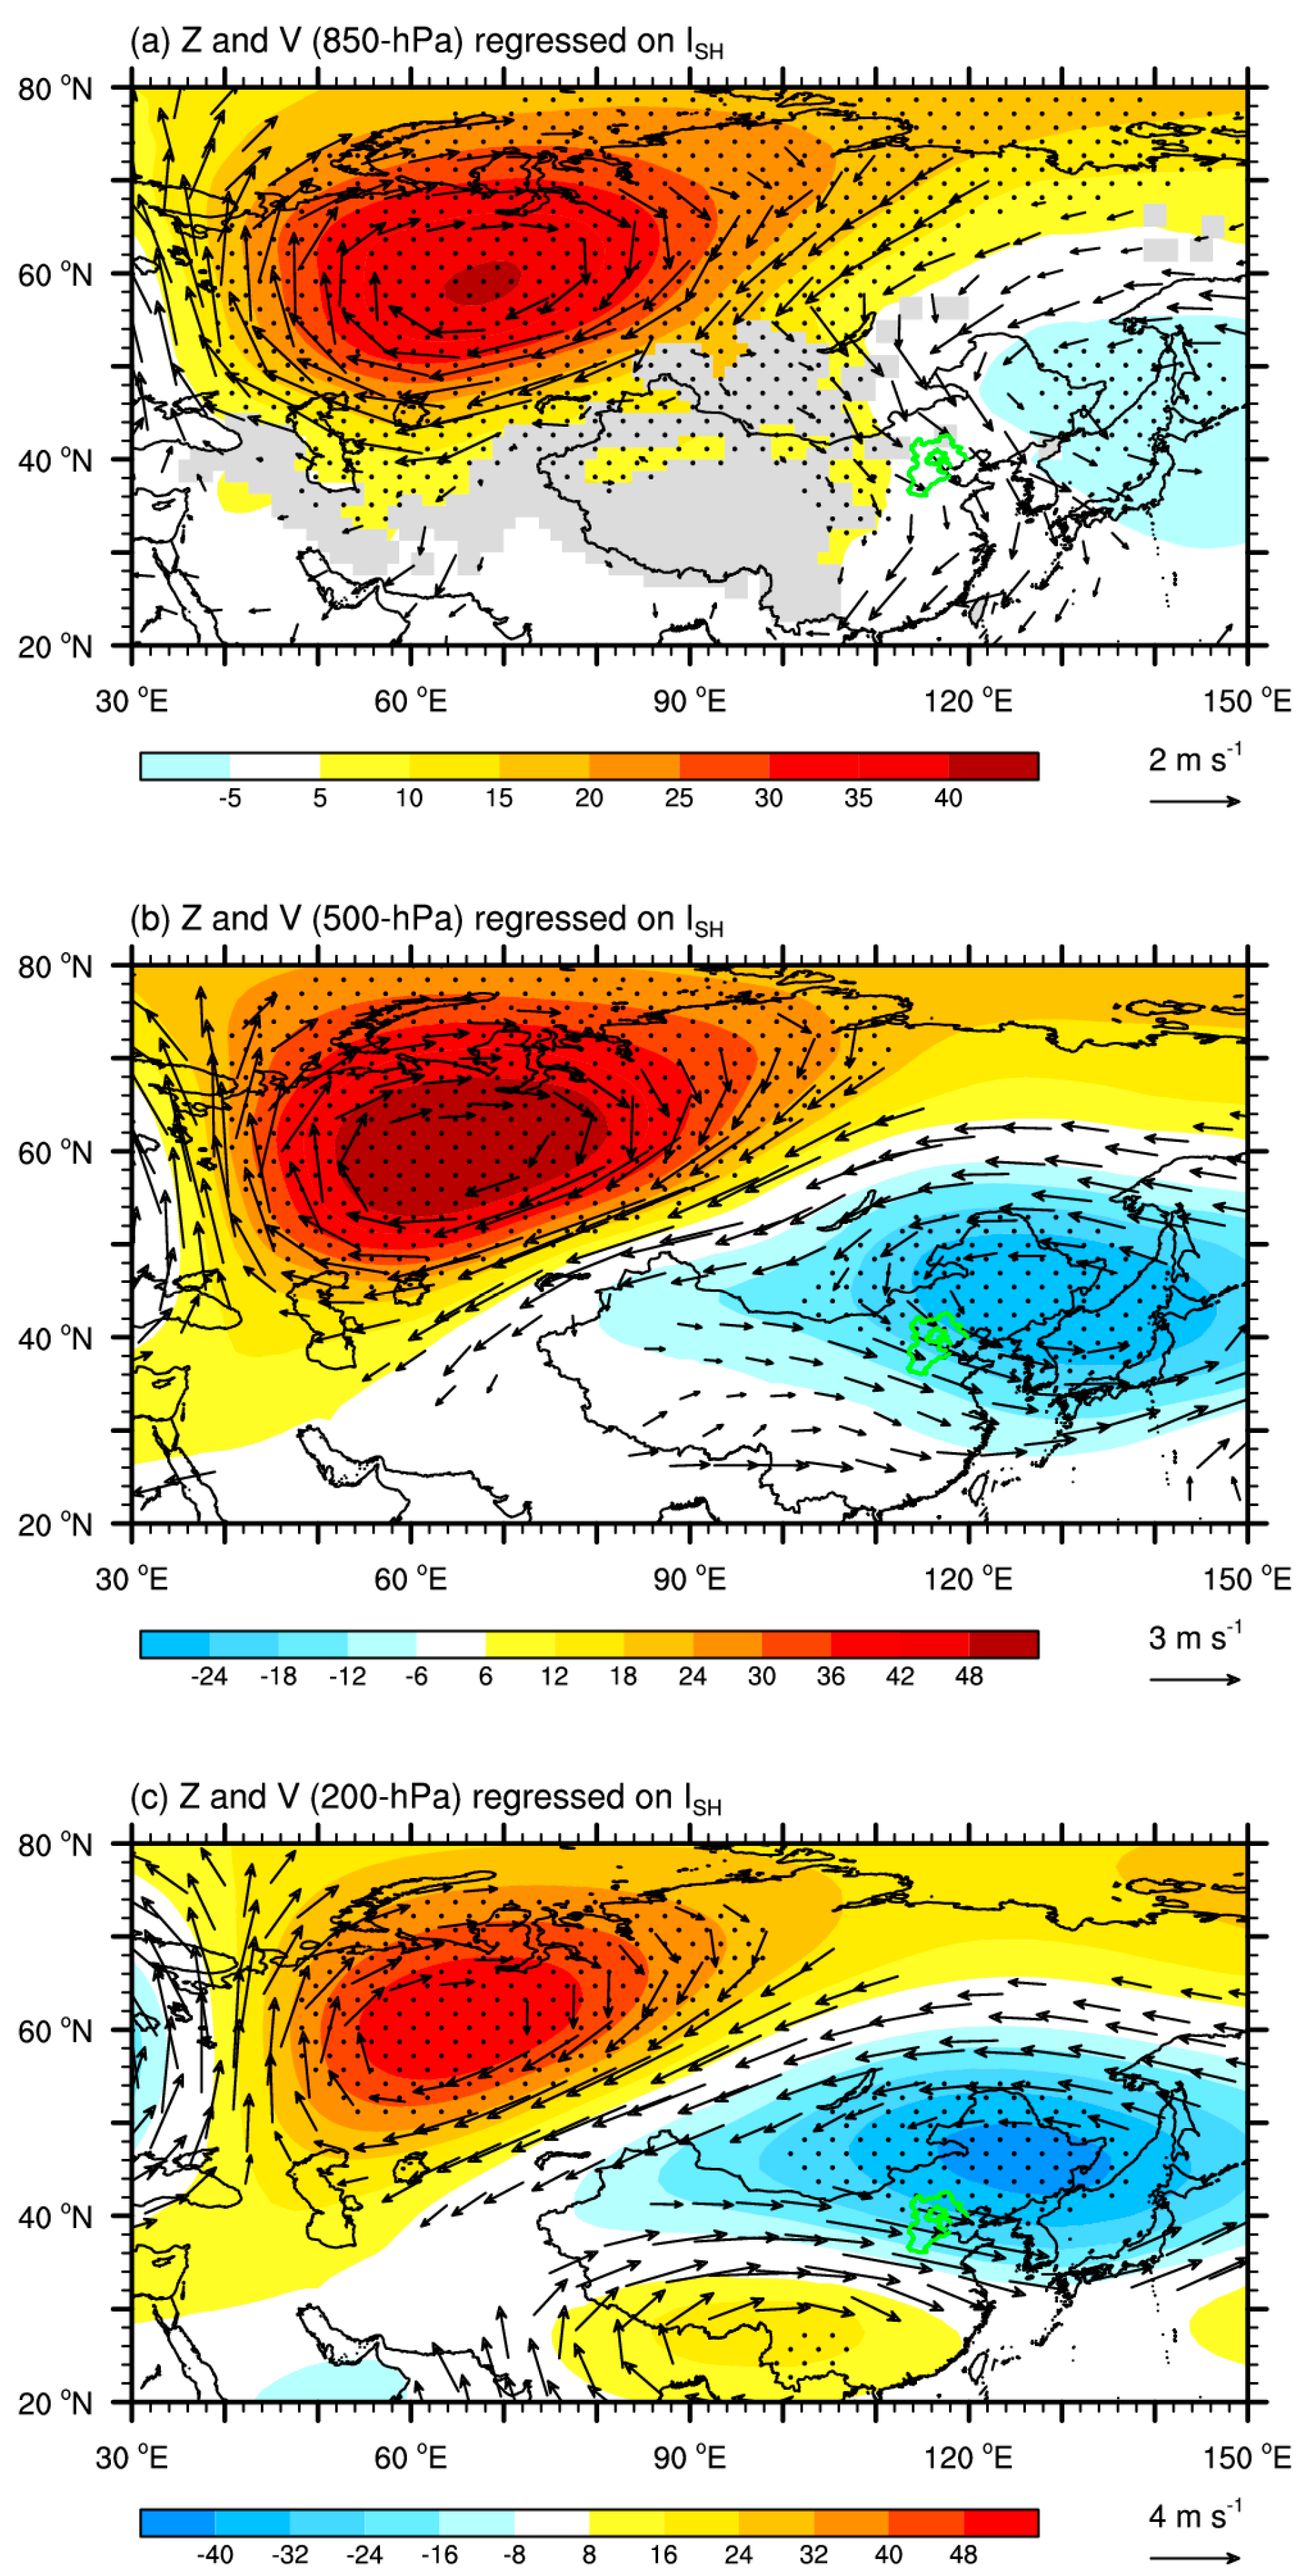
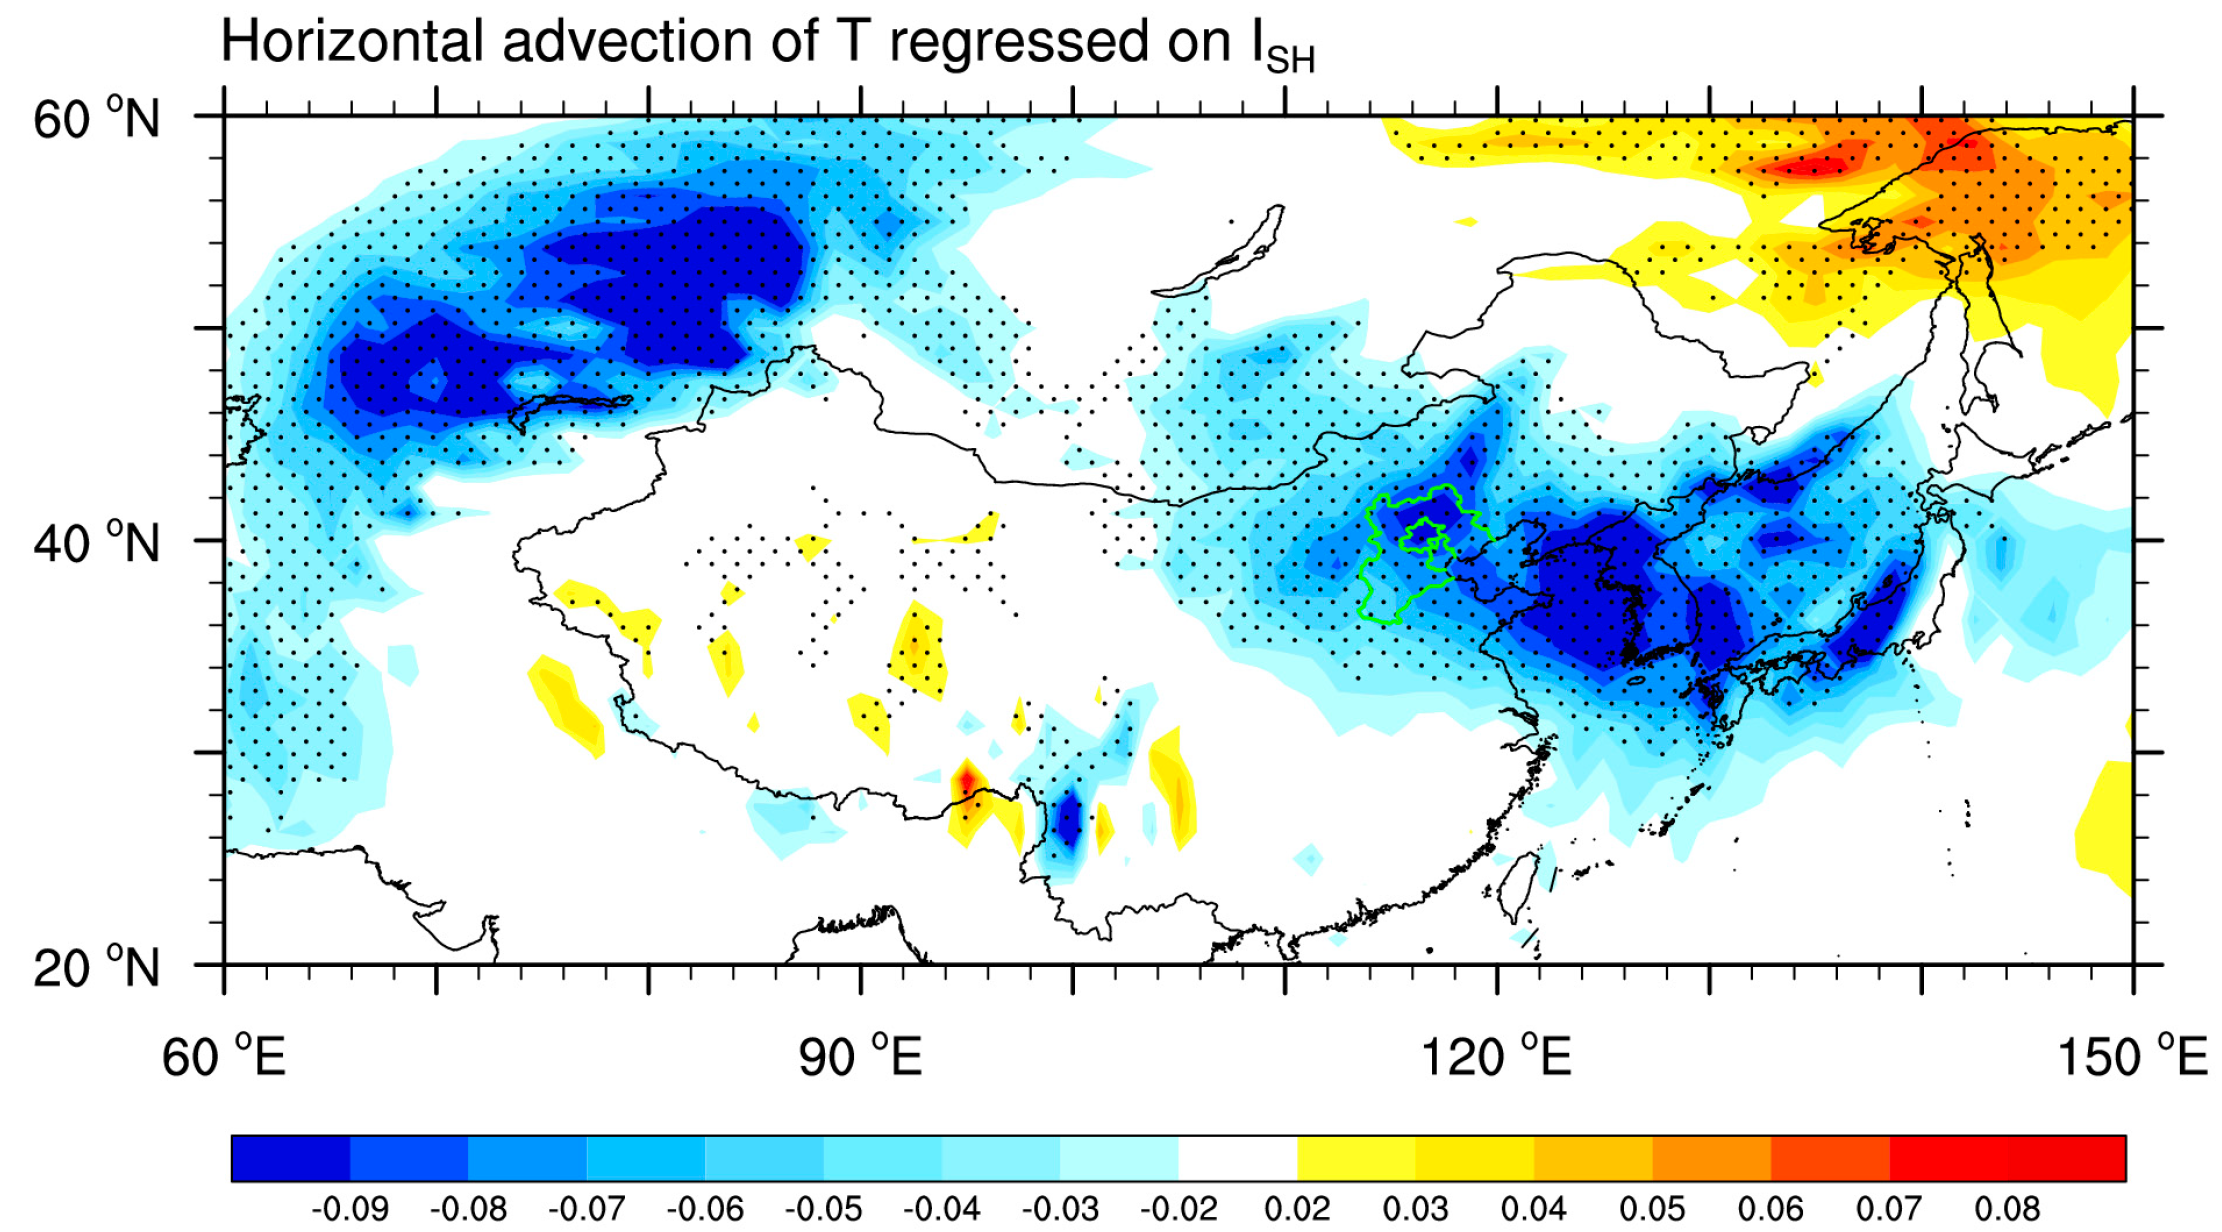
  • A significant positive correlation between the winter FRB in BTH region and the Siberian high is found. When the Siberian high is strong, it is accompanied by positive potential height anomalies and anomalous anticyclonic circulation over the Siberian region, as well as negative potential height anomalies and anomalous cyclonic circulation over the northeastern Asian region. These circulation anomalies show an equivalent barotropic feature in the vertical direction and produce the anomalous northwesterly prevailing over BTH region in the lower troposphere, enhance the East Asia winter monsoon, and deepen East Asian trough in the middle troposphere. All the above circulation anomalies are conducive to the cold air advection from high latitudes to BTH region, causing winter cooling in the BTH region, thus providing low temperatures for rail breakage.
It should be pointed out that this study is limited to the length of FRB data, with the period of 2010–2020. Therefore, it is necessary to analyze the relationship between Siberian high and winter temperature anomaly in BTH region using longer data records, and to clarify the dynamic and thermodynamic mechanisms. Using the meteorological element fields under different future shared socio-economic paths [28] proposed by phase 6 of the Coupled Model Intercomparison Project (CMIP6), the future winter temperatures in BTH region in the context of high and medium forcing scenarios could be predicted, which can provide a background field of meteorological elements for the prediction of future FRB in BTH high-speed railway. In the future, how will the intensity of Siberian high change under different shared socio-economic paths? Will the change of Siberian high intensity cause the winter temperature variations in BTH region? These are also questions worth studying. The FRB is influenced by a number of factors beyond meteorological conditions, such as the sum of track length in a given subregion, age and hardness of the rails, maximum vehicle axle load, total load on the rail line [29], the occurrence of subgrade vibration isolation, type of superstructure [30], objects, such as bridges and tunnels, the value of the neutral temperature assumed in the continuous weld rail (CWR) design, and that actually prevailing during rail jointing [31]. It is also important to investigate the impact of the above factors on FRB in the BTH region. The length of the railway railroads in individual cities of BTH region is uneven. It would be an interesting question to study the temporal variation of FRB in individual cities of the BTH region and their linkage with meteorological factors if more detailed data on high-speed railroads data could be obtained.
In addition, monthly averaged rail breakage data are used in this study. However, it is also important to use the day-by-day rail breakage data to analyze the features of temperature and daily difference of temperature on the day when the rail breakage occurred and to explore the related atmospheric circulation anomaly, so as to provide a scientific basis for predicting the meteorological background of FRB in BTH high-speed railway. These issues will be further studied in the future.

Author Contributions

L.H., J.W. and D.J. conceived and designed the study. L.X. prepared Figure 1 and Figure 2, and D.J. prepared Figure 3, Figure 4 and Figure 5. L.H. and L.X. wrote the early draft. L.H., J.W., D.J., Y.S. and Q.Z. contributed to writing the manuscript. All authors have read and agreed to the published version of the manuscript.

Funding

This work is jointly supported by the National Natural Science Foundation of China (Grants 42030605, 42005016), and the Natural Science Fundamental Research Project of Jiangsu Colleges and Universities (19KJB170024).

Institutional Review Board Statement

Not applicable.

Informed Consent Statement

Not applicable.

Data Availability Statement

The monthly ERA5 reanalysis data is provided by the European Centre for Medium-Range Forecasting (ECMWF) from their website at https://cds.climate.copernicus.eu/#!/search?text=ERA5&type=dataset on 23 March 2021. The monthly FRB in high-speed railway of BTH region could be obtained through the corresponding author for reasonable request.

Conflicts of Interest

The authors declare no competing interest.

References

  1. Wang, Y.; Li, K.; Xu, X.; Zhang, Y. Transport energy consumption and saving in China. Renew. Sustain. Energy Rev. 2014, 29, 641–655. [Google Scholar] [CrossRef]
  2. Li, X.; Yan, J. Research on the Development of Railway Industry in China and the Correlation between Railway and National Economy Based on Input-Output Analysis; Beijing Jiaotong University: Beijing, China, 2016; pp. 1–3. [Google Scholar]
  3. Zhao, H.; Liang, J.; Liu, C. High-Speed EMUs: Characteristics of technological development and trends. Engineering 2020, 6, 234–244. [Google Scholar] [CrossRef]
  4. Xiao, Q.; Zheng, J.; Liu, J.; Fang, J. Analysis of the wheel/rail rolling contact fatigue of a high-speed train under the transient mechanism. J. Mech. Sci. Technol. 2017, 31, 2235–2242. [Google Scholar] [CrossRef]
  5. Magel, E.; Mutton, P.; Ekberg, A.; Kapoor, A. Rolling contact fatigue, wear and broken rail derailments. Wear 2016, 366–367, 249–257. [Google Scholar] [CrossRef] [Green Version]
  6. Shur, E.; Borts, A.; Zakharov, S. Rails for Low Operating Temperature and High Speed. Transp. Soil Eng. Cold Reg. 2020, 1, 221–232. [Google Scholar]
  7. Chen, W.; Graf, H.F.; Huang, R. The Interannual Variability of East Asian Winter Monsoon and Its Relation to the Summer Monsoon. Adv. Atmos. Sci. 2000, 17, 48–60. [Google Scholar]
  8. Ding, Y.H. Monsoons over China; Springer Science & Business Media: Berlin/Heidelberg, Germany, 1994; p. 432. [Google Scholar]
  9. Thompson, D.W.J.; Wallace, J.M. The Arctic Oscillation signature in the wintertime geopotential height and temperature fields. Geophys. Res. Lett. 1998, 25, 1297–1300. [Google Scholar] [CrossRef] [Green Version]
  10. Thompson, D.W.J.; Wallace, J.M. Annular modes in the extratropical circulation. Part I: Month-to-month variability. J. Clim. 2000, 13, 1000–1016. [Google Scholar] [CrossRef]
  11. He, C.; He, J. Relation between Arctic Oscillation and North China Air Temperature in Winter. J. Nanjing Inst. Meteorol. 2003, 26, 1–7. (In Chinese) [Google Scholar]
  12. Wallace, J.M.; Gutzler, D.S. Teleconnections in the geopotential height field during the Northern Hemisphere winter. Mon. Weather Rev. 1981, 109, 784–812. [Google Scholar] [CrossRef]
  13. Wang, N.; Zhang, Y. Evolution of Eurasian teleconnection pattern and its relationship to climate anomalies in China. Clim. Dyn. 2015, 44, 1017–1028. [Google Scholar] [CrossRef] [Green Version]
  14. Luo, B.H.; Luo, D.H.; Dai, A.G.; Simmonds, I.; Wu, L. A connection of winter Eurasian cold anomaly to the modulation of Ural blocking by ENSO. Geophys. Res. Lett. 2021, 48, e2021GL094304. [Google Scholar] [CrossRef]
  15. Yao, Y.; Zhang, W.; Luo, D.; Zhong, L.; Pei, L. Seasonal Cumulative Effect of Ural Blocking Episodes on the Frequent Cold events in China during the Early Winter of 2020/21. Adv. Atmos. Sci. 2022, 39, 609–624. [Google Scholar] [CrossRef]
  16. Branstator, G. Circumglobal Teleconnections, the Jet Stream Waveguide, and the North Atlantic Oscillation. J. Clim. 2002, 15, 1893–1910. [Google Scholar] [CrossRef]
  17. Huang, W.; Yang, Z.; He, X.; Lin, D.; Wang, B.; Wright, J.S.; Chen, R.; Ma, W.; Li, F. A possible mechanism for the occurrence of wintertime extreme precipitation events over South China. Clim. Dyn. 2019, 52, 2367–2384. [Google Scholar] [CrossRef]
  18. Cohen, J.; Saito, K.; Entekhabi, D. The role of the Siberian high in Northern Hemisphere climate variability. Geophys. Res. Lett. 2001, 28, 299–302. [Google Scholar] [CrossRef] [Green Version]
  19. Gong, D.; Ho, C.H. The Siberian High and climate change over middle to high latitude Asia. Theor. Appl. Climatol. 2002, 72, 1–9. [Google Scholar] [CrossRef]
  20. Lu, C.; Zhang, Y.; Guan, Z. Winter anticyclone activities in Siberia and their relationship to the regional temperature anomaly. Int. J. Climatol. 2022, 42, 6429–6440. [Google Scholar] [CrossRef]
  21. Hersbach, H.; Bell, B.; Berrisford, P.; Hirahara, S.; Horány, A.; Muñoz-Sabater, J.; Nicolas, J.; Peubey, C.; Radu, R.; Scheper, D.; et al. The ERA5 global reanalysis. Q. J. R. Meteorol. Soc. 2020, 146, 1999–2049. [Google Scholar] [CrossRef]
  22. Wu, J.; Gao, X. A gridded daily observation dataset over China region and comparison with the other datasets. Chin. J. Geophys. 2013, 56, 1102–1111. (In Chinese) [Google Scholar]
  23. Huo, L.; Wang, J.; Jin, D.; Luo, J.; Shen, H.; Zhang, X.; Min, J.; Xiao, Y. Increased summer electric power demand in Beijing driven by preceding spring tropical North Atlantic warming. Atmos. Ocean. Sci. Lett. 2022, 15, 100146. [Google Scholar] [CrossRef]
  24. Hasanean, H.M.; Almazroui, M.; Jones, P.D.; Alamoudi, A.A. Siberian high variability and its teleconnections with tropical circulations and surface air temperature over Saudi Arabia. Clim. Dyn. 2013, 41, 2003–2018. [Google Scholar] [CrossRef]
  25. Hoskins, B.J.; Karoly, D.J. The steady linear response of a spherical atmosphere to thermal and orographic forcing. J. Atmos. Sci. 1981, 38, 1179–1196. [Google Scholar] [CrossRef]
  26. Takaya, K.; Nakamura, H. Mechanisms of intraseasonal amplification of the cold Siberian high. J. Atmos. Sci. 2005, 62, 4423–4440. [Google Scholar] [CrossRef]
  27. Maeda, S.; Takemura, K.; Kobayashi, C. Planetary Wave Modulations Associated with the Eurasian Teleconnection Pattern. J. Meteorol. Soc. Jpn. Ser. II 2021, 99, 449–458. [Google Scholar] [CrossRef]
  28. O’Neill, B.C.; Tebaldi1, C.; Van Vuuren, D.P.; Eyring, V.; Friedlingstein, P.; Hurtt, G.; Knutti, R.; Kriegler, E.; Lamarque, J.F.; Lowe, J.; et al. The Scenario Model Intercomparison Project (ScenarioMIP) for CMIP6. Geosci. Model Dev. 2016, 9, 3461–3482. [Google Scholar] [CrossRef] [Green Version]
  29. Reddy, V. Modelling and Analysis of Rail Grinding & Lubrication Strategies for Controlling Rolling Contact Fatigue (RCF) and Rail Wear. Ph.D. Thesis, Queensland University of Technology, Brisbane City, QLD, Australia, 2004; p. 43. [Google Scholar]
  30. Ciotlaus, M.; Kollo, G.; Marusceac, V.; Orban, Z. Rail-wheel interaction and its influence on rail and wheels wear. Procedia Manuf. 2019, 32, 895–900. [Google Scholar] [CrossRef]
  31. Gao, Y.; Wang, P.; Wang, K.; Xu, J.; Dong, Z. Damage tolerance of fractured rails on continuous welded rail track for high-speed railways. Rail. Eng. Sci. 2021, 29, 59–73. [Google Scholar] [CrossRef]
Figure 1. (a) Spatial distribution of annual total frequency of rail breakage (FRB) and (b) time series of monthly FRB of high-speed railway in Beijing–Tianjin–Hebei (BTH) region during 2010–2020.
Atmosphere 14 00561 g001
Figure 2. (a) Spatial distribution of the winter FRB, and (b) percentage of the FRB in winter against the FRB of whole year in BTH region during 2010–2020. (c) The doughnut chart of winter FRB in BTH region of each year. The integer on doughnut chart represents the FRB of each winter, and the percentage around doughnut chart represents the percentage of the winter FRB against the annual total FRB in each year.
Atmosphere 14 00561 g002
Figure 3. (a) Spatial distribution of correlation coefficients between FRB in BTH region and surface pressure in winter, where the rectangular box is the area selected to define Siberian high index (ISH). (b) Correlation coefficient between ISH and 2 m temperature field. The solid magenta line denotes the zero line. The shaded area/dot shading is the area that passes the 90/95% significance test. Green curve indicates the BTH region.
Atmosphere 14 00561 g003
Figure 4. Regressions of ISH with the (a) 850 hPa, (b) 500 hPa and (c) 200 hPa geopotential height onto (shading, units: dgpm) and wind field (arrows, units: ms−1). Regression coefficients exceeding the 95% confidence level are stippled. Only the vectors at the 95% confidence level or higher are shown. Green curve indicates the BTH region.
Atmosphere 14 00561 g004
Figure 5. Regressed the vertically integrated temperature advection from the surface to 100 hPa by ISH. Regression coefficients exceeding the 95% confidence level are stippled. Green curve indicates the BTH region.
Atmosphere 14 00561 g005
Disclaimer/Publisher’s Note: The statements, opinions and data contained in all publications are solely those of the individual author(s) and contributor(s) and not of MDPI and/or the editor(s). MDPI and/or the editor(s) disclaim responsibility for any injury to people or property resulting from any ideas, methods, instructions or products referred to in the content.

